Báo cáo y học: "Genome-wide prioritization of disease genes and identification of disease-disease associations from an integrated human functional linkage network" pps
Bạn đang xem bản rút gọn của tài liệu. Xem và tải ngay bản đầy đủ của tài liệu tại đây (675.55 KB, 17 trang )
Genome Biology 2009, 10:R91
Open Access
2009Linghuet al.Volume 10, Issue 9, Article R91
Method
Genome-wide prioritization of disease genes and identification of
disease-disease associations from an integrated human functional
linkage network
Bolan Linghu
*
, Evan S Snitkin
*
, Zhenjun Hu
*
, Yu Xia
*†
and Charles DeLisi
*
Addresses:
*
Bioinformatics Program, Boston University, 24 Cummington Street, Boston, MA 02215, USA.
†
Department of Chemistry, Boston
University, 590 Commonwealth Avenue, Boston, MA 02215, USA.
Correspondence: Charles DeLisi. Email:
© 2009 Linghu et al.; licensee BioMed Central Ltd.
This is an open access article distributed under the terms of the Creative Commons Attribution License ( which
permits unrestricted use, distribution, and reproduction in any medium, provided the original work is properly cited.
Functional-linkage network <p>An evidence-weighted functional-linkage network of human genes reveals associations among diseases that share no known disease genes and have dissimilar phenotypes </p>
Abstract
We integrate 16 genomic features to construct an evidence-weighted functional-linkage network
comprising 21,657 human genes. The functional-linkage network is used to prioritize candidate
genes for 110 diseases, and to reliably disclose hidden associations between disease pairs having
dissimilar phenotypes, such as hypercholesterolemia and Alzheimer's disease. Many of these
disease-disease associations are supported by epidemiology, but with no previous genetic basis.
Such associations can drive novel hypotheses on molecular mechanisms of diseases and therapies.
Background
Recently, a number of computational approaches have been
developed to predict or prioritize candidate disease genes [1-
34]. Most approaches are based on the idea that genes associ-
ated with the same or related disease phenotypes tend to par-
ticipate in common functional modules (such as protein
complexes, metabolic pathways, developmental or organo-
genesis processes, and so on) [1-16]. This concept is sup-
ported by functional analysis of genes associated with diverse
diseases [1-4], and by the success of various disease gene pri-
oritization studies based on the concept [5-7,9-
17,19,20,23,24,29].
Network-based approaches have also been employed to infer
new candidate disease genes based upon network linkages
with known disease genes [15,17-23]. These methods typically
first construct a gene-gene association network based on one
or more types of genomic and proteomic data, and subse-
quently rank candidate genes based on network proximity to
known disease associated genes. Although some of these
methods perform well using just one specific type of evidence
for functional association, such as protein-protein physical-
interaction data or co-expression data, the restriction to only
one type of functional association potentially limits their pre-
dictive ability [17,20-23]. To address this issue, Franke et al.
[15] constructed a functional linkage network (FLN) by inte-
grating multiple types of data, and utilized the FLN for dis-
ease gene prioritization. However, their results indicate that
the performance was highly dependent on Gene Ontology
(GO) annotations, in addition to functional associations from
curated databases such as the Kyoto Encyclopaedia of Genes
and Genomes (KEGG) and Reactome [15,35,36]. As a result,
the predictions tend to be biased towards well-characterized
genes, and thus limit potential inferences. In a second study,
Kohler et al. [19] constructed an FLN from heterogeneous
data sources, and used a random walk algorithm for disease
gene prioritization. However, their network did not incorpo-
rate linkage weight to differentiate confidences in functional
associations among genes. Therefore, the FLN-based disease
gene prioritization still needs to be further explored.
Published: 3 September 2009
Genome Biology 2009, 10:R91 (doi:10.1186/gb-2009-10-9-r91)
Received: 2 May 2009
Revised: 9 July 2009
Accepted: 3 September 2009
The electronic version of this article is the complete one and can be
found online at /> Genome Biology 2009, Volume 10, Issue 9, Article R91 Linghu et al. R91.2
Genome Biology 2009, 10:R91
In addition to identifying genes associated with different dis-
eases, other work has explored relationships among human
diseases [1-4,37]. Recent studies indicate that human dis-
eases tend to form an interrelated landscape, whereby differ-
ent diseases are linked together based on perturbing the same
biological processes [1-4]. Perhaps unsurprising is the finding
that diseases with similar phenotypes tend to be caused by
dysfunctions of the same genes [1-4]. Less anticipated was the
finding that diseases with dissimilar phenotypes can also be
related at the molecular level [1,2]. To study disease-disease
relationships, some previous methods used the similarity of
phenotype descriptions or examined the hospital diagnosis
records to quantify the disease-disease associations [3,37].
However, because these approaches characterize disease-dis-
ease associations entirely at the phenotypic level, they have
the potential limitation of missing those disease-disease asso-
ciations that can be easily detected at the molecular level but
not at the phenotypic level.
Recently, Goh et al. [4] proposed a method to identify dis-
ease-disease associations at the molecular level based on
shared disease genes, which therefore may capture associa-
tions missed by the phenotype-based approaches. However,
the breadth of this method is limited by the relative paucity of
knowledge of disease causing genes. A potential solution to
this problem is the use of functional linkages to identify asso-
ciations between genes involved in different diseases. This
can result in the identification of relationships between dis-
eases that while they may not be associated with the same
genes, are associated with functionally related sets of genes.
Here, we construct an integrated FLN in human for two pur-
poses: to prioritize new (not previously recognized) genes
that are potentially associated with a given disease; and to
explore the inter-relationships between diverse diseases
revealed by considering functional associations between
genes associated with different diseases (Figure 1). We use a
naïve Bayes classifier [38,39] to integrate 16 functional
genomics features assembled from 32 sub-features. The
result of this integration is a genome-scale FLN (composed of
21,657 genes and 22,388,609 links), in which nodes represent
genes, and edge weights the likelihood that the linked nodes
participate in a common biological process. Our integrated
FLN has a higher coverage and increased accuracy compared
to networks based on individual data sources.
Next, we use this FLN to predict new candidate disease genes
for 110 diverse diseases from the Online Mendelian Inherit-
ance in Man Database (OMIM) database [40]. For each dis-
ease, we quantify the degree of association between each gene
and the disease by considering how tightly the candidate gene
is connected to known disease genes in the FLN. This then
allows us to rank the probabilities of all genes being involved
in a particular disease, based upon their degree of functional
relatedness to genes known to be associated with a given dis-
ease.
Finally, using the FLN, we identify disease-disease associa-
tions based on functional correlations between disease-
related genes. Specifically, our approach considers not only
whether diseases share associated genes, but also whether
gene sets from different diseases are tightly linked in the FLN.
We show that the FLN can be used to identify associations
between phenotypically diverse diseases, and to reveal associ-
ations even in the absence of common known disease genes or
common pathological symptoms. With knowledge of such
disease-disease associations, prior knowledge gained from
one disease can shed light on the underlying molecular mech-
anisms and relevant therapies of related diseases.
Results
A genome-scale human functional linkage network
built through data integration
Our goals are to exploit the functional coherence of genes
involved in a given disease to identify genes that underlie
diverse disorders, and to find previously unknown links
between phenotypically dissimilar human diseases. We pur-
sue these goals by first integrating genomic features from dis-
parate data sources to establish quantitative functional links
among human genes. Since each data source usually charac-
terizes only one type of functional association between genes,
and covers a relatively limited set of genes, functional associ-
ations from various sources need to be combined to attain
maximal coverage and accuracy. We systematically assemble
a set of 16 genomic features, which incorporates 32 sub-fea-
tures. These genomic features include diverse functional
genomics data in human, as well as functional associations
mapped through orthology from five model organisms (yeast,
worm, fly, mouse, and rat; Table 1).
We then use a naïve Bayes classifier to compute functional
links between human genes by integrating these genomic fea-
tures. Each functional link is weighted by a log likelihood
ratio (LR) score, which reflects the probability of the linked
gene pair sharing the same biological process after summing
over evidence from all available data sources (see Materials
and methods). Such extensive data integration outperforms
individual data sources in terms of inferring functional link-
ages (Figure 2), demonstrating the importance of data inte-
gration.
After data integration, we choose a permissive linkage weight
cutoff (LR score is higher than 1; Equation 1 in the Materials
and methods) such that two genes are linked if the overall evi-
dence supports the functional linkage. This threshold is very
intuitive, as it retains edges with more evidence for functional
association than against it, and removes edges with more evi-
dence against functional association than for it. In addition,
the same cutoff has also been successfully used by Lee et al.
[41] to predict perturbation phenotypes of genes based on an
integrated FLN in worm. The resulting genome-scale FLN
network consists of 21,657 genes (covering approximately
Genome Biology 2009, Volume 10, Issue 9, Article R91 Linghu et al. R91.3
Genome Biology 2009, 10:R91
85% of RefSeq annotated human genes [42]) and 22,388,609
weighted links (Additional data file 1). Despite its high cover-
age, our network retains its accuracy because each link is
weighted and the linkage weight is proportional to the linkage
precision (Figure 2). The average number of linked neigh-
bours per gene is around 2,000. Such high linkage density
together with linkage weighting allows a quantification of
functional associations between thousands of genes. Such
high coverage is critical to the successful utilization of the
FLN for both disease gene prioritization and mapping the dis-
ease-disease associations at the molecular level.
Identifying candidate disease-associated genes
Given a network of functionally linked genes, our first goal is
to use the information in this network to identify genes most
likely to be associated with a particular disease. The motiva-
tion for using the FLN to identify potentially disease-related-
genes is the hypothesis that genes whose dysfunction contrib-
utes to a disease phenotype tend to be functionally related [1-
16]. Our approach exploits this concept by using genes known
to be associated with a particular disease as network 'seeds',
and identifying those genes whose connectivity with the seeds
indicates a strong functional relation. In particular, for a
given disease, each gene in the network is prioritized accord-
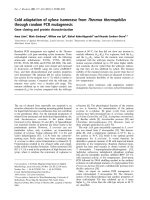
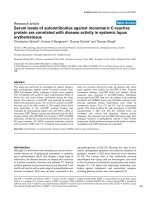
Construction of an integrated functional linkage network (FLN) with applications in prioritizing candidate disease genes and quantifying the disease-disease associationsFigure 1
Construction of an integrated functional linkage network (FLN) with applications in prioritizing candidate disease genes and quantifying the disease-disease
associations. Functional associations between genes are retrieved from diverse data sources (Table 1). These functional associations are then integrated
into one single FLN using a naïve Bayes classifier, in which the nodes represent individual genes and the weighted edges represent the degree of their
overall functional association upon combining all contributing data sources. Green arrows represent the two steps of using of the FLN for candidate
disease gene prioritization: step 1, given a particular disease (Disease I), label genes known to be associated with this disease as seeds (pink colored nodes);
step 2, prioritize all other genes in terms of their association with the disease based on the sum of the weights of their network links to the seed genes.
The purple arrows represent the two steps of using the FLN to quantify the disease-disease associations: step 1, label genes known to be associated with
different diseases with different colors (gene K is labeled with two colors since it is associated with two diseases); step 2, quantify the associations between
any two diseases based on the degree of association between the two corresponding disease gene sets within the FLN.
Co-expression
Protein
protein
interaction
Co-occurrence
in PubMed
abs trac ts
. . . . . .
Functional
associations
mapped from
yeas t
Protein
domain
sharing
Abstract
…… ………
………
K
…
….
I
… …
Abstract
…… ………
………
K
…
….
I
… …
F
G
A
D
Naïve bayes integration
P
F
B
E
A
H
J
K
ILMOQ
Rank Score
3.54
2.71
2.42
1.26
0.5
0.32
0.13
0
1
2
3
4
5
6
7
8
N
Functional linkage
network
H
Q
F
D
B
A
G
M
E
O
I
C
N
L
J
P
K
H
Q
F
D
B
A
G
M
E
O
I
C
N
L
J
P
K
H
Q
F
D
B
A
G
M
E
O
I
C
N
L
J
P
K
H
Q
F
D
B
A
G
M
E
O
I
C
N
L
J
P
K
Disease I
Disease I
Disease II
Diseas e III
0.24
0.91
0.16
Disease II
Disease I Diseas e III
0.24
0.91
Disease II
Disease I Diseas e III
Genome Biology 2009, Volume 10, Issue 9, Article R91 Linghu et al. R91.4
Genome Biology 2009, 10:R91
ing to the sum of the weights of its network links to the known
disease (seed) genes (Equation 4; see Materials and methods)
[41,43]. This prioritization rule is referred to as neighbour-
hood weighting.
Validation of identified candidate disease-associated
genes
To test this approach, we first extract from the OMIM data-
base [40] 1,025 known disease genes, and assemble them into
110 seed gene sets, representing 110 disorders covering a wide
spectrum of human disease phenotypes (Additional data file
2). Each seed set contains at least 5 genes, and the average
seed count is 11 (with some seed genes associated with more
than one disease). Next we use the FLN to identify new candi-
date disease genes for each of the 110 diseases, based on the
neighbourhood weighting rule [41,43,44]. As a result, on
average, nearly half of the genome is prioritized for each dis-
ease. In Additional data file 3, we list the top 100 ranked new
candidate disease genes for each disease. To help investiga-
tors estimate the prediction precision at a particular rank cut-
off, for each disease we provide a plot of precision estimate
versus different rank cutoffs (see Materials and methods;
Additional data file 4). We assess the performance of our
FLN-based disease gene prediction method using leave-one-
out cross validation, with so-called disease-centric [41,43]
and gene-centric approaches [19,23] (see Materials and
methods).
Disease centric assessment
The disease-centric evaluation approach first ranks each gene
based on the neighborhood weighting rule for a particular
disease, and then for each disease computes the area under
the receiver operating characteristic (ROC) curve (AUC),
which is obtained by varying the rank cutoff (see Materials
and methods) [43]. The AUC is an indication of how highly in
the ranked list the known disease genes are, where the AUC
will be 1 if all disease genes are at the top of the list and 0.5 if
the disease genes are randomly distributed in the list. Exam-
ples of ROC curves for seven diseases are provided in Figure
3. Additionally, we also provide the same plot using just the
extreme left side of the ROC curve, which represents the top
ranking predictions (Figure S2 of Additional data file 5).
Disease-centric evaluation shows that FLN-based disease
gene prioritization has an extremely high median AUC of
0.98 for the 110 diseases tested, indicating a high predictive
Table 1
Data sources for FLN construction
Data sources Description Number of unique gene pairs Number of unique genes
Curated PPI Curated human PPI from HPRD, BIND, BIOGRID, INTACT,
MIPS, DIPS, and MINT [45-51]
90,352 10,281
Y2H PPI from high-throughput yeast two-hybrid experiments [52] 2,611 1,522
Masspec PPI from large-scale mass spectrometry experiments [53] 2,046 1,159
DDI Protein pairs containing interacting protein domains [38,39] 6,933,469 13,454
Co-exp Expression correlation from multiple large-scale expression
datasets [56,88-90]
5,110,798 16,287
DS Proteins pairs sharing same protein domains [91] 2,064,262 17,328
PG Gene pairs having correlated phylogenetic profiles [56] 18,086 2,607
GN Gene pairs located close to each other along the chromosome
[56]
10,070 1,365
Fusion Protein pairs fused into one single protein in other species [56] 361 361
Yeast Functional associations mapped from seven types of functional
genomics data in yeast through gene orthology [92]
123,380 3,809
Worm Functional associations mapped from four types of functional
genomics data in worm through gene orthology [41]
96,911 5,737
Fly Functional associations mapped from three types of functional
genomics data in fly through gene orthology [56]
139,984 5,966
Mouse-rat Functional associations mapped from three types of functional
genomics data in mouse and rat through gene orthology [56]
254,477 11,789
TexM Co-occurrence in PubMed abstracts [56] 518,716 12,286
MF Gene pairs sharing same molecular function terms in GO [93] 6,937,725 7,863
CC Gene pairs sharing same cellular component terms in GO [93] 5,591,796 12,503
See Additional data file 5 for detailed descriptions of data sources for FLN construction. CC, cellular component; Co-exp, co-expressed; DDI,
domain-domain interaction; DS, protein domain sharing; GN, gene neighbor; HPRD, Human Protein Reference Database; Masspec, mass
spectrometry; MF, molecular function; MIPS, Munich Information Center for Protein Sequences; PG, phylogenetic profiles; PPI, protein-protein
interaction; TexM, text mining; Y2H, yeast two hybrid experiments.
Genome Biology 2009, Volume 10, Issue 9, Article R91 Linghu et al. R91.5
Genome Biology 2009, 10:R91
capacity across a large number of diseases (Figure 4a). In
light of this very high performance, we next consider an issue
that may potentially inflate our performance. Specifically,
one of the data sources used to construct our FLN is text min-
ing of PubMed abstracts. The potential issue with this text
mining feature is the possibility that some of the gene-disease
associations in the OMIM database, which we use to evaluate
our method, could be originally derived from the same litera-
ture references that text mining is based on [19,24]. To assess
the impact of this potential bias, we create a FLN excluding
text mining, and find that the resulting AUCs have a median
value of 0.85, lower than full FLN, but still far superior to the
random expectation of 0.5. In particular, when we exclude
text mining data from the FLN, 80%, 65%, and 39% of the dis-
eases still have an AUC of over 0.75, 0.8, and 0.9, respec-
tively. Additionally, we have also performed the disease
centric analysis using only the area of the extreme left side of
the ROC curve, which represents the top ranking predictions
(see Additional data file 5 for the ROC-50 analysis). The
results are consistent with those using the whole ROC curve
(Figure S3 of Additional data file 5). Therefore, our FLN is
capable of predicting candidate genes for diverse diseases,
even in the absence of text mining data.
Gene-centric assessment
This evaluation treats each known gene-disease association
as a test case, and assesses how well each known disease gene
ranks relative to a background set of genes not known to be
associated with the particular disease (see Materials and
methods). Then, all test cases are pooled together, and the
overall performance is evaluated by calculating the fraction of
tested disease genes that are ranked above various rank cut-
offs. We use two background sets to define the background
pool of candidate genes from which we pick out disease-asso-
ciated genes. One set is a collection of 100 nearest genes
flanking the test disease gene physically on the chromosome.
This background is referred to as the artificial chromosome
region background, and is intended to mimic the common
scenario in which a chromosomal region is known to be asso-
ciated with a disease through genetic association studies, but
the specific disease-causing genes are unknown. The other
background set contains all genes in the network and is
intended to mimic the common scenario where the set of
potential candidate genes cannot be narrowed down. This set
is referred to as the genome background.
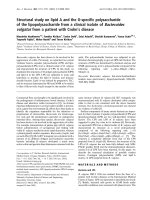
Data integration outperforms individual data sources in terms of quantifying functional links between human genesFigure 2
Data integration outperforms individual data sources in terms of
quantifying functional links between human genes. The x-axis represents
linkage sensitivity, defined as the fraction of the gold standard positive
(GSP) gene pairs that are linked at different linkage weight cutoffs (see
Materials and methods). The y-axis represents linkage precision, defined as
the fraction of the linked gold standard gene pairs that belong to the GSP
set (see Materials and methods). GSPs are defined as gene pairs sharing
the same biological process term in Gene Ontology (GO). Gold-standard
negatives (GSNs) are defined as gene pairs annotated with GO biological
process terms that do not share any term. To generate the random
control curve, we randomize the class labels in the gold standard datasets
and then perform the same evaluation. In Figure S1 of Additional data file
5, we provide the same plot with the x-axis in log scale to show details for
individual data sources. CC, cellular component; Co-exp, co-expressed;
DDI, domain-domain interaction; DS, protein domain sharing; GN, gene
neighbor; Masspect, mass spectrometry; MF, molecular function; PG,
phylogenetic profiles; PPI, protein-protein interaction; TexM, text mining;
Y2H, yeast two hybrid experiments. The descriptions of the 16 individual
data sources are listed in Table 1.
High
FLN linkage weight cutoff
Link age sensitivity
0 0.1 0.2 0.3 0.4 0.5
0.2
0.3
0.4
0.5
0.6
0.7
0.8
0.9
1
Linkage precision
Curated PPI
Y2H
Masspect
DDI
Co-exp
DS
PG
GN
Fusion
Yeast
Worm
Fly
Mous e-rat
TexM
MF
CC
Integration
Random
Low
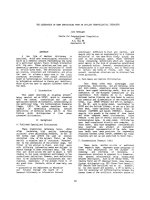
Predictability of seven example diseases evaluated by ROC curves in disease-centric assessmentFigure 3
Predictability of seven example diseases evaluated by ROC curves in
disease-centric assessment. Prediction performance for individual diseases
is measured by the true positive rate (sensitivity) versus false positive rate
(1 - specificity). In particular, for each given disease, each gene in the
network is ranked based on the disease association score (S
i
; Equation 4).
The S
i
for each known disease (seed) gene is computed using leave-one-
out cross-validation, based on its connectivity to other seeds. Next the
performance for each disease is assessed by calculating the sensitivity
(True positives/(True positives + False negatives)) and 1 - specificity (False
positives/(True negatives + False positives)) at different S
i
cutoffs. Here
True positives is the number of seed genes above the S
i
cutoff, False
positives is the number of non-seed genes above the cutoff, True negatives
is the number of non-seed genes below the cutoff, and False negatives is
the number of seed genes below the cutoff. Random prediction
performance is indicated by the diagonal.
0 0.2 0.4 0.6 0.8 1
0
0.2
0.4
0.6
0.8
1
1 - specificity
S ensitivity
Deafness
Leukemia
B lood group
Colon cancer
Diabetes mellitus
Cardiomyopathy
R etinitis pigmentosa
Random
Genome Biology 2009, Volume 10, Issue 9, Article R91 Linghu et al. R91.6
Genome Biology 2009, 10:R91
With the artificial chromosome region background, 85%
(with text mining) or 62% (without text mining) of disease
genes are ranked in the top 10 out of 100 (Figure 4b). Moreo-
ver, we calculate the fold enrichment score, defined as the
average rank of a gene before prioritization divided by the
rank after prioritization (see Materials and methods). The
average fold enrichments are 35.5 (with text mining) or 20.5
(without text mining). Finally, we also carry out gene-centric
evaluation using the genome background, and the results are
similar (Figure 4c).
Monogeneic versus polygeneic disorders
Next, we investigate the difference in prioritization perform-
ance between monogenic diseases and complex diseases. It is
potentially important to distinguish these two classes of dis-
eases, as complex diseases tend to be caused by dysfunctions
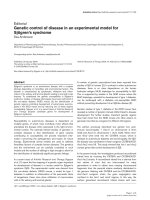
FLN-based disease gene prioritization significantly outperforms random controlFigure 4
FLN-based disease gene prioritization significantly outperforms random control. Performances are compared between FLN (inclusion or exclusion of text
mining data) based disease-gene prioritization and the random control. The random control is generated using the FLN to prioritize randomly assembled
disease gene sets (see Materials and methods). (a) Box plots of AUCs of disease gene prioritization performances for 110 diseases, based on disease-
centric assessment (see Materials and methods). For each box plot, the bottom, middle, and top lines of the box represent the first quartile, the median,
and the third quartile, respectively; whiskers represent 1.5 times the inter-quartile range; red plus signs represent outliers. (b) Disease gene prioritization
performance based on gene-centric assessment using the artificial chromosome region background (see Materials and methods). Gene-centric assessment
treats each known gene-disease association as a test case. For each test case, the task is to assess how well the known disease (seed) gene ranks relative
to a background gene set according to the disease-association score (S
i
; Equation 4). The S
i
for each gene in each test case is calculated in leave-one-out
setting based on the connectivity to the remaining seed genes. The background gene set used is referred to as the artificial chromosomal region, which is
composed of a collection of 100 nearest genes flanking the tested disease gene physically on the chromosome. Finally, after the rank of each tested disease
gene for each test case is determined, all the test cases are pooled together and the overall performance is assessed by evaluating the fraction of the tested
disease genes ranked above various rank cutoffs. (c) Same evaluation as (b) using the background gene set composed of all the genes represented in the
FLN, as opposed to just those proximate on the chromosome.
(b)
(a)
(c)
F LN F LN (no text mining) R andom control
0.2
0.3
0.4
0.5
0.6
0.7
0.8
0.9
1
0 20 40 60 80 100
0
0.2
0.4
0.6
0.8
1
Rank cutoff
FLN
FLN without text mining
R andom control
0 0.2 0.4 0.6 0.8 1
0
0.2
0.4
0.6
0.8
1
Percentage rank cutoff
FLN
FLN without text mining
R andom control
Fraction of disease genes
Fraction of disease genes
AUC of 110 diseases
Genome Biology 2009, Volume 10, Issue 9, Article R91 Linghu et al. R91.7
Genome Biology 2009, 10:R91
in multiple biological processes, and this lack of functional
coherence may reduce the utility of the FLN in predicting
novel disease genes. Kohler et al. [19] published a gene-dis-
ease association benchmark dataset that explicitly separates
monogenic diseases (83 diseases), polygenic diseases (12 dis-
eases) and cancers (12 diseases). We adopt their categoriza-
tion so that we can evaluate the three disease groups
separately. In particular, using the gene-centric evaluation
(see Materials and methods), we evaluate how well each
known disease gene is ranked relative to a background gene
set in a leave-one-out cross-validation (see Materials and
methods). The background gene set is composed of the 100
nearest genes flanking the test disease gene physically on the
chromosome. As expected, the results are best for monoge-
neic diseases (Figure S4 in Additional data file 5). The lower
performance for complex diseases and cancers is not surpris-
ing, since disease gene prediction methods are based on the
assumption of functional coherence among genes contribut-
ing to the same disease, while as mentioned above, complex
diseases tend to perturb multiple biological processes, mak-
ing the contributing genes less functionally coherent. Despite
the lower performance for complex disorders, the results are
still far better than random control; for example, 65% of
tested disease genes ranked in the top 20 among the back-
ground gene set composed of 100 genes.
The importance of data integration for gene
prioritization
Disease genes have previously been prioritized using net-
work-based strategies that used only protein-protein interac-
tions (PPI) [20,21,23]. Here we have integrated multiple data
sources with the expectation that such integration will
improve performance. To assess whether this is in fact the
case, we compare disease-prioritization performances
between our FLN and a PPI network that combines human
PPI links from seven major curated PPI databases [45-51],
along with high-throughput PPI data from yeast two-hybrid
and mass spectrometry [52-54], and interactions mapped
from PPI of other model organisms [55]. To avoid bias, inter-
actions from different sources in the PPI network are
weighted using the same procedure as FLN construction
(Equation S1 in Additional data file 5). In the end, a total of
105,361 interactions among 11,886 genes are included in the
PPI network.
As expected, data integration does improve performance
(Figure 5). Using the gene-centric evaluation with the artifi-
cial chromosome region background, 62% of disease genes
rank in the top 10 among 100 using the integrated FLN
(excluding text miming), in contrast to 40% in the PPI net-
work. Similar results were also found using the disease-cen-
tric assessment (Figure S5a in Additional data file 5; see
Materials and methods for the description of disease-centric
assessment). Further support for using an FLN-based
approach is the increased gene coverage. In the PPI network
only 40% of disease genes are connected to seed genes, and
thus only 40% can be prioritized. In contrast, in the inte-
grated network more than 92% of disease genes are linked to
seeds and can, therefore, be prioritized. Finally, the benefit of
data integration is also evident when we evaluate the prioriti-
zation performance of the FLN at different linkage weight
cutoffs. After the application of the permissive linkage weight
cutoff (LR > 1; Equation 1), we explore other higher cutoffs
but find no improvement in the prioritization performance
(Figure S5b, c in Additional data file 5). This further demon-
strates that functional links are assigned proper weights after
data integration, and that the neighbourhood weighting deci-
sion rule (Equation 4) allows links with lower weights to con-
tribute to performance.
Evaluation of new predictions using recently identified
disease genes
The performance evaluations described above are based on
leave-one-out cross-validation. Here we evaluate the predic-
tive performance for unknown disease genes by simulating
the search for new disease genes. We first manually check the
date of the landmark reference for each gene-disease associa-
tion recorded in the OMIM database. Next, disease genes with
references published after January 2007 are set aside for test-
ing, while all other disease genes with reference dates before
2007 are used for seed genes. For the purpose of this evalua-
tion we included text mining from the STRING database,
which was curated before January 2007 [56].
FLN-based disease gene prioritization shows improvement over PPI networkFigure 5
FLN-based disease gene prioritization shows improvement over PPI
network. Gene-centric assessment (as described in the legend of Figure
4b) is used to compare the disease-gene prioritization performances
between the integrated FLN and a representative PPI network. The PPI
network is composed of curated PPI databases [45-51], along with high-
throughput PPI data from yeast two-hybrid and mass spectrometry [52-
54], and interactions mapped from PPI of other model organisms. The
artificial chromosomal region composed of a collection of 100 nearest
genes flanking each tested disease gene physically on the chromosome is
used as the background gene set. Here, we exclude text mining data from
the FLN.
0 20 40 60 80 100
0
0.2
0.4
0.6
0.8
1
Rank cutoff
Fraction of disease genes
FLN
PPI network
Genome Biology 2009, Volume 10, Issue 9, Article R91 Linghu et al. R91.8
Genome Biology 2009, 10:R91
Within the FLN, there are a total of 61 disease genes associ-
ated with 31 diseases that are published after January 2007.
These are used for evaluating the FLN-based predictions.
Among them, 45 disease genes associated with 24 diseases
are also present in the representative PPI network. These
genes are used for evaluating PPI-based predictions. These
recently identified disease genes and their landmark refer-
ences are listed in Additional data file 6.
Again, the FLN shows improvement over the PPI network
(Figure 6). For instance, using the gene-centric evaluation
with the artificial chromosome region background, 45% of
disease genes are ranked in the top 5 in the FLN, in contrast
to fewer than 25% in the PPI network. It is noteworthy that
there is a drop in performance for both PPI and FLN relative
to the cross-validation analysis presented above. In particu-
lar, the fold enrichment drops from 16 to 8.2 for PPI and from
35.5 to 16.5 for FLN. This indicates that cross-validation
tends to overestimate performance, and it is important to
consider this when interpreting cross-validation results.
Obesity: a case study
Obesity is a polygenic disorder involving genes from various
processes, such as nutrient catabolism and appetite control
[57]. Our FLN includes 24 obesity-associated genes in the
OMIM database, and 334 additional obesity-associated genes
collected from the literature by Hancock et al. [58]. We will
subsequently refer to this set of 334 genes as 'ObesHancock'
genes. There is no overlap between the 24 OMIM obesity
genes and the 334 ObesHancock genes. Here, we rank obes-
ity-related genes using the 24 OMIM genes as seeds, then
evaluate the utility of our ranking using the non-overlapping
set of ObesHancock genes. Since ObesHancock genes are col-
lected from the literature, we exclude the text mining data
source from FLN construction.
We find that the ObesHanecok set is overrepresented in the
top scoring FLN genes, with 22 of them occurring in the top
100 (P < 1.0 × 10
-13
; see Additional data file 5 for P-value cal-
culation). The list of the 22 ObesHancock genes and their
supporting evidence are provided in Additional data file 7.
Detailed analysis of the subset of the top 100 ranked obesity
genes that does not overlap with the ObesHancock set reveals
additional genes with potential roles in obesity. For instance,
NR1H3, ranked 24th, is predominantly expressed in adipose
tissue and plays an important role in cholesterol, lipid, and
carbohydrate metabolism [59-63]. Recently, Dahlman et al.
[64] also found that one NR1H3 single nucleotide polymor-
phism (SNP), rs2279238, is associated with the obesity phe-
notype. Similarly, NMUR2, ranked 35th, is exclusively
expressed in the central nervous system as a receptor for neu-
romedin U, a neuropeptide regulating feeding behavior and
body weight [65]. Additionally, Schmolz et al. [66] found that
a NMUR2 variant potentially related to obesity in a mouse
model.
FLN-based identification of disease-disease
associations at the molecular level
As described in the Introduction, human diseases tend to
form an interrelated landscape. We hypothesize that the basis
for these relationships stems from multiple diseases resulting
from dysfunctions in the same genes, and more broadly, mul-
tiple diseases resulting from dysfunction of the same or
related biological processes [1-4]. Associations between dis-
eases potentially stemming from common causal genes were
previously reported by Goh et al. [4]. Here we focus on quan-
tifying associations between diseases based on perturbation
in common biological processes by developing the concept of
'mutual predictability' (see Materials and methods). The
mutual predictability between two diseases measures the
extent to which genes known to be associated with either
member of a disease pair can be used to identify genes known
to be associated with the other member (see Materials and
methods). We hypothesize that disease pairs with high
mutual predictability will be closely related to each other, as a
high mutual predictability should be indicative of high con-
nectivity in the FLN between the two gene sets associated
with two diseases, and hence should quantify the functional
relatedness between diseases.
We validate our mutual-predictability-based disease-disease
associations at the molecular and gene network level, using
disease-disease associations based on the classification in
Goh et al. [4], where the diseases in OMIM were manually
partitioned into 22 classes based on physiological system-
FLN shows improvement over PPI network for predicting 'new' disease genesFigure 6
FLN shows improvement over PPI network for predicting 'new' disease
genes. Disease genes whose disease-association landmark references were
published before January 2007 are considered 'known' and are used as
seed genes, and disease genes that were published after January 2007 are
considered 'new' and are used as test genes. Performances are compared
among FLN, PPI network, and the random control of the FLN. Gene-
centric assessment is used to evaluate the performance using the artificial
chromosome region background composed of 100 genes, as described in
the legend of Figure 4b.
0 20 40 60 80 100
0
0.2
0.4
0.6
0.8
1
Rank cutoff
Fraction of disease genes
FLN
PPI network
R andom control
Genome Biology 2009, Volume 10, Issue 9, Article R91 Linghu et al. R91.9
Genome Biology 2009, 10:R91
level phenotypic observations. After calculating the mutual
predictability (Equation 7) between every possible disease
pair (all mutual predictability scores are provided in Addi-
tional data file 8), we threshold pair selection with increasing
score cutoffs. At each cutoff, we examine the fraction of dis-
ease pairs belonging to the same disease class (excluding
'unclassified class' and 'multiple class'; the former has insuf-
ficient information for disease class assignment, and the lat-
ter lacks physiological system specificity). As seen in Figure 7,
the fraction of pairs placed in the categories defined by Goh et
al. increases rapidly with increasing score cutoff. This dem-
onstrates that FLN-based mutual predictability can capture
disease-disease association in a quantitative way.
The FLN discloses hidden associations between
diseases sharing no known disease genes and having
dissimilar phenotypes
To visualize disease-disease association estimated by mutual
predictability, we create a network of disease associations, in
which the nodes represent individual diseases and the
weighted edges represent mutual predictability. Figure 8a
shows a high confidence subset of the disease network
obtained by selecting the top 100 pairs (out of 5,995, that is,
the top 1.7%; Figure S9 of Additional data file 5), correspond-
ing to a mutual predictability cutoff of approximately 0.85.
These 100 pairs cover a total of 66 diseases. At this cutoff, the
disease pairs are four times more likely to share the same dis-
ease class than expected at random (Figure 7). Moreover, 97
of the 100 disease pairs are supported by various types of evi-
dence, such as the classification scheme of Goh et al. (within
the same disease class) or other literature evidence (Addi-
tional data file 9). These results suggest that disease pairs
with high mutual predictability tend to be related.
We compare our method with another available disease-dis-
ease association identification method proposed by Goh et
al., which identifies the associations between two diseases by
counting their overlapping disease genes [4]. However, Goh
et al.'s method could only identify the associations between
diseases with known overlapping disease genes. In contrast,
our method is able to identify additional associations for
those diseases sharing no known disease genes but having
dense functional links between their corresponding disease
gene sets by taking advantage of the FLN.
Among the 97 potentially related disease pairs with literature
support, 48 pairs share known disease genes and are identi-
fied by both methods (pairs connected by blue links in Figure
8a). However, the remaining 49 pairs share no known disease
genes, and their associations are identified solely based upon
functional links among associated genes (pairs connected by
red links in Figure 8a). An example of a non-trivial disease-
disease linkage in the latter group is the association between
Alzheimer's disease, a neurological disorder, and hypercho-
lesterolemia, a metabolic disorder. Since the two diseases
share no disease genes in OMIM, their predicted association
is based entirely on the strong and dense functional links
between the corresponding disease gene sets (Figure 8b).
Importantly, associations between diseases identified using
the FLN provide immediate insight into the molecular mech-
anisms underlying different diseases, and thus generate novel
hypotheses for therapeutic strategies. For instance, based on
the association of hypercholesterolemia and Alzheimer's dis-
eases, we propose that high cholesterol may play an impor-
tant role in the development of Alzheimer's disease and that
modulation of cholesterol levels might help to reduce or delay
the risk of Alzheimer's disease, which is indeed supported by
recent literature [67-69]. Besides Alzheimer's disease and
hypercholesterolemia, there are diverse disease-disease asso-
ciations that are identified only by the FLN but not by the dis-
ease gene sharing method. These include night blindness/
Leber's congenital amaurosis, which are both ophthalmolog-
ical; pseudohypoaldosteronism/Bartter syndrome - both
involved in ion transport deficiency); and holoprosenceph-
aly/Waardenburg syndrome - both involved in developmen-
tal deficiencies (Additional data file 9). We provide a more
quantitative comparison between our mutual predictability
method and disease gene sharing method in Additional data
file 5.
Since our disease-disease association identified at the molec-
ular level correlates with disease-disease associations based
on phenotypic level classification (Figure 7), it is not surpris-
ing that some diseases in the same disease class are found to
be connected in our disease network. For example, prostate
cancer and ovarian cancer both belong to the cancer class,
and are connected in our network. Potentially of more inter-
est is the observation that among the 97 potentially associated
disease pairs identified by high mutual predictability and
supported by the literature, 54 disease pairs belong to differ-
Fraction of related disease pairs increases as mutual predictability cutoffs increaseFigure 7
Fraction of related disease pairs increases as mutual predictability cutoffs
increase. Disease pairs are considered to be related if they belong to the
same disease class based on Goh et al.'s manual classification [4].
0 0.1 0.2 0.3 0.4 0.5 0.6 0.7 0.8 0.9
0
0.1
0.2
0.3
0.4
0.5
0.6
0.7
0.8
0.9
F raction of related dis eas e pairs
Mutual predictability score cutoff
Genome Biology 2009, Volume 10, Issue 9, Article R91 Linghu et al. R91.10
Genome Biology 2009, 10:R91
Figure 8 (see legend on next page)
PC
OC
MC
LS
MD
CO
AZ
HC
LC
NB
CD
RP
(a)
(b)
APOE
SORL1
A2M
ACE
PSEN1
MPO
NOS 3
BLMH
PLAU
APBB2
PSEN2
PAXIP1
APP
PCSK9
EPHX2
APOA2
APOB
LDLR
LDLRAP1
ITIH4
GSBS
PH
BS
GC
CL
WS
HP
HD
CH
Muscular or cardiovascular
diseases
Immunological diseases
Deficiency in
lysosomalfunction
Opthalmological diseases
Deficiency in ion
transport
Deficiency in
developmental
process
Deficiency in insulin
production or response
Peroxisomal diseases
Cancers
Deficiency in mitochondria
Genome Biology 2009, Volume 10, Issue 9, Article R91 Linghu et al. R91.11
Genome Biology 2009, 10:R91
ent disease classes, as defined by Goh et al. [4]. This finding
suggests that diseases with different phenotypes can share
common etiology at the molecular level [1,2]. Examples of
such disease pairs include Alzheimer's disease (neurological
class) and hypercholesterolemia (metabolic class) described
above, central hypoventilation syndrome (respiratory class)
and Hirschsprung disease (gastrointestinal class), both of
which are potentially caused by a defective developmental
process [2], and ceroid-lipofuscinosis (neurological class)
and glaucoma (ophthamological class), both of which are
involved in abnormalities in lysosomal function [70,71]
(Additional data file 9). These results suggest that standard
disease classifications may be much less informative than
currently thought.
In addition to validating individual links, we visualize the
topology of our disease-disease association network based on
the network connectivity. We find that some network mod-
ules (such as those defined by rectangles in Figure 8a) can be
readily identified through visual inspection. Specifically, dis-
eases within a module tend to be more connected than dis-
eases between different network modules. These disease
modules tend to be enriched with homogeneous diseases
belonging to the same or related classes, or sharing similar
molecular mechanisms (Figure 8a, homogeneous modules
are colored correspondingly; cluster details are listed in Addi-
tional data file 10 and Figure S9 in Additional data file 5).
Examples are the ophthalmological disease clique of night
blindness/Leber's congenital amaurosis/retinitis pigmen-
tosa/cone or cone-rod dystrophy, and the mitochondrion
deficiency clique of mitochondrial complex I/II/III defi-
ciency/combined oxidative phosphorylation deficiency/
Leigh syndrome/mitochondrial DNA depletion syndrome.
These results confirm that the FLN-based mutual predictabil-
ity measure can be used to identify biologically meaningful
disease-disease associations.
Discussion
Comparison with other disease gene prioritization
methods
We have demonstrated that our FLN-based disease gene pri-
oritization approach successfully predicts new candidate dis-
ease genes for diverse diseases. The method compares
favorably to previous methods, providing 50% more coverage
than [19] with accuracy comparable to [19,24,72]. (Detailed
descriptions of the performance comparisons are provided in
Additional data file 5.)
A potential strategy for further improving on our predictive
performance is to consider not only functional linkages
between neighbors as was done here, but to also incorporate
global network topology into disease gene identification [19].
It should be noted, however, that the use of a global propaga-
tion scheme should be done with extra care. A global propa-
gation scheme may more comprehensively exploit the
information contained in the FLN by considering non-adja-
cent nodes, but at the same time it can be more susceptible to
noise. Such issues are exemplified in recent work by Wu et al.
[23], where they compared a direct interaction based local
rule and a shortest path rule, based on their abilities to prior-
itize disease genes. Surprisingly, the shortest path rule, which
uses global network topological information, performs worse
than the direct interaction rule [23]. A likely reason is that
although, in principle, rules utilizing global network topolog-
ical information are preferred, they are more sensitive to the
false positive and false negative links in the network. In prac-
tice, however, a properly implemented local rule can perform
well, when combined with a comprehensive and weighted
FLN.
Further considerations for disease gene prioritization
Among the data sources used for constructing the integrated
FLN, literature-based text mining, GO annotation (GO anno-
tations in the molecular function and cellular component cat-
egories are included in the integration), and curated PPI
might be biased towards well characterized genes (Table 1).
Similarly, text mining and curated PPI data mapped from
mouse and rat (organisms close to human in the evolutionary
tree) via orthology may also have the same bias. Conse-
FLN-based disease-disease association networkFigure 8 (see previous page)
FLN-based disease-disease association network. (a) An example network of 66 diseases (nodes) linked by the top 100 edges with the highest mutual
predictability scores. Many of these edges cannot be identified using the simple disease-gene sharing method, and these are colored red. The rest of the
edges are colored blue, which link disease pairs with one or more overlapping disease genes. This disease-disease association network has a modular
topology, and diseases tend to form clusters (rectangles). The disease clusters are labeled based on enriched disease class or underlying molecular
mechanisms. The following disease nodes mentioned in the text are labeled: ovarian cancer (OC), prostate cancer (PC), Leber congenital amaurosis (LC),
cone or cone-rod dystrophy (CD), retinitis pigmentosa (RP), night blindness (NB), Leigh syndrome (LS), mitochondrial DNA depletion syndrome (MD),
combined oxidative phosphorylation deficiency (CO), mitochondrial complex I/II/III deficiency (MC), Alzheimer's disease (AZ), hypercholesterolemia
(HC), pseudohypoaldosteronism (PH), Bartter syndrome (BS), holoprosencephaly (HP), Waardenburg syndrome (WS), central hypoventilation syndrome
(CH), Hirschsprung disease (HD), ceroid-lipofuscinosis (CL), and glaucoma (GC). (b) Functional links among Alzheimer's disease genes (purple nodes) and
hypercholesterolemia disease genes (blue nodes) in the FLN. Green edges represent functional links between Alzheimer's disease genes and
hypercholesterolemia genes. Light blue edges represent functional links connecting genes associated with the same disease. Edge thickness is proportional
to linkage weight. Both networks are generated by Visant [76].
Genome Biology 2009, Volume 10, Issue 9, Article R91 Linghu et al. R91.12
Genome Biology 2009, 10:R91
quently, predictions based on these sources tend to be biased
towards well characterized genes. On the other hand, the
remaining data sources are relatively unbiased, and include
sequence data, high-throughput experiments, and functional
associations mapped from yeast, worm, and fly (organisms
distant to human in the evolutionary tree). Predictions from
these latter sources can reveal new disease genes that are not
well characterized. To test the extent to which our predictions
depend on the relatively biased data sources, we remove them
and use the remaining unbiased sources for FLN construction
and disease gene prioritization. The prediction performance
remains far better than random control (Figure S6 in Addi-
tional data file 5). Using the gene-centric assessment, over
40% of disease genes are still ranked within the top 10 posi-
tions in the artificial chromosome region background com-
posed of 100 genes. The disease-centric assessment also
shows similar results. Therefore, our predictions do not solely
rely on the potentially biased text mining, molecular function
and cellular component annotations of GO, and curated PPI
data sources; other relatively unbiased sources also make sig-
nificant contributions to the disease gene prediction and bio-
logical insights that go beyond well characterized genes.
Our current framework assumes that known disease genes
('seed genes') contribute equally to the disease, but in reality
some seed genes may contribute more than others, especially
for complex diseases. An example is homozygosity in the
APOE4 allele, which confers a 40% chance of late-onset
Alzheimer's disease [73]. Incorporation of this notion of 'seed
strength' into our framework would be desirable. In addition,
our framework requires the knowledge of a number of known
disease genes as seed genes in order to predict new candidate
genes. A further improvement might be to borrow seed genes
from closely related diseases when the disease under study
does not have enough seeds, adjusting the strength in accord-
ance with how closely related the two diseases are.
Additionally, FLN has been made available in VisANT [74], a
web-based platform for the integrative visualization and anal-
ysis of biological networks and pathways [75-80]. Users can
interactively query the FLN for genes of interest by choosing
FLN as the current database in the VisANT toolbar; compare
the FLN with other interaction data by updating gene interac-
tions stored in the Predictome database; and filter the FLN
with preferred weights and visualize the weight using edge
color, edge thickness or both. In addition, we are developing
a series of functions to integrate the methods of FLN-based
prediction of new disease genes and disease-disease associa-
tions into VisANT, including making predictions for the new
seed sets provided by users. Each disease will be represented
as a metanode [78] - a special type of node that contains asso-
ciated sub-nodes (disease genes), which allows direct integra-
tion of disease information and the FLN. These new functions
will extend the applications developed here to other areas,
such as the prediction of new proteins for protein complexes,
cross-talk between pathways and so on.
Further considerations for FLN-based identification of
disease-disease associations
Here, we carry out a proof-of-principle study with our mutual
predictability measure to demonstrate that the functional
links provided by the FLN can be used to quantify disease-dis-
ease associations at the molecular level as illustrated in the
Results section. Further studies are needed to improve our
measures as well as to explore related measures of disease-
disease associations based on the FLN. Our approach for
assessing disease-disease associations requires the knowl-
edge of a few known disease genes for each disease, and can-
not be applied to diseases with no known disease genes. In
these cases, phenotype-based methods such as [3] are good
alternatives if there is enough disease phenotype information
available, bearing in mind that it is possible for two diseases
to share related molecular pathology mechanisms but be less
similar at the phenotypic level [1,2]. In general, it is likely that
the identification of disease-disease associations can be fur-
ther improved by combing our FLN-based approach with
phenotype-based approaches.
Conclusions
In this work, we build a comprehensive and high quality
weighted FLN by integrating 16 functional genomics features
assembled from 32 sub-features from 6 model organisms. To
our knowledge, our integrated human FLN is the most com-
prehensive to date.
We show that genome-wide disease gene prioritization for
diverse diseases can be obtained using our integrated FLN.
Top ranking candidate disease genes can be used to guide the
design of new genetic association studies. Conversely, in the
future, results from genetic association studies can be further
integrated into our framework for better disease gene predic-
tions.
We also show that the integrated FLN can be used to identify
disease-disease associations, even among diseases that share
no known disease genes or have dissimilar phenotypes. Thus,
we show that by considering functional linkages between
genes involved in different diseases, relationships between
diseases that are based on underlying molecular mechanisms
can be revealed. Such associations can potentially be used to
generate novel hypotheses on the molecular mechanisms of
human diseases, and can in turn guide the development of
relevant therapy as illustrated in the case of Alzheimer's dis-
ease and hypercholesterolemia.
Materials and methods
Human dataset
All methods are applied to a common set of 25,564 protein
encoding genes (downloaded from RefSeq in November 2007
[42]) with the Entrez gene ID as the unique identifier [81].
For data sources using different gene or protein identifiers,
Genome Biology 2009, Volume 10, Issue 9, Article R91 Linghu et al. R91.13
Genome Biology 2009, 10:R91
the original identifiers are all mapped to Entrez gene IDs
using the cross-reference files from Entrez Gene [81], the
International Protein Index (IPI) database [82], or Biomart
[83].
FLN construction
Gold standard
We construct gold standard datasets for gene-gene functional
association in the following way. Gold-standard positives
(GSPs) are defined as gene pairs sharing the same biological
process term in GO. Gold-standard negatives (GSNs) are
defined as gene pairs annotated by GO biological process
terms but that do not share any term. As a result, 1,456,585
pairs are included in GSP, and 3,345,661 pairs are included in
GSN. These gene pairs are composed of 5,955 human genes.
Details are provided in Additional data files 5 and 11.
Naïve Bayes classifier for FLN construction
We use a naïve Bayes classifier [84] to predict gene pairs that
participate in the same GO biological process. The inputs to
the classifier include diverse genomic features assembled
from various data sources (Table 1). Similar to other studies
[29,85], we use a log likelihood ratio (LR) score to quantify
the degree of functional association between two genes. The
associated gene pairs are then assembled into a functional
linkage network with individual genes as nodes and the LR
score as the linkage weight.
There are two primary reasons that we choose naïve Bayes as
the integration approach. First, it allows for the direct inte-
gration of heterogeneous data sources in an easily interpreta-
ble model. Second, it calculates the probability that two genes
participate in the same biological process given the input fea-
tures. Naïve Bayes classifiers have been used to successfully
combine heterogeneous data in human [29,38,39]. It is pos-
sible, and perhaps likely, that other multivariate methods
would perform equally as well [86].
In the Bayesian framework, we use the LR score to quantify
the degree of functional association between a gene pair:
where I is a binary variable representing the existence of func-
tional association (GSP pairs), ~I represents the absence of
functional association (GSN pairs), f
1
through f
n
are the
genomic features, and LR is the likelihood ratio.
In naïve Bayes, we assume that features are conditionally
independent. As a result, LR(f
1
, , f
n
) can be further written
as:
Equation 2 is equivalent to the following, where LLR repre-
sents log likelihood ratios:
Naïve Bayes assumes conditional independence among fea-
tures, but the naïve Bayes classifier can still be applied even
when this assumption is not strictly satisfied [29,85,87]. In
our work, we minimize conditional dependence among fea-
tures by combining related datasets or features into single
features before final integration (Additional data file 5).
Indeed, no strong correlations exist among our final features
after this procedure (Additional data file 12).
As listed in Table 1, a total of 16 features assembled from 32
sub-features are utilized for the final integration (see Addi-
tional data file 5 for details).
FLN quality assessment
After the naïve Bayes integration, each gene pair is assigned a
probability for sharing a GO biological process. The quality of
this FLN is evaluated by plotting linkage precision versus
linkage sensitivity at various linkage weight cutoffs. Given a
pre-specified linkage weight cutoff, 'linkage precision' is
defined as the fraction of the linked gold-standard gene pairs
that belong to the GSP set, and 'linkage sensitivity' is defined
as the fraction of the GSP pairs that are linked. We perform
threefold cross-validation by randomly partitioning the gold
standard datasets into three equal segments, two serving as
training sets and the third as the test set. This procedure is
repeated three times such that each segment serves once as
the test set. Next, the three test sets are combined and the per-
formance is assessed by plotting linkage precision versus
linkage sensitivity. Finally the whole gold standard dataset is
used for training to generate one final FLN, which is then
used for disease gene prioritization and prediction of disease-
disease associations.
FLN-based disease gene prioritization
For a given disease, the known disease associated genes are
used as seeds. New candidate genes can then be ranked based
on their association with these seed genes in the FLN.
Seed genes
The seed disease genes are obtained from the OMIM data-
base, a compendium of human disease genes and phenotypes
[40]. The disease-gene associations are downloaded from the
Morbid Map (April 2008) [40]. To obtain reliable test statis-
tics, we include in the analysis only diseases with at least five
seed genes in the FLN. This results in 110 unique diseases
with a total of 1,025 seed genes (see Additional data files 2 and
5 for details).
LR f f
Pf f
n
I
Pf f
n
I
n1
1
1
, ,
, , |
, , |~
()
=
()
()
(1)
LR f f
PfI
Pf I
n
i
n
1
1
1
1
, ,
|
|~
()
=
(
)
(
)
=
∏
(2)
LLR f f LLR f LLR f
nn11
, ,
()
=
()
++
()
(3)
Genome Biology 2009, Volume 10, Issue 9, Article R91 Linghu et al. R91.14
Genome Biology 2009, 10:R91
Neighborhood-weighting decision rule
Given a particular disease and its seed gene set, we quantify
the association of each candidate gene i with the disease using
the following disease association score S
i
:
where w
ij
is the linkage weight connecting gene i and seed j
[41,43]. This score is 0 for genes not connected to any seed.
The justifications of the rule selection are described in Addi-
tional data file 5.
Performance assessment for disease gene prioritization
Disease-centric assessment
Disease-centric assessment evaluates an overall prediction
performance for each individual disease [41,43]. In particu-
lar, for a given disease, first each gene is ranked based on the
disease association score (S
i
; Equation 4). The S
i
for each seed
gene is computed using leave-one-out cross-validation, based
on its connectivity to other seeds. Next a ROC curve is gener-
ated to assess how well known disease (seed) genes are
ranked relative to non-seed genes in the ranked gene list. The
ROC curve plots true positive rate (sensitivity) versus false
positive rate (1 - specificity) at different S
i
cutoffs:
where TP (true positive) is the number of seed genes above
the S
i
cutoff, FP (false positive) is the number of non-seed
genes above the cutoff, TN (true negative) is the number of
non-seed genes below the cutoff, and FN (false negative) is
the number of seed genes below the cutoff.
Finally, an AUC is calculated for each ROC curve to represent
the predictability of a disease. AUC scores range between 0
and 1, with 0.5 and 1.0 indicating random and perfect predic-
tive performance, respectively. Here we treat non-seed genes
as non-disease genes, but some of these non-seed genes can
be new disease-associated genes. Hence, our performance
evaluation is likely an underestimate.
Gene-centric assessment
Gene-centric assessment treats each known gene-disease
association as a test case [19,23]. For each test case, the task
is to assess how well the known disease (seed) gene ranks rel-
ative to a background gene set. Gene centric assessment is
also carried out using leave-one-out cross-validation. For
each test case, the tested seed gene is ranked according to its
connectivity to the remaining seed genes (Equation 4), and
compared against a background gene set.
To assess the overall performance of a method, we first deter-
mine the rank of each tested disease gene among the back-
ground gene set within each test case, and then pool together
all test cases and compute the fraction of the tested disease
genes ranked above various cutoffs. A second commonly used
measure is fold enrichment, defined as the average rank of a
gene before prioritization divided by the rank after prioritiza-
tion [19]. For instance, to rank a test disease gene with a back-
ground gene set of 100 genes, the average rank before
prioritization is 50. If the test disease gene is ranked top 1,
then its fold enrichment is 50/1 = 50.
Random control
Similar to McGary et al. [43], we assemble 100 random gene
sets from the FLN for each given disease. Each gene set has
the same number of genes as the seed gene set for the given
disease. Next we perform the same FLN-based disease gene
prioritization and evaluation using these randomly assem-
bled seed sets.
Estimate precision for disease gene predictions
To estimate the prediction for disease gene predictions, we
first rank the predicted candidate disease genes by their dis-
ease association scores (S
i
; Equation 4). Precision is then esti-
mated at different rank cutoffs.
For each particular disease, each known disease gene (seed)
is assigned a disease association score (S
i
) based on its func-
tional linkage to other seeds. We then rank the seed genes
together with other non-seed genes based on their S
i
scores.
At each rank cutoff, we calculate the precision as the fraction
of genes above the cutoff that are seed genes. This is likely an
underestimate, since some non-seed genes can be new dis-
ease-related genes.
For each of the 110 diseases, we provide the precision esti-
mate for its top 100 predicted new candidate genes by plot-
ting precision versus rank cutoff.
Mutual predictability as an estimate for disease-disease
association at the molecular level
Given two diseases, I and II, each of which is associated with
a set of known disease genes, we define a mutual predictabil-
ity score that reflects the degree of association between the
two diseases (Figure S7 in Additional data file 5). The mutual
predictability score accounts for both the number of genes in
common between the two disease gene sets, and the func-
tional links between the two sets in the FLN. In essence, the
mutual predictability score evaluates the degree to which
genes associated with disease I can be used as seed genes to
predict genes associated with disease II (predictability
I-II
),
and vice versa (predictability
II-I
). High mutual predictability
implies close association between the two disease gene sets in
the FLN, suggesting related molecular mechanisms.
To quantify predictability
I-II
, we first use genes associated
with disease I as seeds, and rank all other genes based on the
S
i
score (Equation 4). In addition, disease II genes that over-
SW
iij
j seeds
=
∈
∑
(4)
Sensitivity =+TP TP FN/( )
(5)
1 −=+Specificity FP TN FP/( )
(6)
Genome Biology 2009, Volume 10, Issue 9, Article R91 Linghu et al. R91.15
Genome Biology 2009, 10:R91
lap with the seed genes from disease I are given a S
i
score of
infinity and ranked on the top. Next, we plot a ROC curve of
sensitivity versus 1 - specificity on how well the disease II
genes are ranked in the sorted gene list. Sensitivity and (1 -
specificity) are defined in Equations 5 and 6, where TP is the
number of disease II genes above a particular S
i
cutoff, TN is
the number of genes associated with neither disease below
the cutoff, FP is the number of genes associated with neither
disease above the cutoff, and FN is the number of disease II
genes below the cutoff. Finally, we calculate the AUC of the
ROC curve (AUC
I-II
) as a measure for predictability
I-II
.
Similarly, we can calculate AUC
II-I
as a measure of predicta-
bility
II-I
. The mutual predictability between disease I and II is
defined as the geometric mean of AUC
I-II
and AUC
II-I
:
Since AUC ranges from 0 to 1, the mutual predictability also
ranges from 0 to 1.
Abbreviations
AUC: area under receiver operating characteristic curve; CC:
cellular component; DDI: domain-domain interaction; DS:
protein domain sharing; FLN: functional linkage network;
GO: Gene Ontology; GS: gold standard; GSP: gold standard
positive; GSN: gold standard negative; GN: gene neighbour;
HPRD: Human Protein Reference Database; KEGG: Kyoto
Encyclopaedia of Genes and Genomes; LR: likelihood ratio;
LLR: log likelihood ratio; Masspec: Mass Spectrometry; MF:
molecular function; MIPs: The Munich Information Center
for Protein Sequences; OMIM: Online Mendelian Inheritance
in Man Database; PG: phylogenetic profiles; PPI: protein-
protein interaction; RefSeq: Reference Sequence Database;
ROC: receiver operating characteristic; TexM: text mining;
Y2H: yeast two hybrid experiments.
Authors' contributions
BL designed and implemented the whole computation frame-
work. ESS provided constructive discussions and revised the
manuscript. ZH provided constructive discussions. YX moni-
tored the whole framework. CD directed the whole project
and is Principal Investigator on the NIH grant that funded the
project. All the authors have read and agreed to the manu-
script.
Additional data files
The following additional data are available with the online
version of this paper: a text file listing edges in the integrated
human functional linkage network (Additional data file 1); a
table listing known (seed) disease genes associated with each
of the 110 diseases (Additional data file 2); a list of the top 100
predicted candidate disease genes for each of the 110 diseases
(Additional data file 3); a plot of precision versus rank cutoff
for the top 100 predicted candidate disease genes for each of
the 110 diseases (Additional data file 4); supplementary text
and figures (Additional data file 5); a list of recently identified
disease genes and landmark references dated after January
2007 (Additional data file 6); a list of the 22 predicted obesity
genes among the top 100 predicted gene list that overlap with
the obesity genes collected from literature by Hanock et al.
[58] (Additional data file 7); a list of mutual predictability
scores for all the possible disease pairs between the 110 dis-
eases (Additional data file 8); a list of the top 100 disease pairs
with the highest mutual predictability scores and the support-
ing evidence for the association (Additional data file 9); a list
of the disease clusters, their disease members, and evidence
supporting the associations in Figure S9 of Additional data
file 5 and Figure 8a (Additional data file 10); a list of the 53
informative GO terms used to define the gold standard sets
for the naïve Bayes integration (Additional data file 11); a list
of Pearson correlation coefficients between the 16 features
used for the naïve Bayes integration (Additional data file 12).
Additional data file 1Edges in the integrated human functional linkage networkColumn 1, Entrez Gene ID for gene A; column 2, Entrez Gene ID for gene B; column 3, functional linkage weight (log likelihood ratio of the naïve Bayes integration).Click here for fileAdditional data file 2Known (seed) disease genes associated with each of the 110 dis-easesKnown (seed) disease genes associated with each of the 110 dis-eases.Click here for fileAdditional data file 3The top 100 predicted candidate disease genes for each of the 110 diseasesA WinRAR archive composed of a readme.txt file and 110 predic-tion files for the 110 diseases. For each disease, we list the top 100 ranked new candidate disease genes not included in the disease seed gene set. The description of the prediction files is provided in the readme.txt file.Click here for fileAdditional data file 4Plot of precision versus rank cutoff for the top 100 predicted candi-date disease genes for each of the 110 diseasesPlot of precision versus rank cutoff for the top 100 predicted candi-date disease genes for each of the 110 diseases.Click here for fileAdditional data file 5Supplementary text and figuresSupplemental methods, supplementary results, supplementary Figures S1 to S9, and supplementary Table S1 to S4.Click here for fileAdditional data file 6Recently identified disease genes and landmark references dated after January 2007Recently identified disease genes and landmark references dated after January 2007.Click here for fileAdditional data file 7The 22 predicted obesity genes among the top 100 predicted gene list that overlap with the obesity genes collected from literature by Hanock et al. [58]The 22 predicted obesity genes among the top 100 predicted gene list that overlap with the obesity genes collected from literature by Hanock et al. [58].Click here for fileAdditional data file 8Mutual predictability scores for all the possible disease pairs between the 110 diseasesMutual predictability scores for all the possible disease pairs between the 110 diseases.Click here for fileAdditional data file 9The top 100 disease pairs with the highest mutual predictability scores and the supporting evidence for the associationThe top 100 disease pairs with the highest mutual predictability scores and the supporting evidence for the association.Click here for fileAdditional data file 10Disease clusters, their disease members, and evidence supporting the associations in Figure S9 of Additional data file 5 and Figure 8aDisease clusters, their disease members, and evidence supporting the associations in Figure S9 of Additional data file 5 and Figure 8a.Click here for fileAdditional data file 11The 53 informative GO terms used to define the gold standard sets for the naïve Bayes integrationThe 53 informative GO terms used to define the gold standard sets for the naïve Bayes integration.Click here for fileAdditional data file 12Pearson correlation coefficients between the 16 features used for the naïve Bayes integrationPearson correlation coefficients between the 16 features used for the naïve Bayes integration.Click here for file
Acknowledgements
CD acknowledges funding from the NIH R01 RR022971. YX is supported
by a Research Starter Grant in Informatics from the PhRMA Foundation.
References
1. Oti M, Huynen MA, Brunner HG: Phenome connections. Trends
Genet 2008, 24:103-106.
2. Oti M, Brunner HG: The modular nature of genetic diseases.
Clin Genet 2007, 71:1-11.
3. van surDriel MA, Bruggeman J, Vriend G, Brunner HG, Leunissen JA:
A text-mining analysis of the human phenome. Eur J Hum
Genet 2006, 14:535-542.
4. Goh KI, Cusick ME, Valle D, Childs B, Vidal M, Barabasi AL: The
human disease network. Proc Natl Acad Sci USA 2007,
104:8685-8690.
5. Pan W: Network-based model weighting to detect multiple
loci influencing complex diseases. Hum Genet 2008,
124:225-234.
6. Ideker T, Sharan R: Protein networks in disease. Genome Res
2008, 18:644-652.
7. Ohya Y, Sese J, Yukawa M, Sano F, Nakatani Y, Saito TL, Saka A,
Fukuda T, Ishihara S, Oka S, Suzuki G, Watanabe M, Hirata A, Ohtani
M, Sawai H, Fraysse N, Fraysse JP, Francois JM, Aebi M, Tanaka S,
Muramatsu S, Araki H, Sonoike K, Nogami S, Morishita S: High-
dimensional and large-scale phenotyping of yeast mutants.
Proc Natl Acad Sci USA 2005, 102:19015-19020.
8. Dudley AM, Janse DM, Tanay A, Shamir R, Church GM: A global
view of pleiotropy and phenotypically derived gene function
in yeast. Mol Syst Biol 2005, 1:. 2005 0001.
9. Freudenberg J, Propping P: A similarity-based method for
genome-wide prediction of disease-relevant human genes.
Bioinformatics 2002, 18(Suppl 2):S110-115.
10. Lim J, Hao T, Shaw C, Patel AJ, Szabo G, Rual JF, Fisk CJ, Li N, Smolyar
A, Hill DE, Barabasi AL, Vidal M, Zoghbi HY: A protein-protein
interaction network for human inherited ataxias and disor-
ders of Purkinje cell degeneration. Cell 2006, 125:801-814.
11. Goehler H, Lalowski M, Stelzl U, Waelter S, Stroedicke M, Worm U,
Droege A, Lindenberg KS, Knoblich M, Haenig C, Herbst M, Suopanki
J, Scherzinger E, Abraham C, Bauer B, Hasenbank R, Fritzsche A,
Ludewig AH, Bussow K, Coleman SH, Gutekunst CA, Landwe-
hrmeyer BG, Lehrach H, Wanker EE: A protein interaction net-
work links GIT1, an enhancer of huntingtin aggregation, to
Huntington's disease. Mol Cell 2004, 15:853-865.
Mutual Predictability
disease I and II()
=×
−−
AUC AUC
III III
(7)
Genome Biology 2009, Volume 10, Issue 9, Article R91 Linghu et al. R91.16
Genome Biology 2009, 10:R91
12. Calvano SE, Xiao W, Richards DR, Felciano RM, Baker HV, Cho RJ,
Chen RO, Brownstein BH, Cobb JP, Tschoeke SK, Miller-Graziano C,
Moldawer LL, Mindrinos MN, Davis RW, Tompkins RG, Lowry SF: A
network-based analysis of systemic inflammation in humans.
Nature 2005, 437:1032-1037.
13. Ghazalpour A, Doss S, Zhang B, Wang S, Plaisier C, Castellanos R,
Brozell A, Schadt EE, Drake TA, Lusis AJ, Horvath S: Integrating
genetic and network analysis to characterize genes related
to mouse weight. PLoS Genet 2006, 2:e130.
14. Pujana MA, Han JD, Starita LM, Stevens KN, Tewari M, Ahn JS, Ren-
nert G, Moreno V, Kirchhoff T, Gold B, Assmann V, Elshamy WM,
Rual JF, Levine D, Rozek LS, Gelman RS, Gunsalus KS, Greenberg RA,
Sobhian B, Bertin N, Venkatesan K, Ayivi-Guedehoussou N, Sole X,
Hernandez P, Lazaro C, Nathanson KL, Weber BL, Cusick ME, Hill
DE, Offit K: Network modeling links breast cancer susceptibil-
ity and centrosome dysfunction. Nat Genet 2007, 39:1338-1349.
15. Franke L, Bakel H, Fokkens L, de surJong ED, Egmont-Petersen M,
Wijmenga C: Reconstruction of a functional human gene net-
work, with an application for prioritizing positional candi-
date genes. Am J Hum Genet 2006, 78:1011-1025.
16. Wood LD, Parsons DW, Jones S, Lin J, Sjoblom T, Leary RJ, Shen D,
Boca SM, Barber T, Ptak J, Silliman N, Szabo S, Dezso Z, Ustyanksky
V, Nikolskaya T, Nikolsky Y, Karchin R, Wilson PA, Kaminker JS,
Zhang Z, Croshaw R, Willis J, Dawson D, Shipitsin M, Willson JK,
Sukumar S, Polyak K, Park BH, Pethiyagoda CL, Pant PV, et al.: The
genomic landscapes of human breast and colorectal cancers.
Science 2007, 318:1108-1113.
17. Ala U, Piro RM, Grassi E, Damasco C, Silengo L, Oti M, Provero P, Di
surCunto F: Prediction of human disease genes by human-
mouse conserved coexpression analysis. PLoS Comput Biol 2008,
4:e1000043.
18. Fraser HB, Plotkin JB: Using protein complexes to predict phe-
notypic effects of gene mutation. Genome Biol 2007, 8:R252.
19. Kohler S, Bauer S, Horn D, Robinson PN: Walking the interac-
tome for prioritization of candidate disease genes. Am J Hum
Genet 2008, 82:949-958.
20. Lage K, Karlberg EO, Storling ZM, Olason PI, Pedersen AG, Rigina O,
Hinsby AM, Tumer Z, Pociot F, Tommerup N, Moreau Y, Brunak S:
A human phenome-interactome network of protein com-
plexes implicated in genetic disorders. Nat Biotechnol 2007,
25:309-316.
21. Oti M, Snel B, Huynen MA, Brunner HG: Predicting disease genes
using protein-protein interactions. J Med Genet 2006,
43:691-698.
22. Oti M, van surReeuwijk J, Huynen MA, Brunner HG: Conserved co-
expression for candidate disease gene prioritization. BMC Bio-
informatics 2008, 9:208.
23. Wu X, Jiang R, Zhang MQ, Li S: Network-based global inference
of human disease genes. Mol Syst Biol 2008, 4:189.
24. Aerts S, Lambrechts D, Maity S, Van surLoo P, Coessens B, De surS-
met F, Tranchevent LC, De surMoor B, Marynen P, Hassan B, Carme-
liet P, Moreau Y: Gene prioritization through genomic data
fusion. Nat Biotechnol 2006, 24:537-544.
25. Perez-Iratxeta C, Bork P, Andrade MA: Association of genes to
genetically inherited diseases using data mining. Nat Genet
2002, 31:316-319.
26. Tiffin N, Kelso JF, Powell AR, Pan H, Bajic VB, Hide WA: Integration
of text- and data-mining using ontologies successfully selects
disease gene candidates. Nucleic Acids Res 2005, 33:1544-1552.
27. Turner FS, Clutterbuck DR, Semple CA: POCUS: mining genomic
sequence annotation to predict disease genes. Genome Biol
2003, 4:R75.
28. Adie EA, Adams RR, Evans KL, Porteous DJ, Pickard BS: Speeding
disease gene discovery by sequence based candidate prioriti-
zation. BMC Bioinformatics 2005, 6:55.
29. Calvo S, Jain M, Xie X, Sheth SA, Chang B, Goldberger OA, Spinazzola
A, Zeviani M, Carr SA, Mootha VK: Systematic identification of
human mitochondrial disease genes through integrative
genomics. Nat Genet 2006, 38:
576-582.
30. Gaulton KJ, Mohlke KL, Vision TJ: A computational system to
select candidate genes for complex human traits. Bioinformat-
ics 2007, 23:1132-1140.
31. Lopez-Bigas N, Ouzounis CA: Genome-wide identification of
genes likely to be involved in human genetic disease. Nucleic
Acids Res 2004, 32:3108-3114.
32. Shriner D, Baye TM, Padilla MA, Zhang S, Vaughan LK, Loraine AE:
Commonality of functional annotation: a method for priori-
tization of candidate genes from genome-wide linkage stud-
ies. Nucleic Acids Res 2008, 36:e26.
33. Guan Y, Myers CL, Lu R, Lemischka IR, Bult CJ, Troyanskaya OG: A
genomewide functional network for the laboratory mouse.
PLoS Comput Biol 2008, 4:e1000165.
34. Tasan M, Tian W, Hill DP, Gibbons FD, Blake JA, Roth FP: An en
masse phenotype and function prediction system for Mus
musculus . Genome Biol 2008, 9(Suppl 1):S8.
35. Kanehisa M, Goto S, Kawashima S, Okuno Y, Hattori M: The KEGG
resource for deciphering the genome. Nucleic Acids Res 2004,
32:D277-280.
36. Vastrik I, D'Eustachio P, Schmidt E, Joshi-Tope G, Gopinath G, Croft
D, de surBono B, Gillespie M, Jassal B, Lewis S, Matthews L, Wu G,
Birney E, Stein L: Reactome: a knowledge base of biologic path-
ways and processes. Genome Biol 2007, 8:R39.
37. Rzhetsky A, Wajngurt D, Park N, Zheng T: Probing genetic over-
lap among complex human phenotypes. Proc Natl Acad Sci USA
2007, 104:11694-11699.
38. Scott MS, Barton GJ: Probabilistic prediction and ranking of
human protein-protein interactions. BMC Bioinformatics 2007,
8:239.
39. Rhodes DR, Tomlins SA, Varambally S, Mahavisno V, Barrette T, Kaly-
ana-Sundaram S, Ghosh D, Pandey A, Chinnaiyan AM: Probabilistic
model of the human protein-protein interaction network.
Nat Biotechnol 2005, 23:951-959.
40. Hamosh A, Scott AF, Amberger JS, Bocchini CA, McKusick VA:
Online Mendelian Inheritance in Man (OMIM), a knowledge-
base of human genes and genetic disorders. Nucleic Acids Res
2005, 33:D514-517.
41. Lee I, Lehner B, Crombie C, Wong W, Fraser AG, Marcotte EM: A
single gene network accurately predicts phenotypic effects
of gene perturbation in Caenorhabditis elegans . Nat Genet
2008, 40:181-188.
42. Pruitt KD, Tatusova T, Maglott DR: NCBI reference sequences
(RefSeq): a curated non-redundant sequence database of
genomes, transcripts and proteins. Nucleic Acids Res 2007,
35:D61-65.
43. McGary KL, Lee I, Marcotte EM: Broad network-based predicta-
bility of Saccharomyces cerevisiae gene loss-of-function phe-
notypes. Genome Biol 2007, 8:R258.
44. McDermott J, Bumgarner R, Samudrala R: Functional annotation
from predicted protein interaction networks. Bioinformatics
2005, 21:3217-3226.
45. Mishra GR, Suresh M, Kumaran K, Kannabiran N, Suresh S, Bala P, Shi-
vakumar K, Anuradha N, Reddy R, Raghavan TM, Menon S, Hanuman-
thu G, Gupta M, Upendran S, Gupta S, Mahesh M, Jacob B, Mathew P,
Chatterjee P, Arun KS, Sharma S, Chandrika KN, Deshpande N, Pal-
vankar K, Raghavnath R, Krishnakanth R, Karathia H, Rekha B, Nayak
R, Vishnupriya G, et al.: Human protein reference database
2006 update. Nucleic Acids Res 2006, 34:D411-414.
46. Bader GD, Betel D, Hogue CW: BIND: the Biomolecular Inter-
action Network Database. Nucleic Acids Res 2003, 31:248-250.
47. Breitkreutz BJ, Stark C, Reguly T, Boucher L, Breitkreutz A, Livstone
M, Oughtred R, Lackner DH, Bahler J, Wood V, Dolinski K, Tyers M:
The BioGRID Interaction Database: 2008 update. Nucleic
Acids Res 2008, 36:D637-640.
48. Kerrien S, Alam-Faruque Y, Aranda B, Bancarz I, Bridge A, Derow C,
Dimmer E, Feuermann M, Friedrichsen A, Huntley R, Kohler C,
Khadake J, Leroy C, Liban A, Lieftink C, Montecchi-Palazzi L, Orchard
S, Risse J, Robbe K, Roechert B, Thorneycroft D, Zhang Y, Apweiler
R, Hermjakob H: IntAct - open source resource for molecular
interaction data. Nucleic Acids Res 2007, 35:D561-565.
49. Mewes HW, Dietmann S, Frishman D, Gregory R, Mannhaupt G,
Mayer KF, Munsterkotter M, Ruepp A, Spannagl M, Stumpflen V, Rat-
tei T: MIPS: analysis and annotation of genome information
in 2007.
Nucleic Acids Res 2008, 36:D196-201.
50. Salwinski L, Miller CS, Smith AJ, Pettit FK, Bowie JU, Eisenberg D:
The Database of Interacting Proteins: 2004 update. Nucleic
Acids Res 2004, 32:D449-451.
51. Chatr-Aryamontri A, Zanzoni A, Ceol A, Cesareni G: Searching the
protein interaction space through the MINT Database. Meth-
ods Mol Biol 2008, 484:305-317.
52. Rual JF, Venkatesan K, Hao T, Hirozane-Kishikawa T, Dricot A, Li N,
Berriz GF, Gibbons FD, Dreze M, Ayivi-Guedehoussou N, Klitgord N,
Simon C, Boxem M, Milstein S, Rosenberg J, Goldberg DS, Zhang LV,
Wong SL, Franklin G, Li S, Albala JS, Lim J, Fraughton C, Llamosas E,
Cevik S, Bex C, Lamesch P, Sikorski RS, Vandenhaute J, Zoghbi HY, et
al.: Towards a proteome-scale map of the human protein-
protein interaction network. Nature 2005, 437:1173-1178.
Genome Biology 2009, Volume 10, Issue 9, Article R91 Linghu et al. R91.17
Genome Biology 2009, 10:R91
53. Ewing RM, Chu P, Elisma F, Li H, Taylor P, Climie S, McBroom-Cera-
jewski L, Robinson MD, O'Connor L, Li M, Taylor R, Dharsee M, Ho
Y, Heilbut A, Moore L, Zhang S, Ornatsky O, Bukhman YV, Ethier M,
Sheng Y, Vasilescu J, Abu-Farha M, Lambert JP, Duewel HS, Stewart II,
Kuehl B, Hogue K, Colwill K, Gladwish K, Muskat B, et al.: Large-
scale mapping of human protein-protein interactions by
mass spectrometry. Mol Syst Biol 2007, 3:89.
54. Stelzl U, Worm U, Lalowski M, Haenig C, Brembeck FH, Goehler H,
Stroedicke M, Zenkner M, Schoenherr A, Koeppen S, Timm J, Mint-
zlaff S, Abraham C, Bock N, Kietzmann S, Goedde A, Toksoz E,
Droege A, Krobitsch S, Korn B, Birchmeier W, Lehrach H, Wanker
EE: A human protein-protein interaction network: a resource
for annotating the proteome. Cell 2005, 122:957-968.
55. Lehner B, Fraser AG: A first-draft human protein-interaction
map. Genome Biol 2004, 5:R63.
56. von surMering C, Jensen LJ, Kuhn M, Chaffron S, Doerks T, Kruger B,
Snel B, Bork P: STRING 7 - recent developments in the inte-
gration and prediction of protein interactions. Nucleic Acids
Res 2007, 35:D358-362.
57. Grundy SM: Obesity, metabolic syndrome, and cardiovascular
disease. J Clin Endocrinol Metab 2004, 89:2595-2600.
58. Hancock AM, Witonsky DB, Gordon AS, Eshel G, Pritchard JK, Coop
G, Di surRienzo A: Adaptations to climate in candidate genes
for common metabolic disorders. PLoS Genet 2008, 4:e32.
59. Gerin I, Dolinsky VW, Shackman JG, Kennedy RT, Chiang SH, Burant
CF, Steffensen KR, Gustafsson JA, MacDougald OA: LXRbeta is
required for adipocyte growth, glucose homeostasis, and
beta cell function. J Biol Chem 2005, 280:23024-23031.
60. Tontonoz P, Mangelsdorf DJ: Liver X receptor signaling path-
ways in cardiovascular disease.
Mol Endocrinol 2003, 17:985-993.
61. Li AC, Glass CK: PPAR- and LXR-dependent pathways con-
trolling lipid metabolism and the development of atheroscle-
rosis. J Lipid Res 2004, 45:2161-2173.
62. Steffensen KR, Gustafsson JA: Putative metabolic effects of the
liver X receptor (LXR). Diabetes 2004, 53(Suppl 1):S36-42.
63. Millatt LJ, Bocher V, Fruchart JC, Staels B: Liver X receptors and
the control of cholesterol homeostasis: potential therapeu-
tic targets for the treatment of atherosclerosis. Biochim Bio-
phys Acta 2003, 1631:107-118.
64. Dahlman I, Nilsson M, Jiao H, Hoffstedt J, Lindgren CM, Humphreys
K, Kere J, Gustafsson JA, Arner P, Dahlman-Wright K: Liver X
receptor gene polymorphisms and adipose tissue expression
levels in obesity. Pharmacogenet Genomics 2006, 16:881-889.
65. Fang L, Zhang M, Li C, Dong S, Hu Y: Chemical genetic analysis
reveals the effects of NMU2R on the expression of peptide
hormones. Neurosci Lett 2006, 404:148-153.
66. Schmolz KMP, Bufe B, Vogel H, Nogueiras R, Scherneck S, Nestler M,
Zahn C, Rüschendorf F, Tschöp M, Meyerhof W, Joost H-G, Schür-
mann A: Role of neuromedin-U in the central control of feed-
ing behavior: a variant of the neuromedin-U receptor 2
contributes to hyperphagia in the New Zealand obese
mouse. Obesity Metabolism 2007, 3:28-37.
67. Xiong H, Callaghan D, Jones A, Walker DG, Lue LF, Beach TG, Sue
LI, Woulfe J, Xu H, Stanimirovic DB, Zhang W: Cholesterol reten-
tion in Alzheimer's brain is responsible for high beta- and
gamma-secretase activities and Abeta production. Neurobiol
Dis 2008, 29:422-437.
68. Hooijmans CR, Kiliaan AJ: Fatty acids, lipid metabolism and
Alzheimer pathology. Eur J Pharmacol 2008, 585:176-196.
69. Anstey KJ, Lipnicki DM, Low LF: Cholesterol as a risk factor for
dementia and cognitive decline: a systematic review of pro-
spective studies with meta-analysis. Am J Geriatr Psychiatry 2008,
16:
343-354.
70. Sedel F, Turpin JC, Baumann N: [Neurological presentations of
lysosomal diseases in adult patients]. Rev Neurol (Paris) 2007,
163:919-929.
71. Hayasaka S: Lysosomal enzymes in ocular tissues and diseases.
Surv Ophthalmol 1983, 27:245-258.
72. Adie EA, Adams RR, Evans KL, Porteous DJ, Pickard BS: SUS-
PECTS: enabling fast and effective prioritization of posi-
tional candidates. Bioinformatics 2006, 22:773-774.
73. Strittmatter WJ, Saunders AM, Schmechel D, Pericak-Vance M, Eng-
hild J, Salvesen GS, Roses AD: Apolipoprotein E: high-avidity
binding to beta-amyloid and increased frequency of type 4
allele in late-onset familial Alzheimer disease. Proc Natl Acad
Sci USA 1993, 90:1977-1981.
74. Integrative Visual Analysis Tool for Biological Networks and
Pathways [ />75. Hu Z, Snitkin ES, DeLisi C: VisANT: an integrative framework
for networks in systems biology. Brief Bioinform 2008, 9:317-325.
76. Hu Z, Ng DM, Yamada T, Chen C, Kawashima S, Mellor J, Linghu B,
Kanehisa M, Stuart JM, DeLisi C: VisANT 3.0: new modules for
pathway visualization, editing, prediction and construction.
Nucleic Acids Res 2007, 35:W625-632.
77. Hu Z, Mellor J, Wu J, Yamada T, Holloway D, Delisi C: VisANT:
data-integrating visual framework for biological networks
and modules. Nucleic Acids Res 2005, 33:W352-357.
78. Hu Z, Mellor J, Wu J, Kanehisa M, Stuart JM, DeLisi C: Towards
zoomable multidimensional maps of the cell. Nat Biotechnol
2007, 25:547-554.
79. Hu Z, Mellor J, Wu J, DeLisi C: VisANT: an online visualization
and analysis tool for biological interaction data. BMC Bioinfor-
matics 2004, 5:17.
80. Hu Z, Hung JH, Wang Y, Chang YC, Huang CL, Huyck M, DeLisi C:
VisANT 3.5: multi-scale network visualization, analysis and
inference based on the gene ontology. Nucleic Acids Res 2009,
37:W115-121.
81. Maglott D, Ostell J, Pruitt KD, Tatusova T: Entrez Gene: gene-
centered information at NCBI.
Nucleic Acids Res 2007,
35:D26-31.
82. Yip YL, Famiglietti M, Gos A, Duek PD, David FP, Gateau A, Bairoch
A: Annotating single amino acid polymorphisms in the Uni-
Prot/Swiss-Prot knowledgebase. Hum Mutat 2008, 29:361-366.
83. Kasprzyk A, Keefe D, Smedley D, London D, Spooner W, Melsopp C,
Hammond M, Rocca-Serra P, Cox T, Birney E: EnsMart: a generic
system for fast and flexible access to biological data. Genome
Res 2004, 14:160-169.
84. Duda RO, Hart PE, Stork aDG: Pattern Classification 2nd edition. New
York, NY: Wiley-Interscience; 2000.
85. Zhong W, Sternberg PW: Genome-wide prediction of C. elegans
genetic interactions. Science 2006, 311:1481-1484.
86. Linghu B, Snitkin ES, Holloway DT, Gustafson AM, Xia Y, DeLisi C:
High-precision high-coverage functional inference from inte-
grated data sources. BMC Bioinformatics 2008, 9:119.
87. Qi YJ, Bar-Joseph Z, Klein-Seetharaman J: Evaluation of different
biological data and computational classification methods for
use in protein interaction prediction. Proteins 2006, 63:490-500.
88. Lee HK, Hsu AK, Sajdak J, Qin J, Pavlidis P: Coexpression analysis
of human genes across many microarray data sets. Genome
Res 2004, 14:1085-1094.
89. Jensen LJ, Lagarde J, von surMering C, Bork P: ArrayProspector: a
web resource of functional associations inferred from micro-
array expression data. Nucleic Acids Res 2004, 32:W445-448.
90. Griffith OL, Pleasance ED, Fulton DL, Oveisi M, Ester M, Siddiqui AS,
Jones SJ: Assessment and integration of publicly available
SAGE, cDNA microarray, and oligonucleotide microarray
expression data for global coexpression analyses. Genomics
2005, 86:476-488.
91. Mulder NJ, Apweiler R, Attwood TK, Bairoch A, Bateman A, Binns D,
Bradley P, Bork P, Bucher P, Cerutti L, Copley R, Courcelle E, Das U,
Durbin R, Fleischmann W, Gough J, Haft D, Harte N, Hulo N, Kahn
D, Kanapin A, Krestyaninova M, Lonsdale D, Lopez R, Letunic I, Mad-
era M, Maslen J, McDowall J, Mitchell A, Nikolskaya AN,
et al.: Inter-
Pro, progress and status in 2005. Nucleic Acids Res 2005,
33:D201-205.
92. Lee I, Li Z, Marcotte EM: An improved, bias-reduced probabilis-
tic functional gene network of baker's yeast, Saccharomyces
cerevisiae . PLoS ONE 2007, 2:e988.
93. Harris MA, Clark J, Ireland A, Lomax J, Ashburner M, Foulger R, Eil-
beck K, Lewis S, Marshall B, Mungall C, Richter J, Rubin GM, Blake JA,
Bult C, Dolan M, Drabkin H, Eppig JT, Hill DP, Ni L, Ringwald M,
Balakrishnan R, Cherry JM, Christie KR, Costanzo MC, Dwight SS,
Engel S, Fisk DG, Hirschman JE, Hong EL, Nash RS, et al.: The Gene
Ontology (GO) database and informatics resource. Nucleic
Acids Res 2004, 32:D258-261.