Báo cáo y học: " Many LINE1 elements contribute to the transcriptome of human somatic cells" pptx
Bạn đang xem bản rút gọn của tài liệu. Xem và tải ngay bản đầy đủ của tài liệu tại đây (358.09 KB, 18 trang )
Genome Biology 2009, 10:R100
Open Access
2009Rangwalaet al.Volume 10, Issue 9, Article R100
Research
Many LINE1 elements contribute to the transcriptome of human
somatic cells
Sanjida H Rangwala, Lili Zhang and Haig H Kazazian Jr
Address: Department of Genetics, University of Pennsylvania School of Medicine, Hamilton Walk, Philadelphia, Pennsylvania 19104, USA.
Correspondence: Haig H Kazazian. Email:
© 2009 Rangwala et al.; licensee BioMed Central Ltd.
This is an open access article distributed under the terms of the Creative Commons Attribution License ( which
permits unrestricted use, distribution, and reproduction in any medium, provided the original work is properly cited.
Human LINE1 elements<p>Over 600 LINE 1 elements are shown to be transcribed in humans; 400 of these are full-length elements in the reference genome.</p>
Abstract
Background: While LINE1 (L1) retroelements comprise nearly 20% of the human genome, the
majority are thought to have been rendered transcriptionally inactive, due to either mutation or
epigenetic suppression. How many L1 elements 'escape' these forms of repression and contribute
to the transcriptome of human somatic cells? We have cloned out expressed sequence tags
corresponding to the 5' and 3' flanks of L1 elements in order to characterize the population of
elements that are being actively transcribed. We also examined expression of a select number of
elements in different individuals.
Results: We isolated expressed sequence tags from human lymphoblastoid cell lines
corresponding to 692 distinct L1 element sites, including 410 full-length elements. Four of the
expression tagged sites corresponding to full-length elements from the human specific L1Hs
subfamily were examined in European-American individuals and found to be differentially expressed
in different family members.
Conclusions: A large number of different L1 element sites are expressed in human somatic
tissues, and this expression varies among different individuals. Paradoxically, few elements were
tagged at high frequency, indicating that the majority of expressed L1s are transcribed at low levels.
Based on our preliminary expression studies of a limited number of elements in a single family, we
predict a significant degree of inter-individual transcript-level polymorphism in this class of
sequence.
Background
The human genome is littered with retrotransposons: roughly
20% of genome sequence is derived from LINE1 (L1) ele-
ments. Autonomous L1s are approximately 6,000 bp in size
and encode two open reading frames (ORFs): ORF1, an RNA-
binding protein that functions as a nucleic acid chaperone [1],
and ORF2, a reverse transcriptase [2] and endonuclease [3].
Both of these proteins are critical for retrotransposition [4].
There are approximately 7,000 full-length elements in the
human reference genome, 304 of which belong to the most
recently evolved L1Hs subfamily [5,6].
Full-length human L1 elements contain a conserved 5'
untranslated region (UTR) of approximately 900 bp that car-
ries an internal RNA polymerase II promoter [7]. Binding
sites for RUNX3 [8], SRY [9] and YYI [10,11] within the first
Published: 22 September 2009
Genome Biology 2009, 10:R100 (doi:10.1186/gb-2009-10-9-r100)
Received: 20 May 2009
Revised: 21 August 2009
Accepted: 22 September 2009
The electronic version of this article is the complete one and can be
found online at /> Genome Biology 2009, Volume 10, Issue 9, Article R100 Rangwala et al. R100.2
Genome Biology 2009, 10:R100
few hundred base pairs of this UTR are important for optimal
expression of the transcript. In addition, YY1 activity pro-
motes transcriptional initiation from the start of the element
[10], although Lavie et al. [12] found that transcripts could
also initiate upstream or downstream depending on the con-
text of upstream non-L1 sequence. L1s propagate through
reverse transcription of this primary transcript and integra-
tion into the genome [13,14]. This process is inefficient, so
that the majority of product is 5' truncated, containing only a
3' portion of the element [15]. The human genome contains
on the order of 500,000 non-autonomous, truncated ele-
ments [6].
While older and truncated elements have lost the ability to
retrotranspose, at least some of the more evolutionarily
recent elements are active, as evidenced by the high number
(approximately 500) of polymorphic insertion sites found in
human populations (compiled in [16]), many of which have
contributed to the etiology of human diseases (reviewed in
[17,18]). At least 40 of the human-specific subfamily L1 ele-
ments in the haploid reference genome were found to be com-
petent for retrotransposition in a cell culture assay [19]. L1s
that can no longer mobilize themselves may also be signifi-
cant. L1s are also responsible for the trans-mobilization of
non-autonomous sequences such as Alus, SVAs, and even cel-
lular RNAs to produce processed pseudogenes [20]. Trans-
mobilization may not require active ORF1 [21] and so might
be carried out by a partially degenerate, yet transcribed, L1.
Elements that have lost function for both ORF1 and ORF2
may still contribute promoter and polyadenylation sites that
can interfere with the transcriptional regulation of a genomic
region [22,23]. For instance, transcription through an older
element on human chromosome 10 appears to be involved in
the formation of a neocentromere [24]. L1s also might be
important in recruiting DNA methylation and heterochroma-
tin formation on the inactive X chromosome [25]. In plants,
the presence of transcription through a retrotransposon
results in altered regulation of neighboring genes [26].
L1s in somatic tissues have been thought to be mainly quies-
cent: neither transcribed nor retrotransposing, rendered
silent by cytosine methylation [27-30] and histone modifica-
tion [31]. Those L1s that are expressed are often prematurely
aborted through internal splicing or polyadenylation [32,33].
Yet, growing evidence questions the assumption that all L1s
are suppressed: L1s may in fact be both transcribed and
mobile, not just in the germline [34-36], but also in the early
embryo [37], and in certain other tissues [38-40]. It is unclear
how many of the thousands of L1 promoters in the genome
are active, as sequences derived from repetitive DNA are typ-
ically excluded from most genome-wide transcriptome analy-
ses (see [41] for a recent exception).
We were interested in the number and nature of L1 elements
that contribute to the transcriptome of human somatic cells.
Because the human genome contains over 100,000
sequences that are nearly identical in sequence, it is often
impossible to identify the particular insertion site from
amplicons located within the element. Flanking sequence, in
some cases only a few bases, is necessary in order to deter-
mine the genomic location of an element. We have used vari-
ations on 3' and 5' rapid amplification of cDNA ends (RACE)
in order to trap flanking sequence tags specifically from
expressed human L1 elements. Below, we describe our
results, which have revealed 692 distinct loci, 410 of which
correspond to full-length retroelements in the human refer-
ence genome.
Results
Isolation and characterization of L1 expression tags
from lymphoblastoid cell lines of humans
Isolation of 3' expression tags derived from particular transcribed L1
loci
While L1s carry adequate information for transcriptional ter-
mination and polyadenylation [42], the polyadenylation site
is non-canonical, so that L1 transcripts often do not end
exactly at the end of the element [43]. This is manifest in the
number of L1 elements carrying 3' transduced sequence from
their progenitor locus: about 10% of all retrotransposition
events [44-47]. We predicted that a small proportion of all
transcripts from expressed L1s would carry non-L1 sequence
resulting from read-through of the transcript into the flank-
ing genomic region. These sequences could then be used to
identify the genomic location of the element. In some cases,
the terminal few bases of the L1 3' UTR might be sufficient in
themselves to locate the element uniquely in the human ref-
erence genome.
We primed first strand synthesis of cDNA using oligo(dT),
followed by second strand synthesis with an oligonucleotide
located at the end of the 3' UTR of the L1 (Figure 1a). Due to
the LINE1-associated poly(A) tract, 3' end sequence ampli-
cons tend to be of low complexity (Figure 1b). We have been
unsuccessful in obtaining adequate sequence quality and
length from these amplicons using next generation sequenc-
ing methodologies; below, we describe our results using man-
ually curated sequence reads that were generated by the
Sanger method.
We obtained 3' end transcript sequence from 2,152 cDNA
clones from lymphoblastoid cell lines from a single Euro-
pean-American individual, GM10861, from the Centre
d'Etude du Polymorphisme Humain (CEPH) population
(Table 1). Nearly half of these expressed sequence tags had
been primed from the polyadenylation site immediately
downstream of the L1, and therefore aligned to multiple iden-
tical L1 3' UTR locations in the genome. However, 1,148
expression tags were unique in the reference genome; these
represented 204 distinct sites, 54 of which corresponded to
full-length L1 elements. Thirty-eight L1 expression tag clus-
Genome Biology 2009, Volume 10, Issue 9, Article R100 Rangwala et al. R100.3
Genome Biology 2009, 10:R100
ters could not be mapped adjacent to an L1 in the reference
genome.
Expression tags were typically short (Figure 1b, c; Additional
data file 1), with a mean end position of 34 nucleotides from
the end of the L1 (median = 30.5 nucleotides). Seventy-five
percent (152) of tagged sites terminated transcription less
than 40 nucleotides from the end of the L1, and 93% (190) ter-
minated less than 60 nucleotides from the L1 (Figure 1c). The
distribution of polyadenylation positions for expression tags
corresponding only to full-length elements was similar (mean
= 35 nucleotides; median = 29 nucleotides; 81% located less
than 40 nucleotides from the L1). Many of these short trans-
ductions represent non-canonical L1 3' ends or atypical poly-
adenylation cleavage sites, rather than the use of novel
polyadenylation signals downstream of the L1 itself.
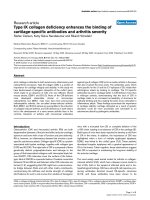
Description of data collection method and overview of resultsFigure 1
Description of data collection method and overview of results. (a) Diagram of expression tag capture. L1 elements are often naturally transcribed with
non-L1 sequences at the 5' and/or 3' end. A 3' RACE adaptor/oligo(dT) primer and L1 specific primer can be used to capture expressed sequence from the
3' end. Similarly, a 5' RACE adaptor and L1 specific primer can capture 5' start sites that occur in non-L1 sequence. PCR is subsequently used to amplify
the signal from the expressed tags. (b) Examples of 3' expression tags. Sequences start at the end of the L1 and terminate in 12 adenosines derived from
the 3' RACE adaptor. (c) Histogram depicting the distribution of polyadenylation positions of 3' expression tags, relative to the end of the L1. (d)
Histogram depicting distribution of 5' start site positions upstream of the 5' end of full-length L1 elements. Negative start sites occur in the 5' UTR
downstream of the consensus 5' end of the element. Nt, nucleotides.
Unique flank
Ol i go ( dT) + adaptor
L1 prim er
Transcription
(in cell)
LI NE1
Gen om ic DNA
poly ( A )
5’ RACE ad a p t o r
L1 prim er
5’ expression t ag s
3’ expression t ags
(a)
(b)
5 ’ TATGATTAAAAAAAAAAAGTACTGTAACCAAAAAAAAAAAA
5 ’ TATAATAAAAAAAATAAAAAATAAAAAACAACTCTCAGAAGCAAAAAAAAAAAA
5 ’ TATAATAAAAAAAAAAGAAGCCAAAAAAAAAAAA
5 ’ TATAATAAAAAAAAAAAATTAAAAAAATAAAAAAAAACATATACCTATTGAAGGAAAAAAAAAAAA
5 ’ TAAAATAATAAAAAAGAAATGAAATATGAAATAAAAAAAAAAAA
LI NE1
poly ( A)
(c)
0
10
20
30
40
50
60
<1
0
20-2
9
40-4
9
60-6
9
80-89
100-10
9
120-12
9
140-149
160-169
180-189
200-20
9
220-22
9
240-249
Position downstream of L1 3’ end (nt)
Number of sites
Distribution of positions of 3’ expression tag ends
(d)
Number of sites
Position upstream of start of L1 5’ end (nt)
Distribution of positions of 5’ expression tag ends
0
20
40
60
80
100
120
700 to 749
600 to649
500 to 549
400 to 449
300 to 349
200 to 249
100 to 149
0 to 49
-99 to -50
Genome Biology 2009, Volume 10, Issue 9, Article R100 Rangwala et al. R100.4
Genome Biology 2009, 10:R100
Thirty-seven L1 elements were tagged five or more times
(Additional data file 2); these include six full-length elements,
two containing intact, putatively functional ORFs (Table 2,
4p15.32 and 7q31.1). The Chao2 ecological index, which esti-
mates the number of types based on the rate of sampling sin-
gletons and doubletons [48], predicts a total of 363 expressed
sites in this individual. As over half of the 204 sites we identi-
fied are represented by only one or two expression tags, it is
likely that increased sequencing will yield few significantly
expressed new sites.
We have also obtained 3' sequence tags from five additional
individuals: GM17032 and GM17033 are African-Americans,
GM17045 is of Middle Eastern origin, and GM11994 and
GM11995 are European-American individuals who are the
parents of GM10861 described above. In total, 3,828 3'
expression tags were sequenced from all six individuals
(Table 1; Additional data files 1, 2 and 3), encompassing 1,592
sequences corresponding to 271 unique sites. Of these sites,
228 corresponded to an L1 element in the reference genome.
The remaining 43 clusters, while containing L1 3' UTR
sequence at one end, do not map to any of the reference L1s,
and, therefore, may represent private or polymorphic inser-
tions. Due to the extremely short, homopolymeric nature of
these tags, we cannot map the putative location of these 43
clusters in the reference genome or design PCR oligonucle-
otides to verify their presence in genomic DNA.
Forty-seven L1 sites were sampled five or more times, while
26 were sampled ten or more times. These relatively highly
expressed sites include ten full-length elements (Additional
data file 1). Expression tags corresponding to different ele-
ments were cloned from different lines, and no elements were
cloned from all six lines (Additional data file 3). We focused
our interest on full-length elements, which might be tran-
scribed from the native promoter in the 5' UTR and could
potentially produce active ORF1 and/or ORF2 protein. Sixty-
nine full-length elements in the human reference genome
were identified in our 3' expression tag analysis (Table 2),
which is significantly greater than the proportion of full-
length elements in the reference genome from the Pa7 family
or younger (Fisher's exact test P = 1.0 × 10
-15
). Of the full-
length elements tagged, more are from the human specific
subfamily (30) than their proportions in the genome (Fisher's
exact test P = 7.8 × 10
-21
); however, this is not surprising
because the primers that were used contained a nucleotide at
the 3' end that biased amplification towards the L1Hs human
specific subfamily.
Of the 69 expressed full-length elements, 30 are present in
genes (Table 2), which is somewhat more than expected from
the proportions in the genome (Fisher's exact test P =
0.0013). Of the elements present within genes, slightly more
than would be expected by their distribution in the genome
are in the same orientation as the gene (Fisher's exact test P =
0.0026; L1Hs only, Fisher's exact test P = 0.017; Table 2).
This is in keeping with the possibility that some of these L1s
may be expressed as a side effect of transcription of the host
gene.
Seven expressed full-length elements contain intact ORF1
and ORF2 and might be competent for retrotransposition
under certain conditions. Four additional elements contain
potentially active ORF2 in the absence of ORF1 (Table 2). The
proportions of expression tagged elements from the L1Hs
subfamily containing intact ORF1, ORF2, both or neither are
not significantly different from those present in the genome
as a whole (χ
2
= 2.36, degrees of freedom = 3, P = 0.5).
Isolation of 5' expression tags that identify transcriptional start sites
of transcribed L1 elements
To supplement our 3' end analysis, we also conducted L1 5'
RACE on RNA from lymphoblastoid cell lines corresponding
to a single European-American individual, GM11994, the
father of GM10861 described above. Expression tags obtained
using 5' RACE identify L1 transcription start sites, either from
the native L1 promoter or from an upstream promoter (Figure
1a). As the 5' end of a full-length L1 is not homopolymeric, we
were able to obtain high quality reads using high-throughput
454 pyrosequencing. We recovered 36,088 sequences, of
which 14,488 corresponded to 427 locations in the reference
genome (Table 1; Additional data file 4). The Chao2 index
predicts 494 sites in total; therefore, these loci include the
majority of the expressed sites within this particular individ-
ual, and likely include all the highly expressed sites.
Only six of the full-length 5' RACE expression-tagged L1 ele-
ments were also found by 3' expression tagging (Table 2). This
Table 1
Summary of sequencing analysis of 3' and 5' L1 expression tags
Cell line Amplicons sequenced Expression tags to
unique sites
Tagged sites Sites not associated
with a reference L1
Tagged full-length L1
elements
3' RACE: GM10861 2,152 1,148 204 38 54
3' RACE: total 3,828 1,592 271 43 69
5' RACE: GM11994 36,088 14,488 427 4 347
Total 39,916 16,080 692 47 410
Genome Biology 2009, Volume 10, Issue 9, Article R100 Rangwala et al. R100.5
Genome Biology 2009, 10:R100
Table 2
Full-length L1 elements identified by 3' expression tag analysis
Chromosome
band
Sub-family Genome
coordinates
(hg18)
ORF1, ORF2 Tag count In intron of
gene, +/-
dbRIP ID [16] Identified by 5'
expression tag,
count
1p21.1 L1HS chr1:105187979-
105194009
-, - 1 No
1q25.2 L1PA2 chr1:177073306-
177079473
-, - 3 No
1q44 L1PA3 chr1:246757382-
246763965
-, - 2 No Yes, 3
1p31.1 L1PA2 chr1:83588685-
83594736
-, - 1 No
1p22.3 L1HS chr1:86917352-
86923382
Yes, Yes 1 No
2q23.1 L1HS chr2:148662785-
148668812
Yes, - 1 Yes, +
2p24.3 L1HS chr2:16638475-
16644507
Yes, Yes 1 Yes, +
2q31.1 L1HS chr2:169813380-
169819412
Yes, - 4 Yes, -
2q31.3 L1HS chr2:181406634-
181412661
-, Yes 3 No
2q34 L1HS chr2:214140201-
214146231
Yes, - 5 Yes, -
2q37.1 L1HS chr2:232722151-
232728183
-, - 1 Yes, - Yes, 1
2p16.2 L1PA3 chr2:53667675-
53673685
Yes, - 1 No*
2p13.3 L1HS chr2:71492113-
71498139
Yes, - 2 Yes, -
3q12.2 L1PA3 chr3:101711142-
101717175
-, - 1 Yes, +
3q13.32 L1PA2 chr3:120115781-
120121808
-, - 1 Yes, -
3q13.33 L1PA2 chr3:123243449-
123249475
Yes, - 4 No
3p24.3 L1PA3 chr3:18992446-
18998582
-, - 1 No*
3p24.3 L1PA3 chr3:23365739-
23371880
Yes, - 1 Yes, + Yes, 71
4q27 L1HS chr4:121089330-
121095361
Yes, - 2 No*
4q31.22 L1HS chr4:145977329-
145983590
-, - 1 No
4p15.32 L1HS chr4:15452268-
15458293
Yes, Yes
†
349 Yes, +
4q13.1 L1PA2 chr4:64080835-
64086866
-, - 6 No Yes, 30
4q23 L1HS chr4:99732610-
99738637
Yes, - 1 Yes, +
5q23.2 L1PA3 chr5:126253878-
126259924
Yes, - 4 Yes, +
5q34 L1PA6 chr5:162571721-
162577711
-, - 3 No*
5q35.3 L1PA2 chr5:180262128-
180268143
Yes, - 2 Yes, -
5p13.3 L1HS chr5:34183708-
34189893
Yes, - 1 No Druze54
Genome Biology 2009, Volume 10, Issue 9, Article R100 Rangwala et al. R100.6
Genome Biology 2009, 10:R100
5q14.1 L1PA3 chr5:77910921-
77916574
-, - 1 Yes, +
6q22.31 L1PA5 chr6:125758770-
125765089
-, - 1 No
6p22.2 L1HS chr6:24919886-
24925913
Yes, Yes 1 Yes, + AL512428|
Database 29
‡
6q13 L1HS chr6:70776961-
70783165
Yes, - 17 Yes, + L1HS169
6q14.3 L1HS chr6:86765484-
86771510
Yes, - 2 No chr6-8676
6q15 L1PA3 chr6:88089716-
88095715
-, - 1 Yes, -+
7q31.1 L1HS chr7:110670808-
110676838
Yes, Yes 5 Yes, +
‡
7q31.1 L1HS chr7:113203414-
113209443
Yes, Yes 13 No
‡
7q36.1 L1PA5 chr7:149925116-
149930649
-, - 17 No
7p14.3 L1PA2 chr7:32703791-
32709682
-, - 2 No*
7p12.1 L1PA2 chr7:50934034-
50940065
Yes, - 1 No*
8p21.2 L1PA2 chr8:26309046-
26315012
Yes, - 12 Yes, +
8q21.13 L1PA2 chr8:84521933-
84527959
Yes, - 4 No
8q22.1 L1PA2 chr8:96633637-
96639669
Yes, - 2 No*
9q31.3 L1HS chr9:112593199-
112599230
Yes, - 2 Yes, +
9q21.11 L1PA2 chr9:71281844-
71287865
-, - 1 Yes, -
9q22.32 L1HS chr9:95915639-
95921668
Yes, - 2 No
10q26.12 L1PA3 chr10:122660462-
122666485
-, - 2 No Yes, 10
10p15.1 L1HS chr10:6451604-
6457635
-, Yes 2 No L1HS171|
Database 45
11q22.3 L1HS chr11:108553432-
108559463
Yes, Yes 1 No Yes, 1
11p15.4 L1PA2 chr11:7635956-
7641978
-, - 19 No
12q23.3 L1PA2 chr12:105389774-
105395799
Yes
†
, - 1 Yes, -
12q24.32 L1PA3 chr12:126916354-
126922380
-, - 3 No
12q13.13 L1HS chr12:50242683-
50248708
Yes, - 2 No
12q21.1 L1PA2 chr12:72074857-
72080877
-, - 2 No
12q23.1 L1PA2 chr12:95233852-
95239880
-, - 5 Yes, -
13q12.3 L1HS chr13:30774452-
30780482
Yes, - 1 Yes, +
13q13.3 L1PA3 chr13:36722478-
36728518
-, - 2 No
13q14.2 L1HS chr13:47937693-
47943703
-, - 6 Yes, +
Table 2 (Continued)
Full-length L1 elements identified by 3' expression tag analysis
Genome Biology 2009, Volume 10, Issue 9, Article R100 Rangwala et al. R100.7
Genome Biology 2009, 10:R100
lack of overlap is instructive, though not entirely surprising,
as 3' tags would include both full-length and 5' truncated ele-
ments, the latter being the most common in the genome. In
contrast, 5' RACE is biased towards full-length elements, as
relatively few L1s are 3' truncated. Moreover, the oligonucle-
otide used to prime 3' amplification contained a nucleotide
change that biased it towards amplification of the L1Hs sub-
family, whereas the 5' RACE primer was unbiased and would
identify all L1 5' UTR-derived sequence.
We identified 347 sites corresponding to full-length
expressed elements by 5' RACE analysis, 89 of which were
sampled 10 or more times (Additional data file 4). Of the
remaining expressed sites, 76 corresponded to deleted or
degenerated 3' truncated elements from the L1P1, L1P2 and
L1P3 subfamilies (Additional data file 4, grey font). Four
tagged sites did not correspond to an L1 element in the refer-
ence genome (Additional data file 4, blue font). We were able
to verify by PCR that one of these four sites, which mapped to
chr12: 33908761, identifies a non-reference L1 present in the
GM10861/GM11994/GM11995 familial trio. The precise
insertion breakpoint of this L1 was determined by sequencing
of the PCR verification product (Additional data files 4 and 5).
L1 5' start sites mapped by 5' RACE can be subdivided into
three groups: those that are located in the upstream flanking
sequence, those that are internal to the element, and those
that splice from far upstream. Four expression tags indicated
usage of a promoter far upstream (>15 kb) that produced a
transcript that spliced immediately adjacent to a full-length
L1 (Additional data file 4, green font). Of the start sites map-
ping internally or within 1,000 bp upstream of a full-length
L1, 50% (170) were located within ± 50 nucleotides of the con-
sensus start of the L1 (Figure 1d), with the median start site at
position -21 relative to the L1. These relatively close, though
variant, start sites are typical of usage of the native L1 pro-
moter [12]. However, 124 5' expression tags to full-length ele-
ments begin greater than 100 nucleotides upstream of the L1
(Figure 1d), suggesting that a proportion of L1 transcripts
from certain loci might also originate from upstream flanking
promoters.
Of the full-length elements identified, 24 are from the L1Hs
human-specific subfamily, which is not significantly greater
than what would be expected based upon the proportions
found in the genome (Fisher's exact test P = 0.26; Table 3).
However, elements from the next youngest L1Pa2 (Fisher's
exact test P = 9.9 × 10
-13
) and L1Pa3 (Fisher's exact test P = 1.7
× 10
-10
) subfamilies are overrepresented, while the older
13q21.32 L1PA2 chr13:67152381-
67158421
-, - 4 No
14q23.1 L1PA2 chr14:59482976-
59488994
-, - 1 Yes, -
14q31.1 L1PA3 chr14:79303855-
79309939
-, - 1 Yes, +
16q22.1 L1HS chr16:67174881-
67180909
Yes, - 1 No
20p11.21 L1HS chr20:23354746-
23360777
Yes, - 2 No*
20q13.2 L1PA2 chr20:51553798-
51559820
-, - 1 No*
22q11.22 L1PA3 chr22:20,961,183-
20,967,196
-, - 1 Yes, -
22q12.1 L1HS chr22:27389272-
27395303
Yes, Yes 2 No* L1HS86|
AL121825
‡
Xq26.1 L1PA2 chrX:129920587-
129926612
Yes, - 2 No
Xq27.2 L1HS chrX:141393302-
141399320
Yes, Yes 2 No AL031586
Xp21.3 L1PA2 chrX:28134830-
28140827
-, Yes 1 No
Xp11.22 L1PA2 chrX:49711541-
49717572
Yes, - 1 Yes, +
Xq13.2 L1PA4 chrX:73611039-
73617191
-, - 1 Yes, -
*Spliced ESTs span L1.
†
Truncated 96 amino acids from carboxyl terminus.
‡
Active (>1% L1RP) in cell culture assay [19].
Table 2 (Continued)
Full-length L1 elements identified by 3' expression tag analysis
Genome Biology 2009, Volume 10, Issue 9, Article R100 Rangwala et al. R100.8
Genome Biology 2009, 10:R100
L1Pa5 (Fisher's exact test P = 2.6 × 10
-5
) and L1Pa6 (Fisher's
exact test P = 5.6 × 10
-15
) elements are underrepresented. This
is consistent with the hypothesis that more evolutionarily
recent elements are more likely to have retained sequences
that would be permissible for transcription. Of the 24 full-
length L1Hs elements, eight contain intact ORF1 and ORF2,
two contain an intact ORF2 only, and nine contain an intact
ORF1 only (Table 3). Relative to the proportions in the
genome, the distribution of elements containing intact ORFs
is not significant (χ
2
= 0.7, degrees of freedom = 3, P = 0.9).
Further characterization of selected expression-tagged
L1 elements indicates inter-individual differences in
transcript levels
The L1 at 4p15.32 is the progenitor of transduced daughter
elements
We have characterized the nature of transcription from four
full-length elements identified by 3' expression tags. The
most frequent 3' expression tag (Table 2; Additional data file
1) we identified corresponds to an element from the L1Hs
subfamily located on band 4p15.32 at coordinates
chr4:15452168-15458393 (Figure 2a). We isolated 263
sequence tags from this element from lymphoblastoid cells of
GM10861 (Additional data file 2), corresponding to 24% of all
mapped tags from that individual. An additional 86 tags to
this element were isolated from four more individuals (par-
ents GM11994 and GM11995, and the unrelated individuals
GM17032 and GM17033; Additional data file 3), indicating
that the element at 4p15.32 is highly expressed in lymphob-
lastoid cell lines. A previous study found that the 4p15.32 ele-
ment is nearly fixed in four human populations
(heterozygosity ≤ 0.05) [49].
The majority of expression tags to this locus end 42 nucle-
otides downstream of the element (Figure 2b, chr4 short tag),
just upstream of a polyadenylation stretch in the genomic
DNA. However, two expression tags extend to 182 nucleotides
downstream (Figure 2b, chr4 long tag), suggesting that at
least some of the transcripts might continue further into the
flanking DNA. Directed 3' RACE using a primer located just
downstream of the L1 amplified a single product terminating
at this same position in both individuals GM11994 and
GM11995 [dbEST:64858885]. These 182 nucleotides are also
found downstream of another 5' truncated L1 located at chr6:
Table 3
Full-length L1Hs subfamily elements identified through 5' expression tag analysis
Chromosome band Genome coordinates (hg18) ORF1, ORF2 dbRIP ID [16] Position of 5' tag start
relative L1 5; end (nt)
Tag count
1q31.3 chr1:194455124-194461155 Yes, - -380 3
2q12.1 chr2: 102549247-102555276 Yes, Yes -1 1
2q24.1 chr2:158131112-158137135 -, - -77 9
2q37.1 chr2:232722151-232728183 Yes, - -456 1
3p24.3 chr3:18946979-18953016 - +42 1
3q25.32 chr3:159220160-159226187 Yes, - 0 2
4q21.21 chr4:79245914-79251943 Yes, - -2 6
5q14.1 chr5:79110459-79116517 Yes, Yes * -59 1
5q14.3 chr5:85842264-85848292 Yes, Yes -364 1
6q14.2 chr6:84100391-84106433 -, Yes -4 4
7q35 chr7:147170579-147176648 -, - -322 6
8q24.13 chr8:126664313-126670315 Yes, Yes 238261 -3 5
10q25.1 chr10:107127095-107133125 -, Yes +50 8
11q14.3 chr11:90339088-90345118 -, - +44 4
11q21 chr11:92509453-92515487 Yes, Yes -394 2
11q22.3 chr11:108553432-108559463 Yes, Yes +50 1
12q24.32 chr12:125349470-125355537 Yes, Yes * -340 5
13q12.3 chr13:29113844-29119843 Yes, Yes L1HS235| Database39 -1 1
14q12 chr14:30223767-30229794 Yes, - +67 1
14q22.1 chr14:51331070-51337100 Yes, - -392 1
15q25.2 chr15:81910561-81916590 Yes, - -7 1
16q21 chr16:64281416-64287424 Yes, - -119 2
18p11.21 chr18:13965860-13971890 -, Yes -2 4
20q13.2 chr20:53868030-53874021 Yes, - 237994 -474 2
*Highly active (>1% L1RP) in cell culture assay [19].
Genome Biology 2009, Volume 10, Issue 9, Article R100 Rangwala et al. R100.9
Genome Biology 2009, 10:R100
66316760-66318742 (Figure 2b, chr6 transduction), which
was previously described as a member of a transduction fam-
ily [47]. The chromosome 6 insertion, which is polymorphic
in different ethnic populations [49-51], is therefore likely the
descendent of the full-length element on chromosome 4.
These lines of evidence all point to at least some fraction of
the L1 transcript at 4p15.32 terminating 182 nucleotides
downstream of the element (Figure 2b, chr4 3' long tag).
The L1 at 4p15.32 contains an intact ORF1 gene; however,
ORF2 is truncated 96 amino acids early, downstream of the
known functional domains. The presence of the transduced
polymorphic descendent element on chromosome 6 suggests
that the 4p15.32 element has been active in the recent past.
Nine expression tags from two different individuals were also
isolated from a similar sequence (U35) to 4p15.32 that does
not occur in the human reference genome (Figure 2b, U35
tag; Additional data files 1 and 3). U35 may represent an allele
or an additional non-reference L1 insertion related to the ele-
ment at 4p15.32.
Inter-individual transcriptional polymorphism at 4p15.32
The L1 at 4p15.32 is located in intron 7 of the CD38 gene, in
the same orientation as the gene (Figure 2a). CD38 (cluster of
Characterization of L1 at 4p15.32Figure 2
Characterization of L1 at 4p15.32. (a) Diagram of L1 at 4p15.32 and the surrounding region. The arrow designates the L1 transcript. Blue boxes indicate
exons of the CD38 gene, with exon number designated. Oligonucleotides CD38-a and CD38-b are indicated. Unmarked triangles indicate the positions of
oligonucleotides used in L1 TaqMan qPCR assay. (b) Alignments of L1 at 4p15.32 3' end and related sequences. 'chr 4 short tag' - the major 3' expression
tag cloned from this site. 'chr4 long tag' - longer 3' expression tag and 3' RACE sequence cloned from this site. 'chr6 transduction' - paralogous, transduced
sequence downstream of L1 on chromosome 6. 'U35' - similar distinct 3' expression tag that cannot be mapped to the human reference genome. 3' end
target site duplications are highlighted in blue. Single nucleotide differences in the chromosome 6 sequence are highlighted in dark red. (c) Diagram of the
pedigree of the CEPH/UTAH individuals used in this study. (d) Relative expression of the L1 at 4p15.32 in lymphoblastoid cell lines from CEPH individuals.
Expression is in arbitrary units normalized to HPRT1. Error bars indicate ± standard deviation from three replicates. (e) Expression of CEPH individuals of
the L1 at 4p15.32 compared to flanking exons of CD38, normalized to HPRT1. Expression is plotted on a logarithmic scale so that levels for both
amplicons can be clearly visualized. Error bars represent ± standard deviations from three replicates. All data are representative of at least two biological
replicates.
CD38
L1 Hs chr4:15452168-15458393
CD38-a
67
8
CD38-b
994bp
905bp
(a)
(b)
chr4 short tag TATAATAAAAAAAATAAA AAATAAAAAACAACTCTCAGAAGC
U35 tag TATAATAAAAAAAATAAATAAATAAATAAAAAATAAAATAAAAAACAACTCTCAGAAGC
chr4 long tag TATAATAAAAAAAATAAA AAATAAAAAACAACTCTCAGAAGCAAAAAAAAAAAAAAAAAAAAAAAA
AAAAGCAATCTTGCAG
chr6 transduction TATAATAAAAAAAAAAAT AAATAAAAAACAACTCTCAGAAGCAAAAAAAAAAAAAAAAA GCAATCTTGCAG
chr4
ATATCTGACGAGTCTAAGCTGTTCAAAGATATGTTGCATGGAGAAAATAGAATAGTAGAAACCTAGACAAAGACTGGGAAATAAAGATGGTCTTATCCCC
chr6
ATATCTGACCAGTCTAAGCTGTTCAAAGATATGTTGCATGGAGAAAATAGAATAGTAGAAACCTAGACAAAGACTGGGAAATAAAGATGGTCTTATCCCC(A) AAAGATATAGTA
39
(e)
(d)
(c)
1199311992
10860
CEPH/Utah 1352
1199511994
10861
0
1
2
3
4
5
6
7
Relative Expression of L1 at 4p15.32
Relative Fold Change (normalized to HPRT1)
L1 at 4p15.32
10861
10860
11992
11993
11994
0.00001
0.0001
0.001
0.01
0.1
1
10
10861
11994
10860
11992
11993
Expression of L1 at 4p15.32 compared to CD38
L1
CD38
Expression normalized to HPRT1
Genome Biology 2009, Volume 10, Issue 9, Article R100 Rangwala et al. R100.10
Genome Biology 2009, 10:R100
differentiation 38) is a cell-surface glycoprotein involved in
lymphocyte cell adhesion and signaling [52]. We examined
steady-state RNA levels of the L1 at 4p15.32 in CEPH familial
lymphoblastoid cell lines using a TaqMan quantitative RT-
PCR assay specific for the L1 transcript (Figure 2c). Note that
expression tags were cloned at high frequency from both
GM10861 and GM11994 (Additional data files 1, 2 and 3).
There are significant differences in expression among the dif-
ferent individuals, with GM11992 showing little to no expres-
sion (Figure 2d), and individual GM10861 showing relatively
high expression. We compared the expression of the L1 ele-
ment to that of the surrounding CD38 gene. We found that,
while the abundance of the CD38 transcript is several orders
of magnitude higher, the pattern of expression of the L1 ele-
ment follows that of expression of the gene (Figure 2e).
Characterization of the L1 transcript at 13q14.2
We also examined three full-length elements that were repre-
sented less frequently by 3' expression tags. The L1 element
on chromosome band 13q14.2, located at coordinates
chr13:47937193-47943803, was represented by six expres-
sion tags total cloned from each member of the GM11994/
GM11995/GM10861 familial trio (Table 2; Additional data
files 2 and 3). The 3' end tags terminate 20 nucleotides down-
stream of the end of the element, within a poly(A) rich region
(Figure 3a). The associated L1, while classified in the human-
Characterization of L1 at 13q14.2Figure 3
Characterization of L1 at 13q14.2. (a) Diagram of L1 at 13q14.2 and the surrounding region. The arrow designates the L1 transcript. Triangles at F and R
indicate positions of oligonucleotides 13q14.2F and 13q14.2R. Blue boxes indicate exons of the RB1 gene, with exon number designated. Oligonucleotides
RB1-1 and RB1-2 are indicated. The sequence of the 3' expression tag is provided. (b) Relative expression of the L1 at 13q14.2 in lymphoblastoid cell lines
from CEPH individuals. Expression is in arbitrary units normalized to HPRT1. Error bars indicate ± standard deviation from three replicates. (c)
Expression of CEPH individuals of the L1 at 13q14.2 compared to flanking exons from RB1, normalized to HPRT1. Expression is plotted on a logarithmic
scale so that levels for both amplicons can be clearly visualized. Error bars represent ± standard deviations from three replicates. All data are
representative of at least two biological replicates.
RB1
L1 Hs chr13:47937193-47943803
21 22
23
5’ RACE end
161bp
1758bp
24
(a)
3’ expression tag TATAATAAAAAATATAAATT
RB1-1
RB1-2
F
R
(b)
(c)
L1
RB1
L1 at 13q14.2
Relative Fold Change (normalized to HPRT1)
10861
10860
11992
11993
11994
Relative Expression of L1 at 13q14.2
Expression normalized to HPRT1
Expression of L1 at 13q14.2 compared to RB1
0.00
1. 0 0
2.00
3.00
0.00
0.01
0.10
1.00
10.00
11992
10860
11993
10861
11994
Genome Biology 2009, Volume 10, Issue 9, Article R100 Rangwala et al. R100.11
Genome Biology 2009, 10:R100
specific L1Hs subfamily, does not contain intact ORFs and is
not expected to be competent for retrotransposition.
The 13q14.2 L1 is located inside intron 22 of the Retinoblast-
oma 1 (RB1) tumor suppressor gene [53], in the same orien-
tation (Figure 3a). 5' RACE analysis specific to this locus
amplified a single product from individual GM11994
[dbEST:64858883], designating a transcriptional start site
457 bp upstream of the start of the element that encompasses
part of intron 21 and all of exon 22 of RB1 (Figure 3a). This
position is over 161 kb downstream of the start of RB1. Real-
time RT-PCR analysis in familial cell lines indicates differen-
tial expression of the L1 amongst related individuals (Figure
3b), with individuals GM10861 and GM11994, from which
expression tags were cloned, showing relatively high expres-
sion, and individual GM11992 showing an almost complete
absence of expression. Expression of the RB1 exons flanking
the L1 correlated with expression of the L1 transcript (Figure
3c), although the RB1 gene was expressed overall at a higher
level (approximately 20 to 50 times more abundant).
L1s are typically cytosine methylated, a modification that is
associated with suppression of expression (for example,
[29]). We hypothesized that methylation might be lost in
expressed elements; therefore, we examined cytosine methyl-
ation, both at the start of transcription of the L1 and within
the L1 5' UTR, in two cell lines (GM10860 and GM11992; Fig-
ure 3b) that showed stark differences in expression levels. In
Characterization of L1 at 6p22.2Figure 4
Characterization of L1 at 6p22.2. (a) Diagram of L1 at 6p22.2 and the surrounding region. The arrow designates the L1 transcript. Triangles at F and R
indicate positions of oligonucleotides 6p22F and 6p22R. Blue boxes indicate exons of the FAM65B gene, with exon number designated. Oligonucleotides
FAM65B-1 and FAM65B-2 are indicated. The sequence of the 3' expression tag is provided. (b) Expression of CEPH individuals GM10861 and GM11994 of
the L1 at 6P22.2 compared to flanking exons from FAM65B, normalized to HPRT1. Expression is plotted on a logarithmic scale so that levels for both
amplicons can be clearly visualized. Error bars represent ± standard deviations from three replicates. Data are representative of two experimental
replicates.
FAM65B
21
22
808bp
1840bp
L1 Hs chr6:24919786-24926013
FAM65B-1
FAM65B-2
F
R
(a)
3’ expression tag TATAATAAAAAAAAAAAAAAGAAAAAAAAAAAAAAAAAAGTACTAAACGAA
TGGGAACTCCTGACATGGATGTTTCCCTTTCAATGGCAAGATGTAATGTTTGACCTACTTTCATCAC
L1
FAM65B
(b)
Expression of L1 at 6p22.3 and FAM65B
0.001
0.01
0.1
1
10861
11994
Ex
pression normalized to HPRT1
Genome Biology 2009, Volume 10, Issue 9, Article R100 Rangwala et al. R100.12
Genome Biology 2009, 10:R100
both cases, the sequences were densely methylated (see Mate-
rials and methods), indicating a lack of an obvious role for
cytosine methylation in quantitative expression differences at
this site.
Characterization of the L1 transcript at 6p22.2
The L1Hs element at 6p22.2, genome coordinates
chr6:24919786-24926013, was represented by a single 3'
expression tag from individual GM17032 (Table 2; Additional
data file 3). However, this element had been previously found
to be one of the most retrotranspositionally active in a cell cul-
ture assay, as well as polymorphic in natural populations
[19,54]. As expected from an element that is known to be
active, both ORFs are intact. The 3' expression tag terminates
119 nucleotides downstream of the element (Figure 4a). 3'
RACE analysis in two unrelated individuals (GM11994 and
Characterization of L1 at 1p22.3Figure 5
Characterization of L1 at 1p22.3. (a) Diagram of L1 at 1p22.3 and the surrounding region. The arrow designates the L1 transcript. Triangles at F and R
indicate positions of oligonucleotides 1p22.3F and 1p22.3R. Blue boxes indicate exons of nearest genes SH3GLB1 and CLCA, with exon number designated.
The sequence of the 3' expression tag is provided. (b) Relative expression of the L1 at 1p22.3 in lymphoblastoid cell lines from CEPH individuals.
Expression is in arbitrary units normalized to HPRT1. Error bars indicate ± standard deviation from three replicates. All data are representative of at least
two biological replicates. (c) Bisulfite sequencing of amplicon surrounding the start of transcription of the L1 at 1p22.3 in GM10860, GM11992 and
GM11993. Each circle represents a single CpG, while each row is an individual sequence clone. The position of the start of transcription as determined by
5' RACE is indicated. Filled circles indicate lack of bisulfite conversion - that is, cytosine methylation. Grey circles indicate residues that could not be
assigned due to sequence polymorphism or poor sequence quality. The CpG at position -120 is unmethylated in the majority of clones from all three
individuals.
CLCA
SH3GLB1
L1 Hs chr1:86917252-86923882
23 600bp
15
5’ RACE end
1
19 000bp
methylated
un-methylated
unassigned
10860
11993
Start transcript
11992
-120
F
R
3’ expression tag GTATAATAATAAAAAAAAAATATGCTAT
(a)
(b)
(c)
0
0.5
1
1.5
2
2.5
3
3.5
10861
10860
11992
11993
Relative Fold Change (normalized to HPRT1)
11994
L1 at 1p22.3
Relative Expression of L1 at 1p22.3
1
3
Genome Biology 2009, Volume 10, Issue 9, Article R100 Rangwala et al. R100.13
Genome Biology 2009, 10:R100
GM11995) using a primer immediately next to the L1 identi-
fied a single product terminating 442 nucleotides down-
stream of the L1 [dbEST:64858886]. Therefore, the
transcript from this L1 can transduce at least 442 bp of
genomic sequence.
The L1 at 6p22.2 is located within intron 21 of the FAM65B
gene (Figure 4a), which encodes a factor involved in trophob-
last differentiation [55]. Expression of the element was con-
firmed in lymphoblastoid cell lines from individuals
GM10861 and GM11994, both of which are heterozygous for
this insertion. The element in GM10861 was expressed
greater than two-fold more than in GM11994 (Figure 4b).
Transcripts corresponding to the FAM65B gene, while more
abundant than those from the L1 (approximately 30 times),
appear to correlate with expression of the L1 in these two indi-
viduals (Figure 4b).
Characterization of the L1 transcript at 1p22.3
The L1 at 1p22.3, genomic coordinates chr1:86917252-
86923882, was identified by a single 3' expression tag cloned
from individual GM10861 (Table 2; Additional data file 2).
This element, a member of the L1Hs subfamily, encodes two
intact ORFs, and therefore might be retrotranspositionally
competent. In contrast to the three elements characterized
above, the L1 at 1p22.3 is intergenic, located 19 kb and 23.6 kb
from its nearest neighboring genes (Figure 5a).
The 3' expression tag corresponding to this locus ends 27
nucleotides downstream of the end of the L1 (Figure 5a).
Directed 5' RACE from cell line GM11994 identified a single
transcriptional start site 125 bp upstream of the element
[dbEST:64858884] (Figure 5a). The L1 transcript shows
some variant expression within lymphoblastoid lines from
two CEPH families (GM10860/GM11992/GM11993 and
GM10861/GM11994; Figure 5b). Bisulfite sequencing analy-
sis on this trio indicates differential methylation levels, with
GM11992 showing the least CpG methylation (Figure 5c).
Because this is also the individual expressing the least tran-
script, cytosine methylation does not appear to correlate with
transcriptional repression at this site.
Discussion
We have found evidence for transcription of 692 distinct L1
element sites in human lymphoblastoid cells. Of these, 410
sites correspond to full-length elements (Table 1), including
52 of the 304 human-specific subfamily (Tables 2 and 3). Of
the sixteen full-length human-specific elements that we iden-
tified carrying intact copies of both ORF1 and ORF2, only five
were represented by five or more expression tags (Tables 2
and 3). Therefore, while many L1 elements are transcribed in
somatic cells, paradoxically few are likely to be active.
The proportion of full-length elements that we identified con-
taining intact ORFs was not significantly different from their
occurrence in the genome, suggesting that transcription of
putatively functional elements is tolerated in somatic cells.
Only six of these intact L1s corresponded to those that are
known to be highly active in a cell culture assay (Tables 2 and
3) [19], suggesting that the most retrotranspositionally com-
petent elements may be suppressed in somatic cells. Alterna-
tively, the individuals that we assayed might carry less active
alleles of these previously examined elements (see [56,57] for
evidences of known allelic variation in L1s). Six expressed
full-length elements encode intact ORF2 in the absence of
ORF1 (Tables 2 and 3). These elements would not be able to
mobilize themselves in cis, but could possibly retain the abil-
ity to mobilize non-autonomous elements such as Alus in
trans [21].
A previous study examining transcription of the native pro-
moter of new L1 insertions in cell culture found that 5' tran-
script ends typically mapped within a few base pairs of the 5'
end of the element [12]. Our data suggest that the transcrip-
tion start site of endogenous, evolutionarily older elements
may also begin further away from the element. Half of the
sites identified by 5' RACE mapped within 50 nucleotides of
the start of the L1 element as indicated by sequence homol-
ogy. We also found over 100 L1 transcription start sites situ-
ated greater than 100 nucleotides upstream of the element.
These start sites might not result from action of the L1 pro-
moter at all, but instead use another promoter located coinci-
dentally in the flanking genomic vicinity of the element. This
hijacking by the L1 of an upstream promoter might be advan-
tageous for an element whose native promoter has either
degenerated through mutation or been subjected to epige-
netic silencing.
Examination of the expression of four full-length human-spe-
cific elements in members of a CEPH Utah family indicated a
high degree of variation among different individuals. This is
consistent with previous studies showing inter-individual and
inter-allelic variation in retrotransposition of different highly
active L1 elements [56,57]. A larger population study is
required to determine how widespread transcript-level varia-
tion is among different individuals and whether this variation
is genetically tractable. Some individuals, such as GM10861,
showed increased expression, while other individuals, such as
GM11992, showed little to no expression at all four loci. These
differences were not noted at the HPRT or 18S loci (data not
shown; see Materials and methods), which were evenly
expressed in all individuals. We hypothesize that there might
be a genome-wide level of regulation leading to individuals
with higher or lower numbers of expressed L1 elements. We
expect that further, more expanded studies in different
human populations will reveal a great amount of natural var-
iation in the number and location of L1s contributing to the
human transcriptome.
Transcription of L1s within genes might be expected to inter-
fere with transcription of the gene, so that genes containing
Genome Biology 2009, Volume 10, Issue 9, Article R100 Rangwala et al. R100.14
Genome Biology 2009, 10:R100
highly expressed retroelements in their introns might be rel-
atively suppressed. By contrast, we found that expression of
the L1 elements at 4p15.32, 13q14.2, and 6p22.2 closely mir-
rored the expression of surrounding spliced exons from pro-
tein-coding genes. In the case of 13q14.2, a transcription start
site was identified 457 nucleotides upstream of the L1, tens of
kilobases downstream of the start of the RB1 gene. Therefore,
it is unlikely that action of the RB1 promoter itself contributes
directly to regulation of the L1. Instead, we hypothesize that
transcription of RB1 results in the creation of a region of open
chromatin that facilitates the activity of other promoters
located within that region. Alternately, both loci might be
located in a larger, transcriptionally permissive epigenetic
domain. We note that Faulkner et al. [41] also found a posi-
tive correlation in expression between transcripts originating
in retroelements and surrounding genes.
Regardless of whether the L1 transcripts are produced
through the action of their native promoters or an upstream
promoter, the transcripts identified through 3' end tagging
terminate near the end of the L1. The short transductions that
we identified most likely use the L1-encoded polyadenylation
signal. In a few cases, longer transductions that were greater
than 50 nucleotides were seen; this is consistent with previ-
ous studies describing L1 elements carrying transductions of
their progenitor locus [44,46,47]. Where elements are located
within genes, such as the elements at 4p15.32 and 6p22.2, a
transcript originating from the gene may terminate prema-
turely by polyadenylation at the end of the L1. In this way, the
intronic L1 transcript might 'break' the expression of down-
stream exons [23]. However, as the L1-incorporating tran-
scripts described in this study are expressed at much lower
steady-state levels than the surrounding genes, it is unclear as
to what extent their termination influences the expression or
function of those genes.
Cytosine methylation is known to suppress the activity of
endogenous L1 promoters [27,29]; our examination of the
regions surrounding the start of transcription of two elements
(the L1s at 1p22.3 and 13q14.2) did not find strong evidence
for this modification modulating individual-specific expres-
sion levels. Other factors, such as histone modifications,
nucleotide polymorphisms, and trans-acting transcriptional
regulators may function at these loci as rheostats to specify
the exact levels of RNA production in different cells, tissues,
and individuals. Moreover, differences in post-transcrip-
tional regulation, for instance, through sequestration into
subcellular compartments [58,59], may further determine
which full-length, putatively functional L1s are able to
actively retrotranspose.
Our study is limited in that we are only able to detect tran-
scripts that carry unique non-L1 sequence at either the 3' or 5'
end. In addition, we have only sampled a single individual at
the 5' end and a single individual in depth at the 3' end, in a
single tissue type - transformed lymphoblastoid cell lines.
Because of these caveats, we expect that we have found a sub-
set of the transcribed element sites in different human tissues
and populations. Indeed, we note that only 42 of the 606 L1
sites that we identified were also identified by an independent
high throughput study looking for transcription start sites
mapping within transposable elements [41] (Additional data
files 1 and 4), a study very different from ours in terms of
methodology, individuals and cell types.
In addition to the major L1 sense promoter, L1s also contain
an antisense promoter in the 5' UTR that produces transcripts
of the upstream flanking region [60-62]. A recent study has
also found evidence for an additional outward-facing sense
promoter in the 3' UTR [41]. As such, explorations of sense
transcription through the L1 may reveal only the tip of the ice-
berg of the genomic transcripts incorporating and influenced
by the presence of these retroelements.
Conclusions
We have identified expressed sequence tags corresponding to
692 distinct L1 element sites in human lymphoblastoid cells,
indicating that retrotransposon-derived sequences contrib-
ute to the transcriptional output of somatic cells. 410 sites
correspond to full-length elements in the human reference
genome, of which 52 are from the most evolutionarily recent
L1Hs subfamily. Closer examination of four L1Hs subfamily
full-length elements revealed significant variation in expres-
sion levels within a single family. Therefore, many L1s are
expressed, and this expression can differ in different individ-
uals. We look forward to more in-depth investigations of L1
expression polymorphisms in human populations and the
potential influence of this variation on the function of adja-
cent genomic regions.
Materials and methods
Cell culture and nucleic acid extraction
Cell lines from the CEPH Utah pedigrees (GM10860,
GM10861, GM11992, GM11993, GM11994, GM11995) and
GM17032, GM17033 and GM17045 are all part of the
National Institute of General Medical Sciences human genetic
cell repository (Coriell Institute for Medical Research). Cells
were grown in RPMI (Life Technologies, Carlsbad, CA, USA)
supplemented with 15% fetal bovine serum (Thermo Fisher
Scientific, Waltham, MA, USA), 1% L-glutamine (Life Tech-
nologies) and 1% penicillin/streptomycin (Life Technologies)
at 37°C/5% CO
2
. Cultures were maintained at concentrations
of 0.25 to 1 × 10
6
cells/ml.
Genomic DNA was isolated using the DNeasy Tissue Kit
(QIAGEN, Valencia, CA, USA). Total RNA was isolated with
the RNeasy Mini Kit (QIAGEN). For expression tag isolation,
polyA+ RNA was isolated from total RNA using the Oligotex
Direct mRNA Mini Kit (QIAGEN). RNA aliquots destined for
Genome Biology 2009, Volume 10, Issue 9, Article R100 Rangwala et al. R100.15
Genome Biology 2009, 10:R100
cDNA synthesis were treated with DNaseI (Life Technologies,
Carlsbad, CA, USA).
Expression tag isolation
For 3' expression tag isolation, first strand cDNA was pro-
duced from polyA+ RNA using MMLV reverse transcriptase
(Ambion, Austin, TX, USA), primed with either 3' RACE
adaptor or FusionBRACE adaptor. This product was sub-
jected to two rounds of PCR (iTaq, Bio-Rad, Hercules, CA,
USA) using oligonucleotides L1HsSP1A/3' RACE outer for 40
cycles for the first round and L1HsSP3A/3' RACE inner or
FusionAL1Hs/FusionBRACE inner for 40 cycles for the sec-
ond round. First strand product was purified through a QIA-
GEN PCR Purification column prior to the second round.
Second round product was run on an agarose gel and purified
using the QIAGEN Gel Extraction Kit. Alternatively, linear
PCR (Fast Start High Fidelity, Roche, Basel, Switzerland) was
conducted for 35 cycles on the first strand cDNA using
FusionAL1Hs without a reverse primer. Resulting product
was purified through a QIAGEN PCR Purification column.
5' RACE first-strand cDNA was primed using 5' RACE adap-
tor using the First Choice RLM RACE Kit (Ambion). The 35-
cycle first round of PCR (iTaq, Bio-Rad) was conducted using
5' RACE outer and L15PUR, and the product was purified
using a QIAGEN PCR Purification column. The 40-cycle sec-
ond round of PCR (Fast Start High Fidelity, Roche) was con-
ducted on first round product using FusionAL15RACE and
FusionBRACEinner. This product was gel isolated using the
QIAGEN Gel Extraction Kit, purified a second time through a
PCR Purification column, and sent to the DNA Sequencing
Facility at the University of Pennsylvania School of Medicine
for 454 pyrosequencing (Roche) (see below).
5' and 3' RACE specific to the L1s at 4p15.32, 13q14.2, 6p22.2,
and 1p22.3 were conducted using the First Choice RLM-
RACE Kit (Ambion) according to standard protocols. Two
rounds of PCR were conducted using either iTaq (Bio-Rad) or
Fast Start High Fidelity enzyme (Roche). First round 5' RACE
used oligonucleotides L15PUR/5' RACE outer, while first
round 3' RACE used oligonucleotides L1HsSP1A/3' RACE
outer. These primer sets amplify L1 sequence indiscrimi-
nately. Second round PCRs used corresponding 5' or 3' RACE
inner primers along with element site-specific 3' RACE or 5'
RACE primers. Sequences from locus-specific 5' and 3' RACE
were deposited in dbEST [63]; accession numbers are given
in the Results section.
Refer to Additional data file 5 for all oligonucleotide
sequences.
Bisulfite analysis
Genomic DNA was treated with sodium bisulfite using the
Imprint DNA Modification Kit (Sigma-Aldrich, St. Louis,
MO, USA). Amplicons from L1s located near 13q14.2 and
1p22.3 were generated using iTaq. Oligonucleotide sequences
can be found in Additional data file 5. At least 13 clones were
sequenced from each amplicon in each individual. More than
99% of cytosines located in non-CpG contexts were con-
verted, indicating effective chemical modification.
For the 13q14.2 amplicon near the L1 transcription start site,
individuals GM10860, GM11992 and GM11993 featured
100%, 100%, and 98.5% CpG methylation, respectively. For
the 13q14.2 amplicon located in the L1 5' UTR, GM10860 and
GM11992 featured 96.7% and 97.9% CpG methylation,
respectively. GM10860, GM11992, and GM11993 featured
86.4%, 57.2%, and 81.8% CpG methylation in the vicinity of
the 1p22.3 L1 transcription start site. Figure 5c shows a visual
representation of the data for the 1p22.3 amplicon.
Cloning and sequencing
Purified PCR amplicons from expression tagging, RACE and
bisulfite analysis were cloned into PCR4. TOPO (Invitrogen)
and transformed into TOP10 cells (Invitrogen), and plated on
LB (lysogeny broth) supplemented with 50 μg/ml kanamycin
and 20 μg/ml X-gal at 37°C overnight. Single colonies were
amplified in LB plus 50 μg/ml kanamycin liquid culture, and
plasmid was isolated using the QIAGEN Plasmid Mini Kit.
Alternately, colonies were propagated in 220 μl of LB/
10%glycerol/50 μg/ml kanamycin in 96-well culture dishes
for high-throughput plasmid isolation and sequencing.
Sanger sequencing was conducted by the DNA Sequencing
Facility using the M13-forward primer located on the vector
backbone.
454 pyrosequencing
5' RACE PCR products were initially cloned and subjected to
Sanger sequencing (see above) prior to 454 pyrosequencing.
We identified 147 5' RACE amplicons representing 58 L1 sites
in the reference genome by this pilot Sanger sequencing
project. Almost all of these sites were later corroborated in the
454 pyrosequencing; as a result, we only report the 454
results in Table 1 and Additional data file 4.
Pyrosequencing was performed on a Roche/454 GS FLX
machine by the University of Pennsylvania DNA Sequencing
Facility, according to procedures recommended by the man-
ufacturer. Briefly, emulsion PCR was conducted to amplify
DNA from a single bead-bound copy to millions of copies per
bead in an emulsion of water-in-oil mixture. Beads carrying
amplified DNA were isolated from empty beads based on the
binding of biotinylated amplification primers to streptavidin.
Sequencing primer B was then annealed to the bead-bound
amplicons, resulting in sequence generation that proceeded
from the 5' RACE-identified transcription start site towards
the L1. Beads were loaded into the wells of a picotiter plate
such that the wells contain single DNA beads. The picotiter
plate was then loaded with packing and enzyme beads and
inserted into the FLX instrument and the sequencing rea-
gents were sequentially flowed over the entire plate. Pyro-
phosphate released after incorporation of a nucleotide into
Genome Biology 2009, Volume 10, Issue 9, Article R100 Rangwala et al. R100.16
Genome Biology 2009, 10:R100
the growing DNA strand by DNA polymerase was detected by
ATP sulfurylase and luciferase, with the light signal recorded
by a CCD camera from every well on the plate simultaneously
in a massively parallel fashion. More detailed methods can be
found at [64].
5' RACE PCR for individual GM11994 was run on one-quarter
of a picotiter plate, resulting in 38,602 reads; 2,514 reads did
not match sequencing primer B sequence and were discarded.
The reverse primer FusionBRACEinner (or any substring of
the reverse primer down to 5 bp) was trimmed from the ends
of the 36,088 remaining reads. Refer to Additional data file 6
for a compilation of mapped 454 sequencing reads.
Quantitative RT-PCR
Total RNA was treated with RQ1 RNase-Free DNase
(Promega, Madison, WI, USA) and cDNA synthesized using
the Applied Biosystems (Foster City, CA, USA) High-Capacity
cDNA Reverse Transcription Kit. Typically, 2 μg of total RNA
was added to a 20 μl first strand synthesis reaction.
The SYBR green method was used for most amplicons (SYBR
Green PCR master mix (2×); Applied Biosystems), in con-
junction with oligonucleotide pairs F/R as indicated (Figures
2, 3, 4 and 5; Additional data file 5). The exception was the L1
at 4p15.32, which was assayed with the TaqMan method
(TaqMan Gene Expression master mix, Applied Biosystems)
using the oligonucleotide pair 4p15.32R/L1HsSP1A and the
antisense strand 4p15.32 TaqMan probe (Additional data file
5). Quantitative PCR was carried out in 20 μl of total volume
reactions containing 150 nmol of primers and 1 μl of RT reac-
tion. Amplification reactions were performed in the Applied
Biosystems 7900 HT Fast Real Time PCR System following
the manufacturer's instructions with the following condi-
tions: denaturation program (95°C for 10 minutes) and
amplification program repeated 40 times (95°C for 20 s, 51°C
to 57°C for 30 s, 72°C for 30 s). The PCR protocol was opti-
mized for the different Tm of the oligonucleotides. The data
were exported from the 7900 HT Sequence Detection System
Software v2.2 into a Microsoft Excel spreadsheet. Expression
levels in arbitrary units were calculated relative to amplifica-
tion of HPRT1 using the ΔCt method followed by a log
2
trans-
formation. Mean values and standard deviations were
calculated based on the three replications per sample. At least
two biological replicates were conducted for most amplicons;
data in Figures 2, 3, 4 and 5 are representative. Experiments
were also conducted using 18S as an internal reference con-
trol, with the results of the analysis not significantly different
from those with HPRT (data not shown). Oligonucleotide
primers for quantitative PCR were designed using Primer3
[65].
All individuals subjected to RT-PCR analysis were initially
genotyped for presence of the L1 insertion. The individuals
were found to be homozygous for the insertion unless other-
wise noted in the Results section (data not shown). Prelimi-
nary semi-quantitative RT-PCR was also conducted using
iTaq (Bio-Rad) and oligonucleotides located within the
expression tags (data not shown) to confirm that all ampli-
cons could be amplified sufficiently in less than 40 cycles of
PCR to be visualized by standard ethidium bromide staining.
Please refer to Additional data file 5 for the sequences of oli-
gonucleotides located in the vicinity of L1s at 4p15.32,
13q14.2, 6p22.2 and 1p22.3.
Bioinformatics analysis
The genomic origin of 3' expression tag sequences was
mapped using Tagscan [66] or BLAT [67]. Tags were only
assigned to a particular location if the alignment contained
fewer than three mismatches, not counting within the primer
sequence. Sequence tags with multiple equally good matches
were not assigned to a location. Sequences with no good
matches were considered to be not present in the reference
genome and were designated U1 to U43 (Additional data files
1, 2 and 3).
5' RACE trimmed reads from 454 pyrosequencing were
aligned to the human genome reference using BLAT [67]
(Additional data file 6). The best single hit was determined by
examining the match with the greatest value for number of
matched minus number of mismatched bases, and assigning
that sequence to the nearest L1 element. While most of this
analysis used a script developed in-house (Adam D Ewing),
BLAT hits that were not near a primate-specific L1 were
curated manually.
Human genome information, including L1 annotation infor-
mation (for example, numbers in each subfamily, sequences,
orientations relative to genes), was obtained from the UCSC
Genome Browser [68,69], with all coordinates corresponding
to hg18 (March 2006). Previously known polymorphic L1
insertion sites are found in the dbRIP database [16].
Abbreviations
CEPH: Centre d'Etude du Polymorphisme Humain; L1:
LINE1 (long interspersed nuclear element); ORF: open read-
ing frame; RACE: rapid amplification of cDNA ends; UTR:
untranslated region.
Authors' contributions
SHR and HHK conceived the study. SHR collected, compiled
and analyzed the data and drafted the manuscript. LZ con-
ducted quantitative PCR analysis. All authors examined and
approved the final manuscript.
Additional data files
The following additional data are available with the online
version of this paper: a spreadsheet listing the total 3' expres-
sion tagged sites from individuals GM10861, GM11994,
Genome Biology 2009, Volume 10, Issue 9, Article R100 Rangwala et al. R100.17
Genome Biology 2009, 10:R100
GM11995, GM17032, GM17033, GM17045 (Additional data
file 1); a spreadsheet listing the subset of 3' expression tagged
sites from individual GM10861 only (Additional data file 2); a
spreadsheet that lists 3' expression tagged sites from individ-
uals GM11994, GM11995, GM17032, GM17033, and
GM17045 separately (Additional data file 3); a spreadsheet
presenting 5' RACE tagged sites from individual GM11994
(Additional data file 4); a spreadsheet listing oligonucleotides
used in this study, as well as sequence corresponding to the L1
breakpoint region of a 5' RACE expression tagged site to a
non-reference L1 (Additional data file 5); a csv file of 454 5'
expression tag pyrosequencing sequence reads and their
putative genomic matches (Additional data file 6).
Additional data file 1Total 3' expression tagged sites from individuals GM10861, GM11994, GM11995, GM17032, GM17033, GM17045The spreadsheet includes cDNA sequence, L1 assignments, tag counts and related information as indicated in the header.Click here for fileAdditional data file 2The subset of 3' expression tagged sites from individual GM10861 onlyThe spreadsheet includes cDNA sequence, L1 assignments, tag counts and related information as indicated in the header.Click here for fileAdditional data file 33' expression tagged sites from individuals GM11994, GM11995, GM17032, GM17033, and GM17045 separatelyThe spreadsheet includes sequences, L1 assignments, counts, and related information.Click here for fileAdditional data file 45' RACE tagged sites from individual GM11994The spreadsheet includes locations, counts, L1 assignments, and other related information. A second worksheet presents this infor-mation for tags corresponding to full-length elements only. Grey font indicates 3' truncated elements, green font indicates splicing from greater than 15 kb upstream, while blue font indicates puta-tive non-reference L1s.Click here for fileAdditional data file 5Oligonucleotides used in this study, as well as sequence corre-sponding to L1 breakpoint region of a 5' RACE expression tagged site to a non-reference L1Oligonucleotides used in this study, as well as sequence corre-sponding to L1 breakpoint region of a 5' RACE expression tagged site to a non-reference L1.Click here for fileAdditional data file 6454 5' expression tag pyrosequencing sequence reads and their putative genomic matches454 5' expression tag pyrosequencing sequence reads and their putative genomic matches.Click here for file
Acknowledgements
We acknowledge the DNA Sequencing Facility at the University of Pennsyl-
vania School of Medicine for generating Sanger and 454 sequence for this
study. We thank Scott Sherrill-Mix and Adam D Ewing for preliminary bio-
informatics analysis of 454 sequence reads. We are grateful to Adam D
Ewing and Jens Mayer and our anonymous reviewers for helpful comments
on the manuscript. This study was supported by grants to HHK from the
Penn Genome Frontiers Institute (PGFI) and the National Institutes of
Health (NIH). The above funding bodies did not significantly contribute to
the collection, analysis, and interpretation of data, the writing of the manu-
script, or the decision to submit the manuscript for publication.
References
1. Martin SL, Bushman FD: Nucleic acid chaperone activity of the
ORF1 protein from the mouse LINE-1 retrotransposon. Mol
Cell Biol 2001, 21:467-475.
2. Mathias SL, Scott AF, Kazazian HH Jr, Boeke JD, Gabriel A: Reverse
transcriptase encoded by a human transposable element.
Science 1991, 254:1808-1810.
3. Feng Q, Moran JV, Kazazian HH Jr, Boeke JD: Human L1 retro-
transposon encodes a conserved endonuclease required for
retrotransposition. Cell 1996, 87:905-916.
4. Moran JV, Holmes SE, Naas TP, DeBerardinis RJ, Boeke JD, Kazazian
HH Jr: High frequency retrotransposition in cultured mam-
malian cells. Cell 1996, 87:917-927.
5. Khan H, Smit A, Boissinot S: Molecular evolution and tempo of
amplification of human LINE-1 retrotransposons since the
origin of primates. Genome Res 2006, 16:78-87.
6. Lander ES, Linton LM, Birren B, Nusbaum C, Zody MC, Baldwin J,
Devon K, Dewar K, Doyle M, FitzHugh W, Funke R, Gage D, Harris
K, Heaford A, Howland J, Kann L, Lehoczky J, LeVine R, McEwan P,
McKernan K, Meldrim J, Mesirov JP, Miranda C, Morris W, Naylor J,
Raymond C, Rosetti M, Santos R, Sheridan A, Sougnez C, et al.: Initial
sequencing and analysis of the human genome. Nature 2001,
409:860-921.
7. Swergold GD: Identification, characterization, and cell specif-
icity of a human LINE-1 promoter. Mol Cell Biol 1990,
10:6718-6729.
8. Yang N, Zhang L, Zhang Y, Kazazian HH Jr: An important role for
RUNX3 in human L1 transcription and retrotransposition.
Nucleic Acids Res 2003, 31:4929-4940.
9. Tchenio T, Casella JF, Heidmann T: Members of the SRY family
regulate the human LINE retrotransposons. Nucleic Acids Res
2000, 28:411-415.
10. Athanikar JN, Badge RM, Moran JV: A YY1-binding site is
required for accurate human LINE-1 transcription initiation.
Nucleic Acids Res 2004, 32:3846-3855.
11. Becker KG, Swergold GD, Ozato K, Thayer RE: Binding of the
ubiquitous nuclear transcription factor YY1 to a cis regula-
tory sequence in the human LINE-1 transposable element.
Hum Mol Genet 1993, 2:1697-1702.
12. Lavie L, Maldener E, Brouha B, Meese EU, Mayer J: The human L1
promoter: variable transcription initiation sites and a major
impact of upstream flanking sequence on promoter activity.
Genome Res 2004, 14:2253-2260.
13. Cost GJ, Feng Q, Jacquier A, Boeke JD: Human L1 element tar-
get-primed reverse transcription in vitro. EMBO J 2002,
21:5899-5910.
14. Luan DD, Korman MH, Jakubczak JL, Eickbush TH: Reverse tran-
scription of R2Bm RNA is primed by a nick at the chromo-
somal target site: a mechanism for non-LTR
retrotransposition. Cell 1993, 72:595-605.
15. Grimaldi G, Skowronski J, Singer MF: Defining the beginning and
end of KpnI family segments. EMBO J 1984, 3:1753-1759.
16. Wang J, Song L, Grover D, Azrak S, Batzer MA, Liang P: dbRIP: a
highly integrated database of retrotransposon insertion pol-
ymorphisms in humans. Hum Mutat 2006, 27:323-329.
17. Belancio VP, Hedges DJ, Deininger P: Mammalian non-LTR retro-
transposons: for better or worse, in sickness and in health.
Genome Res 2008, 18:343-358.
18. Ostertag EM, Kazazian HH Jr: Biology of mammalian L1 retro-
transposons. Annu Rev Genet 2001, 35:501-538.
19. Brouha B, Schustak J, Badge RM, Lutz-Prigge S, Farley AH, Moran JV,
Kazazian HH Jr: Hot L1s account for the bulk of retrotranspo-
sition in the human population. Proc Natl Acad Sci USA 2003,
100:5280-5285.
20. Esnault C, Maestre J, Heidmann T: Human LINE retrotrans-
posons generate processed pseudogenes. Nat Genet 2000,
24:363-367.
21. Dewannieux M, Esnault C, Heidmann T: LINE-mediated retro-
transposition of marked Alu sequences. Nat Genet 2003,
35:41-48.
22. Mourier T, Willerslev E: Does selection against transcriptional
interference shape retroelement-free regions in mammalian
genomes? PLoS ONE 2008,
3:e3760.
23. Wheelan SJ, Aizawa Y, Han JS, Boeke JD: Gene-breaking: a new
paradigm for human retrotransposon-mediated gene evolu-
tion. Genome Res 2005, 15:1073-1078.
24. Chueh AC, Northrop EL, Brettingham-Moore KH, Choo KH, Wong
LH: LINE retrotransposon RNA is an essential structural and
functional epigenetic component of a core neocentromeric
chromatin. PLoS Genet 2009, 5:e1000354.
25. Hansen RS: X inactivation-specific methylation of LINE-1 ele-
ments by DNMT3B: implications for the Lyon repeat
hypothesis. Hum Mol Genet 2003, 12:2559-2567.
26. Kashkush K, Feldman M, Levy AA: Transcriptional activation of
retrotransposons alters the expression of adjacent genes in
wheat. Nat Genet 2003, 33:102-106.
27. Hata K, Sakaki Y: Identification of critical CpG sites for repres-
sion of L1 transcription by DNA methylation. Gene 1997,
189:227-234.
28. Phokaew C, Kowudtitham S, Subbalekha K, Shuangshoti S, Mutiran-
gura A: LINE-1 methylation patterns of different loci in nor-
mal and cancerous cells. Nucleic Acids Res 2008, 36:5704-5712.
29. Thayer RE, Singer MF, Fanning TG: Undermethylation of specific
LINE-1 sequences in human cells producing a LINE-1-
encoded protein. Gene 1993, 133:273-277.
30. Yu F, Zingler N, Schumann G, Stratling WH: Methyl-CpG-binding
protein 2 represses LINE-1 expression and retrotransposi-
tion but not Alu transcription. Nucleic Acids Res 2001,
29:4493-4501.
31. Montoya-Durango DE, Liu Y, Teneng I, Kalbfleisch T, Lacy ME, Steffen
MC, Ramos KS: Epigenetic control of mammalian LINE-1 ret-
rotransposon by retinoblastoma proteins. Mutat Res 2009,
665:20-28.
32. Belancio VP, Roy-Engel AM, Deininger P: The impact of multiple
splice sites in human L1 elements. Gene 2008, 411:38-45.
33. Belancio VP, Hedges DJ, Deininger P: LINE-1 RNA splicing and
influences on mammalian gene expression. Nucleic Acids Res
2006, 34:1512-1521.
34. Brouha B, Meischl C, Ostertag E, de Boer M, Zhang Y, Neijens H,
Roos D, Kazazian HH Jr: Evidence consistent with human L1
retrotransposition in maternal meiosis I. Am J Hum Genet 2002,
71:327-336.
35. Georgiou I, Noutsopoulos D, Dimitriadou E, Markopoulos G, Apergi
A, Lazaros L, Vaxevanoglou T, Pantos K, Syrrou M, Tzavaras T: Ret-
rotransposon RNA expression and evidence for retrotrans-
position events in human oocytes. Hum Mol Genet 2009,
18:1221-1228.
36. Trelogan SA, Martin SL: Tightly regulated, developmentally
specific expression of the first open reading frame from
LINE-1 during mouse embryogenesis. Proc Natl Acad Sci USA
Genome Biology 2009, Volume 10, Issue 9, Article R100 Rangwala et al. R100.18
Genome Biology 2009, 10:R100
1995, 92:1520-1524.
37. Kano H, Godoy I, Courtney C, Vetter MR, Gerton GL, Ostertag EM,
Kazazian HH Jr: L1 retrotransposition occurs mainly in embry-
ogenesis and creates somatic mosaicism. Genes Dev 2009,
23:1303-1312.
38. Coufal NG, Garcia-Perez JL, Peng GE, Yeo GW, Mu Y, Lovci MT,
Morell M, O'Shea KS, Moran JV, Gage FH: L1 retrotransposition in
human neural progenitor cells. Nature 2009, 460:1127-1131.
39. Ergun S, Buschmann C, Heukeshoven J, Dammann K, Schnieders F,
Lauke H, Chalajour F, Kilic N, Stratling WH, Schumann GG: Cell
type-specific expression of LINE-1 open reading frames 1
and 2 in fetal and adult human tissues. J Biol Chem 2004,
279:27753-27763.
40. Muotri AR, Chu VT, Marchetto MC, Deng W, Moran JV, Gage FH:
Somatic mosaicism in neuronal precursor cells mediated by
L1 retrotransposition. Nature 2005, 435:903-910.
41. Faulkner GJ, Kimura Y, Daub CO, Wani S, Plessy C, Irvine KM, Schro-
der K, Cloonan N, Steptoe AL, Lassmann T, Waki K, Hornig N,
Arakawa T, Takahashi H, Kawai J, Forrest AR, Suzuki H, Hayashizaki
Y, Hume DA, Orlando V, Grimmond SM, Carninci P: The regulated
retrotransposon transcriptome of mammalian cells. Nat
Genet 2009, 41:563-571.
42. Belancio VP, Whelton M, Deininger P: Requirements for polyade-
nylation at the 3' end of LINE-1 elements. Gene 2007,
390:98-107.
43. Moran JV, DeBerardinis RJ, Kazazian HH Jr: Exon shuffling by L1
retrotransposition. Science 1999, 283:1530-1534.
44. Goodier JL, Ostertag EM, Kazazian HH Jr: Transduction of 3'-
flanking sequences is common in L1 retrotransposition. Hum
Mol Genet 2000, 9:653-657.
45. Holmes SE, Dombroski BA, Krebs CM, Boehm CD, Kazazian HH Jr:
A new retrotransposable human L1 element from the LRE2
locus on chromosome 1q produces a chimaeric insertion.
Nat Genet 1994, 7:143-148.
46. Pickeral OK, Makalowski W, Boguski MS, Boeke JD: Frequent
human genomic DNA transduction driven by LINE-1 retro-
transposition. Genome Res 2000, 10:411-415.
47. Szak ST, Pickeral OK, Landsman D, Boeke JD: Identifying related
L1 retrotransposons by analyzing 3' transduced sequences.
Genome Biol 2003, 4:R30.
48. Walther BA, Morand S: Comparative performance of species
richness estimation methods. Parasitology 1998, 116:395-405.
49. Myers JS, Vincent BJ, Udall H, Watkins WS, Morrish TA, Kilroy GE,
Swergold GD, Henke J, Henke L, Moran JV, Jorde LB, Batzer MA: A
comprehensive analysis of recently integrated human Ta L1
elements. Am J Hum Genet 2002, 71:312-326.
50. Bennett EA, Coleman LE, Tsui C, Pittard WS, Devine SE: Natural
genetic variation caused by transposable elements in
humans. Genetics 2004, 168:933-951.
51. Ovchinnikov I, Troxel AB, Swergold GD: Genomic characteriza-
tion of recent human LINE-1 insertions: evidence supporting
random insertion. Genome Res 2001, 11:2050-2058.
52. Jackson DG, Bell JI: Isolation of a cDNA encoding the human
CD38 (T10) molecule, a cell surface glycoprotein with an
unusual discontinuous pattern of expression during lym-
phocyte differentiation. J Immunol 1990, 144:2811-2815.
53. Goodrich DW: The retinoblastoma tumor-suppressor gene,
the exception that proves the rule. Oncogene 2006,
25:5233-5243.
54. Boissinot S, Entezam A, Young L, Munson PJ, Furano AV: The inser-
tional history of an active family of L1 retrotransposons in
humans. Genome Res 2004, 14:1221-1231.
55. Dakour J, Li H, Morrish DW: PL48: a novel gene associated with
cytotrophoblast and lineage-specific HL-60 cell differentia-
tion. Gene 1997, 185:153-157.
56. Lutz SM, Vincent BJ, Kazazian HH Jr, Batzer MA, Moran JV: Allelic
heterogeneity in LINE-1 retrotransposition activity. Am J
Hum Genet
2003, 73:1431-1437.
57. Seleme MC, Vetter MR, Cordaux R, Bastone L, Batzer MA, Kazazian
HH Jr: Extensive individual variation in L1 retrotransposition
capability contributes to human genetic diversity. Proc Natl
Acad Sci USA 2006, 103:6611-6616.
58. Goodier JL, Zhang L, Vetter MR, Kazazian HH Jr: LINE-1 ORF1
protein localizes in stress granules with other RNA-binding
proteins, including components of RNA interference RNA-
induced silencing complex. Mol Cell Biol 2007, 27:6469-6483.
59. Goodier JL, Ostertag EM, Engleka KA, Seleme MC, Kazazian HH Jr: A
potential role for the nucleolus in L1 retrotransposition.
Hum Mol Genet 2004, 13:1041-1048.
60. Speek M: Antisense promoter of human L1 retrotransposon
drives transcription of adjacent cellular genes. Mol Cell Biol
2001, 21:1973-1985.
61. Nigumann P, Redik K, Matlik K, Speek M: Many human genes are
transcribed from the antisense promoter of L1 retrotrans-
poson. Genomics 2002, 79:628-634.
62. Conley AB, Miller WJ, Jordan IK: Human cis natural antisense
transcripts initiated by transposable elements. Trends Genet
2008, 24:53-56.
63. Boguski MS, Lowe TM, Tolstoshev CM: dbEST - database for
"expressed sequence tags". Nat Genet 1993, 4:332-333.
64. Penn Medicine Department of Genetics 454 Sequencer.
[ />65. Rozen S, Skaletsky H: Primer3 on the WWW for general users
and for biologist programmers. Methods Mol Biol 2000,
132:365-386.
66. Iseli C, Ambrosini G, Bucher P, Jongeneel CV: Indexing strategies
for rapid searches of short words in genome sequences. PLoS
ONE 2007, 2:e579.
67. Kent WJ: BLAT - the BLAST-like alignment tool. Genome Res
2002,
12:656-664.
68. Karolchik D, Kuhn RM, Baertsch R, Barber GP, Clawson H, Diekhans
M, Giardine B, Harte RA, Hinrichs AS, Hsu F, Kober KM, Miller W,
Pedersen JS, Pohl A, Raney BJ, Rhead B, Rosenbloom KR, Smith KE,
Stanke M, Thakkapallayil A, Trumbower H, Wang T, Zweig AS, Haus-
sler D, Kent WJ, et al.: The UCSC Genome Browser Database:
2008 update. Nucleic Acids Res 2008, 36:D773-D779.
69. Kent WJ, Sugnet CW, Furey TS, Roskin KM, Pringle TH, Zahler AM,
Haussler D: The human genome browser at UCSC. Genome
Res 2002, 12:996-1006.