Báo cáo y học: "Comparing cellular proteomes by mass spectrometry" pot
Bạn đang xem bản rút gọn của tài liệu. Xem và tải ngay bản đầy đủ của tài liệu tại đây (274.58 KB, 5 trang )
Fröhlich and Walther: Genome Biology 2009, 10:240
Abstract
Mass spectrometry and cryo-electron tomography together
enable the determination of the absolute and relative abundances
of proteins and their localization, laying the groundwork for
comprehensive systems analyses of cells.
Biological systems are characterized by the dynamic inter-
play of their components, and to understand how individual
parts act together it is crucial to know the composition of a
system and how it changes over time. The protein
components are of prime interest as they provide structure
and carry out many functions in the cell. The transcriptome
has been much used as a proxy to infer changes in protein
expression, as techniques for measuring global RNA levels
preceded those for measuring the proteome. However, when
the levels of an mRNA and its corresponding protein are
systematically compared, many differences in their abun-
dance emerge, resulting in poor quantitative correlation
overall between transcriptome and proteome [1-3]. Ways of
measuring protein levels directly are therefore highly
desirable, and breakthroughs in mass spectrometry (MS)-
based proteomics are starting to enable this on a global scale.
In experiments recently published in Nature, Ruedi Aeber-
sold and colleagues (Malmström et al. [4]) combined
MS-based measurements of protein abundance in the
bacterial pathogen Leptospira interrogans, the agent of
Weil’s disease, with imaging by cryo-electron tomography
(CET) of distinct structures of known protein composition,
such as the flagellar motor (in which the precise number
and type of the protein subunits can be counted). The CET
imaging provided a way of confirming the MS protein-
quantitation data. The protein-abundance measurements
then enabled the effect of the antibiotic ciprofloxacin on a
large fraction of the Leptospira proteome to be determined.
In this article we describe some of the recent developments
in MS-based proteomics that enable such experiments,
focusing on quantitative techniques that will eventually
allow a complete inventory of cellular proteins. The goal
for proteomics is the measurement of the absolute and
relative abundances of proteins at high accuracy and with
minimal effort. But currently this means a compromise
between depth of analysis and measurement time.
Identifying proteins by mass spectrometry
Intact proteins are difficult to identify by MS because their
sequence cannot be obtained by fragmentation and so
MS-based proteomics relies on analysis of peptides
obtained by proteinase digestion of the sample. By analogy
with genome-sequencing methods, this approach has been
called ‘shotgun’ proteomics. The resulting peptide mixtures
are dauntingly complex and are fractionated before
submitting them to MS. Several recent studies, including
the determination of the yeast and Leptospira proteomes
[2,4], used isoelectric focusing in so-called OFF-gels [5,6]
as a first separation step. Following this initial fractiona-
tion, peptides are separated by liquid chromatography
(LC) most commonly directly coupled to electrospray
ionization of peptides (ESI) or less frequently to matrix-
assisted laser desorption ionization (MALDI) to produce
ions for MS.
In the next step, mass-to-charge (m/z) values of peptides
and their ion intensities are determined by MS (MS
1
or
‘parent ion’ spectra). To reliably identify peptides, the
(typically) 5 to 20 most abundant peptides are selected for
further fragmentation, resulting in a sequence-charac ter-
istic spectrum (MS
2
or fragmentation spectrum) for each
peptide that is used to search databases to identify the
peptide (Figure 1a). In the determination of the Leptospira
proteome, Malmström et al. [4] collected more than
415,000 MS
2
spectra that could be assigned to more than
18,000 unique peptides, leading to the identification of
2,221 proteins (61% of the predicted open reading frames).
To analyze the complex peptide mixtures typical of proteo-
mics very high mass resolution is required. Otherwise, MS
spectra from different peptides overlap, making peptide
identification and quantification potentially inaccurate and
unreliable. Precision instruments, in particular orbital
frequency resonance ion traps such as the Orbitrap [7], are
therefore most widely used for proteomics.
Methods for comparative quantitative
proteomics
A common goal in proteomics is the accurate quantification
and comparison of the proteomes of cells in different
physiological or developmental states. For Leptospira, the
Minireview
Comparing cellular proteomes by mass spectrometry
Florian Fröhlich and Tobias C Walther
Address: Organelle Architecture and Dynamics, Max Planck Institute of Biochemistry, Am Klopferspitz 18, 82152 Martinsried/Munich,
Germany.
Correspondence: Tobias C Walther. Email:
240.2
Fröhlich and Walther: Genome Biology 2009, 10:240
SILAC
‘Label-free’ quantitation
R =
MS
I
2
I
2
I
1
Heavy labeled
Light labeled
R =
MS
MS
Absolute quantitation with standard peptides
C =
I
REF
x 100 nM
MS
[100 nM]
Intensity
m/z m/z
Intensity
b2
y3
y4
y5
y6
y8
Collision-induced
dissociation
MS
1
MS
2
Liquid
chromato-
graphy
Electrospray
ionization
Sample
peptide
mixture
I
1
I
2
I
1
I
2
I
1
I
1
I
REF
I
1
(a)
(b)
m/z
m/z
m/z
Figure 1
Continued on next page
240.3
Fröhlich and Walther: Genome Biology 2009, 10:240
interesting question addressed by Malmström et al. [4] is
how the proteome reacts to addition of an antibiotic. They
took the approach of quantifying protein abundance
directly using a label-free method, which we shall discuss
later. Another approach would have been to derivatize the
peptides from different conditions with isobaric labels that
yield different, indicative, small molecules after fragmen-
tation, a technique called isobaric tag for relative and
absolute quantitation (iTRAQ) [8]. After fragmentation
these derivatives yield distinctive small molecules indica-
tive of the peptide. In such an experiment, the relative
abundance of these indicators is used to quantify the
relative abundance of the different peptides (and thus
proteins) in the sample.
Metabolic labeling of proteins yields similar information,
but avoids complications of in vitro coupling such as
incomplete reactions. Samples are labeled in vivo with
amino acids (lysine and arginine) labeled with heavy non-
radioactive isotopes such as
13
C or
15
N, and compared with
samples containing unlabeled amino acids, a technique
called stable isotope labeling of cells in culture (SILAC) [9].
Peptides are then generated by digesting with proteinases
(for example, trypsin) that cut specifically after labeled
amino acids, thereby ensuring that each peptide contains
at least one labeled amino acid. This results in a distinct
shift in MS spectra between heavy and light peptides. The
intensity ratio between peaks in a SILAC pair indicates the
abundance ratio of proteins from which the peptides were
derived (Figure 1b).
For more accurate measurements, multiple peptides from
a protein are typically averaged and this analysis is now
completely automated [10]. Because of the high resolving
power of Orbitrap mass spectrometers, this methodology
can be applied to very complex mixtures and closely spaced
peaks can be well resolved. Together with only one
previous fractionation step - isoelectric focusing - this
experimental setup was used for the first quantitation of a
eukaryotic proteome, that of Saccharomyces cerevisiae, in
the haploid and diploid phases of the life cycle (4,399
proteins were identified and 4,033 quantitated from
1,788,451 SILAC pair peptides [2]). If the abundances of at
least some proteins are known, as was the case in yeast,
they can be used to calibrate the MS data and yield absolute
protein measurements. Advantages of this approach include
very accurate quantitation and the fact that no previous
knowledge of proteins that change in abundance is
required. This is in contrast to the classical protein-
detection methods, for example, immunoblotting, where
reagents are often limiting and a clear hypothesis about
which protein(s) to measure is required. SILAC, pioneered
by the Mann laboratory, is now widely used for protein
analyses in yeast, flies and even mice [1,2,11,12].
Label-free approaches
A limitation of SILAC experiments is that labeling is
necessary but is not always possible - for example in
human samples. One option is to compare SILAC-labeled
reference extracts or recombinant proteins against samples
of interest [13]. Alternatively, it may be desirable to find
means of reliably quantifying protein abundance directly,
an approach taken by Malmström et al. [4] for the
characterization of Leptospira and its reaction to
ciprofloxacin. Early methods of ‘label-free’ quantification
used the frequency of peptide selection for fragmentation
as a measure of their abundance - termed ‘spectral count-
ing’ [14,15]. Because that technique uses an indirect
measurement for peptide abundance and only works
reliably for proteins with many available peptides,
alternatives have been developed. Specifically, peptide-ion
intensities in the parent MS
1
spectrum are used to quantify
peptide abundances. For this method, reproducible
identification of the same peptides in different LC-MS runs
is crucial (Figure 1b). This is achieved by high mass-
accuracy measurements, and also by aligning different
runs based on the LC retention time of matched peptides
between them [16]. Although still somewhat less accurate
than quantification methods relying on isotope labels, this
methodology makes a variety of clinical and environmental
samples accessible, such as cancer or other biopsies.
In a series of papers including the Leptospira study, the
peptide-ion intensity method has been further developed
to calibrate MS measurements and yield absolute quanti fi-
cations [4,6,17,18]. As standards for calibration, isotope-
labeled reference peptides are spiked into samples.
Comparison of the ion intensities of standards of known
abundance and of the experimental peptides yields an
absolute concentration for the latter (Figure 1b). In very
complex mixtures, it can be difficult to detect such peptide
pairs, but in principle, advances in instrumentation and
development of analytic tools should eventually allow the
measurement of most peptides in a mixture, including
those spiked as a reference. In the meantime, targeted
approaches such as selected reaction monitoring (SRM)
Figure 1 continued
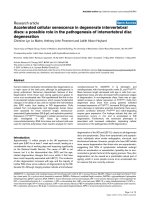
Quantitative MS-based proteomics. (a) Analysis of complex peptide mixtures by LC-MS
2
. Peptide mixtures are resolved by liquid
chromatography, ionized through electrospray and resolved by MS
1
. Selected peptides are fragmented by collision with an inert gas and the
resulting MS
2
spectra are recorded. (b) Quantitative proteomics strategies. In the SILAC technique, isotope-labeled peptide intensities (I) are
compared in the MS
1
spectra. For ‘label-free’ quantitation, intensities of peptides are compared between different runs. Alternatively, standard
peptides are spiked into the mixture to yield calibration for absolute peptide abundances. R refers to the ratio between either heavy and light
peptides (SILAC panel) or ion intensities between different runs (label-free quantitation).
240.4
Fröhlich and Walther: Genome Biology 2009, 10:240
are promising. In these experiments, a series of mass
analyzers (for example, a triple quadrupole MS) ‘filters’
only targeted peptides. In combination with isotope-
labeled standards, the abundance of peptides is quantitated
by comparison of parent ion pair intensities. As a result of
effective filtering, SRM assays are performed very fast and
can monitor a series of peptides. To obtain a calibration
curve for the Leptospira proteome that can be extrapolated
to determine the absolute abundances of all detected
proteins, Malmström et al. [4] used 19 peptides to report
on proteins ranging in abundance from 40 to 15,000 copies
per cell. One appeal of this methodology is the rapid
monitoring of a limited number of proteins, which would
enable a comparison of abundance in many samples and
the characterization of protein dynamics over time.
A potential problem with the peptide-ion intensity method
is that parent ion scans are usually carried out using
quadrupoles with high sensitivity and dynamic range but
low mass accuracy, possibly leading to overlapping peaks
and convolution of signals when analyzing complex
mixtures. A remedy for this could be to acquire full high-
resolution spectra by scanning MS and then select peptides
for sequencing by an ‘inclusion’ list. Satisfyingly, in the
case of Leptospira [4], the quantitation obtained using an
SRM-derived calibration curve agreed very well with the
counting by CET of the subunits in prominent cellular
structures such as the flagella and the flagellar motor, or of
methyl-accepting proteins in individual cells. This work
shows how MS-based proteomics combined with high-
resolution CET can yield information on protein abun-
dance and localization.
Having obtained accurate measurements of the levels of
individual proteins, it is then possible to compare prote-
omes under different physiological conditions. In the case
of Leptospira [4], the comparison showed that the
bacterium reacts to ciprofloxacin by strongly inducing the
expression of a number of proteins (whose existence was
previously only predicted from the genome sequence), but
maintains overall protein concentration. The upregulated
proteins might include interesting targets for combination
therapy and the experiment shows in principle how this
technology can be used for an unbiased systems charac-
terization.
Over the past decade, developments in MS-based proteo-
mics have greatly accelerated. In particular, new instru-
men tation and automation of MS-spectra interpretation
enables the quantification of essentially whole-organism
proteomes in single experiments. Tools to calibrate
measurements are already leading to the determination of
absolute protein abundances and specialized methods can
be used to target subsets of proteins. All together, these
developments predict that MS-based proteomics will
become a staple technique in systems biology.
Acknowledgements
We thank Bob Farese, Natalie Krahmer and members of the Walther
lab for discussions and contributions to this essay. This work was
supported by the Max Planck Society, the German Research
Council (DFG) and the Human Frontier Science Program (HFSP).
References
1. Bonaldi T, Straub T, Cox J, Kumar C, Becker PB, Mann M:
Combined use of RNAi and quantitative proteomics to
study gene function in Drosophila. Mol Cell 2008, 31:762-
772.
2. de Godoy LM, Olsen JV, Cox J, Nielsen ML, Hubner NC,
Frohlich F, Walther TC, M Mann M: Comprehensive mass-
spectrometry-based proteome quantification of haploid
versus diploid yeast. Nature 2008, 455:1251-1254.
3. Ideker T, Thorsson V, Ranish JA, Christmas R, Buhler J, Eng
JK, Bumgarner R, Goodlett DR, Aebersold R, Hood L:
Integrated genomic and proteomic analyses of a systemat-
ically perturbed metabolic network. Science 2001, 292:929-
934.
4. Malmström J, Beck M, Schmidt A, Lange V, Deutsch EW,
Aebersold R: Proteome-wide cellular protein concentra-
tions of the human pathogen Leptospira interrogans.
Nature 2009, 460:762-765.
5. Hubner NC, Ren S, Mann M: Peptide separation with immo-
bilized pI strips is an attractive alternative to in-gel protein
digestion for proteome analysis. Proteomics 2008, 8:4862-
4872.
6. Picotti P, Bodenmiller B, Mueller LN, Domon B, Aebersold R:
Full dynamic range proteome analysis of S. cerevisiae by
targeted proteomics. Cell 2009, 138:795-806.
7. Hu Q, Noll RJ, Li H, Makarov A, Hardman M, Graham Cooks R:
The Orbitrap: a new mass spectrometer. J Mass Spectrom
2005, 40:430-443.
8. Ross PL, Huang YN, Marchese JN, Williamson B, Parker K,
Hattan S, Khainovski N, Pillai S, Dey S, Daniels S, Purkayastha
S, Juhasz P, Martin S, Bartlet-Jones M, He F, Jacobson A,
Pappin DJ: Multiplexed protein quantitation in
Saccharomyces cerevisiae using amine-reactive isobaric
tagging reagents. Mol Cell Proteomics 2004, 3:1154-1169.
9. Ong SE, Blagoev B, Kratchmarova I, Kristensen DB, Steen H,
Pandey A, Mann M: Stable isotope labeling by amino acids
in cell culture, SILAC, as a simple and accurate approach
to expression proteomics. Mol Cell Proteomics 2002, 1:376-
386.
10. Cox J, Mann M: MaxQuant enables high peptide identifica-
tion rates, individualized p.p.b range mass accuracies and
proteome-wide protein quantification. Nat Biotechnol 2008,
26: 1367-1372.
11. Kruger M, Moser M, Ussar S, Thievessen I, Luber CA, Forner
F, Schmidt S, Zanivan S, Fassler R, Mann M: SILAC mouse
for quantitative proteomics uncovers kindlin-3 as an
essential factor for red blood cell function. Cell 2008, 134:
353-364.
12. Liao L, Park SK, Xu T, Vanderklish P, Yates JR 3rd:
Quantitative proteomic analysis of primary neurons
reveals diverse changes in synaptic protein content in
fmr1 knockout mice. Proc Natl Acad Sci USA 2008, 105:
15281-15286.
13. Hanke S, Besir H, Oesterhelt D, Mann M: Absolute SILAC for
accurate quantitation of proteins in complex mixtures
down to the attomole level. J Proteome Res 2008, 7:1118-
1130.
14. Liu H, Sadygov RG, Yates JR 3rd: A model for random sam-
pling and estimation of relative protein abundance in
shotgun proteomics. Anal Chem 2004, 76:4193-4201.
15. MacCoss MJ, Wu CC, Liu H, Sadygov R, Yates JR 3rd: A cor-
relation algorithm for the automated quantitative analysis
of shotgun proteomics data. Anal Chem 2003, 75:6912-
6921.
16. Strittmatter EF, Ferguson PL, Tang K, Smith RD: Proteome
analyses using accurate mass and elution time peptide
240.5
Fröhlich and Walther: Genome Biology 2009, 10:240
tags with capillary LC time-of-flight mass spectrometry. J
Am Soc Mass Spectrom 2003, 14:980-991.
17. Gerber SA, Rush J., Stemman O, Kirschner MW, Gygi SP:
Absolute quantification of proteins and phosphoproteins
from cell lysates by tandem MS. Proc Natl Acad Sci USA
2003, 100:6940-6945.
18. Silva JC, Gorenstein MV, Li GZ, Vissers JP, Geromanos SJ:
Absolute quantification of proteins by LCMSE: a virtue of
parallel MS acquisition. Mol Cell Proteomics 2006, 5:144-
156.
Published: 28 October 2009
doi:10.1186/gb-2009-10-10-240
© 2009 BioMed Central Ltd