Báo cáo y học: " Divergence of exonic splicing elements after gene duplication and the impact on gene structures" pot
Bạn đang xem bản rút gọn của tài liệu. Xem và tải ngay bản đầy đủ của tài liệu tại đây (371.37 KB, 14 trang )
Genome Biology 2009, 10:R120
Open Access
2009Zhanget al.Volume 10, Issue 11, Article R120
Research
Divergence of exonic splicing elements after gene duplication and
the impact on gene structures
Zhenguo Zhang
¤
*†
, Li Zhou
¤
*†
, Ping Wang
*†
, Yang Liu
*†
, Xianfeng Chen
*†
,
Landian Hu
*‡
and Xiangyin Kong
*‡
Addresses:
*
The Key Laboratory of Stem Cell Biology, Institute of Health Sciences, Shanghai Institutes for Biological Sciences (SIBS), Chinese
Academy of Sciences (CAS) and Shanghai Jiao Tong University School of Medicine (SJTUSM), 225 South Chong Qing Road, Shanghai 200025,
PR China.
†
Graduate School of the Chinese Academy of Sciences, 19A Yuquan Road, Beijing 100049, PR China.
‡
State Key Laboratory of Medical
Genomics, Ruijin Hospital, Shanghai Jiaotong University, 197 Rui Jin Road II, Shanghai 200025, PR China.
¤ These authors contributed equally to this work.
Correspondence: Xiangyin Kong. Email:
© 2009 Zhang et al.; licensee BioMed Central Ltd.
This is an open access article distributed under the terms of the Creative Commons Attribution License ( which
permits unrestricted use, distribution, and reproduction in any medium, provided the original work is properly cited.
Exonic splicing element evolution<p>An analysis of human exonic splicing elements in duplicated genes reveals their important role in the generation of new gene struc-tures.</p>
Abstract
Background: The origin of new genes and their contribution to functional novelty has been the
subject of considerable interest. There has been much progress in understanding the mechanisms
by which new genes originate. Here we examine a novel way that new gene structures could
originate, namely through the evolution of new alternative splicing isoforms after gene duplication.
Results: We studied the divergence of exonic splicing enhancers and silencers after gene
duplication and the contributions of such divergence to the generation of new splicing isoforms.
We found that exonic splicing enhancers and exonic splicing silencers diverge especially fast shortly
after gene duplication. About 10% and 5% of paralogous exons undergo significantly asymmetric
evolution of exonic splicing enhancers and silencers, respectively. When compared to pre-
duplication ancestors, we found that there is a significant overall loss of exonic splicing enhancers
and the magnitude increases with duplication age. Detailed examination reveals net gains and losses
of exonic splicing enhancers and silencers in different copies and paralog clusters after gene
duplication. Furthermore, we found that exonic splicing enhancer and silencer changes are mainly
caused by synonymous mutations, though nonsynonymous changes also contribute. Finally, we
found that exonic splicing enhancer and silencer divergence results in exon splicing state transitions
(from constitutive to alternative or vice versa), and that the proportion of paralogous exon pairs
with different splicing states also increases over time, consistent with previous predictions.
Conclusions: Our results suggest that exonic splicing enhancer and silencer changes after gene
duplication have important roles in alternative splicing divergence and that these changes
contribute to the generation of new gene structures.
Published: 2 November 2009
Genome Biology 2009, 10:R120 (doi:10.1186/gb-2009-10-11-r120)
Received: 15 June 2009
Revised: 28 September 2009
Accepted: 2 November 2009
The electronic version of this article is the complete one and can be
found online at /> Genome Biology 2009, Volume 10, Issue 11, Article R120 Zhang et al. R120.2
Genome Biology 2009, 10:R120
Background
There is an intimate link between the evolution of novel func-
tions and the evolution of new genes [1-3]. Thus, it is impor-
tant to understand the origin and evolution of new gene
structures in order to understand the mechanisms responsi-
ble for the generation of new functions. Several mechanisms
for the origin of new genes have been proposed, such as exon
shuffling, gene duplication, and retroposition (reviewed in
[4]). It is also possible that new gene structures are generated
by the evolution of new alternative splicing forms after gene
duplication. Consistent with this idea, 6 to 8% of profiled
human-chimpanzee orthologous exons display significant
splicing level differences in corresponding tissues. These
genes affect diverse functions, including regulation of gene
expression, signal transduction, cell death, immune defense,
and susceptibility to diseases [5]. Previous studies have
focused on the quantitative relationship between gene dupli-
cation and alternative splicing, and their findings support the
quantitative divergence of alternative splicing events after
gene duplication [6-9]. However, the details of this mecha-
nism of alternative splicing evolution and its contributions to
the evolution of new gene structures remain largely unknown.
Alternative splicing is a common and vital mechanism in
higher eukaryotes that helps to increase transcriptional com-
plexity [10,11]. By ligation of different exons or regions, alter-
native splicing is able to produce more than one transcript
isoform from the same gene [10]. Alternative splicing
requires a complex network and is regulated by many factors.
In addition to sequences that comprise the branchpoint and
the 3' and 5' splice sites, the cellular splicing machinery relies
on additional information in the form of exonic splicing
enhancer (ESE) and intronic splicing enhancer and exonic
splicing silencer (ESS) and intronic splicing silencer
sequences [10,12-14]. To carry out their functions, these ele-
ments are bound by different splicing factors, such as SR pro-
teins [15] and heterogeneous nuclear ribonucleoproteins
[10,16,17]. Several groups have made progress in the identifi-
cation of these functional elements using experimental and
computational methods [18]. The RESCUE-ESE method
identified 238 ESEs that are preferentially associated with
constitutive exons with weak splice sites [19]. In another
study, octamers that are overrepresented in internal non-cod-
ing exons compared with pseudo-exons and 5' untranslated
regions of intronless genes were compiled [20]. Putative ESSs
were also identified by using in vivo [21] and computational
methods [20,22]. These lists of putative elements provide a
rich resource to study their functions in exon splicing.
To evaluate the contribution of alternative splicing to the evo-
lution of new gene structures, we studied the evolution of
splicing-related elements after gene duplication and deter-
mined their influence on splicing. The results can also help
improve the understanding of functional divergence. We
began with ESEs and ESSs, which are the two types of regula-
tory elements that are currently the best annotated. Using the
synonymous substitution rate (Ks) between duplicates as a
proxy for time after gene duplication, we find that ESEs and
ESSs diverge with evolutionary time and the patterns are dif-
ferent between real and control motifs, indicating the effect of
splicing. Furthermore, we observed that there is a tendency
for duplicates to loose ESEs over time. Moreover, gains and
losses of ESEs and ESSs tend to be concerted processes with
one exon in a duplicated pair tending to always either gain or
lose ESE or ESS. The net losses and gains are mainly caused
by synonymous changes, which suggests that splicing selec-
tion is the major force influencing the splicing element
changes. Consistent with the roles of ESE and ESS in splicing,
we found that alternative exons have higher ESS and lower
ESE densities when compared to their constitutive copies.
And the fractions of exon pairs with different constitutive
exons increase with duplication age. We conclude that ESE
and ESS changes after gene duplication play important roles
in alternative splicing divergence and contribute to the origin
of new gene structures.
Results
ESE and ESS divergences increase with evolutionary
time after gene duplication
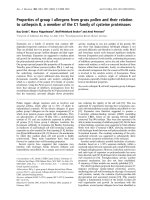
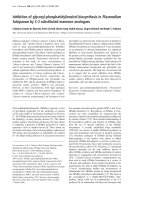
The relative difference of ESE and ESS density between two
paralogous exons increases as Ks becomes large (Figure 1a,
b). The spearman correlation coefficients for ESEs and ESSs
with Ks are 0.536333 and 0.499158, respectively (Table 1). A
detailed examination of the two graphs indicates that the dif-
ference grows faster in the early stage (Ks <0.11) and then
reaches a plateau at the late stage. This pattern is quite similar
to the evolution of protein sequences in chimeric fusion genes
driven by adaptive evolution [23], suggesting that ESEs and
ESSs possibly also undergo adaptive evolution after gene
duplication.
The observed large difference between paralogous exons
implied the possibility of asymmetric evolution for ESEs and
ESSs. To address this issue vigorously, we employ a statistical
method to detect the difference between two paralogs based
on the binomial distribution (see [24] and Materials and
methods for details). If the two paralogous exons evolved
symmetrically, the number of ESE or ESS elements specific to
only one exon should be a random variable with a binomial
distribution. As shown in Table 2, among the 1,089 pairs of
paralogous exons, 166 show significant ESE difference (P <
0.05). However, since it involves 1,089 simultaneous statisti-
cal tests, about 1,089 × 0.05 ≈ 54 cases will show significance
by pure chance at a significance level of 0.05, assuming the
test is unbiased. Therefore, 166 - 54 = 112 cases are likely to be
truly significant, which accounts for 10.3% of tested pairs.
Similarly, for ESSs we observed 46 of 454 tested pairs of par-
alogous exons with P < 0.05, and 22 cases possibly happen by
pure chance. Thus, 24 (5.1%) are truly significant. The pro-
portion of exon pairs with asymmetric evolution of ESEs or
Genome Biology 2009, Volume 10, Issue 11, Article R120 Zhang et al. R120.3
Genome Biology 2009, 10:R120
ESSs is similar to the test of splicing isoform numbers (9.5%)
[25].
In most cases, ESE and ESS motifs in exons contain both pro-
tein-coding and splicing-related information. Therefore, evo-
lution of these motifs should be constrained at two levels of
selection - the protein sequence constraint and the require-
ment for accurate splicing - so called dual-coding [26]. To
separate the two types of selection and see how splicing
requirement affects ESE/ESS evolution, we constructed a set
of control motifs using the method described by Ke et al. [27].
Briefly, we reversed and complemented each sequence of the
original ESE set and then purged this set of sequences from
the original set to obtain the control ESE set. The same proce-
dure was applied to the ESS set. The control ESE and ESS sets
have the same coherence among motifs and the same CG
dinucleotide content as the original experimental sets. Com-
pared with real motifs, these control motifs also code pro-
teins, but do not presumably have splicing signals. Therefore,
a comparison of the real ESE/ESS motifs to these control
motifs can separate the effect of selection from splicing con-
straint. As shown in Figure 1a, real ESE divergence is gener-
ally lower than the control in all stages, and more so at the late
stage. For the ESSs, the changes in the real motifs are slightly
lower than in the control at the early stage, similar to ESEs,
but the divergence exceeds that of the control set in the late
stage (Figure 1b). These results suggest that splicing selection
indeed has an effect on ESE and ESS changes after gene
duplication, but the effects are different for ESEs and ESSs.
For ESEs, selection for splicing may suppress their diver-
gence to some extent, but for ESSs, the divergence is enlarged
by selection on splicing at the late stage. This indicates that
ESEs and ESSs have different evolutionary routes. This idea
is consistent with another observation that ESEs are favored
by exons but that ESSs are selected against during evolution
[27].
Both ESEs and ESSs diverge with the age of duplicationFigure 1
Both ESEs and ESSs diverge with the age of duplication. When compared to control motifs, it seems that divergence between paralogs is selected against
in the case of ESEs and for in the case of ESSs by splicing constraints at the late stage. Error bars show standard errors in each group.
0 0.01 0.05 0.11 0.19 0.32
00.0 0.10 0.20 0.30
ytisnedESEfoecnereffiD
Ks
(a)
Motif
Control
7.06.05.04.03.02.01.00.0
ytisnedSSEfoecnereffiD
0 0.01 0.05 0.11 0.19 0.32
Ks
(b)
Table 1
Spearman rank correlation of ESE and ESS divergence with Ks
Paralogs (n = 2,074) Orthologs (n = 99,716)
Rho P Rho P
ESEs 0.536333 <2.2e-16 0.091868 <2.2e-16
ESSs 0.499158 <2.2e-16 0.170465 <2.2e-16
The numbers of pairs used are indicated in parentheses.
Table 2
Asymmetric evolution of paralogous exons for ESEs and ESSs
Total Count (P < 0.05)
ESEs 1,089 166
ESSs 454 46
Shown here are the paralog pairs in which the total element changes
are larger than 5 (see Materials and methods for details). The number
of pairs with P < 0.05 is also given.
Genome Biology 2009, Volume 10, Issue 11, Article R120 Zhang et al. R120.4
Genome Biology 2009, 10:R120
One possibility to consider is that ESE/ESS divergence is a
common phenomenon when sequence divergence occurs and
is not actually related to the gene duplication event, for exam-
ple, in a manner similar to changes between orthologs. To test
this, we reanalyzed the relationships in human-mouse orthol-
ogous exons. Indeed, we found positive correlations between
ESE and ESS differences and Ks (Table 1; rho = 0.091868 and
0.170465 for ESEs and ESSs, respectively). However, the
magnitudes of correlations are much smaller than those that
are observed between paralogs (Table 1). This result indicates
that sequence divergence itself could also result in ESE/ESS
divergence, but the degree is much stronger in paralogs.
Gain and loss of ESEs and ESSs after gene duplication
The above result shows that both ESEs and ESSs diverge in
the time after duplication. A more informative analysis would
involve the comparison of the paralogs with their pre-dupli-
cation ancestors, from which creations or losses could be
determined. The Inparanoid program is able to distinguish
duplication events that happened before and after speciation
and identify only the paralogs that were produced after speci-
ation [28]. We used human and mouse proteins as inputs to
identify paralogs in humans. Under these conditions, it is
suitable to use mouse orthologs as the pre-duplication
ancestors.
The paralogous exon pairs, with their respective splicing
information, were divided into three groups according to
their splicing states, which were the AC, AA, and CC groups.
Each exon pair in the AC group represents a pair of paralo-
gous exons with one alternative and one constitutive exon,
the AA group represents a pair of alternative exons, and the
CC group represents two constitutive exons. The numbers for
each group are listed in Table S1 in Additional data file 1. As a
control to estimate the genomic bias, the differences between
human and mouse orthologous constitutive exons without
paralogs are displayed (this group is identified as Orth). We
compared the mean value of ESE or ESS densities in each par-
alogous exon to the mouse ortholog to derive the element
changes. The AC, AA and CC exon groups all show more ESE
losses than the control (Orth group; Wilcoxon rank sum test,
P = 5.97E-10, 0.0006909 and 0.0009766, respectively; Fig-
ure 2a). Furthermore, the AC and AA groups lost more than
the CC group (P = 0.0015 and 0.01917, respectively). When all
the paralogous exon pairs are included, the result is still sig-
nificant (All versus Orth, P = 1.17E-07). For the ESSs (Figure
2b), the AC and AA groups have, on average, slightly more
losses than the Orth group, but the differences are not statis-
tically significant (Wilcoxon rank sum test, P = 0.9233 and
0.778 for AC and AA groups, respectively). The CC group and
the 'All' group show similar changes to the Orth group. Inter-
estingly, the ESE and ESS differences between orthologs
(Orth group) do not equal zero. This emphasizes the necessity
of using the orthologous exon pairs as a control.
We can also employ the shuffled motifs (as used in Figure 1),
to see whether splicing requirements affect ESEs and ESSs
when protein constraints are controlled. As shown in Figure
2a and Table S2 in Additional data file 1, generally the real
ESE elements are lost more than the control ones for paralo-
gous exons. In particular, compared to mouse exons, the
average changes of control ESE motifs is around zero when all
the paralogous exons ('All' group) are used, but a significant
loss for real ESE motifs exists (two-sided Wilcoxon rank sum
test, P = 0.002135). By contrast to the paralogous exons, the
human-mouse orthologous exon pairs (Orth group) show
greater conservation for the real ESE motifs than for the con-
trol (two-sided Wilcoxon rank sum test, P = 4.66 × 10
-15
). Dif-
ferent from ESEs, the changes of ESS elements in paralogous
exons are smaller than the control ones, showing fewer gains
of ESSs, especially when all the paralogous exons are used (P
= 0.01321). Once again we observed a converse pattern in
orthologous exons, showing more gains of ESSs than the con-
trol (P = 1.31 × 10
-8
). These observations suggest that splicing
greatly affects the gains and losses of splicing elements in
duplicates, and the pattern is different from that in non-
duplicated genes.
It is also important to examine the ESE and ESS changes with
the age of duplication. We use the Ka between duplicates as a
proxy of duplication age. Compared to mouse, the ESE
changes are negatively correlated with Ka (Spearman rank
correlation analysis, rho = -0.1463, P = 2.38E-07; Figure 2c),
which suggests that more ESE losses occur as the age of the
duplication increases. For ESSs, as expected, there is no
detectable correlation between the changes and Ka (rho =
0.0252, P = 0.3903) when the mean values of paralogous
exon pairs are used (Figure 2d). We also use Ks as the proxy
of duplication age and the same result is observed (Additional
data file 2).
The above analysis is based on all the exons in each group of
exons together. To explore further the underlying changes of
paralogous exons, we examine the exon pairs showing statis-
tically asymmetric evolution (Table 2). For easy visualization,
we plot the member with lower ESE or ESS density in each
pair of paralogous exons on the abscissa axis and the other
with higher density on the ordinate axis (Figure 3); for easy
description, we call the two copies 'Low' and 'High', respec-
tively. As shown in Figure 3a, a significant portion of the exon
pairs shows discordant changes, with one copy gaining ESEs
and the other losing some, or with one copy changing and the
other largely constant. We also found some pairs of exons
showing gains or losses in both copies (the points near the
black diagonal in Figure 3a), though the changing magnitudes
are different. A similar pattern was observed for ESS changes
(Figure 3b), but the points are sparse due to the small dataset.
These observations display a diverse pattern of ESE and ESS
evolution after gene duplication, and may reflect different
requirements of functional divergence in different genes.
Genome Biology 2009, Volume 10, Issue 11, Article R120 Zhang et al. R120.5
Genome Biology 2009, 10:R120
Loss and gain of ESEs/ESSs are mainly caused by
synonymous changes
Losses and gains of ESEs and ESSs in different copies of par-
alogous exons have been observed. Especially for the ESEs,
only overall losses are found. It has been reported that protein
sequences after gene duplications may diverge quickly
[29,30]. Protein sequence changes are likely to disrupt and
create ESEs or ESSs. Thus, it is possible that the changes in
ESEs and ESSs are just a passive process that is caused by
protein divergence rather than the requirement of splicing. A
simple way to test this is to see which kind of mutations, syn-
onymous or nonsynonymous, are more likely to result in ESE
or ESS net gains and net losses. In other words, the synony-
mous changes do not affect the protein sequences and should
be mainly affected by splicing selection.
To determine how disruption or creation of ESEs and ESSs
happened after gene duplication, we used mouse orthologous
exons as pre-duplication ancestors for comparison with the
human paralogous exons in order to determine whether crea-
tion or disruption takes place. To exclude mutations that hap-
pened after the human-mouse split but before gene
duplication, we only consider the mutational bases that are
different between paralogous exons and either of which is the
same as the mouse ortholog (see Materials and methods for
details). Disruptions were subtracted from creations to derive
the net changes, and any resulting positive values indicate net
creations and negative values indicate net disruptions. When
we calculate changes by combining the changes that occurred
in both copies of each paralogous exon pair, which corre-
sponds to the case above when the mean values of paralogous
exons were used to determine gains or losses, the mean value
of net ESE changes per exon pair when compared to the
mouse orthologs is -0.312296 (Figure 4 and Table 3), which
suggests more disruptions than creations (P = 1.54E-05) and
is consistent with the above observation of more losses of
ESEs (Figure 2a). As expected, the disruptions and creations
for ESSs were equal, on average (mean = -0.0272, P = 0.3491;
Figure 4 and Table 3). To discriminate the splicing selection
from the protein sequence constraints, the mutations were
further divided into synonymous and nonsynonymous
groups. On average, each exon pair loses 0.2122 ESEs
through synonymous changes, while this is 0.0642 for non-
synonymous changes (Figure 4 and Table 3). Furthermore,
the changes that were caused by synonymous changes was
significantly different from zero (P = 2.93E-06) but not for
nonsynonymous changes (P = 0.1403). Again, no net ESS cre-
ations or disruptions that were caused by either synonymous
or nonsynonymous changes were found. The same result was
obtained when the changes were collected together (Table S3
in Additional data file 1).
The above analysis, by averaging the changes in different cop-
ies and clusters of paralogs, may obscure the underlying
changes to some extent because the changes in different cop-
ies and in different paralogous exon pairs are discordant (Fig-
ure 3a, b). To support the above analysis further, each time we
only examined the changes generated in the High or Low copy
of each paralogous exon pair, as defined in the previous sec-
tion. This method may enlarge the changes to some extent,
but it is safe to test whether the changes are mainly caused by
synonymous mutations. As shown in Table 3, in the High
group, there were no net creations or disruptions for ESEs on
average (mean = 0.022805, P = 0.4164), but there were sig-
nificant net creations for ESSs (mean = 0.110604, P = 1.37E-
07). Both synonymous and nonsynonymous mutations pro-
duced more ESS creations (P = 0.000106 and 0.03008,
respectively), and the magnitude of net changes that were cre-
ated by synonymous mutations was larger (Wilcoxon signed-
rank test, P = 0.03114). In the Low group, net disruptions
were observed for both ESEs (mean = -0.31471, P = 7.6E-13)
and ESSs (mean = -0.0992, P = 1.72E-05). Moreover, the net
changes produced by synonymous mutations are again larger
(synonymous versus nonsynonymous, P = 0.01216 and 0.1173
for ESEs and ESSs, respectively). These findings are consist-
ent with a previous report that the ratio of ESE/ESS changes
are mostly caused by synonymous mutations [31] and suggest
splicing itself is the major factor influencing ESE and ESS
evolution.
ESE and ESS changes influence exon splicing isoforms
ESEs and ESSs function as regulatory elements to activate or
repress splicing of a certain exon [10,32]. The changes in
these elements should contribute to the formation of different
splicing isoforms (constitutive or alternative). To test this, we
compared the changes of ESEs and ESSs between alternative
and constitutive paralogous exons.
For comparison, all the paralogous exon pairs were divided
into two groups: exon pairs with the same exon splicing state
(AA or CC, non-AC group); and pairs with different types of
exon splicing state (AC, AC group). The density of ESEs or
ESSs between alternative and constitutive paralogous exon
copies in AC pairs was compared in a pairwise manner. The
alternative paralogous exon had significantly lower ESE and
higher ESS densities than their constitutive copy (Wilcoxon
signed-rank test, P = 0.02231 and 0.04243 for ESEs and
ESSs, respectively; Figure 5a; Table S4 in Additional data file
1). The exon pairs with the same splicing states could not be
deterministically divided into two groups, so the test for these
pairs is unavailable. However, the absolute difference of ESE/
ESS densities between paralogous exon pairs in AC pairs can
be compared to those in non-AC pairs. If the ESE/ESS ele-
ments are functional, we expect that there should be larger
differences in the AC pairs than non-AC pairs, and we do find
a larger absolute difference in AC exon pairs for both ESEs
and ESSs (Wilcoxon rank test, P = 0.04857 and 0.006637,
respectively; Figure 5b). These results suggest that ESEs and
ESSs are functional and that divergences in them can contrib-
ute to changes in exon splicing state. Usually, both ESEs and
ESSs changed in one exon. There is currently no effective way
to combine these two types of information so to do this we
Genome Biology 2009, Volume 10, Issue 11, Article R120 Zhang et al. R120.6
Genome Biology 2009, 10:R120
borrowed one parameter, the proportion of ESEs in an exon
(ESE.prop), as defined by the number of ESEs divided by the
sum of ESEs and ESSs in this exon [33] (see Materials and
methods for details). This parameter is a relatively good pre-
dictor for splicing state, when other splicing signals are con-
stant [33]. A larger ESE proportion means a higher
probability for this exon to be included in spliced transcripts.
Consistent with this property, alternative exons have a signif-
icantly lower ESE proportion than their constitutive partners
(Table S4 in Additional data file 1). There was no statistical
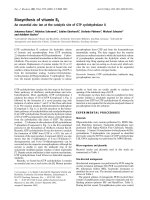
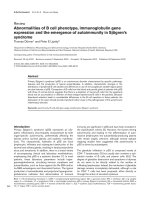
ESE and ESS gains and losses after gene duplicationFigure 2
ESE and ESS gains and losses after gene duplication. (a) Overall losses of ESEs are observed in different types of paralogous exon pairs (AC, AA, CC) when
compared to the genome-wide difference (Orth group). Futhermore, the AC and AA groups are significantly different from the CC group. Changes of
control motifs are also plotted to see how splicing affects the evolution of ESEs. (b) Unlike the ESEs, no significant differences were found when compared
to genomic differences (the Orth group). Similarly, the control motifs are displayed beside the ESS motifs. (c) The relative difference of ESEs is negatively
correlated with Ka, and (d) no correlation is found for ESSs. A corresponding plot with Ks as time proxy is shown in Additional data file 2. Error bars in
(a, c) show standard errors in each group.
AC AA CC All Orth
Motif
Control
fidESEevitaleRecneref
50.0-01.0-51.0-
50.000.0
(a)
AC AA CC All Orth
Motif
Control
fidSSEevitaleR ference
51.001.050.000.050.0-01.0-
(b)
0.0 0.1 0.2 0.3 0.4 0.5 0.6
0.1- -0.5
0.0 0.5
fidESEevitaleR ference
R = -0.1463
= 2.38E-07p
(c)
Ka
0.0 0.1 0.2 0.3 0.4 0.5 0.6
-1.0 -0.5 0.0 0.5 1.0
fidSSEevitaleR ference
R = 0.0252
=p 0.3903
(d)
Ka
SSEESE
Genome Biology 2009, Volume 10, Issue 11, Article R120 Zhang et al. R120.7
Genome Biology 2009, 10:R120
difference between alternative and constitutive exon copies
with regard to the 5' and 3' splice sites (Table S4 in Additional
data file 1). Unfortunately, there is not enough splicing infor-
mation for mouse exons to determine the path of the splicing
state changes of the human paralogous exons. Otherwise, we
could examine more how ESE and ESS changes affect the
splicing state shift.
Consistent with the above result, exons in the ESE Low group
tend to be alternative when compared to the High group
exons (28.70% versus 22.90%, P = 0.01642) (Table 4). In con-
trast, fewer alternative exons were observed in the ESS Low
group (24.35% versus 27.25%), though this is not statistically
significant (Table 4).
ESE and ESS divergence increases with the age of the dupli-
cation (Figure 1). It may also be possible that more splicing
state shifts will occur with evolutionary time. As predicted,
the proportion of AC pair exons increases with duplication
age (Spearman's rho = 0.8829187, P = 0.00845; Figure 6).
Interestingly, a decrease of AA pair exons was also observed,
although it was not significant (rho = -0.820032, P = 0.3879).
However, the changes before Ks <0.011 are not reliable, since
the exons with splicing information are too few to draw a reli-
able result (Additional data file 3).
Discussion
Several mechanisms for the creation of new gene structures
are known (reviewed in [4]). For example, duplication of ymp
followed by recombination of retroposed Adh generated the
jingwei gene [34]. However, evolution works like a tinker
[35], and gene duplication may be only the first step. Subse-
quent changes to the duplicated gene are also important for
sub-functionalization or neo-functionalization and deter-
mine the fates of duplicates [1,19,36]. In this study, we exam-
ined the divergence of splicing properties after gene
duplication.
ESE and ESS divergence contributes to new gene
structures and functional divergence
It has reported that alternative exons could be derived from
constitutive exons [31,37,38], possibly by weakening of 5'
splice sites [39]. Exon splicing regulatory elements also play
important roles in splicing state transitions [40], especially
under weak splice sites [31]. Consistent with this idea, we
observed lower ESE densities and higher ESS densities in
alternative exons than in their constitutive copies (Figure 5a).
We also checked if the alternative exons had lower splice site
scores, but there was no difference (Table S4 in Additional
data file 1). This result suggests that ESE/ESS changes, more
than splice site changes, are responsible for splicing state
transitions after gene duplication. Based on this, we specu-
lated that one copy of the CC exon pairs with large ESE/ESS
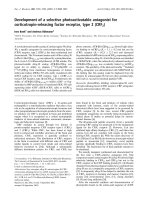
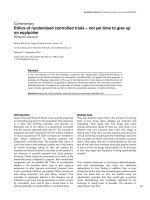
The diverse evolutionary pattern of ESEs and ESSs in asymmetric pairs of paralogous exonsFigure 3
The diverse evolutionary pattern of ESEs and ESSs in asymmetric pairs of paralogous exons. The values of relative difference compared to mouse
orthologs are plotted for each pair of paralogous exons. For easy visualization, we plot the copy with lower element density (Low) on the abscissa axis and
the other with higher density (High) on the ordinate axis. The mean genomic difference for human-mouse orthologous exons are shown by the blue lines
in each plot on both axes. The black diagonal line shows the pattern of symmetric evolution. (a) ESEs; (b) ESSs.
-0.8 -0.6 -0.4 -0.2 0.0 0.2
4.0- -0.2 0.0 0.2
ESE
Relative difference Low()
fidevitaleRecnerefhgiH
)(
(a)
-1.0 -0.5 0.0 0.5
8.06.04.02.00.02.0-
ESS
Relative difference Low()
fidevitaleR ference hgiH
)(
(b)
Genome Biology 2009, Volume 10, Issue 11, Article R120 Zhang et al. R120.8
Genome Biology 2009, 10:R120
changes may be on the verge of becoming alternatively
spliced, as any changes that relax the splicing signals would
result in alternatively spliced exons. Consistent with our idea,
a previous study proposed a model of alternative splicing evo-
lution relevant to duplicated genes. The model depicts that
alternative splicing isoforms are lost rapidly after gene dupli-
cation at an early stage and then new splicing isoforms evolve
at a late stage (see Figure 2 in [25]). Our results support this
model well (Figure 6). These new splicing isoforms that
evolved after gene duplication are valuable sources of new
gene structures. Some originally constitutive exons may be
alternatively spliced in a minor mode and even lost in the
future, depending on natural selection and genetic drift [31].
Similarly, some originally alternatively spliced exons may
become constitutive when they are beneficial. Compared to
other mechanisms of new gene structure origination, modifi-
cations of gene structures after gene duplication may require
fewer changes and changes of otherwise low impact, thus ren-
dering such a path to new structures relatively evolvable.
Divergence of splicing structures may also produce functional
divergence among duplicates. It is easy to think that ESE/ESS
changes that result in splicing state transitions will also result
in new splicing isoforms, which will, in turn, acquire novel
functions or partition ancestral functions. This may be real-
ized mainly by two categories of changes. Alternative splicing
could change functions by altering the expression of the gene,
such as expression level or the place and time of expression.
Alternative splicing is a subnetwork of gene regulation [16],
and, thus, the changes could influence gene expression
[32,41-44]. For example, alternative splicing is coupled with
nonsense-mediated mRNA decay to regulate gene expression
[45-47]. Previous studies showed that expression divergence
is partially caused by changes in promoter regulatory ele-
ments and related trans-acting factors [48-50]. However,
these changes could only explain 2 to 20% of expression
divergence [48,49], and a weak relationship is also found in
orthologs [51], which suggests that the promoter region is a
weak predictor of gene expression levels. We hypothesize that
alternative splicing is another possible way to alter expres-
sion. Since ESEs and ESSs are generally bound by specific fac-
tors in order to function, such as SR-proteins (for ESEs) and
heterogeneous nuclear ribonucleoproteins (for ESSs) [10].
These factors may be expressed in a tissue-specific manner,
such as nova [52-54]. These factors, combined with ESE/ESS
divergence, could result in different expression among differ-
ent tissues.
Consistent with this idea, Makova and Li [55] found that
many duplicates are expressed differentially in different tis-
sues. On the other hand, alternative splicing involves either
inclusion or skipping of certain regions or exons in the gene,
such that different protein products and structures are gener-
ated [56-59]. Alternative splicing could also change the read-
ing frame in certain regions of exons and, in turn, encode
different peptides [60]. Both mechanisms should be very
important for the evolution of new functions or subfunctions
that are different from the ancestral gene. Compared to cod-
ing sequence divergence, changes that are required in alter-
native splicing are maybe much more minor in order to reach
the same degree of divergence [36]. However, it is possible
that ESEs and ESSs may result in functional divergence in an
alternative-splicing-independent manner. For example, ESEs
may function as a transcriptional pause site [16], influence
the transcription rate, and, in turn, produce different expres-
sion levels.
A previous study reported the negative correlation between
coexpression and Ka [55]. In our study, we also found that
both ESE changes are negatively correlated with Ka (Figure
2). This suggests that ESE/ESS changes are coupled with pro-
tein sequence changes. This is very important as protein
sequence changes may help improve functionality when the
protein is expressed in a different place or time. Furthermore,
alternative splicing itself could alter the evolutionary rate of
alternative exons or regions by lowering purifying selection
pressure [61].
ESEs and ESSs are selected at alternative splicing and
protein levels
As ESEs and ESSs are mostly located within protein-coding
sequences, their changes possibly affect both the protein
sequence and splicing efficiency. Previous studies have pro-
posed that ESEs constrained protein sequence changes and
codon usage, especially in proximity to the exon boundary
[27,62,63]. These studies suggest selection of splicing on
ESEs inhibits the protein sequence changes and codon
choices. On the other hand, protein sequence changes should
also affect ESE/ESS motifs. Protein sequence divergence
after gene duplication is important to evolve new functions
[23,30]. Thus, the disruption and creation of ESEs/ESSs
caused by protein sequences may be inevitable. Consistent
with this idea, both creation and disruption could be caused
by nonsynonymous changes (Table 3). However, these non-
synonymous changes may be slightly deleterious and the pri-
mary force may actually be from the splicing selections. In
fact, the changes in ESEs/ESSs at nonsynonymous sites may
be selected at two levels, protein and splicing [26]. It will be
interesting to discriminate between the two types of selec-
tions and determine which is more predominant in future
studies. As the two types of selections may not always coordi-
nate, splicing selection should better operate at different
places, such as synonymous sites, which are independent of
protein sequence. Consistent with this, most ESE and ESS
changes are caused by synonymous mutations (Figure 4 and
Table 3). This result is also consistent with previous findings
that synonymous sites show a much clearer trend toward
increased evolutionary rate with increased distance from the
splice sites than nonsynonymous sites [64], which suggests
that splicing mainly acts on synonymous sites.
Genome Biology 2009, Volume 10, Issue 11, Article R120 Zhang et al. R120.9
Genome Biology 2009, 10:R120
The limitation of our studies
In this study, we do not include the intronic elements, such as
intronic splicing silencer and enhancers, due to lack of vali-
dated global sets of these motifs. It will be interesting to
determine how intronic elements have evolved after gene
duplication and their relationships with ESEs/ESSs, and 5'
and 3' start sites when the data sets are available. In fact, a sig-
nificant challenge in this area is determining the method by
which this information can be combined and by which exon
splicing could be predicted [13,16,18,32]. This would heavily
rely on our knowledge of splicing regulation. Although we
found higher ESS and lower ESE densities in alternative
exons than their constitutive copies, this is just an average
trend and does not mean that exons with higher ESS or lower
ESE densities are deterministically alternatively spliced.
Changes in ESEs or ESSs alone could not predict exon splic-
ing state accurately [65]. It is likely that understanding of
splicing element changes will improve when the 'splicing
code' [65,66] is well defined in the future.
We used the duplicates that occurred after the human-mouse
split, about 91 million years ago [67]. Therefore, the dupli-
cates in our datasets are relatively young. It will be interesting
to see how ESEs/ESSs evolve when duplicates over a long
evolutionary period are used in the future. On the other hand,
since only a limited fraction of exons in our mouse set was
mapped to the ASAP2 database [68], there is not enough exon
splicing state information for the mouse exons, which pre-
vents us from determining the direction of splicing state
changes. This should be extended in future analyses, when
mouse exon splicing data have accumulated. The newly
emerging high-throughput sequencing technology has pro-
vided a powerful tool in this direction [47,69-72].
Conclusions
Our results revealed the evolution pattern of exonic splicing
elements after gene duplication and its influence on exon
splicing. Furthermore the findings suggest that splicing
requirement but not protein sequence mostly determines the
changes of ESE and ESS. Combined with previous studies,
our results imply that alternative splicing changes after gene
duplication can have important roles in generating new splic-
ing isoforms and gene structures.
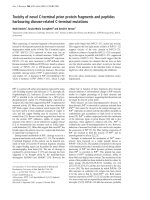
The creation and disruption of ESEs/ESSs in human duplicatesFigure 4
The creation and disruption of ESEs/ESSs in human duplicates. The
ordinate axis denotes the average number of ESEs or ESSs that were
changed in each exon. A negative value indicates a net disruption, and a
positive value indicates a net creation. Significant disruptions of ESEs are
found in both 'All' mutations and just synonymous mutations (see Table 3
for statistical tests). No significant net changes are found for the ESSs.
Error bars show standard errors in each group. The data shown here
merge the changes that occurred in each pair of paralogous exons. Please
see Table 3 for the changes when the High and Low groups are considered
separately.
ESE ESS
All
Nonsynonymous
Synonymous
segnahcSSE/ESE
3.0-4.0-2.0- -0.1 0.0 0.1
Table 3
ESE and ESS net changes in human duplicates
All P Non- synonymous P Synonymous P
ESEs Mean -0.3123 1.54E-05 -0.0642 0.1403 -0.2122* 2.93E-06
High 0.0228 0.4164 0.0308 0.2124 -0.0240 0.4879
Low -0.3147 7.6E-13 -0.0809 0.0023 -0.1870* 1.25E-08
ESSs Mean 0.0272 0.3491 -0.0087 0.9629 0.0163 0.5235
High 0.1106 1.37E-07 0.0285 0.0301 0.0604* 0.0001
Low -0.0992 1.72E-05 -0.0354 0.0095 -0.0559 0.0007
*The contribution of synonymous mutations to the net change of elements is significantly larger than that of nonsynonymous mutations (P < 0.05). In
each cell, the number is the mean net change for each exon that is caused by mutations. Positive values mean more creation than disruption, and
negative values the reverse. The 'mean' group merges the changes in each paralogous exon pair, while the High and Low groups include one of two
paralogous exons with the higher or lower ESE/ESS density, respectively. The number of homologous clusters used in this analysis is 921.
Genome Biology 2009, Volume 10, Issue 11, Article R120 Zhang et al. R120.10
Genome Biology 2009, 10:R120
Materials and methods
Identification of homologous exons
We downloaded the sequences and annotations for human
and mouse from the NCBI RefSeq [73] database (build 36.1)
[74] in January 2007. Any mRNAs for which the length in
nucleotides of the coding sequence was not a multiple of three
or that contain in-frame stop codons were excluded. The
exon-intron structure information from the annotation files
was then parsed using a Perl script.
To identify orthologs and paralogs for human and mouse, all
the human and mouse proteins were input into the Inpara-
noid program (version 1.35) [28,75,76], which was run with
the default parameters except for the overlap cutoff, which
was set to 0.8 to improve specificity. The Inparanoid program
is able to identify orthologs and in-paralogs (duplication that
occurred after speciation) between two species. Therefore, we
could obtain the orthologs between human and mouse and
the paralogs in human, which were generated after human-
mouse split (see the InParanoid FAQ [77] for details). Thus, it
is reasonable to assume the mouse orthologs are the pre-
duplication ancestors for the human paralogs.
To identify the homologous exons, the proteins in each para-
log cluster were aligned using MUSCLE [78] and then con-
verted to a coding sequence alignment using the BioPerl
utility aa_to_dna_aln [79,80]. The exon-intron information
was mapped on these alignments using Perl scripts. The par-
alogous exons were defined when they satisfied the following
two criteria: the two exons must align at least at one boundary
in the coding sequence alignment; and the two exons have the
same length. We obtained 2,074 paralogous exons with this
method (Additional data file 4). The same approach was
applied to the orthologous genes between human and mouse,
and 99,716 pairs of orthologous exons were identified (Addi-
tional data file 5). To improve the accuracy of homologous
exon identifications, only mRNAs with the 'NM_' prefix,
which generally have more experimental support, were used.
The first and last coding exons in each mRNA were also
excluded, as these exons are generally partially coding and
may have different properties.
Calculation of Ka and Ks
To calculate Ka and Ks, the coding sequence alignments gen-
erated above were input into the PAML package [81], and the
values were calculated using the CodeML program with the
parameter CodonFreq equal to F3X4, which is estimated
from the nucleotide composition at each of three codon
positions.
Scanning of ESEs and ESSs in exons
The 400 ESE and 217 ESS hexamers were collected from sup-
plementary Table S3 of Ke et al. [27]. These motifs combined
the hexamers from Burge and colleagues [19,21] and those
ESE and ESS divergence after gene duplication is associated with splicing state divergenceFigure 5
ESE and ESS divergence after gene duplication is associated with splicing state divergence. (a, b) Alternatively spliced exons show lower ESE and higher
ESS densities than their constitutive copies (a) and absolute density differences between paralogous exons in AC (one alternative and one constitutive
exon) pairs are larger than those in non-AC pairs for both ESEs and ESSs (b). Error bars in (a) show standard errors.
ESE ESS
fidytisneD)evitutitsnoC-evitanretlA(ecneref
-0.015 500.0- 0.005 0.015
ESE ESS
A-C
Non-A-C
fidytisnedetulosbA ference
50.040.030.020.010.000.0
(a)
(b)
Genome Biology 2009, Volume 10, Issue 11, Article R120 Zhang et al. R120.11
Genome Biology 2009, 10:R120
enriched in octamers from Zhang and Chasin [20]. These ESE
and ESS hexamers were scanned separately in each exon
using a Perl script, and their occurrences were denoted by the
fraction of positions that were covered by motifs, which are
given as density(ESE) and density(ESS), respectively. To
quantify the changes (loss and gain) of ESEs and ESSs when
compared to the mouse orthologs, the following formula,
which is analogous to the method used by Corvelo and Eyras
[82], was used:
where density
human
and density
mouse
are the motif densities
for human and mouse genes, respectively, and the function
max gets the larger value of the two. A positive value indicates
a gain of motifs and a negative value indicates a loss of motifs.
The ESE proportion for each is calculated as ESE count
divided by the sum of ESE and ESS counts, like that described
by Zhang et al. [33].
In order to get the control ESE and ESS motifs, as described
in [27], the ESE motifs were converted into their reverse and
complementary sequences, and original ESE sequences were
purged from the converted sequences. The end result was 327
real ESE and 327 control ESE motifs. The same approach was
applied to ESSs and resulted in 153 real ESS and 153 control
ESS motifs. The new sets of motifs were searched separately,
and compared to the real and control motifs.
In this study, we use the list of ESEs and ESSs that was com-
piled for humans and applied this list in a search of the mouse
genome, since there is no validated ESS list for the mouse.
This should have a systematic influence on the scanning of
ESEs/ESSs in the mouse genome but should not change our
conclusions, since we used the orthologous exon pairs as a
control.
Testing the asymmetric evolution of paralogous exons
To determine the asymmetric divergence of the two paralo-
gous exons, we employ a method similar to that in [24]. Given
a sequence alignment of two paralogous exons, we can scan
the sequence one base at a time and detect the ESE or ESS
hexamers specific to either exon and those shared by both
sequences at the same position of the alignment. Assuming
that there are totally n1 and n2 ESE elements observed in two
paralogous exons and b of them are observed at the same
position of the alignment, we regard these b ESE elements as
conserved. Then there are d1 = n1 - b and d2 = n2 - b ESE ele-
ments specific to one of the two exons and these difference
should be caused by gains and/or losses after gene duplica-
tion. If the two exons evolve in a symmetric mode, d1 and d2
should comply with the binomial distribution B(d1 + d2, 0.5).
The probability P of observing a disparity as large as or
greater than the actual one between d1 and d2 by chance
alone is calculated by summing over the tails of the binomial
distribution:
and P = 1 for d1 = d2. To minimize the noise, we exclude the
exon pairs with the total difference d1 + d2 less than 6, which
is the minimum to get a P-value of 0.05 in the most asymmet-
ric situation. This resulted in 1,089 and 454 testable exon
pairs for ESEs and ESSs, respectively.
Splicing score calculation
The tool MaxEntScan [83,84] was used to calculate the scores
for the 5' and 3' splice sites. The 5' splice site includes three
bases in the exon and six bases in the intron. The 3' splice site
includes 20 bases in the intron and 3 bases in the exon.
Exon splicing state classification
To determine the splicing state (alternative or constitutive)
for each exon, as described in [85], we mapped the ASAP2
database [68] exons to our exon sets by their positions on the
chromosomes. The exon splicing states were then extracted
from the ASAP2 database, which, in turn, allowed us to obtain
the splicing states for our exons.
Creation and disruption of ESEs/ESSs
To determine the mutations that create or disrupt ESEs/ESSs
after gene duplication in human paralogs, the human exon
coding sequences were aligned with mouse orthologous exons
Relative difference =
−density
human
density
mouse
density
hu
max(
mman
density
mouse
,)
P
dd
dd
dd
dd
=
+
⎛
⎝
⎜
⎞
⎠
⎟
×≠
+
∑
2
12
05
05 1 2
12
0
12
.
.,
min( , )
Table 4
Alternative and constitutive exon counts in the ESE/ESS High and Low groups
High Low
A C Proportion of A A C Proportion of A P*
ESEs 158 532 22.90% 198 492 28.70% 0.01642
ESSs 188 502 27.25% 168 522 24.35% 0.2424
A and C denote the alternative and constitutive exons, respectively. 'High' and 'Low' groups represent the member exons with higher or lower ESE/
ESS densities in each pair, respectively. *P-value is determined from a test if the proportion of alternative exons is different between the High and
Low groups.
Genome Biology 2009, Volume 10, Issue 11, Article R120 Zhang et al. R120.12
Genome Biology 2009, 10:R120
using their peptide alignment as a guide. For each pair of par-
alogous exons, only the mutational positions that were differ-
ent within this pair of exons were considered, in order to
ensure that the examined mutations occurred after gene
duplication. The bases were compared to mouse orthologs at
each mutation position in order to decide the mutational
direction. Only those cases in which one of a pair of paralo-
gous exons is the same as the mouse ortholog are considered,
because this will enable determination of the sequence in
which the mutation happened.
After determining the mutational direction, the six hexamers
that overlapped the changed bases in the paralog were com-
pared to aligned six hexamers in the ancestor to determine a
net loss or gain of ESEs or ESSs. If there are more ESEs or
ESSs in the ancestor, this mutation is likely a disruption, and,
if it is vice versa, then the mutation is likely a creation. Note
the two hexamers under comparison must contain only one
mutation to exclude the possibility that the motif loss or gain
is caused by mutations other than the one we are focused on.
Abbreviations
ESE: exonic splicing enhancer; ESS: exonic splicing silencer;
Ka: nonsynonymous substitution rate; Ks: synonymous sub-
stitution rate.
Authors' contributions
XK, ZZ and LZ conceived and designed the experiments. ZZ
and LZ performed the experiments. ZZ analyzed the data. LZ,
PW, YL and XC contributed reagents/materials/analysis
tools. ZZ, LZ, XK and LH wrote the paper.
Additional data files
The following additional data are available with the online
version of this paper: a document providing supplementary
materials, including supplementary Tables S1, S2, S3 and S4
(Additional data file 1); a figure showing the relationship
between ESE/ESS changes and Ks (Additional data file 2); a
figure providing the counts of different types of paralogous
exon pairs in each Ks group (Additional data file 3); a dataset
listing all the human paralogous exon pairs used in this study
(Additional data file 4); the complete list of human-mouse
orthologous exon pairs used in this study (Additional data file
5).
Additional data file 1Supplementary materialsSupplementary Tables S1, S2, S3 and S4.Click here for fileAdditional data file 2Relationship between ESE/ESS changes and KsThis figures is same as Figure 2c, d, except that Ks is used as the proxy of gene duplication age.Click here for fileAdditional data file 3Counts of different types of paralogous exon pairs in each Ks groupPlot of number of paralogous exons in each Ks group.Click here for fileAdditional data file 4Human paralogous exon pairs used in this studyThis file contains the complete list of 2,074 paralogous exon pairs and their genomic information used in this study.Click here for fileAdditional data file 5Human-mouse orthologous exon pairs used in this studyThe complete list of 99,716 human-mouse orthologous exon pairs used in this study and their genomic information.Click here for file
Acknowledgements
We would like to thank Dr. Laurence D Hurst for critical comments and
kind help in the manuscript preparation and thank Mrs Suchao Chen, Zhen
Wang and Dr Zhixi Su for helpful discussions. We also would like to thank
the two anonymous referees for their constructive suggestions for improv-
ing our manuscript. This work is supported by the National High Technol-
ogy Research and Development Program of China (2006AA02Z330,
2006AA02A301), the National Basic Research Program of China (No.
2007CB512202, 2004CB518603), the National Natural Science Foundation
of China, Key Program (No.30530450), and the Knowledge Innovation Pro-
gram of the Chinese Academy of Sciences (Grant No. KSCX1-YW-R-74).
The funders had no role in study design, data collection and analysis, deci-
sion to publish, or preparation of the manuscript.
References
1. Katju V, Lynch M: On the formation of novel genes by duplica-
tion in the Caenorhabditis elegans genome. Mol Biol Evol 2006,
23:1056-1067.
2. Otto SP, Yong P: The evolution of gene duplicates. Adv Genet
2002, 46:451-483.
3. Long M: Evolution of novel genes. Curr Opin Genet Dev 2001,
11:673-680.
4. Long M, Betran E, Thornton K, Wang W: The origin of new genes:
glimpses from the young and old. Nat Rev Genet 2003,
4:865-875.
5. Calarco JA, Xing Y, Caceres M, Calarco JP, Xiao X, Pan Q, Lee C,
Preuss TM, Blencowe BJ: Global analysis of alternative splicing
differences between humans and chimpanzees. Genes Dev
2007, 21:2963-2975.
6. Talavera D, Vogel C, Orozco M, Teichmann SA, de la Cruz X: The
(in)dependence of alternative splicing and gene duplication.
PLoS Comput Biol 2007, 3:e33.
7. Guan Q, Zheng W, Tang S, Liu X, Zinkel RA, Tsui KW, Yandell BS,
Culbertson MR: Impact of nonsense-mediated mRNA decay
on the global expression profile of budding yeast. PLoS Genet
2006, 2:e203.
8. Kopelman NM, Lancet D, Yanai I: Alternative splicing and gene
duplication are inversely correlated evolutionary
mechanisms. Nat Genet 2005, 37:588-589.
9. Pan Q, Bakowski MA, Morris Q, Zhang W, Frey BJ, Hughes TR, Blen-
cowe BJ: Alternative splicing of conserved exons is frequently
species-specific in human and mouse. Trends Genet 2005,
21:73-77.
10. Black DL: Mechanisms of alternative pre-messenger RNA
splicing. Annu Rev Biochem 2003, 72:291-336.
11. Blencowe BJ: Alternative splicing: new insights from global
The fractions of different types of exon pairs with age of duplicationFigure 6
The fractions of different types of exon pairs with age of duplication.
AC
AA
CC
noitcarfriapnoxE
8.06.04.02.00.0
0
0.0038
0.0107
0.0528
0.108
0.192
0.3194
Ks range
Genome Biology 2009, Volume 10, Issue 11, Article R120 Zhang et al. R120.13
Genome Biology 2009, 10:R120
analyses. Cell 2006, 126:37-47.
12. Solis AS, Shariat N, Patton JG: Splicing fidelity, enhancers, and
disease. Front Biosci 2008, 13:1926-1942.
13. Hertel KJ: Combinatorial control of exon recognition. J Biol
Chem 2008, 283:1211-1215.
14. Lim LP, Burge CB: A computational analysis of sequence fea-
tures involved in recognition of short introns. Proc Natl Acad
Sci USA 2001, 98:11193-11198.
15. Blencowe BJ, Bowman JA, McCracken S, Rosonina E: SR-related
proteins and the processing of messenger RNA precursors.
Biochem Cell Biol 1999, 77:277-291.
16. Wang Z, Burge CB: Splicing regulation: from a parts list of reg-
ulatory elements to an integrated splicing code. Rna 2008,
14:802-813.
17. Graveley BR: Sorting out the complexity of SR protein
functions. Rna 2000, 6:1197-1211.
18. Chasin LA: Searching for splicing motifs. Adv Exp Med Biol 2007,
623:85-106.
19. Fairbrother WG, Yeh RF, Sharp PA, Burge CB: Predictive identifi-
cation of exonic splicing enhancers in human genes. Science
2002, 297:1007-1013.
20. Zhang XH, Chasin LA: Computational definition of sequence
motifs governing constitutive exon splicing. Genes Dev 2004,
18:1241-1250.
21. Wang Z, Rolish ME, Yeo G, Tung V, Mawson M, Burge CB: System-
atic identification and analysis of exonic splicing silencers.
Cell 2004,
119:831-845.
22. Goren A, Ram O, Amit M, Keren H, Lev-Maor G, Vig I, Pupko T, Ast
G: Comparative analysis identifies exonic splicing regulatory
sequences - the complex definition of enhancers and
silencers. Mol Cell 2006, 22:769-781.
23. Jones CD, Begun DJ: Parallel evolution of chimeric fusion
genes. Proc Natl Acad Sci USA 2005, 102:11373-11378.
24. Wagner A: Asymmetric functional divergence of duplicate
genes in yeast. Mol Biol Evol 2002, 19:1760-1768.
25. Su Z, Wang J, Yu J, Huang X, Gu X: Evolution of alternative splic-
ing after gene duplication. Genome Res 2006, 16:182-189.
26. Warnecke T, Weber CC, Hurst LD: Why there is more to pro-
tein evolution than protein function: splicing, nucleosomes
and dual-coding sequence. Biochem Soc Trans 2009, 37:756-761.
27. Ke S, Zhang XH, Chasin LA: Positive selection acting on splicing
motifs reflects compensatory evolution. Genome Res 2008,
18:533-543.
28. Remm M, Storm CE, Sonnhammer EL: Automatic clustering of
orthologs and in-paralogs from pairwise species
comparisons. J Mol Biol 2001, 314:1041-1052.
29. Lynch M, Conery JS: The evolutionary fate and consequences of
duplicate genes. Science 2000, 290:1151-1155.
30. Ohno S: Evolution by Gene Duplication Berlin: Springer; 1970.
31. Lev-Maor G, Goren A, Sela N, Kim E, Keren H, Doron-Faigenboim A,
Leibman-Barak S, Pupko T, Ast G: The "alternative" choice of
constitutive exons throughout evolution. PLoS Genet 2007,
3:e203.
32. Matlin AJ, Clark F, Smith CW: Understanding alternative splic-
ing: towards a cellular code. Nat Rev Mol Cell Biol 2005,
6:386-398.
33. Zhang XH, Arias MA, Ke S, Chasin LA: Splicing of designer exons
reveals unexpected complexity in pre-mRNA splicing. Rna
2009, 15:
367-376.
34. Long M, Langley CH: Natural selection and the origin of jingwei,
a chimeric processed functional gene in Drosophila. Science
1993, 260:91-95.
35. Jacob F: Evolution and tinkering. Science 1977, 196:1161-1166.
36. Force A, Lynch M, Pickett FB, Amores A, Yan YL, Postlethwait J:
Preservation of duplicate genes by complementary, degen-
erative mutations. Genetics 1999, 151:1531-1545.
37. Koren E, Lev-Maor G, Ast G: The emergence of alternative 3'
and 5' splice site exons from constitutive exons. PLoS Comput
Biol 2007, 3:e95.
38. Kim E, Goren A, Ast G: Alternative splicing: current
perspectives. Bioessays 2008, 30:38-47.
39. Ast G: How did alternative splicing evolve? Nat Rev Genet 2004,
5:773-782.
40. Kralovicova J, Vorechovsky I: Global control of aberrant splice-
site activation by auxiliary splicing sequences: evidence for a
gradient in exon and intron definition. Nucleic Acids Res 2007,
35:6399-6413.
41. Wegmann D, Dupanloup I, Excoffier L: Width of gene expression
profile drives alternative splicing. PLoS ONE 2008, 3:e3587.
42. Cheah MT, Wachter A, Sudarsan N, Breaker RR: Control of alter-
native RNA splicing and gene expression by eukaryotic
riboswitches. Nature 2007, 447:497-500.
43. Elton TS, Martin MM: Alternative splicing: a novel mechanism
to fine-tune the expression and function of the human AT1
receptor. Trends Endocrinol Metab 2003, 14:66-71.
44. Shin C, Manley JL: Cell signalling and the control of pre-mRNA
splicing. Nat Rev Mol Cell Biol 2004, 5:727-738.
45. Cuccurese M, Russo G, Russo A, Pietropaolo C: Alternative splic-
ing and nonsense-mediated mRNA decay regulate mamma-
lian ribosomal gene expression. Nucleic Acids Res 2005,
33:5965-5977.
46. Lareau LF, Brooks AN, Soergel DA, Meng Q, Brenner SE: The cou-
pling of alternative splicing and nonsense-mediated mRNA
decay. Adv Exp Med Biol 2007, 623:190-211.
47. Saltzman AL, Kim YK, Pan Q, Fagnani MM, Maquat LE, Blencowe BJ:
Regulation of multiple core spliceosomal proteins by alter-
native splicing-coupled nonsense-mediated mRNA decay.
Mol Cell Biol 2008, 28:4320-4330.
48. Leach LJ, Zhang Z, Lu C, Kearsey MJ, Luo Z: The role of cis-regu-
latory motifs and genetical control of expression in the diver-
gence of yeast duplicate genes. Mol Biol Evol 2007, 24:2556-2565.
49. Su AI, Wiltshire T, Batalov S, Lapp H, Ching KA, Block D, Zhang J,
Soden R, Hayakawa M, Kreiman G, Cooke MP, Walker JR, Hogenesch
JB: A gene atlas of the mouse and human protein-encoding
transcriptomes. Proc Natl Acad Sci USA 2004, 101:6062-6067.
50. Pal C, Papp B, Hurst LD: Highly expressed genes in yeast evolve
slowly. Genetics 2001, 158:927-931.
51. Chiba H, Yamashita R, Kinoshita K, Nakai K: Weak correlation
between sequence conservation in promoter regions and in
protein-coding regions of human-mouse orthologous gene
pairs. BMC Genomics 2008, 9:152.
52. Jensen KB, Dredge BK, Stefani G, Zhong R, Buckanovich RJ, Okano
HJ, Yang YY, Darnell RB: Nova-1 regulates neuron-specific
alternative splicing and is essential for neuronal viability.
Neuron 2000, 25:359-371.
53. Buckanovich RJ, Yang YY, Darnell RB: The onconeural antigen
Nova-1 is a neuron-specific RNA-binding protein, the activity
of which is inhibited by paraneoplastic antibodies. J Neurosci
1996, 16:1114-1122.
54. Ule J, Jensen KB, Ruggiu M, Mele A, Ule A, Darnell RB: CLIP identi-
fies Nova-regulated RNA networks in the brain. Science 2003,
302:1212-1215.
55. Makova KD, Li WH: Divergence in the spatial pattern of gene
expression between human duplicate genes. Genome Res 2003,
13:1638-1645.
56. Kondrashov FA, Koonin EV: Evolution of alternative splicing:
deletions, insertions and origin of functional parts of proteins
from intron sequences. Trends Genet 2003, 19:115-119.
57. Shionyu M, Yamaguchi A, Shinoda K, Takahashi K, Go M: AS-ALPS:
a database for analyzing the effects of alternative splicing on
protein structure, interaction and network in human and
mouse. Nucleic Acids Res 2009, 37:D305-309.
58. Birzele F, Kuffner R, Meier F, Oefinger F, Potthast C, Zimmer R: Pro-
SAS: a database for analyzing alternative splicing in the con-
text of protein structures. Nucleic Acids Res 2008, 36:D63-68.
59. Stetefeld J, Ruegg MA: Structural and functional diversity gen-
erated by alternative mRNA splicing. Trends Biochem Sci 2005,
30:515-521.
60. Liang H, Landweber LF: A genome-wide study of dual coding
regions in human alternatively spliced genes. Genome Res
2006, 16:190-196.
61. Xing Y, Lee C: Evidence of functional selection pressure for
alternative splicing events that accelerate evolution of pro-
tein subsequences. Proc Natl Acad Sci USA 2005, 102:13526-13531.
62. Parmley JL, Urrutia AO, Potrzebowski L, Kaessmann H, Hurst LD:
Splicing and the evolution of proteins in mammals. PLoS Biol
2007, 5:e14.
63. Parmley JL, Hurst LD: Exonic splicing regulatory elements skew
synonymous codon usage near intron-exon boundaries in
mammals. Mol Biol Evol 2007, 24:1600-1603.
64. Dewey CN, Rogozin IB, Koonin EV: Compensatory relationship
between splice sites and exonic splicing signals depending on
the length of vertebrate introns. BMC Genomics 2006, 7:311.
65. Irimia M, Rukov JL, Roy SW: Evolution of alternative splicing
regulation: changes in predicted exonic splicing regulators
are not associated with changes in alternative splicing levels
Genome Biology 2009, Volume 10, Issue 11, Article R120 Zhang et al. R120.14
Genome Biology 2009, 10:R120
in primates. PLoS One 2009, 4:e5800.
66. Fu XD: Towards a splicing code. Cell 2004, 119:736-738.
67. Hedges SB: The origin and evolution of model organisms. Nat
Rev Genet 2002, 3:838-849.
68. Kim N, Alekseyenko AV, Roy M, Lee C: The ASAP II database:
analysis and comparative genomics of alternative splicing in
15 animal species. Nucleic Acids Res 2007, 35:D93-98.
69. Carninci P, Kasukawa T, Katayama S, Gough J, Frith MC, Maeda N,
Oyama R, Ravasi T, Lenhard B, Wells C, Kodzius R, Shimokawa K,
Bajic VB, Brenner SE, Batalov S, Forrest AR, Zavolan M, Davis MJ,
Wilming LG, Aidinis V, Allen JE, Ambesi-Impiombato A, Apweiler R,
Aturaliya RN, Bailey TL, Bansal M, Baxter L, Beisel KW, Bersano T,
Bono H, et al.: The transcriptional landscape of the mamma-
lian genome. Science 2005, 309:1559-1563.
70. Wang Z, Gerstein M, Snyder M: RNA-Seq: a revolutionary tool
for transcriptomics. Nat Rev Genet 2009, 10:57-63.
71. Wilhelm BT, Marguerat S, Watt S, Schubert F, Wood V, Goodhead I,
Penkett CJ, Rogers J, Bahler J: Dynamic repertoire of a eukaryo-
tic transcriptome surveyed at single-nucleotide resolution.
Nature 2008, 453:1239-1243.
72. Karolchik D, Kuhn RM, Baertsch R, Barber GP, Clawson H, Diekhans
M, Giardine B, Harte RA, Hinrichs AS, Hsu F, Kober KM, Miller W,
Pedersen JS, Pohl A, Raney BJ, Rhead B, Rosenbloom KR, Smith KE,
Stanke M, Thakkapallayil A, Trumbower H, Wang T, Zweig AS, Haus-
sler D, Kent WJ: The UCSC Genome Browser Database: 2008
update. Nucleic Acids Res 2008, 36:D773-779.
73. Pruitt KD, Tatusova T, Maglott DR: NCBI reference sequences
(RefSeq): a curated non-redundant sequence database of
genomes, transcripts and proteins. Nucleic Acids Res 2007,
35:D61-65.
74. National Center for Biotechnology Information ftp
[ftp://
ftp.ncbi.nih.gov/genomes]
75. Berglund AC, Sjolund E, Ostlund G, Sonnhammer EL: InParanoid 6:
eukaryotic ortholog clusters with inparalogs. Nucleic Acids Res
2008, 36:D263-266.
76. InParanoid: Eukaryotic Ortholog Groups [http://inpara
noid.sbc.su.se/]
77. InParanoid FAQ [ />78. Edgar RC: MUSCLE: multiple sequence alignment with high
accuracy and high throughput. Nucleic Acids Res 2004,
32:1792-1797.
79. Stajich JE: An introduction to BioPerl. Methods Mol Biol 2007,
406:535-548.
80. Stajich JE, Block D, Boulez K, Brenner SE, Chervitz SA, Dagdigian C,
Fuellen G, Gilbert JG, Korf I, Lapp H, Lehväslaiho H, Matsalla C, Mun-
gall CJ, Osborne BI, Pocock MR, Schattner P, Senger M, Stein LD,
Stupka E, Wilkinson MD, Birney E: The Bioperl toolkit: Perl mod-
ules for the life sciences. Genome Res 2002, 12:1611-1618.
81. Yang Z, Nielsen R: Estimating synonymous and nonsynony-
mous substitution rates under realistic evolutionary models.
Mol Biol Evol 2000, 17:32-43.
82. Corvelo A, Eyras E: Exon creation and establishment in human
genes. Genome Biol 2008, 9:R141.
83. Yeo G, Burge CB: Maximum entropy modeling of short
sequence motifs with applications to RNA splicing signals. J
Comput Biol 2004, 11:377-394.
84. MaxEntScan [ />Xmaxentscan_scoreseq.html]
85. Zhang Z, Xin D, Wang P, Zhou L, Hu L, Kong X, Hurst LD: Noisy
splicing, more than expression regulation, explains why
some exons are subject to nonsense-mediated mRNA decay.
BMC Biol 2009, 7:23.