Báo cáo y học: "Serum-dependent transcriptional networks identify distinct functional roles for H-Ras and N-Ras during initial stages of the cell cycle" doc
Bạn đang xem bản rút gọn của tài liệu. Xem và tải ngay bản đầy đủ của tài liệu tại đây (1.68 MB, 24 trang )
Genome Biology 2009, 10:R123
Open Access
2009Castellanoet al.Volume 10, Issue 11, Article R123
Research
Serum-dependent transcriptional networks identify distinct
functional roles for H-Ras and N-Ras during initial stages of the cell
cycle
Esther Castellano
*†
, Carmen Guerrero
*
, Alejandro Núñez
*
, Javier De Las
Rivas
*
and Eugenio Santos
*
Addresses:
*
Centro de Investigación del Cáncer, IBMCC (CSIC-USAL), University of Salamanca, Campus Unamuno, 37007 Salamanca, Spain.
†
Current address: Signal Transduction Laboratory, Cancer Research UK London Research Institute, 44 Lincoln's Inn Fields, London WC2A
3PX, UK.
Correspondence: Eugenio Santos. Email:
© 2009 Castellano et al.; licensee BioMed Central Ltd.
This is an open access article distributed under the terms of the Creative Commons Attribution License ( which
permits unrestricted use, distribution, and reproduction in any medium, provided the original work is properly cited.
Ras isoforms and the cell cycle<p>Transcriptional and functional analysis reveals that the H-Ras and N-Ras isoforms have different roles in the initial phases of the mouse cell cycle</p>
Abstract
Background: Using oligonucleotide microarrays, we compared transcriptional profiles
corresponding to the initial cell cycle stages of mouse fibroblasts lacking the small GTPases H-Ras
and/or N-Ras with those of matching, wild-type controls.
Results: Serum-starved wild-type and knockout ras fibroblasts had very similar transcriptional
profiles, indicating that H-Ras and N-Ras do not significantly control transcriptional responses to
serum deprivation stress. In contrast, genomic disruption of H-ras or N-ras, individually or in
combination, determined specific differential gene expression profiles in response to post-
starvation stimulation with serum for 1 hour (G0/G1 transition) or 8 hours (mid-G1 progression).
The absence of N-Ras caused significantly higher changes than the absence of H-Ras in the wave of
transcriptional activation linked to G0/G1 transition. In contrast, the absence of H-Ras affected the
profile of the transcriptional wave detected during G1 progression more strongly than did the
absence of N-Ras. H-Ras was predominantly functionally associated with growth and proliferation,
whereas N-Ras had a closer link to the regulation of development, the cell cycle,
immunomodulation and apoptosis. Mechanistic analysis indicated that extracellular signal-regulated
kinase (ERK)-dependent activation of signal transducer and activator of transcription 1 (Stat1)
mediates the regulatory effect of N-Ras on defense and immunity, whereas the pro-apoptotic
effects of N-Ras are mediated through ERK and p38 mitogen-activated protein kinase signaling.
Conclusions: Our observations confirm the notion of an absolute requirement for different peaks
of Ras activity during the initial stages of the cell cycle and document the functional specificity of H-
Ras and N-Ras during those processes.
Published: 6 November 2009
Genome Biology 2009, 10:R123 (doi:10.1186/gb-2009-10-11-r123)
Received: 2 July 2009
Accepted: 6 November 2009
The electronic version of this article is the complete one and can be
found online at /> Genome Biology 2009, Volume 10, Issue 11, Article R123 Castellano et al. R123.2
Genome Biology 2009, 10:R123
Background
The mammalian H-Ras, N-Ras and K-Ras proteins are highly
related small GTPases functioning as critical components of
cellular signaling pathways controlling proliferation, differ-
entiation or survival. They act as molecular switches cycling
between inactive (GDP-bound) and active (GTP-bound)
states in a process modulated under physiological conditions
by a variety of specific regulatory proteins, including GAPs
(GTPase activating proteins) and GEFs (guanine nucleotide
exchange factors) [1-3]. Hyperactivating point mutations of
these proteins are frequently associated with pathological
conditions, particularly the development of various forms of
human cancer [4,5]. The three main mammalian ras genes
appear to be ubiquitously expressed, although specific differ-
ences have been reported for particular isoforms regarding
their expression levels in different cell types and tissues or
their intracellular processing and subsequent location to dif-
ferent subcellular compartments [1,3].
Early studies focusing on the shared sequence homology and
identical in vitro effector activation pathways suggested that
the three Ras protein isoforms were functionally redundant
[2,4]. However, many other reports based on different exper-
imental approaches support the notion that these three mem-
bers of the Ras family may play specialized cellular roles
[1,3,6]. Thus, the preferential activation of specific ras genes
in particular tumor types [4,5], the different transforming
potential of transfected ras genes in different cellular con-
texts [7,8], the distinct sensitivities exhibited by different Ras
family members for functional interactions with their GAPs,
GEFs or downstream effectors [9-15], or differences among
Ras isoforms regarding their intracellular processing path-
ways and their differential compartmentalization to specific
plasma membrane microdomains or intracellular compart-
ments [12,14,16-21] provide strong evidence in favor of the
notion of functional specificity. The study of Ras knockout
strains provides additional in vivo evidence for functional
specificity. Thus, whereas disruption of K-ras 4B is embry-
onic lethal [22,23], H-ras, N-ras and K-ras4A single knock-
out mice and H-ras/N-ras double knockout mice are
perfectly viable [22,24-26], indicating that only K-ras is nec-
essary and sufficient for full embryonic development and sug-
gesting that K-Ras performs specific function(s) that cannot
be carried out by either H-Ras or N-Ras. A recent study
describing that the knock-in of H-ras at the K-ras locus
results in viable adult mice [27] suggests that the mortality of
K-ras knockout may derive not from intrinsic inability of the
other Ras isoforms to compensate for K-Ras function but
rather from their inability to be expressed in the same loca-
tions (embryonic compartments) or at the same time (devel-
opmental stage) as K-Ras. Finally, additional experimental
support for the notion of functional specificity of H-, N- and
K-Ras proteins derives from genomic or proteomic profiling
of cell lines transformed by exogenous ras oncogenes [28-34]
or devoid of specific Ras proteins [35]. In particular, our
recent characterization of the transcriptional networks of
actively growing cultures of fibroblast cells harboring single
or double null mutations in the H-ras
and N-ras loci clearly
supported the notion of different functions for H-Ras and N-
Ras by documenting a significant involvement of N-Ras in
immunomodulation/defense and apoptotic responses [35].
It is also well established that Ras proteins play capital roles
in regulation of the initiation and progression of the cell cycle
[1,3,5,36]. A number of reports have documented the abso-
lute requirement for Ras activity at different points between
G0 and S phase, after growth factor stimulation of quiescent,
serum-arrested (G0) cells. Indeed, the available experimental
evidence indicates that the contribution of Ras activity is
absolutely needed for both the initial entry into the cell cycle
(G0/G1 transition) and for the subsequent G1 progression, in
a process to which multiple Ras effector pathways can con-
tribute [36-41]. However, the exact mechanisms regulating
the participation of Ras proteins in cell cycle activation and
subsequent progression are still largely unknown. It is also
unknown whether the different Ras isoforms play specific or
redundant functional roles in those processes.
Our previous characterization of the transcriptional profiles
of unsynchronized, exponentially growing cultures of H-ras
and N-ras knockout fibroblasts in the presence of serum dem-
onstrated the functional specificity of those proteins in prolif-
erating, actively cycling cells [35]. In this report, we were
specifically interested in ascertaining whether N-Ras and H-
Ras play also specific - or redundant - functional roles during
the initial stages of the cell cycle. In particular, we wished to
characterize the participation, if any, of these proteins in the
process of entry into the cell cycle of G0, growth arrested cells
(G0/G1 transition) and the subsequent steps of progression
through early G1. For this purpose, we used commercial
microarrays to characterize the profiles of genomic expres-
sion of wild-type (WT) and ras knockout fibroblasts (H-ras
-/
-
, N-ras
-/-
, H-ras
-/-
/N-ras
-/-
) that had been subjected to
serum starvation (G0) or to subsequent incubation in the
presence of serum for a short, 1-hour period (G0/G1 transi-
tion) or for 8 hours (mid-G1 progression). Our data support
the notion of functional specificity for H-Ras and N-Ras by
documenting the occurrence of specific transcriptional pro-
files associated with the absence of H-Ras and/or N-Ras dur-
ing defined moments of the early stages of the cell cycle.
Results
Analysis of serum-dependent, transcriptional profiles
in wild-type and ras knockout fibroblasts
To ascertain whether or not the different members of the Ras
family control the expression of specific gene sets in response
to the absence or presence of serum in cell cultures, we used
commercial oligonucleotide microarrays to compare the
genomic expression profile of serum-starved or serum-
treated, WT, immortalized fibroblasts with those of similarly
treated fibroblasts derived from knockout mice harboring
Genome Biology 2009, Volume 10, Issue 11, Article R123 Castellano et al. R123.3
Genome Biology 2009, 10:R123
single- or double-null mutations for the H-ras and N-ras loci
(H-ras
-/-
, N-ras
-/-
, H-ras
-/-
/N-ras
-/-
). For this purpose, we
analyzed representative RNA samples extracted from cell cul-
tures of the mentioned WT and ras knockout genotypes that
had been subjected to 24 hours of serum deprivation (Figure
1, 0 h), or to incubation in the presence of serum for 1 hour or
8 hours after the previous 24-hour starvation period (Figure
1, 1 h or 8 h). The results from microarray hybridizations cor-
responding to cell cultures subjected to serum starvation for
24 hours were instrumental to characterize the transcrip-
tional profile of non-proliferating, off-cycle fibroblasts
arrested in G0 because of the absence of growth factors
caused by serum withdrawal from the cultures. Addition of
serum to the starved (G0) cell cultures causes re-entry of the
growth-arrested cells into the cell cycle, thus starting progres-
sion through G1 in a process involving an absolute require-
Microarray analysis of differential gene expression in wild-type and knockout fibroblasts (H-ras
-/-
, N-ras
-/-
and H-ras
-/-
/N-ras
-/-
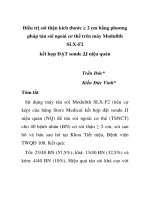
) subjected to serum starvation or stimulationFigure 1
Microarray analysis of differential gene expression in wild-type and knockout fibroblasts (H-ras
-/-
, N-ras
-/-
and H-ras
-/-
/N-ras
-/-
) subjected to serum
starvation or stimulation. Graphical representation of numbers of probesets showing differential gene expression in pair-wise SAM comparisons between
the microarray hybridization data of WT fibroblasts that were serum-starved for 24 hours (Control) and corresponding microarray hybridization data of
fibroblasts of the indicated WT and ras knockout genotypes obtained before (0 h) or after short-term (1 h) or mid-term (8 h) post-starvation incubation
of the cultures in the presence of 20% fetal bovine serum (FBS). Four independent microarray hybridizations were performed for all conditions involving
WT samples, and at least three independent hybridizations were performed with RNA of each of the different knockout genotypes analyzed. Numbers
shown indicate the amount of induced (red) or repressed (green), differentially expressed probesets that were identified in each case using a stringent false
discovery rate cut-off parameter value of 0.09.
182 168
2
225
711
348
210
4
12
335
879
214
129
4
367
1
438
189
3
334
385
G0
G1 S
24h serum starvation
0h 1h 8h
FBS
WT
H-ras
-/-
N-ras
-/-
/N-ras
-/-
H-ras
-/-
Control
Genome Biology 2009, Volume 10, Issue 11, Article R123 Castellano et al. R123.4
Genome Biology 2009, 10:R123
ment for the participation of Ras proteins [37,39,42]. In this
regard, the transcriptional profiles corresponding to cell cul-
tures incubated in the presence of serum for a short period (1
hour) are expected to include loci belonging to the population
of immediate early (IE) genes known to be expressed imme-
diately after exposure of serum-depleted fibroblasts to
growth factors or serum [43-47]. On the other hand, the tran-
scriptional profiles corresponding to cell cultures incubated
in the presence of serum for 8 hours represent the transcrip-
tomic pattern associated with the early stages of G1 progres-
sion known to lead to entry into S phase after Rb
phosphorylation and subsequent E2F-dependent transcrip-
tional activation [48].
To ensure statistical significance, four independent microar-
ray hybridizations were carried out for each of the time points
studied with WT cell samples, and three independent hybrid-
izations were performed for each of the experimental condi-
tions tested in the three different ras knockout genotypes
under study (H-ras
-/-
, N-ras
-/-
, H-ras
-/-
/N-ras
-/-
). After
robust normalization of the signals in all 39 separate microar-
ray hybridizations included in this study by means of robust
multi-array average software [49], the Significance Analysis
of Microarrays (SAM) algorithm [50] was applied to identify
the sets of differentially expressed genes showing statistically
significant changes of gene expression levels when comparing
the transcriptome of starved WT fibroblasts (Figure 1, Con-
trol) with that of the rest of the samples and conditions
included in this study for WT and knockout cells. Figure 1
summarizes the experimental conditions and quantitative
results of the microarray hybridizations performed at the dif-
ferent time points analyzed for each WT and ras knockout
genotype under study, and shows the numbers of differen-
tially expressed probesets (induced or repressed with regards
to the 0 h, WT control) that were identified under the strin-
gent selection conditions (false discovery rate (FDR) = 0.09)
applied in the SAM comparisons.
Transcriptional profiles of serum-starved fibroblasts
Initial comparison of the gene expression patterns obtained
for fibroblasts of all different genotypes analyzed after 24
hours of serum starvation showed that the transcriptional
profile of the control, WT fibroblasts was very similar to those
of similarly treated H-ras
-/-
and N-ras
-/-
knockout cells, indi-
cating that H-Ras and N-Ras exert rather minor influence
over the transcriptomic profile resulting from submitting
fibroblasts to the stress of serum deprivation (Figure 1). We
observed that the individual H-ras
-/-
and N-ras
-/-
knockouts
showed negligible numbers of overall transcriptomic changes
and only the simultaneous absence of both N-Ras and H-Ras
in the double knockout cells allowed identification of a short
list of 15 differentially expressed gene probesets in compari-
son to the serum-starved, control WT fibroblasts at the FDR
value applied (Figure 1; Table S1 in Additional data file 1).
Consideration of the short list of gene probesets distinguish-
ing the H-ras
-/-
knockout cells from their corresponding WT
controls suggested a predominant involvement of genes
affecting cell growth and proliferation, whereas the list of
genes differentially expressed in serum-starved, N-ras
-/-
knockout cells indicated a higher prevalence of genes related
to transcriptional processes and development or differentia-
tion (Table S1a, b in Additional data file 1). The double knock-
out (H-ras
-/-
/N-ras
-/-
), starved cells allowed identification of
a somewhat more extensive list of differentially expressed
genes (Table S1c in Additional data file 1) that confirmed
some of the functional tendencies observed in the individual
ras knockouts. For example, Crabp2, a gene coding for a
retinoid binding protein functionally involved in morphogen-
esis and organogenesis [51,52] was highly overexpressed in
the single N-ras
-/-
cells and was also the most highly overex-
pressed locus detected in the double knockout (H-ras
-/-
/N-
ras
-/-
) fibroblasts (Table S1b, c in Additional data file 1).
Serum-induced transcriptional profiles in wild-type
fibroblasts
Besides analyzing the effect of serum deprivation on the cel-
lular transcriptome, we also wished to determine the effect, if
any, of eliminating H-Ras and/or N-Ras on the transcrip-
tional profile of fibroblasts cultured in the presence of fetal
bovine serum (FBS) for short periods of time (1 hour or 8
hours) post-starvation. Computational, pair-wise compari-
sons of the transcriptional profile of control WT, serum-
starved fibroblasts with those obtained for the same cells after
incubation in the presence of FBS generated two separate lists
of differentially expressed genes reflecting the actual tran-
scriptional changes caused in WT, growth arrested (G0)
fibroblasts by stimulation with serum for 1 hour (Table S2 in
Additional data file 1) or after 8 hours of serum incubation
(Table S3 in Additional data file 1).
It is noteworthy that the transcriptomic profile depicted in
Table S2 in Additional data file 1 for serum-deprived, growth
arrested, WT fibroblasts treated with FBS for a short 1-hour
period contained only induced genes, as no repressed loci
could be identified as differentially expressed under the strin-
gent comparison conditions used. As expected, the subset of
loci showing highest transcriptional activation in Table S2 in
Additional data file 1 included a series of genes (Jun, Fos, Egr,
Atg, Atf-, Zfp-Ier-, and so on) belonging to the previously
described category of IE genes [53-55] known to be activated
in starved, G0 fibroblasts shortly after exposure to serum
[43,46,47,56-58]. Interestingly, the differential expression of
a large proportion of the most highly activated IE loci
detected in WT fibroblasts (Table S2 in Additional data file 1)
was also observed in the transcriptional profiles of H-ras
-/-
,
N-ras
-/-
and H-ras
-/-
/N-ras
-/-
knockout fibroblasts that were
similarly starved and treated with serum for 1 hour, suggest-
ing that H-Ras and N-Ras are not participating directly in the
regulation of their transcriptional activation. On the other
hand, we observed that a significant number of genes listed in
Table S2 in Additional data file 1 at medium-low values of
transcriptional activation (as judged by R.fold or d(i) values)
Genome Biology 2009, Volume 10, Issue 11, Article R123 Castellano et al. R123.5
Genome Biology 2009, 10:R123
did not score as differentially expressed in the transcriptional
profiles of corresponding ras knockout fibroblasts treated
under similar conditions (see the column 'Differential expres-
sion not kept' in Table S2 in Additional data file 1), suggesting
that in those cases H-Ras or N-Ras may be actively involved
in regulation of their expression.
The list of loci showing differential expression after 8 hours of
serum stimulation (Table S3 in Additional data file 1) was
longer and clearly different from that of early-expressed
genes after 1 hour of serum treatment. In contrast to Table S2,
Table S3 in Additional data file 1 includes both induced (168
probesets; 158 genes) and repressed (129 probesets; 126
genes) loci (Figure 1), and showed very minor overlapping
with the list of induced-only, IE genes included in Table S2 in
Additional data file 1. Consistent with the previously
described molecular mechanisms triggering G1/S transition
as a consequence of Rb phosphorylation and subsequent
induction of E2F-dependent transcription, this loci list
includes a number of known E2F targets (E2f3, Myc, Ctfg,
Smad, Cyr61, Psme3, Tpm2, Vegfb, and so on) [48,59-62].
Interestingly, some of the most highly overexpressed genes in
Table S3 (see the 'R.fold' column) were functionally related to
inhibition of proteolytic activities (Serpine1 and Serpinb2,
Timp1, and so on) or to interaction with components of the
extracellular matrix (Hbegf, Ctgf). Finally, as in Table S2 in
Additional data file 1, a significant number of the loci differ-
entially expressed in WT fibroblasts after 8 hours of serum
stimulation did not keep such differential expression in the
transcriptome of corresponding ras knockout fibroblast
counterparts subjected to the same 8-hour serum incubation
(see the column 'Differential expression not kept' in Table S3
in Additional data file 1). Interestingly, in most cases such loss
of transcriptional activation or repression concerned specifi-
cally the single N-ras
-/-
or the double H-ras
-/-
/N-ras
-/-
knock-
out cells, an observation suggesting very different functional
contributions of N-Ras and H-Ras to the regulation of gene
expression during G1 progression in fibroblasts.
Transcriptional waves induced by serum in H-ras and
N-ras knockout fibroblasts
Whereas the absence of H-Ras or N-Ras caused negligible
transcriptional changes relative to WT, serum-deprived
fibroblasts (Figure 1, 0 h), genomic disruption of H-ras
-/-
and/or N-ras
-/-
, individually or in combination, was associ-
ated with the occurrence of significant transcriptional
changes caused by short-term incubation of the knockout
fibroblasts with serum (Figure 1, 1 h and 8 h). Thus, impor-
tant numbers of differentially expressed genes were detected
when performing stringent pair-wise comparisons (FDR =
0.09) between the microarray hybridization pattern of
serum-starved, G0 arrested WT fibroblasts and those of H-
ras
-/-
, N-ras
-/-
or H-ras
-/-
/N-ras
-/-
fibroblasts subjected to
serum starvation and subsequent stimulation with serum for
1 hour (G0/G1 transition) or 8 hours (G1 progression) (Figure
1, 1 h and 8 h).
Quantitative analysis of the microarray hybridization data
showed that, among all different fibroblast genotypes tested,
the N-ras
-/-
fibroblasts exhibited the highest numbers of IE,
differentially expressed genes after 1 hour of serum stimula-
tion (786 altered probesets in N-ras
-/-
fibroblasts versus 439
probesets in H-ras
-/-
fibroblasts) (Figure 1, 1 h). In contrast,
the H-ras
-/-
genotype was associated with the higher number
of differentially expressed loci detected during G1 progres-
sion, after 8 hours of serum stimulation (1,078 affected
probesets in H-ras
-/-
fibroblasts versus 399 probesets in N-
ras
-/-
fibroblasts; Figure 1, 8 h). These data suggest very dif-
ferent roles for H-Ras and N-Ras in regulation of cellular
transcriptional responses to serum and reinforces the notion
of specific, non-overlapping molecular functions for the dif-
ferent Ras isoforms. Our observation of two distinct waves of
transcriptional activation (after 1 hour and 8 hours of serum
stimulation) that are preferentially linked, respectively, to the
N-ras
-/-
or the H-ras
-/-
genotype is consistent with the previ-
ously reported absolute requirement for Ras activity during at
least two separate phases of the early G0 to S interval [36-41].
This raises the interesting possibility of a preferential func-
tional involvement of N-Ras during the early phase and of H-
Ras during a later phase of the period of absolute Ras activity
requirement defined by means of microinjection of neutraliz-
ing Ras antibodies and dominant negative Ras forms [63-65].
Our initial analysis of the microarray hybridization data gen-
erated in this study focused on identifying the loci sharing dif-
ferential expression among the different genotypes and
experimental conditions tested (Figure 2). Figure 2a identi-
fies and quantifies the overlapping of differentially expressed
probesets occurring among all the WT, H-ras
-/-
, N-ras
-/-
or H-
ras
-/-
/N-ras
-/-
genotypes analyzed, after 1 hour or 8 hours of
serum treatment. On the other hand, in order to better iden-
tify the genes whose differential expression is exclusively due
to the presence/absence of Ras proteins in the fibroblasts,
Figure 2b shows the intersections occurring among the lists of
differentially expressed genes for the H-ras
-/-
, N-ras
-/-
or H-
ras
-/-
/N-ras
-/-
genotypes that were generated after excluding
from them all the loci showing similar values of differential
expression in their corresponding (1 hour or 8 hours) WT
controls. Thus, Tables S4, S5 and S6 in Additional data file 1
list, respectively, the individual gene probeset composing the
wave of differential expression occurring after 1 hour of
serum stimulation in only the H-ras
-/-
, N-ras
-/-
or H-ras
-/-
/N-
ras
-/-
fibroblasts but not in the WT control cells. Similarly,
Tables S7, S8 and S9 in Additional data file 1 describe the
wave of differentially expressed genes occurring only in H-
ras
-/-
, N-ras
-/-
or H-ras
-/-
/N-ras
-/-
fibroblasts, respectively,
but not in WT fibroblasts, after 8 h of serum incubation. To
facilitate the detailed analysis of our microarray expression
data, all these tables present gene lists categorized according
to their degree of overexpression/repression and functional
category.
Genome Biology 2009, Volume 10, Issue 11, Article R123 Castellano et al. R123.6
Genome Biology 2009, 10:R123
Functional signatures linked to deficiency of H-Ras or
N-Ras in the transcriptional profile of serum-induced
fibroblasts
Initial qualitative analysis of the genes showing differential
expression in fibroblasts after serum stimulation was pro-
vided by the global, multi-class comparisons represented by
the dendrograms in Figure 3. These heatmaps were generated
by means of hierarchical clustering of shortened gene lists
containing the loci simultaneously showing the highest levels
of induction or repression when comparing the sets of hybrid-
ization data corresponding to serum-starved, WT fibroblasts
with those of the three different ras knockout genotypes (H-
ras
-/-
, N-ras
-/-
and H-ras
-/-
/N-ras
-/-
) tested in the presence of
serum for 1 hour (Figure 3a) or 8 hours (Figure 3b).
The dendrogram analyzing the short-term wave of transcrip-
tional response to serum stimulation for 1 hour allowed dis-
crimination of two main vertical branches (Figure 3a). One of
them encompassed the hybridization data corresponding to
the N-ras
-/-
and H-ras
-/-
/N-ras
-/-
knockout cells, whereas the
Overlapping of differential gene expression patterns from wild-type and ras knockout fibroblasts after serum stimulation for 1 hour or 8 hoursFigure 2
Overlapping of differential gene expression patterns from wild-type and ras knockout fibroblasts after serum stimulation for 1 hour or 8 hours. (a) Venn
diagrams showing number of probesets contained in the intersections among the different lists of differentially expressed genes occurring simultaneously in
WT, H-ras
-/-
, N-ras
-/-
or H-ras
-/-
/N-ras
-/-
fibroblasts after incubation of serum-starved cells in the presence of serum for 1 hour or 8 hours. (b) Venn
diagrams showing overlapping among the lists of differentially expressed genes of H-ras
-/-
, N-ras
-/-
or H-ras
-/-
/N-ras
-/-
fibroblasts generated after excluding
from them those loci showing similar values of differential expression (ratio of the R-fold values within the range 0.6 to 1.5) in the corresponding 1-hour
or 8-hour WT controls.
(a)
11
23 74 59 66
16 36
156
7 13 146 397
28 9
315
WT
H-ras
-/-
N-ras
-/-
H-ras /
-/-
N-ras
-/-
51
19 79 93 40
84 261
450
4 8 77 78
23 28
633
WT
H-ras
-/-
N-ras
-/-
H-ras /
-/-
N-ras
-/-
1 hour serum stimulation 8 hours serum stimulation
(b)
423
146
355
68
55
37
163
N-ras
-/-
(696 probesets)
H-ras
-/-
(323 probesets)
475
88
89
88
79
260
647
H-
ras /
-/-
N-ras
-/-
(593 probesets)
H-ras /
-/-
N-ras
-/-
(1074 probesets)
N-ras
-/-
(294 probesets)
H-ras
-/-
(862 probesets)
1 hour serum stimulation 8 hours serum stimulation
Genome Biology 2009, Volume 10, Issue 11, Article R123 Castellano et al. R123.7
Genome Biology 2009, 10:R123
second one contained those of the H-ras
-/-
and WT fibroblasts
(Figure 3a, columns). This branching distribution indicated
that the transcriptional profile of H-ras
-/-
cells after 1 hour of
serum induction is closest to that of WT fibroblasts, whereas
the expression pattern of the H-ras
-/-
/N-ras
-/-
cells is inter-
mediate and more similar to that of the N-ras
-/-
cells, which is
located farthest away from the WT branch. This behavior is
consistent with our previous suggestion (Figure 1) of a prefer-
ential contribution of N-Ras over H-Ras in generating the
first transcriptional wave of immediate-early responses to
serum stimulation for 1 hour. The horizontal branching of the
dendrogram allowed identification of a series of gene blocks
that clearly discriminated the transcriptional profiles of the
different WT and ras knockout genotypes under study (Fig-
ure 3a, blocks 1-8).
Using GeneCodis software [66], we analyzed the functional
annotations of the different loci comprising the clusters
defined in Figure 3a and uncovered statistically significant
associations linking specific cellular functions to the individ-
ual H-ras
-/-
or N-ras
-/-
genotypes (Table 1). In particular, we
observed that specific subsets of genes over-expressed in N-
ras
-/-
fibroblasts stimulated with serum for 1 hour are linked,
with a very high degree of statistical probability, to four par-
ticular functional categories, including immune responses,
apoptosis, transcription and MAPK signaling (Table 1; Figure
3a, blocks 1 and 4). In addition, the clusters containing
repressed genes in the N-ras
-/-
columns of the same dendro-
gram (Figure 3a) were observed to include genes linked, with
a high degree of statistical significance, to cellular functions
related to cell cycle and cell adhesion and insulin signaling
Hierarchical clustering of differentially expressed genes occurring in ras knockout cell lines after stimulation with serumFigure 3
Hierarchical clustering of differentially expressed genes occurring in ras knockout cell lines after stimulation with serum. (a) After stimulation with serum
for 1 hour; (b) after stimulation with serum for 8 hours. Heatmaps generated by cluster analysis of absolute expression values of a selected group of gene
probesets showing the highest levels of differential expression (induction or repression; stringent cutoff parameters set as FDR = 0.05 and P-value < 0.003)
in the lists of differentially expressed genes corresponding to starved control WT fibroblasts and H-ras
-/-
, N-ras
-/-
and H-ras
-/-
/N-ras
-/-
fibroblasts cultured
after starvation in the presence of serum for 1 hour (a) (267 different probesets) or 8 hours (b) (239 different probesets). Horizontal rows represent
individual gene probesets and vertical columns depict results from single microarray hybridizations. The intensity of color saturation in each probeset box
(ranging from 2 to 14 in a log2 scale) provides a quantitative estimation of its expression level. Red color denotes over-expression, increasing in brightness
with higher values. Green color denotes repression, increasing in brightness with lower values. Black color denotes unchanged expression signals relative
to controls. Cluster blocks numbered on the right side of each heatmap identify gene sets sharing common expression behavior under the genotypes and
experimental conditions indicated.
(a) (b)
H-ras
-/-
Wild typeN-ras
-/-
H-ras /N-ras
-/- -/-
H-ras
-/-
Wild typeN-ras
-/-
H-ras /N-ras
-/- -/-
46
8
10 12
Log2
46
8
10 12
Log2
Genome Biology 2009, Volume 10, Issue 11, Article R123 Castellano et al. R123.8
Genome Biology 2009, 10:R123
(Table 1a; Figure 3a, blocks 5 to 7). Similar computational
analysis identified a specific subgroup of genes over-
expressed in the H-ras
-/-
fibroblasts stimulated with serum
for 1 hour that was functionally linked to cell growth and pro-
liferation with high statistical significance (Table 1; Figure 3a,
blocks 2 and 3). In contrast, no significant functional associ-
ations were detected under similar selection conditions for
the clusters containing genes down-regulated in the H-ras
-/-
fibroblasts incubated with serum for 1 hour.
Two main vertical branches were also identified in the den-
drogram containing the genes showing highest differential
expression (induction or repression) after 8 hours of incuba-
tion in the presence of serum (Figure 3b). In this case, the two
branches discriminated clearly the hybridization pattern of
the WT fibroblasts from those of the three knockout geno-
types under study (H-ras
-/-
, N-ras
-/-
and H-ras
-/-
/N-ras
-/-
;
Figure 3b, columns). Consistent with our previous suggestion
of the preferential implication of H-Ras in the generation of
the transcriptional wave produced in response to serum stim-
ulation for 8 hours, the H-ras
-/-
hybridization profiles clus-
tered farthest away from the WT transcriptional profiles in
this particular dendrogram (Figure 3b). Functional annota-
tion analysis of the clusters of induced or repressed genes
defined in the Figure 3b dendrogram also revealed statisti-
cally significant associations linking specific cellular func-
tions to some of the individual ras knockout genotypes under
study (Table 2). Thus, GeneCodis analysis of the overex-
pressed gene clusters occurring in H-Ras-deficient fibroblasts
incubated with serum for 8 hours showed significant up-reg-
ulation of gene subsets functionally related to processes of
cellular growth and proliferation, such as RNA binding/
metabolism/processing and ribosomal protein biosynthesis
(Table 2; Figure 3b, blocks 1 and 3). On the other hand, anal-
ysis of the population of genes over-expressed in the Figure
3b dendrogram for N-ras
-/-
cells treated with serum for 8
hours allowed identification of specific subgroups that were
functionally linked to cellular processes concerned with
extracellular matrix interactions, cell cycle progression, DNA
replication or apoptosis (Table 2; Figure 3b, blocks 4 and 7).
Finally, among the population of loci repressed in N-ras
-/-
cells treated with serum for 8 hours, a small gene subset was
also identified that showed functional links to transcriptional
processes with a high degree of statististical significance
(Table 2; Figure 3b, block 6).
Taken together, these data reinforce the notion of non-over-
lapping functional roles for H-Ras and N-Ras in mammalian
fibroblast cells and are consistent with our previous observa-
tions on actively growing fibroblasts [35] that pointed to pref-
erential functional roles of H-Ras in growth and proliferation
and of N-Ras in transcriptional regulation of immune/
defense responses and apoptosis.
Table 1
Functional signatures of differentially expressed genes induced or suppressed in H-ras
-/-
and/or N-ras
-/-
fibroblasts after serum stimulation
for 1 hour (G0/G1 transition)
GO ID Functional category Gene % P-value Relevant genotype Significant loci
Up-regulated genes
GO:0006955 Immunity and defense 10.5% 0.000209 N-ras
-/-
Fas, Cxcl10, Il6, Irf1, Psmb9, Mx1, Mx2,
Cxcl2, Tap1, Ifi202b
GO:0006915 Apoptosis 9.6% 0.000250 N-ras
-/-
Bax, Bid, Fas, Gadd45b, Perp, Tnfrsf11b,
Phlda1, Tnfaip3, Trp53
GO:0003677 Transcription 4.3% 0.000400 N-ras
-/-
Rela, Stat1, Stat5a, Trp53
GO:0005515 MAPK signaling cascade 3.2% 0.000896 N-ras
-/-
Fas, Mapkapk2, Gadd45b, Dusp8, Trp53,
Map3k8, Flnb
GO:0003924 GTPase activity 5.3% 0,002511 N-ras
-/-
Ehd1, Mx1, Mx2, Iigp2, Rhoj
GO:0008283 Cell proliferation 10.3% 0.006678 H-ras
-/-
Gnb1, Vegfa, Irs2
Down-regulated genes
GO:0007049 Cell cycle 16.7% 0.000109 N-ras
-/-
Ccnd2, Ccng2, Cdkn2a, Ppp1cc, Spin,
Tsc2, Anapc4, Sash1
GO:0005515 Cell adhesion and cytoskeleton
organization
6.3% 0.000244 N-ras
-/-
Nras, Pik3r2, Ppp1cc
GO:0004910 Insulin signaling pathway 10.4% 0,000720 N-ras
-/-
Nras, Pik3r2, Ppp1cc, Tsc2, Pck2
Specific functional categories assigned by GeneCodis software [66] to particular subsets of the induced or repressed genes included in the
dendrograms in Figure 3a. The software tool was used to search for gene annotation co-occurrences in the Gene Ontology (GO) and KEGG
pathways databases, assigning values of statistical significance in each case. Functional categories are listed according to increasing P-value of
significance for each relevant genotype. Columns provide information on functional GO ID and denomination, percentage of total number of induced
or repressed genes in Figure 3a, statistical significance (P-value) of the functional assignment made in each case, and a representative list of
differentially expressed loci associated with each functional category.
Genome Biology 2009, Volume 10, Issue 11, Article R123 Castellano et al. R123.9
Genome Biology 2009, 10:R123
Serum-dependent gene expression signatures linked to
deficiency of H-ras and/or N-ras
To complement the global functional analyses derived from
simultaneous, multi-class comparisons in Figure 3 and
Tables 1 and 2, we also focused on identifying specific gene
signatures for H-Ras or N-Ras by analyzing in detail the
nature and functional annotations of the individual differen-
tially expressed loci listed in Tables S4 to S9 in Additional
data file 1 that were identified by pair-wise comparisons
between the serum-starved, WT fibroblasts (0 hours) and the
H-ras
-/-
, N-ras
-/-
or H-ras
-/-
/N-ras
-/-
fibroblasts subjected to
post-starvation serum stimulation for 1 hour (G0/G1 transi-
tion; Tables S4, S5 and S6 in Additional data file 1) or 8 hours
(G1 progression; Tables S7, S8 and S9 in Additional data file
1). To emphasize identification of genes whose differential
expression was exclusively linked to the presence/absence of
H-Ras and/or N-Ras in the fibroblasts, the lists in these tables
exclude all loci showing similar values of differential expres-
sion in each of the ras knockout fibroblasts stimulated with
serum (for 1 hour or 8 hours) and their corresponding,
serum-stimulated WT controls. Functional categories such as
signal transduction, transcription, primary metabolism, cell
development, cell cycle, or transport and trafficking are
highly represented in all cases (Figure 4). However, the iden-
tities of genes listed under each functional category are rather
specific and are defined for each table, with very minor over-
lapping existing among the different ras knockout genotypes
and conditions tested (Tables S4 to S9 in Additional data file
1). Here we describe some general observations concerning
specific signatures detected in the different individual ras
knockout genotypes analyzed.
The list of differentially expressed genes identified in H-ras
-/
-
fibroblasts stimulated with serum for 1 hour (Table S4 in
Additional data file 1) includes a high percentage of loci
related to signal transduction pathways (Figure 4), including
Wnt-, transforming growth factor beta- and Ras-dependent
signaling pathways. Among others, a notable change was a
significant reduction in the expression level of the p110alpha
subunit of phosphoinositide-3 kinase (PI3K; Table S4 in
Additional data file 1). Furthermore, confirming the conclu-
sions from the global analyses in Figure 3 and Tables 1 and 2,
the expression profile of H-ras
-/-
fibroblasts stimulated with
serum for 1 hour showed specifically increased percentages of
differentially expressed genes functionally related to cell
development and cell growth and proliferation (Figure 4;
Table S4 in Additional data file 1).
Differential gene expression during G1 progression in H-ras
-
/-
fibroblasts stimulated with serum for 8 hours (Table S7 in
Additional data file 1) involved a high percentage of loci
related to specific functional categories such as signal trans-
duction, transcription, RNA processing, protein biosynthesis
or ubiquitin interaction (Figure 4). Noticeable with regard to
signal transduction was the increased expression of a number
of important G protein subunits or small GTPases (including,
Table 2
Functional signatures of differentially expressed genes induced or suppressed in H-ras
-/-
and/or N-ras
-/-
fibroblasts after serum stimulation
for 8 hours (G1 progression)
GO ID Functional category Gene % P-value Relevant genotype Significant loci
Up-regulated genes
GO:0003723 RNA binding 15.9% 0,000055 H-ras
-/-
Eif2s1, Rnu3ip2, Nola2, Cpsf4, Rnpc1,
Mrpl20, Ddx18, Sf3a1, Hnrpll, Lsm8
GO:0006412 Protein biosynthesis 11.1% 0,000405 H-ras
-/-
Iars, Tars, Eif2s1, Eftud2, Nola2, Rpp30,
Mrpl20
GO:0030529 Ribonucleoprotein complex 9.5% 0,001480 H-ras
-/-
Eftud2, Rnu3ip2, Nola2, Mrpl20, Hnrpll,
Lsm8
GO:0000398 mRNA splicing 6.3% 0,002982 H-ras
-/-
Rnps1, Eftud2, Sf3a1, Lsm8
GO:0003743 Translation initiation factor activity 4.8% 0,007354 H-ras
-/-
Eif2s1, Eif4ebp1, AU014645
GO:0000074 Regulation of cell cycle 4.8% 0,045790 H-ras
-/-
Ccnd2, Junb, Kras
GO:0005578 Extracellular matrix interaction 9.8% 0,000006 N-ras
-/-
Col18a1, Mmp10, Mmp13, Mmp9
GO:0005634 Cell cycle 14.6% 0,000057 N-ras
-/-
Ccne2, Mcm5, Rbl1, Trp53, Cdc6
GO:0006260 DNA replication 12,2% 0,000035 N-ras
-/-
Mcm5, Pold1, Rrm2, Myst2, Cdc6
GO:0006915 Apoptosis 12.2% 0,002126 N-ras
-/-
Birc5, Bcap29, Perp, Tnfrsf11b, Trp53
Down-regulated genes
GO:0003677 Transcription 21.4% 0,003721 N-ras
-/-
Ankrd1, Meis1, Tcf20
Specific functional categories assigned by GeneCodis software [66] to particular subsets of the induced or repressed genes included in the
dendrogram in Figure 3b. The software tool was used to search for gene annotation co-occurrences in the Gene Ontology (GO) and KEGG
pathways databases, assigning values of statistical significance in each case. Functional categories are listed according to increasing P-value of
significance for each relevant genotype. Columns provide information on functional GO ID and denomination, percentage of total number of induced
or repressed genes in Figure 3b, statistical significance (P-value) of the functional assignment made in each case, and a representative list of
differentially expressed loci associated with each functional category.
Genome Biology 2009, Volume 10, Issue 11, Article R123 Castellano et al. R123.10
Genome Biology 2009, 10:R123
among others, K-Ras), as well as specific regulatory proteins
with GAP or GEF activity (Table S7 in Additional data file 1).
In contrast to the profile of IE gene expression in H-ras
-/-
cells
during G0/G1 transition, the profile of H-ras
-/-
cells stimu-
lated with serum for 8 hours showed a clear increase in the
number of differentially expressed loci related to functional
categories such as RNA metabolism and processing, protein
biosynthesis and ribosome biogenesis (Figure 4). Particularly
interesting in this regard was the specific detection of signifi-
cantly increased expression levels of various tRNA syn-
thetases, translation regulatory factors and ribosomal
proteins (both cytoplasmic and mitochondrial; Table S7 in
Additional data file 1). Interestingly, the increased expression
of tRNA acyl synthetases was conserved in similarly treated,
double knockout H-ras
-/-
/N-ras
-/-
cells, but not in single
knockout N-ras
-/-
cells (Tables S8 and S9 in Additional data
file 1). The concentration of specific transcriptional altera-
tions on functional categories related to cellular growth and
proliferation (that is, transcription, protein biosynthesis or
primary cell metabolism) is consistent with our previous
proposition of a predominant role of H-Ras in controlling the
second wave of serum-induced transcriptional activation
Functional categories affected by differential gene expression in ras knockout fibroblasts stimulated with serumFigure 4
Functional categories affected by differential gene expression in ras knockout fibroblasts stimulated with serum. Bars represent
percentage of total number of differentially expressed probesets (Tables S4 to S9 in Additional data file 1) corresponding to the indicated functional
categories in H-ras
-/-
, N-ras
-/-
and H-ras
-/-
/N-ras
-/-
fibroblasts (see the legend in the figure) that were subjected to starvation and subsequent stimulation with
serum (FBS) for 1 hour (upper panel) or 8 hours (lower panel). IFN, interferon.
% Probesets
Signal transduction
Transcription
Primary cell metabolism
Transport and trafficking
Cell cycle and DNA replication
Immunity and defense
Response to IFN
Cell adhesion and migration
RNA metabolism and processing
Cell development and differentiation
Protein biosynthesis and ribosome organization
DNA repair
Coagulation
Protein folding
Microtubule dynamics
Proteolysis and peptidolysis
Angiogenesis
Cell growth and proliferation
Cytoskeleton organization and biogenesis
Electron transport and energy production
Ubiquitin cycle
Apoptosis
8h FBS
% Probesets
1h FBS
H-ras
-/-
N-ras
-/-
H-ras
-/-
/N-ras
-/-
Genome Biology 2009, Volume 10, Issue 11, Article R123 Castellano et al. R123.11
Genome Biology 2009, 10:R123
occurring in fibroblasts during G1 progression after 8 h of
incubation in the presence of serum (Figure 1, Tables 1 and 2).
The list of differentially expressed genes specifically associ-
ated with the absence of N-Ras in fibroblasts stimulated with
serum for 1 hour (Table S5 in Additional data file 1) showed a
high proportion of loci functionally related to processes of cel-
lular signal transduction, transcription and primary metabo-
lism. Although similarly treated H-ras
-/-
fibroblasts also
showed predominant alteration of these functional categories
(Table S4 in Additional data file 1), the identity of the genes
listed under these functional headings differed significantly
between the H-ras
-/-
and N-ras
-/-
genotypes. In particular, the
elevated levels of specific transcription-related genes
detected in N-ras
-/-
fibroblasts incubated with serum for 1
hour (Table S5 in Additional data file 1; Figure 4) confirms the
functional signature for transcription detected in the global,
multi-class analyses depicted in Tables 1 and 2 and is consist-
ent with the predominant regulatory role previously attrib-
uted to N-Ras during the first transcriptional wave of the
response of fibroblasts to serum (Figure 1). The detection of
significantly increased levels of genes concerned with immu-
nity/defense and response to interferon in these N-ras
-/-
fibroblasts was also striking (Table S5 in Additional data file
1; Figure 4). Interestingly, the increased expression of this
functional category of genes was restricted to, and highly spe-
cific for, the N-ras
-/-
genotype and was of greater quantitative
significance during the early transcriptional wave of response
to 1 hour of stimulation with serum (G0/G1) than during G1
progression after 8 hours of serum stimulation (Figure 4).
Consistent with these observations, a preferential functional
involvement of N-Ras with immunity and defense responses
was also previously described in serum-supplemented,
unsynchronized, actively growing cultures of N-ras
-/-
cells
[35]. Regarding signal transduction, Table S5 in Additional
data file 1 includes significant numbers of over-expressed
kinase kinases as well as repressed phosphatases, G protein
subunits and Ras-related small GTPases. It was also remark-
able to identify Pik3ca (the p110 alpha polypeptide of PI3K)
and Pik3r2 (its regulatory p85 subunit) among the most
highly repressed loci in the list (Table S5 in Additional data
file 1). The simultaneous differential expression of genes
related to cell migration and adhesion, together with the
repression of specific members of the Rho and Rac families,
may suggest functional effects over cell motility under these
particular experimental conditions.
The transcriptional profile of N-ras
-/-
cells stimulated with
serum for 8 hours (Table S8 in Additional data file 1) showed
specifically high representation of functional categories such
as primary cell metabolism, signal transduction, cell develop-
ment and differentiation and cell adhesion (Figure 4). In par-
ticular, the categories of primary cell metabolism and cell
development and differentiation showed the highest quanti-
tative increases in comparison to the same cells stimulated
with serum for 1 hour only (Figure 4). The list of differentially
expressed genes related to signal transduction is shorter for
N-ras
-/-
cells stimulated with serum for 8 hours (Table S8 in
Additional data file 1) than in the same cells treated with
serum for 1 hour (Table S5 in Additional data file 1). Penk,
coding for proenkephalin1 [67,68], was the most highly over-
expressed probeset under this functional category. Interest-
ingly, this locus was also highly over-expressed in the same N-
ras
-/-
fibroblasts subjected to starvation alone (Table S1 b in
Additional data file 1) or to starvation and subsequent short-
term, 1-hour serum stimulation (Table S5 in Additional data
file 1). Compared to its transcriptional profile during G0/G1
transition, the N-ras
-/-
cells stimulated with serum for 8
hours shared similar repression of Pi3Kr2 and over-expres-
sion of a smaller number of different kinases. Over-expres-
sion of GAPs and repression of GEFs, as well as induction or
repression of specific ras-related loci, was also observed in
this case (Table S8 in Additional data file 1). Regarding cell
development and differentiation, Mpg (matrix G1a protein)
and Crabp2 (retinoic acid binding protein) showed the high-
est levels of over-expression under these conditions of serum
stimulation. As with Penk, Crabp2 was already highly over-
expressed in the same cells subjected to starvation alone
(Table S1b in Additional data file 1). Finally, the group of dif-
ferentially expressed genes listed under cell adhesion and
migration showed great increases in the level of expression of
specific matrix metallopeptidases or gap junction membrane
channel proteins, suggesting specific functional effects on
cell-extracellular matrix or cell-cell interactions in fibroblasts
of this particular genotype (Table S8 in Additional data file 1).
Differential gene expression in double knockout H-ras
-/-
/N-
ras
-/-
fibroblasts stimulated with serum for 1 hour (Table S6
in Additional data file 1) involved a significant percentage of
genes related to signaling, metabolism and transcription.
There was a specific quantitative increase in the functional
categories of signal transduction and cell cycle/DNA replica-
tion when compared to the other knockout genotypes ana-
lyzed (Figure 4). In these double H-ras
-/-
/N-ras
-/-
knockout
cells, the percentage of differentially expressed genes func-
tionally assigned to signal transduction was higher during
G0/G1 transition than during G1 progression (Figure 4). At
both stages of the cell cycle we observed increased expression
of a number of kinases, small GTPases and other G proteins
as well as repression of PI3K subunits (Pik3r2, Pik3ca)
(Tables S6 and S9 in Additional data file 1), a pattern consist-
ent with that previously described in the single knockout H-
ras
-/-
or N-ras
-/-
cells (Tables S4 and S5 in Additional data file
1)
The specific transcriptional profile of fibroblasts lacking both
H-Ras and N-Ras during G1 progression (8 hours with serum;
Table S9 in Additional data file 1) also showed significant
involvement of signaling, transcription or cell metabolism. A
specific, visible increase in the categories of cell cycle/DNA
replication, RNA processing and ubiquitin cycle was also
observed in this case (Figure 4).
Genome Biology 2009, Volume 10, Issue 11, Article R123 Castellano et al. R123.12
Genome Biology 2009, 10:R123
In general, the percentage profile of functional categories
associated with the absence of both H-Ras and N-Ras in
fibroblasts paralleled for the most part that of the same func-
tional categories in one or both of the individual H-ras
-/-
or N-
ras
-/-
knockout genotypes. For example, the H-ras
-/-
/N-ras
-/-
fibroblasts behaved like H-ras
-/-
cells with regard to develop-
ment and differentiation or like N-ras
-/-
cells with regard to
growth and proliferation after 1 hour of serum stimulation.
Likewise, a similar percentage distribution was detected for
functional categories such as RNA metabolism or ubiquitin
cycle between H-ras
-/-
/N-ras
-/-
and H-ras
-/-
fibroblasts stim-
ulated with serum for 8 hours (Figure 4). A contrasting excep-
tion to that behavior was seen with the category of cell cycle/
DNA replication, which clearly showed an additive behavior
in comparison to the individual H-ras
-/-
and N-ras
-/-
knock-
out cells (Figure 4).
Functional verification of microarray-based expression
data
Various alternative experimental approaches were used to
validate the transcriptional data generated with microarrays.
Quantitative real time PCR of a randomly selected collection
of the differentially expressed genes listed in Tables S4 to S9
in Additional data file 1 was first carried out with microfluidic
cards using the signal of the18S ribosomal subunit as control.
Confirmation by this technique of the transcriptional trends
previously detected with microarrays is indicated by the
asterisks in the R.fold column of Tables S4 to S9. In general,
a good qualitative agreement was observed between the
microarray-derived data and the quantitative real time PCR
results, although some quantitative differences were some-
times observed. Additional validation of the microarray-
based transcriptional data was obtained in other cases by
means of western immunoblots of cellular extracts of the
same ras knockout fibroblast lines analyzed with microarrays
after serum stimulation. This approach also confirmed the
over-expression or the repression of the protein products of a
series of differentially expressed genes, as indicated by the
hash signs in the R.fold columns of the pertinent tables.
Further, detailed confirmation of specific sets of the genomic
transcriptional data detected with microarrays was also
obtained at the protein level by means of reverse phase pro-
tein microarray analysis of appropriate cellular extracts (Fig-
ure 5). Using this approach, we documented the increased
expression levels and/or activation of a number of pro-apop-
totic proteins in N-ras and/or H-ras
-/-
/N-ras
-/-
fibroblasts
(Figure 5a), thus confirming our previous transcriptomic data
(Tables 1 and 2) suggesting an increase in the apoptotic
response in N-Ras deficient fibroblasts. Our microarray tran-
scriptional data also suggested an involvement of N-Ras with
immunity/defense, especially the interferon response. Vali-
dating those observations, the protein arrays demonstrated
the occurrence of significantly increased levels of cellular
Stat1 (signal transducer and activator of transcription 1) pro-
tein, together with an increase in its tyrosine (Y701) or serine
(S727) phosphorylated forms, indicating full activation of this
protein in the N-ras
-/-
deleted fibroblasts [69-71]. Interest-
ingly, no differences were detected in the expression levels of
other members of the STAT family of proteins (Figure 5b).
These observations in the N-ras and/or H-ras
-/-
/N-ras
-/-
fibroblasts stimulated with serum for short periods (1 hour or
8 hours) are fully consistent with our previous observations in
non-starved, actively growing N-Ras-deficient fibroblasts
[35].
We also explored the possibility of functional links between
the above described alterations of gene expression and poten-
tial defects in signal transduction. Analysis with protein
microarrays of the status of a number of known components
of Ras effector signaling pathways showed in N-ras
-/-
knock-
out cells a significant decrease in extracellular signal-regu-
lated kinase (ERK) phosphorylation (T202/Y204 residues)
occurring after both starvation or short-term serum stimula-
tion (1 hour), suggesting a specific deficiency in ERK-related
signaling under those conditions (Figure 5c). Regarding the
H-ras
-/-
fibroblasts, our data suggested a specific deregula-
tion in Ras-PI3K pathways as we consistently detected a sig-
nificant increase of phosphorylated AKT (S473 residue) in
these cells under both starvation and/or serum stimulation,
as well as increased PTEN levels after stimulation with serum
for 8 hours (Figure 5c).
N-Ras regulation of Stat1 expression and activity
through the Ras-ERK signaling pathway
We described previously that in long-term, actively growing
N-ras
-/-
cultures, the over-expression of Stat1 was accompa-
nied by increased transcriptional activation of genes contain-
ing interferon-stimulated response elements (ISREs) in their
promoter sequence [35]. Here we wished to determine
whether those transcriptional alterations are specifically reg-
ulated by N-Ras and whether similar changes are also observ-
able at the beginning of the cell cycle after short-term
stimulation of N-Ras deficient cells with serum. Figure 6a
documents our observation of significantly increased tran-
scriptional activity mediated by ISREs in N-ras
-/-
cultures
stimulated with serum for 1 hour or 8 hours. Furthermore,
when N-Ras expression was restored in the N-ras knockout
cells by transfection with an appropriate construct (Figure
6b), the ISRE-dependent transcriptional activity reverted to
levels similar to those found in WT control fibroblasts, con-
firming that N-Ras is a regulator of Stat1 activity in these cells
(Figures 6a, b). To gain further insight into which specific
effector pathways might be involved in regulation of Stat1 by
N-Ras, we treated WT control fibroblasts with inhibitors of
ERK (PD98059), p38 (SB203580), PI3K (LY294002) or epi-
dermal growth factor receptor (PD153035) signaling, as well
as a tyrosine kinase inhibitor (Genistein) and compared their
resulting levels of cellular Stat1 with those of N-Ras-deficient
cells (Figure 6c). We observed that down-regulation of the
ERK signaling pathway produced an increase in the expres-
sion level and activation state of the Stat1 protein that was
Genome Biology 2009, Volume 10, Issue 11, Article R123 Castellano et al. R123.13
Genome Biology 2009, 10:R123
comparable to that found in N-ras
-/-
fibroblasts, demonstrat-
ing that N-Ras regulates Stat1 through the ERK pathway (Fig-
ure 6c).
Enhanced apoptosis in N-ras
-/-
and H-ras
-/-
N-ras
-/-
fibroblasts involves intrinsic and extrinsic pathway
components
As mentioned above, our microarray-based transcriptional
data and the results obtained with reverse phase protein
arrays documented the increased expression and activation
levels of various pro-apoptotic proteins, which suggested the
possibility of increased apoptotic responses in N-ras
-/-
and H-
Reverse phase protein arraysFigure 5
Reverse phase protein arrays. Fibroblast protein lysates of the indicated genotypes (H-ras
-/-
, N-ras
-/-
, H-ras
-/-
/N-ras
-/-
and their WT control counterparts)
were printed as indicated in Materials and methods onto slides containing two sets of spots corresponding, respectively, to WT controls and knockout
samples after being subjected to the specified culture conditions (starvation or stimulation with serum for 1 hour or 8 hours). All samples were printed in
duplicate, using five-point, two-fold dilution curves (starting at 2 μg/μl). The sixth point was always a negative control consisting of lysis buffer alone. After
staining and development with the specific antibodies indicated on the y-axis, the slides were scanned and the ratios of the signals of the different ras
knockout samples, normalized in relation to their respective WT controls, are depicted as bars on the x-axis of the graphs. Ratios smaller than 0.6 are
considered to indicate decreased protein expression, whereas ratios higher than 1.5 are considered as indicative of increased expression. Similar results
were obtained in two separate experiments. Results depicted here represent the proteomic validation of the genomic expression changes corresponding
to (a) various apoptotic proteins, (b) proteins in the JAK/STAT signaling pathway, and (c) well known Ras effectors in fibroblasts.
Casp3
Casp7
Bcl2
Bcl2 (S70)
Bcl2 (T56)
Cl’Casp3 (D175)
Cl’Casp7 (D198)
Cl’Casp8 (D374)
Decrease Increase
Starvation
(a)
Bax
Casp3
Casp7
Bcl2
Bcl2 (S70)
Bcl2 (T56)
Cl’Casp3 (D175)
Cl’Casp7 (D198)
Decrease Increase
1 hour serum stimulation
Stat1
Stat1 (Y701)
Stat1 (S727)
Stat2
Stat3
Stat5
Decrease Increase
(b)
Erk
c-Raf (S338)
Erk (T202/Y204)
Akt
Akt (S473)
PTEN
Akt (T308)
Decrease Increase
(c)
Starvation
Erk
c-Raf (S338)
Erk (T202/Y204)
Akt
Akt (S473)
PTEN
Akt (T308)
1 hour serum stimulation
Decrease Increase
Erk
c-Raf (S338)
Erk (T202/Y204)
Akt
Akt (S473)
PTEN
Akt (T308)
N-ras vs Wild type
-/-
/N-ras vs Wild type
-/-
H-ras
-/-
H-ras vs Wild type
-/-
Decrease Increase
8 hours serum stimulation
Bax
Casp3
Casp7
Bcl2
Bcl2 (S70)
Bcl2 (T56)
Cl’Casp3 (D175)
Cl’Casp7 (D198)
Cl’Casp8 (D374)
Decrease Increase
8 hours serum stimulation
1 hour serum stimulation
Stat1
Stat1 (Y701)
Stat1 (S727)
Stat2
Stat3
Stat5
Decrease Increase
8 hours serum stimulation
Genome Biology 2009, Volume 10, Issue 11, Article R123 Castellano et al. R123.14
Genome Biology 2009, 10:R123
ras
-/-
/N-ras
-/-
fibroblasts. Morphological alterations associ-
ated with apoptosis include changes in the refractive index of
the cellular membrane, loss of cellular contacts, appearance
of cellular blebbing and cell detachment. Accordingly, we
used phase-contrast microscopy in order to detect and quan-
tify the presence of apoptotic cells in cultures of starved and
serum-stimulated fibroblasts of the various WT and ras
knockout genotypes under study. This experimental
approach demonstrated the presence of high numbers of
morphologically apoptotic cells in starved and serum-stimu-
lated N-ras
-/-
cell cultures and, to a somewhat lesser extent,
also in H-ras
-/-
/N-ras
-/-
cultures (Figure 7). In contrast, con-
sistent with the genomic and proteomic expression data, the
H-ras
-/-
fibroblast cultures did not display any morphological
features of apoptosis and were similar to WT fibroblasts in
appearance (Figure 7). These morphological observations
were confirmed at the quantitative level by means of fluores-
ence activated cell sorting (FACS) analysis of the same fibrob-
last cultures, which revealed a 5 to 20% increase in the
number of apoptotic cells in N-ras
-/-
and H-ras
-/-
/N-ras
-/-
fibroblasts compared to their control counterparts (Figure 7).
Two major pathways regulate apoptosis induction in mam-
malian cells. In the extrinsic pathway, apoptosis is induced
through specialized surface receptors such as FAS or tumor
necrosis factor-α [72,73], whereas in the intrinsic pathway,
this process is mainly induced through release of mitochon-
drial pro-apoptotic factors [72,74]. Our proteomic data
showed increased expression of proteins involved in both the
intrinsic (Bax, p53) and extrinsic (Casp8, FAS) pathways,
together with some effector caspases and Bid, which connect
both pathways. We confirmed these data and checked the
functionality of both apoptotic pathways by measuring Casp8
(extrinsic pathway) and Casp9 (intrinsic pathway) activity in
N-ras
-/-
and H-ras
-/-
/N-ras
-/-
fibroblasts (Figure 8). These
assays showed increased activity of both caspases in the
knockout cell lines compared to the WT controls and did not
show predominance of either pathway in our ras knockout
N-Ras regulation of Stat1 through the Ras-ERK pathwayFigure 6
N-Ras regulation of Stat1 through the Ras-ERK pathway. (a) N-Ras controls transcriptional activity of ISREs in fibroblasts. Relative luciferase activity of
transfected reporter ISRE constructs versus their empty vector controls was measured as described in Materials and methods after 1 hour or 8 hours of
serum stimulation in cultures of WT, N-ras
-/-
or N-ras
-/-
cells transfected with an appropriate N-Ras construct. The assays were carried out in triplicate,
with error bars indicating standard deviation (***P < 0.001 versus WT;
+++
P < 0.001,
++
P < 0.01 versus N-ras
-/-
fibroblasts). (b) Restored N-Ras expression
in N-ras
-/-
fibroblasts. Western immunoblot showing partial recovery of N-Ras expression after transfecting N-ras
-/-
fibroblasts with a vector containing a
single N-ras copy. (c) Regulation of Stat1 expression and activation through the ERK pathway. WT control fibroblasts were treated with different
inhibitors as indicated and total Stat1 or pStat1 (Y701) levels were detected by immunoblot. Controls of activity of the kinase inhibitors are included in
Figure 9e.
5
10
15
20
N-ras
-/-
N-ras + pCEFL-N-ras
-/-
(a)
1 hour serum stimulation
Luciferase relative activity
pZtk-ISRE pZtk
***
+++
(b)
N-ras
-/-
Wild type
pCEFL-N-ras
N-ras
JetPei
N-ras
-/-
Wild type
Stat1
p-Stat1 (Y701)
Wild type
Wild type
N-ras
-/-
PD098059
SB203580
LY294002
Genistein
PD153035
(c)
Actin
***
++
pZtk-ISRE pZtk
5
10
15
20
Luciferase relative activity
8 hours serum stimulation
Genome Biology 2009, Volume 10, Issue 11, Article R123 Castellano et al. R123.15
Genome Biology 2009, 10:R123
Enhanced apoptosis in N-ras
-/-
and H-ras
-/-
/N-ras
-/-
fibroblast culturesFigure 7
Enhanced apoptosis in N-ras
-/-
and H-ras
-/-
/N-ras
-/-
fibroblast cultures. Representative phase-contrast microscopic images of WT and ras knockout
fibroblast cultures that were serum-starved, or stimulated with serum for 1 hour or 8 hours, as indicated. Flow cytometric analyses of corresponding
preconfluent cultures of the same control and knockout cell lines are also presented. Graphics are representative of three separate determinations with
similar results. The averaged percentage of apoptotic cells is included in each case.
Starved 1 hour stimulation 8 hours stimulation
N-ras
-/-
Control
H-ras
-/-
Apoptosis = 15,03%
Apoptosis
G1
S
G2/M
Apoptosis
G1
S
G2/M
Apoptosis = 24,07%
G1
Apoptosis
S
G2/M
Apoptosis = 3,09%
Apoptosis
G1
S
G2/M
Apoptosis = 1,46%
Apoptosis
Apoptosis
G1
S
G2/M
Apoptosis = 1,13%
Apoptosis
G1
S
G2/M
Apoptosis = 1,06%Apoptosis = 1,86%
Apoptosis
G1
S
G2/M
Apoptosis
G1
S
G2/M
Apoptosis = 2,15%
Apoptosis
G1
S
G2/M
Apoptosis = 12,58%
G2/M
Apoptosis
S
Apoptosis = 22,03%
G1
Apoptosis = 8,58%
Apoptosis
G1
S
G2/M
Apoptosis
G1
S
G2/M
Apoptosis = 20,35%
/ N-ras
-/-
H-ras
-/-
Genome Biology 2009, Volume 10, Issue 11, Article R123 Castellano et al. R123.16
Genome Biology 2009, 10:R123
cell lines. All together, these results support our genomic and
proteomic data and demonstrate an increase in the apoptotic
response associated with the absence of N-Ras in N-ras
-/-
and
H-ras
-/-
/N-ras
-/-
fibroblasts.
N-Ras is a direct regulator of Bax and Perp expression
Our microarray hybridization data consistently detected the
over-expression of the apoptotic Bax and Perp loci in N-ras
-/
-
and/or H-ras
-/-
/N-ras
-/-
fibroblast cultures (Tables S5 to S9
in Additional data file 1). To gain further insight into the func-
tional significance of these observations, we carried out luci-
ferase assays to quantify the transcriptional activation of the
Bax and Perp promoters in the N-ras
-/-
and H-ras
-/-
/N-ras
-/-
fibroblasts compared to their WT controls (Figure 9). Our
assays using specific reporter constructs demonstrated in
both cases the transcriptional activation of these promoters in
the absence of N-Ras expression in single or double knockout
cells (Figures 9a, b). In order to confirm the specific implica-
tion of N-Ras in regulating the transcriptional activation of
both genes, we transfected the knockout cells with vectors
containing either H-ras or N-ras, thus recovering expression
of these genes in the corresponding null cell lines (Figures 9a-
c). When N-ras expression was restored in either single or
double knockout cell lines, the activity of the Bax and Perp
promoters decreased to values similar to those found in WT
control fibroblasts. In contrast, when H-ras expression was
recovered in the double knockout fibroblasts we did not
observe any change in the activity of the Perp promoter,
implying that deregulation of this gene in H-ras
-/-
/N-ras
-/-
fibroblasts was due to the absence of N-Ras, but not of H-Ras
(Figure 9b, c). Finally, further information concerning possi-
ble effector pathways involved in transcriptional regulation of
Bax by N-Ras was obtained by using a battery of specific
inhibitors on control WT fibroblasts and quantifying the
resulting levels of Bax protein expression (Figure 9d). We
observed increased expression levels of Bax protein after 24
Increased caspase 8 and 9 activation in N-ras
-/-
and H-ras
-/-
/N-ras
-/-
fibroblastsFigure 8
Increased caspase 8 and 9 activation in N-ras
-/-
and H-ras
-/-
/N-ras
-/-
fibroblasts. Caspase 8 and 9 activities were measured as described in Materials and
methods in WT, N-ras
-/-
and H-ras
-/-
/N-ras
-/-
cell lines that had been subjected to different culture conditions, including, as indicated, serum starvation for
24 hours or subsequent stimulation with serum for 1 hour or 8 hours. Three separate determinations were performed where all individual assays were
carried out in triplicate. All values were normalized against their respective N-ras WT controls. Error bars indicate standard deviation (*P < 0.05; **P <
0.01).
Casp8 Casp9
*
*
**
**
Caspase activity
(arbitrary units)
1 hour serum stimulation
Casp8 Casp9
8 hours serum stimulation
*
**
*
Caspase activity
(arbitrary units)
0.5
1.0
1.5
2.0
2.5
0.5
1.0
1.5
2.0
Casp8 Casp9
N-ras
-/-
/N-ras
-/-
H-ras
-/-
0.5
1.0
1.5
Starved
Caspase activity
(arbitrary units)
**
*
*
**
2.0
2.5
N-ras
+/+
Genome Biology 2009, Volume 10, Issue 11, Article R123 Castellano et al. R123.17
Genome Biology 2009, 10:R123
hours incubation in the presence of specific inhibitors of ERK
or p38 signaling (Figure 9d), suggesting the possible partici-
pation of these two pathways in the regulatory effect of N-Ras
on Bax protein levels. Interestingly, no significant changes in
the transcriptional activities of the Bax and Perp reporters
were observed when the luciferase assays were performed in
the presence of ERK or p38 inhibitors (not shown), suggest-
ing that the enhancing effect of those inhibitors on Bax pro-
tein expression levels detected by WB (Figure 9d) may involve
additional post-transcriptional regulatory mechanisms.
Overall, our data support the notion of a specific, direct
involvement of N-Ras through transcriptional and post-tran-
scriptional regulatory mechanisms in the control of apoptotic
responses in fibroblasts.
Discussion
Various experimental approaches, including studies of over-
expression, subcellular location/processing, genomic disrup-
tion and genomic/proteomic profiling support the notion that
the mammalian H-Ras, N-Ras and K-Ras isoforms play non-
overlapping, differentiated functional roles [1,3,6]. For exam-
ple, our recent characterization of the transcriptomic profile
of actively growing fibroblasts lacking H-Ras and/or N-Ras
N-Ras regulation of Bax and PERP expressionFigure 9
N-Ras regulation of Bax and PERP expression. (a) Transcriptional activation of Bax is N-Ras-dependent. Relative luciferase activity of transfected Bax
construct versus their empty vector controls was measured in WT, N-ras
-/-
and N-ras
-/-
with partially restored N-ras expression cells as described in
Materials and methods. The assays were carried out twice, each time in triplicate, with error bars indicating standard deviation (**P < 0.01; ***P < 0.001
versus control;
+
P < 0.05;
++
P < 0.01 versus N-ras
-/-
fibroblasts). (b) Transcriptional activation of Perp is N-Ras-dependent. Relative luciferase activity was
measured in transfected WT, N-ras
-/-
and H-ras
-/-
/N-ras
-/-
fibroblasts as well as in double knockout fibroblasts with partially restored expression of either
H-ras or N-ras. The assays were done twice, each time in triplicate, with error bars indicating standard deviation (*P < 0.05; **P < 0.01; ***P < 0.001 versus
WT cell lines;
+
P < 0.05;
++
P < 0.01 versus N-ras
-/-
fibroblasts; Ψ P < 0.05; ΨΨ P < 0.01 versus H-ras
-/-
/N-ras
-/-
fibroblasts). (c) Western immunoblot
showing recovery of H-Ras and N-Ras expression after transfection of double knockout H-ras
-/-
/N-ras
-/-
fibroblasts with vectors containing a copy of either
H-ras or N-ras. (d) Regulation of Bax expression and activation through the ERK and p38 pathways. Control fibroblasts were treated with different Ras-
effector inhibitors as indicated in Materials and methods, and total Bax levels were detected by immunoblot. (e) Controls of activity of the chemical
inhibitors on their corresponding molecular targets.
(a)
5
10
15
20
pGL3-Bax-Luc pGL3
Starvation
Relative luciferase activity
***
++
Wild type
N-ras
-/-
N-ras + pCEFL-N-ras
-/-
5
10
15
20
Relative luciferase activity
25
1 hour serum induction
**
+
pGL3-Bax-Luc pGL3
(d)
PD098059
SB203580
LY294002
Genistein
PD153035
Actin
Bax
N-ras
-/-
Wild type
Wild type
pCEFL-H-ras
H-ras
-/-
/N-ras
-/-
pCEFL-N-ras
H-ras
-/-
/N-ras
-/-
H-ras
N-ras
(c)
(b)
5
10
15
20
pGL3-PERP
pGL3pGL3-PERP pGL3
yy
Relative luciferase activity
N-ras
-/-
N-ras + pCEFL-N-ras
-/-
Wild type
/N-ras
-/-
H-ras
-/-
/N-ras + pCEFL-H-ras
-/-
H-ras
-/-
/N-ras + pCEFL-N-ras
-/-
H-ras
-/-
***
+++
**
25
Starvation
5
10
15
20
pGL3-PERP
pGL3pGL3-PERP pGL3
yy
Relative luciferase activity
**
++
**
25
30
1 hour serum induction
5
10
15
20
pGL3-PERP pGL3pGL3-PERP pGL3
yy
Relative luciferase activity
***
+++
**
25
30
35
40
8 hour serum induction
(e)
PD098059
SB203580
LY294002
Genistein
PD153035
p-ERK (T202/Y204)
ERK
pAkt (S473)
Akt
N-ras FBS
+/+
N-ras FBS
+/+
N-ras starved
+/+
p-MAPKAPK2 (T222)
Genome Biology 2009, Volume 10, Issue 11, Article R123 Castellano et al. R123.18
Genome Biology 2009, 10:R123
provided significant evidence for the functional involvement
of N-Ras in cellular responses related to immunomodulation/
host defense and apoptosis [35]. Other reports indicate also
that the mammalian Ras proteins play essential functional
roles in regulation of the cell cycle [1,3,5,36]. This is based on
the observation that microinjection of non-specific, neutraliz-
ing Ras antibodies has demonstrated an absolute require-
ment for Ras activity at several points during serum
stimulation of quiescent cells [36-41]. However, little is
known about the exact mechanisms mediating the participa-
tion of Ras proteins in cell cycle progression or about the pos-
sibility that different Ras isoforms play differential functional
contributions in this process.
The present study, focused on the joint analysis of the
genomic expression profiles of WT and ras knockout (H-ras
-
/-
, N-ras
-/-
, H-ras
-/-
/N-ras
-/-
) fibroblasts subjected to serum
starvation or to subsequent stimulation with serum for short
periods of time, provides a valid experimental system to test
whether N-Ras and H-Ras play specific -or redundant - func-
tional roles during the initial stages of the cell cycle, and to
analyze potential mechanisms involved. Thus, microarray-
based analysis of the transcriptomic profiles of the serum
starved, G0-arrested fibroblasts enables the participation of
the Ras isoforms in cellular responses to the stress of serum
deprivation to be gauged. On the other hand, the study of the
transcriptomic profiles of the same set of serum-arrested
fibroblast lines after stimulation with serum for 1 hour or 8
hours was instrumental to discern different functional contri-
butions of N-Ras or H-Ras during G0/G1 transition (1 hour)
or mid-G1 progression (8 hours).
The meaningful, joint analysis of the complete set of different
transcriptional profiles generated in this study involved in
most instances the comparison of the profiles of G0-arrested
WT cells with those of the other samples and conditions stud-
ied here by means of microarray hybridization. Interestingly,
the comparison of the gene expression patterns of G0-
arrested fibroblasts (after 24 hours of serum starvation) of all
different genotypes tested showed negligible differences
among the transcriptional profiles of the WT controls and
those of the H-ras
-/-
or N-ras
-/-
knockout cells (Tables 1 and
2), indicating that H-Ras and N-Ras do not play a highly sig-
nificant functional role in generating the transcriptional
response of cultured fibroblasts to the stress of serum depri-
vation.
The hybridization data generated here also allowed us to
ascertain whether H-Ras and N-Ras had any specific effect on
the transcriptional responses of the starved fibroblasts to
serum stimulation. In particular, the microarray hybridiza-
tions corresponding to fibroblasts incubated with serum for 1
hour were aimed at targeting the specific gene population
transcribed immediately after exit of G0 and re-entry into G1
of the cell cycle (G0/G1 transition) [43,46,47,56-58], whereas
those corresponding to cells stimulated with serum for 8
hours were geared to characterize the profile of induced/
repressed genes occurring in fibroblasts progressing through
the early-mid stages of G1 phase in the cell cycle [48,59-62].
Accordingly, the list of differentially expressed genes result-
ing from comparing the profile of G0-arrested WT cells with
that of the same WT cells after short-term stimulation (1
hour) with serum contained only induced genes that corre-
sponded, for the most part, with the expected population of
so-called IE genes (jun, fos, and so on) known to be tran-
scribed in starved G0 fibroblasts shortly after exposure to
serum in culture [43,46,47,56-58]. Interestingly, the profiles
of H-ras
-/-
, N-ras
-/-
and H-ras
-/-
/N-ras
-/-
knockout fibrob-
lasts shared high differential expression of many of the IE loci
detected in WT cells, suggesting that, in those cases, H-Ras
and N-Ras do not have a direct functional contribution to the
transcriptional activation of IE loci and that the regulation of
these early serum responses is probably mediated through
other Ras-independent signaling pathways. On the other
hand, a significant number of differentially expressed, pri-
mary response genes were also identified in the WT cells that
did not score as differentially expressed in the transcriptional
profiles of corresponding ras knockout fibroblasts treated
under similar conditions, suggesting that in those cases H-
Ras or N-Ras may be actively involved in regulation of their
expression. The transcriptional profile of WT fibroblasts
stimulated with serum for 8 hours was clearly different from
that detected during G0/G1 transition (1 hour) and includes a
long list of induced and repressed genes encompassing E2F
targets that would be expected as a consequence of the proc-
ess of G1 to S progression, after Rb phosphorylation and sub-
sequent E2F transcriptional activation [48,59-62].
Interestingly, the transcriptional activation of many differen-
tially expressed loci detected in the WT cells was lost in the
ras knockout fibroblasts subjected to the same treatment
with serum. Such loss of transcriptional activation was partic-
ularly noticeable in the case of the N-ras
-/-
and H-ras
-/-
/N-
ras
-/-
knockout cells, suggesting a major functional participa-
tion of Ras proteins, particularly N-Ras, in the regulation of
transcriptional programs during early G1 progression.
Whereas the absence of H-Ras or N-Ras did not seem to mod-
ify the cellular responses to serum deprivation stress, the
genomic disruption of H-ras
-/-
and/or N-ras
-/-
, individually
or in combination, led to very different transcriptional
responses to serum stimulation in comparison to the G0-
arrested, WT fibroblasts. Our data clearly show that the
absence of N-Ras causes the highest quantitative changes in
the first wave of transcriptional activation occurring during
G0/G1 transition (1-hour serum stimulation), whereas the
absence of H-Ras was associated with the largest size of the
second wave of transcriptional activation corresponding to
mid-G1 progression (8-hour serum stimulation). The prefer-
ential association of N-Ras and H-Ras with each of these two
distinct transcriptional waves is consistent with previous
reports documenting the absolute requirement for Ras activ-
ity during different moments of the early G0 to S interval [36-
Genome Biology 2009, Volume 10, Issue 11, Article R123 Castellano et al. R123.19
Genome Biology 2009, 10:R123
41], and raises the interesting possibility of a preferential
functional involvement of N-Ras with the immediate-early
cellular responses to serum stimulation and of H-Ras with the
cellular responses related to growth and proliferation during
mid-G1 progression.
The analysis of functional annotations corresponding to the
differentially expressed genes identified in the multi-class
comparisons depicted in the Figure 3 dendrograms and the
pair-wise comparisons described in Tables S4 to S9 in Addi-
tional data file 1 was instrumental for the assignment of spe-
cific functional signatures to H-Ras and N-Ras during the two
specific stages of the early cell cycle (G0/G1 transition and
mid-G1) that were studied here. Thus, consistent with our
previous conclusion attributing a preferential functional role
to N-Ras in control of the early (G0/G1 transition) transcrip-
tional wave, and to H-Ras in control of the second (mid-G1)
transcriptional wave, the branching of the respective dendro-
grams clearly shows that the transcriptional pattern of N-ras
-
/-
cells was the most distant from that of the WT control dur-
ing the early G0/G1 transition and, in contrast, that of H-ras
-
/-
fibroblasts clustered farthest away from its WT control in
the set of samples corresponding to stimulation with serum
for 8 hours, during mid-G1 progression. Computational eval-
uation (Genecodis) of the functional annotations for the com-
ponents of the clusters in the dendrograms provided
statistically significant evidence linking the absence of N-Ras
during G0/G1 transition to induction of loci related to four
main categories of cellular functions, including immune
defense responses, apoptosis, transcription and MAPK sign-
aling, and to repression of loci functionally related to cell
cycle control, cell adhesion and insulin signaling. The same
computational analyses also demonstrated the occurrence of
a statistically significant link between the absence of H-Ras
and induction of genes related to RNA binding/metabolism/
processing and ribosomal protein biosynthesis during the
second transcriptional wave analyzed in this study (8-hour
serum stimulation; mid-G1 progression). These observations
during early stages of the cell cycle are clearly consistent with
previous observations from our laboratory with actively
growing fibroblasts [35] that pointed to preferential func-
tional roles of H-Ras in growth and proliferation and of N-Ras
in transcriptional regulation of apoptosis and immune/
defense responses. Our conclusions are further supported by
recent reports [75-77] on the contribution of Stat proteins and
interferon signaling to oncogenic transformation and human
tumor development. All these observations thus reinforce the
notion of non-overlapping functional roles for H-Ras and N-
Ras in mammalian fibroblast cells.
The global functional analyses were further complemented
and reinforced by the study of the functional annotations of
the individual genes listed in the pair-wise comparisons sum-
marized in Tables S4 to S9 in Additional data file 1. The iden-
tification of individual genes whose transcription was most
specifically linked to the absence of either H-Ras or N-Ras
was facilitated by excluding from consideration all loci show-
ing similar levels of differential expression (d-value or R.fold
parameters in pair-wise comparisons to G0-arrested, WT
cells) for both the WT and the ras knockout (H-ras
-/-
, N-ras
-
/-
or H-ras
-/-
/N-ras
-/-
) cells subjected to stimulation with
serum for the same time (1 hour or 8 hours). Confirming the
previous global analysis, the list of differentially expressed
genes in H-ras
-/-
fibroblasts subjected to serum stimulation
included many different loci that were functionally related to
development, growth and proliferation. Particularly striking
in this regard was the elevated number of genes coding for
tRNA synthetases and ribosomal proteins in both the single
H-ras
-/-
and double H-ras
-/-
/N-ras
-/-
knockout cells, but not
in N-ras
-/-
cells, suggesting a specific, direct link between H-
Ras and these types of cellular functions related to growth
processes. The transcriptional profile of N-Ras-deficient cells
displayed many individual genes falling under the functional
categories of defense and apoptosis (as previously noted), as
well as cell adhesion, motility and signal transduction proc-
esses. Regarding this latter category, it was remarkable to
observe in serum-stimulated N-ras
-/-
cells a significant reduc-
tion in expression level of components of PI3K signaling
pathways, in particular the p85 and p110 subunits of this
enzyme, suggesting a significant contribution of N-Ras to cel-
lular signaling through this pathway. All in all, these observa-
tions are consistent with the suggestion of a significant
functional contribution of N-Ras to the first wave of tran-
scriptional activation associated with G0/G1 re-entry into the
cell cycle. Finally, the profile of functional categories affected
in the double H-ras
-/-
/N-ras
-/-
knockouts reflected, in gen-
eral, the individual profiles exhibited by the individual H-ras
-
/-
or N-ras
-/-
genotypes, with a notable exception in the cate-
gory of cell cycle/DNA replication, where the behavior of the
double knockout fibroblasts was additive in relation to the
individual knockout genotypes, suggesting that H-Ras and N-
Ras complement each other functionally with regards to cel-
lular functions affecting cell cycle progression. In any event,
the validation of any proposed functional link resulting from
the analysis of transcriptional profiles requires further direct
confirmation by means of specific, in vivo functional assays.
Various experimental approaches, including reverse phase
protein arrays and direct functional assays of knockout
fibroblasts of the specific genotypes under study provided
direct support for some of the functional roles attributed to N-
Ras or H-Ras on the basis of the transcriptional profiles of
pertinent knockout cells, and also offered specific hints on the
possible mechanisms involved. For example, with regards to
cellular defense processes, our results demonstrated the spe-
cific increase of Stat1 expression and phosphorylation in N-
Ras-deficient cells and provided direct evidence for the par-
ticipation of Ras-ERK signaling pathways to mediate the
transcriptional regulation of Stat1 by N-Ras. Our data also
documented the enhanced apoptotic responses associated
with the absence of N-Ras in fibroblasts and provided evi-
dence for the participation of both intrinsic and extrinsic
Genome Biology 2009, Volume 10, Issue 11, Article R123 Castellano et al. R123.20
Genome Biology 2009, 10:R123
pathways in a process involving direct transcriptional and
post-transcriptional regulation by N-Ras of major compo-
nents, such as Bax and Perp, through ERK- and p38-medi-
ated pathways.
Conclusions
We have shown that the transcriptional profiles of G0-
arrested, serum-starved WT and ras knockout fibroblasts (H-
ras
-/-
, N-ras
-/-
, H-ras
-/-
/N-ras
-/-
) are very similar, indicating
that these Ras proteins do not play highly important roles in
regulation of transcriptional responses to the stress of serum
deprivation. In sharp contrast, the transcriptional profiles of
knockout fibroblasts lacking H-Ras and/or N-Ras are very
different from those of their WT controls after serum stimu-
lation for 1 hour (G0/G1 transition) or 8 hours (mid G1 pro-
gression), indicating that H-Ras and N-Ras exert distinct,
specific cellular functions during the initial stages of the cell
cycle. Whereas all three different ras knockout strains exhib-
ited important transcriptional alterations during both stages
of the cell cycle, the absence of N-Ras was quantitatively more
disruptive for the first transcriptional wave linked to G0/G1
transition, and the absence of H-Ras affected more potently
the transcriptional wave linked to G1 progression. Further-
more, the transcriptional changes of H-Ras-deficient cells
showed preferential involvement of loci functionally related
to growth and proliferation whereas those of N-Ras-deficient
cells were more frequently concerned with development, cell
cycle regulation, immunomodulation and apoptosis. Func-
tional analysis indicates that N-Ras contributions to cellular
immunity/defense responses is mediated, at least in part,
through ERK-dependent regulation of Stat1 expression and
activity, whereas its participation in apoptotic responses
involves transcriptional regulation of various genes (Bax and
Perp) via ERK and p38 signaling pathways.
Our data documenting the occurrence of specific transcrip-
tional profiles associated with the absence of H-Ras and/or
N-Ras during early cell cycle stages are consistent with previ-
ous reports showing absolute requirements for different
peaks of Ras activity during the initial stages of the cell cycle
and confirm the notion of functional specificity for the H-Ras
and N-Ras isoform proteins.
Materials and methods
Cell culture
Cell lines from the appropriate ras genotype were harvested
on Dulbecco's modified Eagle's medium (DMEM; Gibco Pais-
ley, UK) supplemented with FBS (10%; Hyclone, Logan, Utah,
USA), glutamine (2 mM), penicillin (100 U/ml) and strepto-
mycin (100 mg/ml). Cultures were grown in a humidified CO
2
(5%) atmosphere at 37°C and when subconfluent cells were
starved for 24 hours. After starvation cells were either used
for RNA/protein isolation, or induced for 1 hour or 8 hours
with 20% FBS and then RNA/protein isolation was carried
out.
When using the pharmacological inhibitors PD098059 (37
μM), SB203580 (10 μM), LY294002 (20 μM), Genistein (100
μM), and PD153035 (10 μM), WT fibroblasts were cultured as
usual and when 70 to 80% confluence was reached they were
treated for 24 to 48 hours in the presence of the inhibitor and
then collected for protein extraction. All the inhibitors were
purchased from Calbiochem
®
(Darmstadt, Germany).
RNA isolation, cDNA synthesis and microarray
hybridization
For each cell line and time point under study RNA was puri-
fied from two 10-cm culture dishes per cell line using a com-
mercial kit (RNeasy, Qiagen, Hilden, Germany).
Concentration was measured at 260 nm (Ultrospec 2000,
Pharmacia Biotech Buckinghamshire, UK) and purity and
quality was determined using RNA 6000 Nanochips (Agilent
Technologies, Santa Clara, CA, USA). RNA was then used to
synthesize cRNA probes for hybridization to Affymetrix
MGU74Av2 GeneChip high-density oligonucleotide microar-
rays. Microarray hybridization was carried out as described in
the Gene Expression Analysis Technical Manual provided by
Affymetrix [78].
Microarray hybridization data analysis: normalization,
differential gene expression and clustering
Pre-confluent cultures of at least two separate cell lines
belonging to each of the ras-related genotype(s) under study
(WT, H-ras
-/-
and N-ras
-/-
and H-ras
-/-
/N-ras
-/-
) were har-
vested and their RNA extracted for subsequent analysis using
Affymetrix high density oligonucleotide microarrays
MGU74Av2. At least three independent microarray hybridi-
zations were performed with RNA corresponding to each of
the null mutant ras genotypes in the experimental conditions
under study. Thus, this study encompassed a total of 3 differ-
ent data sets (starved cells, cells stimulated with serum for 1
hour and cells stimulated with serum for 8 hours), each con-
sisting of 13 separate chip microarray hybridizations (4 for
controls and 3 for each of the three null mutant genotypes).
All array hybridization data are available at the NCBI, Gene
Expression Omnibus database [GEO:GSE14829] [79].
Data analysis was carried out using the robust multi-array
average and SAM algorithms as previously described [35].
Changes in probeset expression level in knockout cell lines
compared to their WT counterparts were identified as signif-
icant using a FDR cutoff value of 0.09. Following identifica-
tion of the differentially expressed probesets, the
corresponding matrix of expression values for all microarray
hybridizations performed were analyzed using the hclust
clustering algorithm implemented in R [80]. This algorithm
performs hierarchical cluster analysis with complete linkage
to find similarity between probesets based on their expres-
sion values in the different chip microarrays analyzed. The
Genome Biology 2009, Volume 10, Issue 11, Article R123 Castellano et al. R123.21
Genome Biology 2009, 10:R123
algorithm classifies the probesets in correlated groups pre-
senting similar expression profiles or expression signatures.
The statistical significance of functional Gene Ontology anno-
tations was estimated by means of P-values of confidence cal-
culated by running Fisher's exact test to compare the number
of genes assigned to the various functional categories within
each cluster of the dendrogram.
Functional analysis
Functional analysis of the significant genes obtained for each
induced state was done using a functional annotation tool
called GeneCodis (Gene Annotation Co-occurrence Discov-
ery) [66,81]. This tool finds combinations of co-occurrent
annotations that are significantly associated with a list of
genes under study with respect to a reference list. The signif-
icance of the annotations is calculated using a hypergeometric
statistical test with FDR P-value correction and using as ref-
erence the mouse genome. The annotations were done at the
same time to the full Gene Ontology) database [82] and to the
Kyoto Encyclopedia of Genes and Genomes (KEGG) path-
ways database [83]. After the analyses were done with Gene-
Codis, the redundancy on the list of genes that are assigned to
each functional class was depurated by manual curation in
order to identify distinct groups of genes that include similar
or related biological functions and that can be enclosed in
more general cellular processes as presented in Tables 1 and
2.
Microfluidic cards
RNA from mouse embryo fibroblasts subjected to the differ-
ent experimental conditions under study was used for quan-
titative PCR validation on low density microarrays,
microfluidic cards (Applied Biosystems, Foster City, CA,
USA) using the 18 s ribosomal subunit as an internal control.
RNA (10 μg; 1 μl final reaction volume) were reverse tran-
scribed using the High Capacity cDNA Archive Kit (Applied
Biosystems) as recommended by the supplier. The previously
synthesized cDNA (5 μl) was then mixed with 50 μl of the Taq-
man
®
Universal PCR Master Mix (Applied Biosystems) and
50 μl of RNAses free water. Samples were loaded into the
microfluidic cards containing the lyophilized oligos in each
well and then centrifuged at 1,200 rpm for 2 minutes. Cards
were sealed using a Low Density Array Sealer (Applied Bio-
systems) and the PCR reaction was carried out in an ABI
PRISM
®
7900HT termocycler (Applied Biosystems). Results
were analyzed using the software Sequence Detection Sys-
tems (SDS) v2.1 (Applied Biosystems).
Western blot analysis of cellular extracts
Protein lysates were obtained and quantified as previously
described [35] Lysates (30 to 40 μg/lane) were loaded onto
SDS polyacrylamide gels and the electrophoresed proteins
transferred to polyvinylidene difluoride membranes (Milli-
pore Immobilon-P, Billerica, MA, USA) by electroblotting.
Membranes blocked in Tween 20-tris-buffered saline (10 mM
Tris-HCl (pH 8.0), 150 mM NaCl, 0.05% Tween 20) plus 1%
bovine serum albumin were incubated, as appropriate, with
dilutions of 0.2 mg/ml of commercial antibodies from Santa
Cruz Biotechnologies (Santa Cruz, CA, USA) and horseradish
peroxidase-conjugated (Amersham Bioscience, Buckingham-
shire, UK) were used as secondary antibodies. Immunoblots
were developed using the commercial Enhanced Chemilumi-
nescence (ECL) and ECL plus kits (Amershan Pharmacia Bio-
tech, Piscataway, NJ, USA) following the supplier's
recommendations.
Reverse-phase protein lysate array layout and antibody
staining
Reverse phase protein microarrays were done as previously
described [35]. Origin and dilution of the antibodies used is
shown in Table S10 in Additional data file 1. Development of
antibody-stained arrays and quantification of the signal data
obtained after scanning the arrays were carried out as
described [84,85].
Luciferase reporter assays
Transcriptional activity of control, N-ras
-/-
and the double H-
ras
-/-
/N-ras
-/-
cells was assayed using luciferase reporter con-
structs 8 ISRE-tkLuc (kindly provided by Dr R Pine, The Pub-
lic Health Research Institute, Newark, NJ, USA)), Bax-pGL3
and PERP-pGL3 (kindly provided by Dr P Lazo, Centro de
Investigacion del Cancer, Salamanca, Spain). Cells seeded in
six-well plates (5 × 10
5
cells/well) and cultured for 12 hours
were transfected with reporter plasmids (5.0 μg) using JetPEI
(Polyplus transfection, Illkirch, France). phRL-tk plasmid (50
ng; Promega, Madison, WI, USA) was co-transfected as an
internal control. After further culture for 24 to 36 hours in
DMEM with 10% FBS serum, cell extracts were assayed for
luciferase activity. Where indicated, cotransfections were
done by adding 5.0 μg of a construct containing N-ras (N-ras-
pCEFL) or H-ras (H-ras-pCEFL) genes. Luciferase assays
were performed using a dual luciferase reporter kit
(Promega). Luminescence was determined with a MiniLumat
LB9506 luminometer (Berthold, Bad Wildbad, Germany).
Caspase 8 and caspase 9 activity assays
We seeded 5 × 10
5
cells in six-well plates and once attached
they were starved for 24 hours and/or serum stimulated for 1
hour or 8 hours as previously described. After washing twice
with cold phosphate-buffered saline cells were lysated with
Reporter lysis buffer 1× (Promega), centrifuged for 5 minutes
at 12,000 rpm and 4°C and supernatant collected into a new
tube. Caspase 8 and 9 activity was measured by adding to the
lysates the corresponding reagent (Caspase-Glo
®
8 or Cas-
pase-Glo
®
9, Promega) in a 1:1 ratio. After 1 hour incubation
at room temperature caspase 8 and caspase 9 activity was
determined using a MiniLumat LB506 luminometer
(Berthold).
Genome Biology 2009, Volume 10, Issue 11, Article R123 Castellano et al. R123.22
Genome Biology 2009, 10:R123
Abbreviations
DMEM: Dulbecco's modified Eagle's medium; ERK: extracel-
lular signal-regulated kinase; FBS: fetal bovine serum; FDR:
false discovery rate; GAP: GTPase activating protein; GEF:
guanosine nucleotide exchange factor; IE: immediate early;
ISRE: interferon-stimulated response element; KO: knock-
out; SAM: Significance Analysis of Microarrays; Stat: signal
transducer and activator of transcription; WT: wild type.
Authors' contributions
EC carried out the experiments and data gathering and wrote
the initial version of the manuscript. CG participated in data
collection and manuscript editing. AN performed tasks
related to maintenance and use of the animal knockout col-
ony. JdlR carried out the bioinformatics analyses of the tran-
scriptional data. ES designed and coordinated the study and
wrote the manuscript. All authors read and approved the final
manuscript.
Additional data files
The following additional data are available with the online
version of this paper: Tables S1 to S10 listing the differential
expression detected in WT and knockout fibroblasts of the
indicated genotypes that were cultured under conditions of
serum starvation or stimulation, as specified in each case
(Additional data file 1).
Additional data file 1Tables S1 to S10Table S1: differential gene expression in ras knockout fibroblasts after serum starvation. Table S2: differential gene expression in serum starved, G0-arrested WT fibroblasts after incubation of cell cultures in the presence of serum for 1 hour. Table S3: differential gene expression in serum-starved, G0-arrested WT fibroblasts after stimulation with serum for 8 hours. Table S4: differential gene expression in serum-starved, G0-arrested H-ras
-/-
fibroblast cultures after stimulation with serum for 1 hour. Table S5: differen-tial gene expression in serum-starved, G0-arrested N-ras
-/-
fibrob-lasts after incubation of cell cultures in the presence of serum for 1 hour. Table S6: differential gene expression in serum-starved, G0-arrested H-ras
-/-
/N-ras
-/-
fibroblasts after incubation of cell cul-tures in the presence of serum for 1 hour. Table S7: differential gene expression in serum-starved, G0-arrested H-ras
-/-
fibroblasts after incubation of cell cultures in the presence of serum for 8 hours. Table S8: differential gene expression in serum-starved, G0-arrested N-ras
-/-
fibroblasts after incubation of cell cultures in the presence of serum for 8 hours. Table S9: differential gene expres-sion in serum-starved, G0-arrested H-ras
-/-
/N-ras
-/-
fibroblasts after incubation of cell cultures in the presence of serum for 8 hours. Table S10: antibodies used in reverse phase protein micro-arrays.Click here for file
Acknowledgements
We thank Dr R Pine (The Public Health Research Institute, Newark, NJ) for
ISRE reporter constructs, Dr P Crespo (Instituto de Investigaciones
Biomédicas, Santander, Spain) for H-Ras and N-Ras reporter constructs, Dr
P Lazo (Centro de Investigación del Cancer, Salamanca, Spain) for PERP
reporter construct and E Petricoin (George Mason University, VA) for sup-
port with protein array layout generation and analysis. This work was sup-
ported in part by grants from Junta Castilla y León (SA044A08 and GR93)
and from Instituto de Salud Carlos III (FIS PI021570), as well as institutional
support from RTICC (RD06/0020/000), and Acción Transversal en Cáncer
2008 from ISCIII, MSC, Spain. CG was supported by Ramon y Cajal Pro-
grama and EC was supported by MEC and FICUS (Fundación de Investi-
gación del Cáncer Universidad de Salamanca) fellowships.
References
1. Abankwa D, Gorfe AA, Hancock JF: Mechanisms of Ras mem-
brane organization and signalling: Ras on a rocker. Cell Cycle
2008, 7:2667-2673.
2. Colicelli J: Human RAS superfamily proteins and related
GTPases. Sci STKE 2004, 2004:RE13.
3. Karnoub AE, Weinberg RA: Ras oncogenes: split personalities.
Nat Rev Mol Cell Biol 2008, 9:517-531.
4. Rojas JM, Santos E: ras genes and human cancer: different impli-
cations and different roles. Curr Genom 2002, 3:295-311.
5. Schubbert S, Shannon K, Bollag G: Hyperactive Ras in develop-
mental disorders and cancer. Nat Rev Cancer 2007, 7:295-308.
6. Omerovic J, Hammond DE, Clague MJ, Prior IA: Ras isoform abun-
dance and signalling in human cancer cell lines. Oncogene
2008, 27:2754-2762.
7. Maher J, Baker DA, Manning M, Dibb NJ, Roberts IA: Evidence for
cell-specific differences in transformation by N-, H- and K-
ras. Oncogene 1995, 11:1639-1647.
8. Oliva JL, Zarich N, Martinez N, Jorge R, Castrillo A, Azanedo M, Gar-
cia-Vargas S, Gutierrez-Eisman S, Juarranz A, Bosca L, Gutkind JS,
Rojas JM: The P34G mutation reduces the transforming activ-
ity of K-Ras and N-Ras in NIH 3T3 cells but not of H-Ras. J
Biol Chem 2004, 279:33480-33491.
9. Bollag G, McCormick F: Differential regulation of rasGAP and
neurofibromatosis gene product activities. Nature 1991,
351:576-579.
10. Clyde-Smith J, Silins G, Gartside M, Grimmond S, Etheridge M, Apol-
loni A, Hayward N, Hancock JF: Characterization of RasGRP2, a
plasma membrane-targeted, dual specificity Ras/Rap
exchange factor. J Biol Chem 2000, 275:32260-32267.
11. Jones MK, Jackson JH: Ras-GRF activates Ha-Ras, but not N-Ras
or K-Ras 4B, protein in vivo . J Biol Chem 1998,
273:1782-1787.
12. Hancock JF: Ras proteins: different signals from different loca-
tions. Nat Rev Mol Cell Biol 2003, 4:373-384.
13. Plowman SJ, Hancock JF: Ras signaling from plasma membrane
and endomembrane microdomains. Biochim Biophys Acta 2005,
1746:274-283.
14. Plowman SJ, Muncke C, Parton RG, Hancock JF: H-ras, K-ras, and
inner plasma membrane raft proteins operate in nanoclus-
ters with differential dependence on the actin cytoskeleton.
Proc Natl Acad Sci USA 2005, 102:15500-15505.
15. Walsh AB, Bar-Sagi D: Differential activation of the Rac path-
way by Ha-Ras and K-Ras. J Biol Chem 2001, 276:15609-15615.
16. Ehrhardt A, David MD, Ehrhardt GR, Schrader JW: Distinct mech-
anisms determine the patterns of differential activation of H-
Ras, N-Ras, K-Ras 4B, and M-Ras by receptors for growth fac-
tors or antigen. Mol Cell Biol 2004, 24:6311-6323.
17. Hamilton M, Wolfman A: Oncogenic Ha-Ras-dependent
mitogen-activated protein kinase activity requires signaling
through the epidermal growth factor receptor. J Biol Chem
1998, 273:28155-28162.
18. Matallanas D, Sanz-Moreno V, Arozarena I, Calvo F, Agudo-Ibanez L,
Santos E, Berciano MT, Crespo P: Distinct utilization of effectors
and biological outcomes resulting from site-specific Ras acti-
vation: Ras functions in lipid rafts and Golgi complex are dis-
pensable for proliferation and transformation. Mol Cell Biol
2006, 26:100-116.
19. Prior IA, Muncke C, Parton RG, Hancock JF: Direct visualization
of Ras proteins in spatially distinct cell surface microdo-
mains. J Cell Biol 2003, 160:165-170.
20. Rocks O, Peyker A, Bastiaens PI: Spatio-temporal segregation of
Ras signals: one ship, three anchors, many harbors. Curr Opin
Cell Biol 2006, 18:351-357.
21. Voice JK, Klemke RL, Le A, Jackson JH: Four human ras homologs
differ in their abilities to activate Raf-1, induce transforma-
tion, and stimulate cell motility. J Biol Chem 1999,
274:17164-17170.
22. Johnson L, Greenbaum D, Cichowski K, Mercer K, Murphy E, Schmitt
E, Bronson RT, Umanoff H, Edelmann W, Kucherlapati R, Jacks T: K-
ras is an essential gene in the mouse with partial functional
overlap with N-ras. Genes Dev 1997, 11:2468-2481.
23. Koera K, Nakamura K, Nakao K, Miyoshi J, Toyoshima K, Hatta T,
Otani H, Aiba A, Katsuki M: K-ras is essential for the develop-
ment of the mouse embryo. Oncogene 1997, 15:1151-1159.
24. Esteban LM, Vicario-Abejon C, Fernandez-Salguero P, Fernandez-
Medarde A, Swaminathan N, Yienger K, Lopez E, Malumbres M,
McKay R, Ward JM, Pellicer A, Santos E: Targeted genomic dis-
ruption of H-ras and N-ras, individually or in combination,
reveals the dispensability of both loci for mouse growth and
development. Mol Cell Biol 2001, 21:1444-1452.
25. Plowman SJ, Williamson DJ, O'Sullivan MJ, Doig J, Ritchie AM, Harri-
son DJ, Melton DW, Arends MJ, Hooper ML, Patek CE: While K-ras
is essential for mouse development, expression of the K-ras
4A splice variant is dispensable. Mol Cell Biol 2003,
23:9245-9250.
26. Umanoff H, Edelmann W, Pellicer A, Kucherlapati R: The murine N-
ras gene is not essential for growth and development. Proc
Natl Acad Sci USA 1995, 92:1709-1713.
27. Potenza N, Vecchione C, Notte A, De Rienzo A, Rosica A, Bauer L,
Affuso A, De Felice M, Russo T, Poulet R, Cifelli G, De Vita G, Lembo
G, Di Lauro R: Replacement of K-Ras with H-Ras supports nor-
mal embryonic development despite inducing cardiovascu-
lar pathology in adult mice. EMBO Rep 2005, 6:432-437.
28. Brem R, Certa U, Neeb M, Nair AP, Moroni C: Global analysis of
differential gene expression after transformation with the v-
H-ras oncogene in a murine tumor model. Oncogene 2001,
20:2854-2858.
29. Croonquist PA, Linden MA, Zhao F, Van Ness BG: Gene profiling
Genome Biology 2009, Volume 10, Issue 11, Article R123 Castellano et al. R123.23
Genome Biology 2009, 10:R123
of a myeloma cell line reveals similarities and unique signa-
tures among IL-6 response, N-ras-activating mutations, and
coculture with bone marrow stromal cells. Blood 2003,
102:2581-2592.
30. Kim S, Lee YZ, Kim YS, Bahk YY: A proteomic approach for pro-
tein-profiling the oncogenic ras induced transformation (H-,
K-, and N-Ras) in NIH/3T3 mouse embryonic fibroblasts. Pro-
teomics 2008, 8:3082-3093.
31. Ohnami S, Aoki K, Yoshida K, Hatanaka K, Suzuki K, Sasaki H, Yosh-
ida T: Expression profiles of pancreatic cancer cell lines
infected with antisense K-ras-expressing adenoviral vector.
Biochem Biophys Res Commun 2003, 309:798-803.
32. Sweet-Cordero A, Mukherjee S, Subramanian A, You H, Roix JJ, Ladd-
Acosta C, Mesirov J, Golub TR, Jacks T: An oncogenic KRAS2
expression signature identified by cross-species gene-
expression analysis. Nat Genet 2005, 37:48-55.
33. Vasseur S, Malicet C, Calvo EL, Labrie C, Berthezene P, Dagorn JC,
Iovanna JL: Gene expression profiling by DNA microarray
analysis in mouse embryonic fibroblasts transformed by
rasV12 mutated protein and the E1A oncogene. Mol Cancer
2003, 2:19.
34. Zuber J, Tchernitsa OI, Hinzmann B, Schmitz AC, Grips M, Hellriegel
M, Sers C, Rosenthal A, Schafer R: A genome-wide survey of RAS
transformation targets. Nat Genet 2000, 24:144-152.
35. Castellano E, De Las Rivas J, Guerrero C, Santos E: Transcriptional
networks of knockout cell lines identify functional specifici-
ties of H-Ras and N-Ras: significant involvement of N-Ras in
biotic and defense responses. Oncogene 2007, 26:917-933.
36. Pruitt K, Der CJ: Ras and Rho regulation of the cell cycle and
oncogenesis. Cancer Lett 2001, 171:1-10.
37. Gille H, Downward J: Multiple ras effector pathways contribute
to G(1) cell cycle progression.
J Biol Chem 1999,
274:22033-22040.
38. Marshall C: How do small GTPase signal transduction path-
ways regulate cell cycle entry? Curr Opin Cell Biol 1999,
11:732-736.
39. Stacey D, Kazlauskas A: Regulation of Ras signaling by the cell
cycle. Curr Opin Genet Dev 2002, 12:44-46.
40. Takuwa N, Takuwa Y: Regulation of cell cycle molecules by the
Ras effector system. Mol Cell Endocrinol 2001, 177:25-33.
41. Taylor SJ, Shalloway D: Cell cycle-dependent activation of Ras.
Curr Biol 1996, 6:1621-1627.
42. Bar-Sagi D, Feramisco JR: Microinjection of the ras oncogene
protein into PC12 cells induces morphological differentia-
tion. Cell 1985, 42:841-848.
43. Greenberg ME, Hermanowski AL, Ziff EB: Effect of protein synthe-
sis inhibitors on growth factor activation of c-fos, c-myc, and
actin gene transcription. Mol Cell Biol 1986, 6:1050-1057.
44. Jones SM, Kazlauskas A: Growth-factor-dependent mitogenesis
requires two distinct phases of signalling. Nat Cell Biol 2001,
3:165-172.
45. Pardee AB: G1 events and regulation of cell proliferation. Sci-
ence 1989, 246:603-608.
46. Riabowol KT, Vosatka RJ, Ziff EB, Lamb NJ, Feramisco JR: Microin-
jection of fos-specific antibodies blocks DNA synthesis in
fibroblast cells. Mol Cell Biol 1988, 8:1670-1676.
47. Siegfried Z, Ziff EB: Transcription activation by serum, PDGF,
and TPA through the c-fos DSE: cell type specific require-
ments for induction. Oncogene 1989, 4:3-11.
48. Sun A, Bagella L, Tutton S, Romano G, Giordano A: From G0 to S
phase: a view of the roles played by the retinoblastoma (Rb)
family members in the Rb-E2F pathway. J Cell Biochem 2007,
102:
1400-1404.
49. Irizarry RA, Hobbs B, Collin F, Beazer-Barclay YD, Antonellis KJ,
Scherf U, Speed TP: Exploration, normalization, and summa-
ries of high density oligonucleotide array probe level data.
Biostatistics 2003, 4:249-264.
50. Tusher VG, Tibshirani R, Chu G: Significance analysis of micro-
arrays applied to the ionizing radiation response. Proc Natl
Acad Sci USA 2001, 98:5116-5121.
51. Collins CA, Watt FM: Dynamic regulation of retinoic acid-bind-
ing proteins in developing, adult and neoplastic skin reveals
roles for beta-catenin and Notch signalling. Dev Biol 2008,
324:55-67.
52. Lane MA, Xu J, Wilen EW, Sylvester R, Derguini F, Gudas LJ: LIF
removal increases CRABPI and CRABPII transcripts in
embryonic stem cells cultured in retinol or 4-oxoretinol. Mol
Cell Endocrinol 2008, 280:63-74.
53. Fambrough D, McClure K, Kazlauskas A, Lander ES: Diverse signal-
ing pathways activated by growth factor receptors induce
broadly overlapping, rather than independent, sets of genes.
Cell 1999, 97:727-741.
54. Herschman HR: Primary response genes induced by growth
factors and tumor promoters. Annu Rev Biochem 1991,
60:281-319.
55. Rollins BJ, Stiles CD: Serum-inducible genes. Adv Cancer Res 1989,
53:1-32.
56. Hopewell R, Li L, MacGregor D, Nerlov C, Ziff EB: Regulation of
cell proliferation and differentiation by Myc. J Cell Sci Suppl
1995, 19:85-89.
57. Leonard DG, Ziff EB, Greene LA: Identification and characteri-
zation of mRNAs regulated by nerve growth factor in PC12
cells. Mol Cell Biol 1987, 7:3156-3167.
58. Siegfried Z, Ziff EB: Altered transcriptional activity of c-fos pro-
moter plasmids in v-raf-transformed NIH 3T3 cells. Mol Cell
Biol 1990, 10:6073-6078.
59. Blais A, Dynlacht BD: Hitting their targets: an emerging picture
of E2F and cell cycle control. Curr Opin Genet Dev 2004,
14:527-532.
60. Ma Y, Croxton R, Moorer RL Jr, Cress WD: Identification of novel
E2F1-regulated genes by microarray. Arch Biochem Biophys
2002, 399:212-224.
61. Polager S, Kalma Y, Berkovich E, Ginsberg D: E2Fs up-regulate
expression of genes involved in DNA replication, DNA
repair and mitosis. Oncogene 2002, 21:437-446.
62. Wells J, Graveel CR, Bartley SM, Madore SJ, Farnham PJ: The iden-
tification of E2F1-specific target genes. Proc Natl Acad Sci USA
2002, 99:3890-3895.
63. Dobrowolski S, Harter M, Stacey DW: Cellular ras activity is
required for passage through multiple points of the G0/G1
phase in BALB/c 3T3 cells. Mol Cell Biol 1994, 14:5441-5449.
64. Feig LA, Cooper GM: Inhibition of NIH 3T3 cell proliferation by
a mutant ras protein with preferential affinity for GDP. Mol
Cell Biol 1988, 8:3235-3243.
65. Mulcahy LS, Smith MR, Stacey DW: Requirement for ras proto-
oncogene function during serum-stimulated growth of NIH
3T3 cells. Nature 1985, 313:241-243.
66. Carmona-Saez P, Chagoyen M, Tirado F, Carazo JM, Pascual-Montano
A: GENECODIS: a web-based tool for finding significant con-
current annotations in gene lists. Genome Biol 2007, 8:R3.
67. Boggs DF, Miller JH: Absence of an hypoxic depression of
metabolism in preproenkephalin knockout mice. Respir Physiol
Neurobiol 2006, 152:92-99.
68. Nitsche JF, Schuller AG, King MA, Zengh M, Pasternak GW, Pintar JE:
Genetic dissociation of opiate tolerance and physical
dependence in delta-opioid receptor-1 and preproenkepha-
lin knock-out mice. J Neurosci 2002, 22:10906-10913.
69. Dimberg A, Karlberg I, Nilsson K, Oberg F: Ser727/Tyr701-phos-
phorylated Stat1 is required for the regulation of c-Myc, cyc-
lins, and p27Kip1 associated with ATRA-induced G0/G1
arrest of U-937 cells. Blood 2003, 102:254-261.
70. Pilz A, Ramsauer K, Heidari H, Leitges M, Kovarik P, Decker T:
Phos-
phorylation of the Stat1 transactivating domain is required
for the response to type I interferons. EMBO Rep 2003,
4:368-373.
71. Shuai K, Schindler C, Prezioso VR, Darnell JE Jr: Activation of tran-
scription by IFN-gamma: tyrosine phosphorylation of a 91-
kD DNA binding protein. Science 1992, 258:1808-1812.
72. Hengartner MO: The biochemistry of apoptosis. Nature 2000,
407:770-776.
73. Wajant H: Death receptors. Essays Biochem 2003, 39:53-71.
74. Parone PA, James D, Martinou JC: Mitochondria: regulating the
inevitable. Biochimie 2002, 84:105-111.
75. Critchley-Thorne RJ, Simons DL, Yan N, Miyahira AK, Dirbas FM,
Johnson DL, Swetter SM, Carlson RW, Fisher GA, Koong A, Holmes
S, Lee PP: Impaired interferon signaling is a common immune
defect in human cancer. Proc Natl Acad Sci USA 2009,
106:9010-9015.
76. Wang S, Koromilas AE: Stat1 is an inhibitor of Ras-MAPK sign-
aling and Rho small GTPase expression with implications in
the transcriptional signature of Ras transformed cells. Cell
Cycle 2009, 8:2070-2079.
77. Gough DJ, Corlett A, Schlessinger K, Wegrzyn J, Larner AC, Levy DE:
Mitochondrial STAT3 supports Ras-dependent oncogenic
transformation. Science 2009, 324:1713-1716.
78. Affymetrix [ /> Genome Biology 2009, Volume 10, Issue 11, Article R123 Castellano et al. R123.24
Genome Biology 2009, 10:R123
79. NCBI Gene Expresión Omnibus (GEO) Accesion Display
[ />80. Murtagh F: Multidimensional clustering algorithms. In COMP-
STAT Lectures 4 Wuerzburg: Physica-Verlag; 1985:131.
81. Genecodis 2.0, UCM access, Madrid [http://geneco
dis.dacya.ucm.es/]
82. The Gene Ontology Database [ />83. KEGG Pathway Database [ />way.html]
84. Herrmann PC, Gillespie JW, Charboneau L, Bichsel VE, Paweletz CP,
Calvert VS, Kohn EC, Emmert-Buck MR, Liotta LA, Petricoin EF:
Mitochondrial proteome: altered cytochrome c oxidase sub-
unit levels in prostate cancer. Proteomics 2003, 3:1801-1810.
85. Wulfkuhle JD, Aquino JA, Calvert VS, Fishman DA, Coukos G, Liotta
LA, Petricoin EF: Signal pathway profiling of ovarian cancer
from human tissue specimens using reverse-phase protein
microarrays. Proteomics 2003, 3:2085-2090.