Báo cáo y học: " Substantial deletion overlap among divergent Arabidopsis genomes revealed by intersection of short reads and tiling arrays" ppt
Bạn đang xem bản rút gọn của tài liệu. Xem và tải ngay bản đầy đủ của tài liệu tại đây (1.38 MB, 8 trang )
Santuari et al. Genome Biology 2010, 11:R4
/>Open Access
METHOD
© 2010 Santuari et al.; licensee BioMed Central Ltd. This is an open access article distributed under the terms of the Creative Commons
Attribution License ( which permits unrestricted use, distribution, and reproduction in
any medium, provided the original work is properly cited.
Method
Substantial deletion overlap among divergent
Arabidopsis
genomes revealed by intersection of
short reads and tiling arrays
Luca Santuari
1
, Sylvain Pradervand
2,3
, Amelia-Maria Amiguet-Vercher
1
, Jerôme Thomas
3
, Eavan Dorcey
1
,
Keith Harshman
3
, Ioannis Xenarios
2
, Thomas E Juenger
4
and Christian S Hardtke*
1
Arabidopsis genomic variationA new approach to detect deletions in diver-gentgenomes combines short read sequenc-ing and tilling array data. Its utility is demonstrated on Arabidopsis strains.
Abstract
Identification of small polymorphisms from next generation sequencing short read data is relatively easy, but detection
of larger deletions is less straightforward. Here, we analyzed four divergent Arabidopsis accessions and found that
intersection of absent short read coverage with weak tiling array hybridization signal reliably flags deletions.
Interestingly, individual deletions were frequently observed in two or more of the accessions examined, suggesting
that variation in gene content partly reflects a common history of deletion events.
Background
Ultra-high throughput sequencing (UHTS) has become
affordable to re-sequence genomes of model organisms,
such as Arabidopsis thaliana [1-5]. While identification
of single nucleotide polymorphisms (SNPs) and small
indels from UHTS short reads is relatively easy, detection
of structural variation, such as larger deletions, is less
straightforward [2,3,6,7]. This is particularly true for
analysis of divergent genomes, such as those of Arabidop-
sis strains that are not closely related to the reference
accession, Columbia-0 (Col-0). For instance, the accuracy
of short read mapping depends on the number of poly-
morphic sites permitted per read [8]. If it is set too high, it
can result in read mapping to false locations; if it is set too
low, it can prevent mapping to the correct location.
Moreover, local accumulation of polymorphisms with
respect to the reference genome can occur and such reads
could only be correctly mapped with unrealistically
relaxed settings that would interfere with overall correct
annotation. Consequently, the corresponding reference
genome regions would not be covered in standard map-
ping protocols, and whether or not these regions reflect
excess polymorphism or deletions would remain ambigu-
ous. Novel technologies, such as paired end read
sequencing, combined with novel instruments, might
eventually enable precise mapping of larger deletions.
However, to date bioinformatic tools to exploit such data
are still scarce [6], and whether the available algorithms
deliver comprehensive analyses has not been experimen-
tally verified.
Another tool to predict deletions are genome tiling
array hybridizations, either through statistical analysis of
hybridization signals [9-11] or empirically determined
thresholds [12,13]. In these approaches, signal ratios from
hybridizations with DNA from a divergent strain versus
DNA from the reference strain used for array design are
analyzed to infer absence of the sequence homologous to
a given tile. However, experimental verification suggests
that deletions predicted in this manner contain a high
number of false positives (approximately 47%) [13].
Finally, although inherently difficult and non-compre-
hensive [14,15], contig-building from UHTS could iden-
tify larger deletions in genome variants with some
success [3]. Interestingly, these correlated with reduced
hybridization signal in corresponding re-sequencing
arrays [3,7,16]. Thus, intersection of UHTS with tiling
array hybridization could be a powerful tool to pinpoint
deletions. Here we applied this procedure to investigate
genomic variation in four divergent, isogenized Arabi-
dopsis strains (so-called accessions): Eilenburg-0 (Eil-0),
Loch Ness-0 (Lc-0), Slavice-0 (Sav-0) and Tsushima-1
(Tsu-1).
* Correspondence:
1
Department of Plant Molecular Biology, University of Lausanne, Biophore
Building, CH-1015 Lausanne, Switzerland
Santuari et al. Genome Biology 2010, 11:R4
/>Page 2 of 8
Results and discussion
Novel UHTS data were generated for Eil-0, Lc-0 and Sav-
0 using an Illumina Genome Analyzer II platform, while
published data for Tsu-1 [3] served as comparison. To
estimate the quality of our data, we mapped the Eil-0 and
Lc-0 short reads onto previously established approxi-
mately 94 kb (Eil-0) and approximately 96 kb (Lc-0) of
high quality genomic DNA sequence obtained from 144
loci by dideoxy sequencing [12]. Mapping with three mis-
matches allowed in the 5', 28 bp of each 35- to 36-bp read
to account for sequencing errors using MAQ (Mapping
and Assembly Quality software) [17] failed to cover
approximately 1.3% (Eil-0) and 5.0% (Lc-0) of sequence,
which thus appeared to be absent. Such missing sequence
is not unusual and could reflect insufficient coverage
(17.1 for Eil-0, 6.4 for Lc-0), the stochastic nature of the
sequencing process, or technical biases [3,5,18-20].
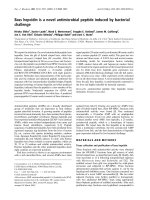
Mapped onto the Col-0 reference sequence [21], the
Eil-0, Lc-0, Sav-0 and Tsu-1 UHTS reads failed to cover
approximately 5.6 Mb, 8.5 Mb, 6.5 Mb and 5.5 Mb,
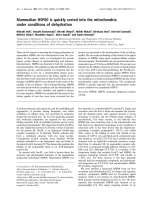
respectively (Figure 1a). Average coverage after mapping
was approximately 14.0 (Eil-0), 5.1 (Lc-0), 11.6 (Sav-0)
and 22.5 (Tsu-1) (Figure 1b). Similar mapping of Col-0
short reads obtained from re-sequencing [3] also could
not cover approximately 1.3 Mb (average coverage
approximately 20.9), suggesting that in the divergent
accessions, portions of the genome escaped UHTS or
were too polymorphic to be correctly mapped. Insuffi-
cient coverage could be one reason as mapping a subset
of the Tsu-1 reads, equaling the number of Eil-0 reads,
increased the non-covered sequence from approximately
5.5 Mb to 7.1 Mb (Figure 1b). However, insufficient cov-
erage could not explain all missing homologous sequence,
as estimated by the lower end of coverage distribution
(Additional file 1). Notably, this distribution did not fol-
low gamma or Poisson distributions that were recently
used to model coverage of short read sequences [3,22].
Thus, portions of the reference sequence must indeed be
missing in the accessions. Which exactly is difficult to
determine, however, because of bioinformatic constraints
on short read mapping [3,14,15,18,23]. To overcome
these limitations, we sought to complement UHTS by an
independent approach and thus intersected our short
read mappings with tiling array hybridizations.
Using available tiling array data [12] and additional
hybridizations, we determined the hybridization signal
ratio (that is, log
2
of mean signal from two arrays hybrid-
ized with divergent DNA divided by mean signal from
two arrays hybridized with Col-0 DNA) of all 25-bp tiles
(Affymetrix Arabidopsis Tiling 1.0R Arrays) for each
accession. To avoid ambiguities due to cross-hybridiza-
tion, we concentrated on tiles that are unique in the Col-0
genome [9]. Next, we determined the tiles' UHTS cover-
age based on our MAQ mappings. Tiles that were not at
all covered were considered candidates for missing
sequence and analyzed further. We first applied an empir-
ically determined threshold [12] and selected tiles with a
signal ratio less than -1.5. To detect major deletions, we
focused on consecutive tiles that covered ≥300 bp (taking
into account spacing between tiles, typically 10 bp). For
experimental verification, we chose 47 deletions pre-
dicted on chromosome 1 of Eil-0 (26) or Tsu-1 (21) and
designed flanking primers (Additional file 2). In replicate
PCR experiments with independent genomic DNA tem-
plate preparations, we then observed a consistent pattern:
nearly all (46) loci could be amplified from Col-0 DNA as
expected; by contrast, loci presumptively deleted in Eil-0
could not be amplified from Eil-0 DNA, but could be
amplified from Tsu-1 DNA, and vice versa; loci presump-
tively missing from both Eil-0 and Tsu-1 could not be
amplified from either background. Inspection of the tiles
flanking the loci, up to and beyond primer locations,
revealed that they were often not covered and had nega-
tive, although not <-1.5, signal ratios (average -0.85 for
Eil-0, -1.22 for Tsu-1). Thus, our criteria were apparently
overly stringent. The particular threshold used should be
driven by the goals of particular researchers and the cost
associated with false positive or false negative inferences
(Additional file 3). In the following, we focused on an
empirical threshold of less than -1.0 derived from the sig-
nal ratios describe above and the average ratios from
polymorphic tiles in the Eil-0 and Lc-0 dideoxy reference
sequences. This simple threshold identified a set of puta-
tive deletions with high confidence.
To estimate technical variability, we first intersected
Col-0 tiling array hybridizations and UHTS data [3]. Out
of 2.88 million tiles considered, 62,720 displayed a signal
ratio <-1.0, and 4,711 could not be covered by UHTS
reads (Figure 1c). The intersection of the two groups was
only 212 tiles. Considering the range of intersection in
the four accessions (46,008 to 61,798 tiles), false positives
due to technical variability thus appeared to be relatively
low. In the divergent genomes, a significant fraction of
intersection tiles might represent SNP hotspots that
could not be mapped [7]. Interestingly, such hotspots
have been preferentially found around confirmed dele-
tions in rice strains [24]. However, the fraction of such
tiles should be relatively low, as even high levels of poly-
morphism (5 to 10 SNPs in 25 bp) resulted in rather mild
negative signal ratio as determined from the dideoxy data
(average -0.21). Moreover, based on the <-1.0 threshold,
we selected 21 predicted deletions ≥100 bp from Lc-0, the
accession with lowest UHTS coverage. For PCR verifica-
tion, primers were this time designed to anneal in well
covered flanking regions (Additional file 2). All 21 loci
could be amplified and 17 displayed deletions in Lc-0.
Thus, our method performed well even with limited
UHTS data.
Santuari et al. Genome Biology 2010, 11:R4
/>Page 3 of 8
Approximately 57% of Eil-0 reads and all Lc-0 reads
originated from paired end sequencing runs, which
would principally enable direct prediction of deletions
from paired end map positions. To estimate the perfor-
mance of our approach, we thus re-analyzed the Eil-0 and
Lc-0 reads using the Breakdancer algorithm [6], an exten-
sion of MAQ that takes into account spacing between
mapped paired end reads to predict deletions. Interest-
ingly, this approach generally predicted fewer deletions
(Additional file 4) and failed to identify 2 out of 17 exper-
imentally confirmed deletions in Lc-0, and 17 out of 26 in
Eil-0 (Additional file 2). Importantly, this was true for
repeated analyses that explored the Breakdancer parame-
ter range. Thus, with our data, intersection of UHTS with
tiling arrays yielded more comprehensive information,
particularly with respect to larger deletions, such as those
experimentally verified for Eil-0.
Next, we mapped substantial putative deletions within
genes - that is, no read coverage combined with a signal
ratio <-1.0 for at least 100 bp. By these criteria, 1,220 (Eil-
0), 1,312 (Lc-0), 1,344 (Sav-0) and 987 (Tsu-1) genes with
deletions were identified (Additional file 5). Many of
these deletions (36.6 to 41.4%) affect the coding region
and thus likely impair gene activity (Additional file 6). As
evident from plots of coverage versus signal ratio, tiles
fulfilling our criteria frequently clustered and spanned
significant portions of the genes (for example, Figure 1d).
Moreover, they were often surrounded by tiles with no
coverage and negative, although not <-1.0, signal ratios.
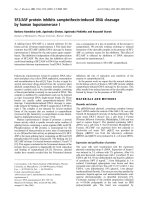
Even with the <-1.0 threshold strictly maintained, many
genes appeared to be affected by rather large deletions
(Figure 2), which would eliminate significant portions of
coding sequence.
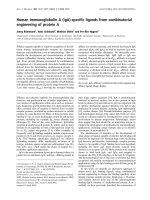
We also observed a strong bias in the distribution of
deletions. Generally, genes annotated as transposable ele-
ment genes were more abundant than expected (41.6 to
48.5% of all loci; that is, 3.3 to 3.9-fold over-represented; P
< 0.001 [χ
2
statistic]), matching reports from SNP analy-
ses [3,10,11]. Conversely, genes annotated as protein cod-
ing were under-represented. While bias towards
transposable element genes could be expected given their
role as generally non-essential genetic material, another
observation was less obvious, namely large overlap
between the genes with predicted deletions in the differ-
ent genotypes. For the transposable element genes, only
17.2 to 24.3% of deletions were unique for a given acces-
sion, while all others were shared with at least one of the
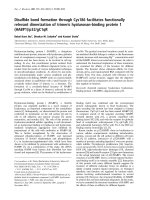
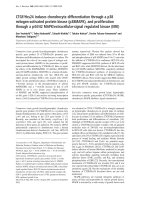
three other backgrounds (Figure 3a). More than one-
third (38.6 to 45.2%) of genes were affected in at least
three accessions, and 21.7 to 28.9% (n = 138) in all four
genotypes. A similar pattern was evident for protein cod-
ing genes, although the proportion of uniquely affected
genes was somewhat higher (25.8 to 38.5%) (Figure 3b).
Still, a high amount (16.6 to 25.0%) of them was affected
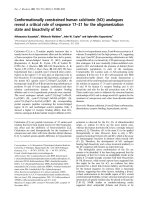
UHTS and tiling array statistics for the investigated acces-
sions
Figure 1 UHTS and tiling array statistics for the investigated ac-
cessions. (a) Total number of short reads (35 bp for paired end runs; 36
bp for single end runs) obtained for each accession after quality filter-
ing and calculated raw coverage (single end runs were performed for
Eil-0, Lc-0 and Sav-0; additional paired end runs for Eil-0 and Lc-0; Tsu-
1 and Col-0 reads from single end runs were obtained from published
data). For Tsu-1, a subset of reads was retrieved (Tsu-1
red
) for compara-
tive purposes. (b) Average coverage after MAQ mapping of the short
reads onto the Col-0 reference genome and number of base-pairs in
the reference genome with zero coverage. (c) Genomic tiling array sta-
tistics. Left: number of unique tiles with relative hybridization signal ra-
tio <-1.0 (log
2
) calculated from the averages of two array hybridizations
with divergent DNA versus two array hybridizations with the reference
DNA. Middle: number of unique tiles with no UHTS coverage across all
25 bp of the tile. Right: intersection between the two groups of tiles.
(d) Example plot of tiling array signal ratio (top panel) versus UHTS cov-
erage (bottom panel). The entire gene (At1g31100) appears to be de-
leted in Eil-0, but appears to be intact in Lc-0. Please refer to Figure 3c
for detailed plot labels.
Total number
of reads
77,097,465
30,599,068
53,534,405
140,010,701
77,097,465
122,018,790
Eil-0
Lc-0
Sav-0
Tsu-1
Tsu-1
red
Col-0
Accession
23 fold
9 fold
16 fold
42 fold
23 fold
37 fold
Av. raw read
coverage
5,638,020
8,534,840
6,541,693
5,473,194
7,093,836
1,317,460
Total bp with
no coverage
Eil-0
Lc-0
Sav-0
Tsu-1
Tsu-1
red
Col-0
14.0 fold
5.1 fold
11.6 fold
22.5 fold
12.3 fold
20.9 fold
Av. coverage
after mapping
Accession
Tiles with signal
< -1.0 (log
2
)
90,835
108,132
101,749
82,724
98,497
4,711
225,423
198,136
272,057
239,432
239,432
62,763
Tiles with
no coverage
Eil-0
Lc-0
Sav-0
Tsu-1
Tsu-1
red
Col-0
57,221
60,358
61,798
46,008
51,475
212
Intersection
Accession
(a)
(c)
(b)
(d)
1 kb
At1g31100
Eil-0
Lc-0
Santuari et al. Genome Biology 2010, 11:R4
/>Page 4 of 8
Genome-wide distribution and size of deletions within genes
Figure 2 Genome-wide distribution and size of deletions within genes. Deletions were called by intersecting a tiling array signal ratio <-1.0 (log
2
)
of individual 25-bp tiles with no coverage of the entire tiles by UHTS short reads, for at least 100 bp. Tiles within a gene that fulfilled these criteria were
added up, taking into account the gaps between tiles (typically 10 bp; maximum 39 bp), to calculate the approximate proportion of a gene affected
by a deletion(s) (y axis). Each dot represents a gene: red dots represent transposable element genes (which cluster around the centromeres); black
dots represent protein coding genes. The genes are plotted along the five Arabidopsis chromosomes (chr.), drawn to scale (x axis).
100
80
60
40
20
0
100
80
60
40
20
0
100
80
60
40
20
0
100
80
60
40
20
0
Eil-0
Lc-0
Sav-0
Tsu-1
chr. I chr. II chr. III chr. IV chr. V
% of gene region affected by deletion; red: transposable element genes; black: protein coding genes
Santuari et al. Genome Biology 2010, 11:R4
/>Page 5 of 8
Overlap of deletions between two or more of the four accessions examined
Figure 3 Overlap of deletions between two or more of the four accessions examined. (a) Venn diagram of the overlap between transposable
element genes for which deletions (that is, tiling array signal ratio <-1.0 (log
2
) and no short read coverage for at least 100 bp) could be detected in the
different accessions. (b) Same as (a), for protein coding genes. (c) Example plot of tiling array signal ratio versus UHTS short read coverage for a gene
(At1g09840) in all four accessions. Top panels: tiling array signal ratio (log
2
), with the -1.0 threshold indicated by a red line. Bottom panel: correspond-
ing short read coverage after MAQ mapping. A major deletion shared by two accessions (Eil-0 and Lc-0) and another shared by all four accessions are
highlighted.
Santuari et al. Genome Biology 2010, 11:R4
/>Page 6 of 8
in all four backgrounds (n = 127). Although the exact
extent of individual deletions would have to be deter-
mined by dideoxy sequencing, they frequently appeared
to be roughly identical in the different accessions. More-
over, patterns of deletions were often shared between
accessions (for example, Figure 3c), suggesting that they
reflect a common ancestry and history of rearrange-
ments.
Conclusions
Our study suggests that combination of UHTS with tiling
array analysis is a valid and economical approach to reli-
ably flag deletions in divergent genomes. Analysis of the
four divergent genomes suggests that deletions preferen-
tially affect transposable element genes, but also signifi-
cant numbers of protein coding genes. Our observation
that many predicted deletions are shared between two or
more of the accessions examined suggests that variation
in gene content to some degree reflects a common his-
tory of deletion events, which has been partly shaped by
transposable element activity.
Materials and methods
Tiling arrays: mapping and pre-processing
DNA samples (extracted with Qiagen [Hilden, Germany]
DNeasy Plant kits according to the manufacturer's
instructions) from the four accessions were hybridized to
Affymetrix GeneChip
®
Arabidopsis Tiling 1.0R arrays in
duplicate as described [12]. Probe sequences from the
BPMAP specification of the array (At35b_MR_v04-
2_TIGRv5) were mapped on the Col-0 TAIR8.0 genome
release downloaded from The Arabidopsis Information
Resource (TAIR) [25], using BioConductor [26]. Only
probes with a perfect match and single occurrence in the
genome were retrieved. Approximately 15% of reads in
each sample represented contamination from organelle
DNA. For each accession, probe intensities from two til-
ing array hybridizations were normalized by quantile nor-
malization along with the intensity values of the two
reference array hybridizations of Col-0 DNA. The log
2
ratio of the mean of the two intensities from the accession
arrays over the mean of the two intensities from the con-
trol arrays was taken as the reference signal for each tile.
UHTS: genome-wide mapping of short reads and coverage
analysis
The genomes of Eil-0, Lc-0 and Sav-0 were re-sequenced
using the Illumina Genome Analyzer II platform accord-
ing to the manufacturer's instructions. Several lanes of
either single end runs (Eil-0 and Sav-0) or paired end runs
(Eil-0 and Lc-0) were produced for each accession. Short
reads from single end runs for Col-0 and Tsu-1 were
retrieved from published data [3]. For each accession,
short reads were filtered by quality (MAQ standard set-
tings) and mapped on the TAIR 8.0 Col-0 genome using
the MAQ algorithm [17]. We allowed up to three mis-
matches in the first (5') 28 bp of the read. The number of
reads mapped on each base-pair was considered in all
subsequent analyses and we defined it as the read cover-
age. For each tile, we computed the mean coverage across
the 25 bp interval on the genome relative to the probe
sequence and we used this information in the comparison
of the tiling array signal with the short read coverage.
Purely bioinformatic deletion mapping taking into
account the information from paired end data was per-
formed using the Breakdancer algorithm [6], an extension
to MAQ.
Mapping of short reads to the Eil-0 and Lc-0 dideoxy
reference sequence
Short reads from the Eil-0 accession were mapped onto
94,076 bp of dideoxy sequence obtained from 144 loci of
the Eil-0 genome, onto 95,980 bp of dideoxy sequence
obtained from 144 loci of the Lc-0 genome using the
MAQ software. We allowed from zero up to three mis-
matches in the mapping process to take into account pos-
sible sequencing errors. We performed five repetitions in
order to see how much the reads with several possible
mapping positions on the reference sequence affect the
coverage.
Identification of deletions and gene level analysis
For each of the four accessions, we analyzed the mean
coverage and the signal relative to the genomic positions
of the probe sequence of each tile. We identified regions
where the probe sequences are spaced by typically 10 bp,
but always less than 40 bp, and are characterized by hav-
ing no short read coverage and a tile signal ratio below an
arbitrary threshold. According to the analysis of the dis-
tribution of the signal in each array, at first we decided to
set this threshold to be <-1.5. After PCR validation of
major deletions in Eil-0 and Tsu-1, we were able to deter-
mine a less stringent threshold, <-1.0, and we repeated
the above analysis to annotate putative deletions for each
strain. To understand how these deletions affect func-
tional gene content in the accessions, we considered the
base-pair positions of the deleted regions that span the
genes, based on the TAIR 8.0 GFF gene annotation. We
first analyzed untranslated regions, exons and introns,
according to the 'mRNA' feature in the GFF annotation
file, and then focused on the coding sequences of the
genes, the 'CDS' (coding sequence) feature in the GFF file.
Molecular biology and plant materials
Plant tissue culture and molecular biology procedures
followed routine protocols as described [12,27]. Tiling
array source files are available from ArrayExpress
[ArrayExpress:E-MEXP-2220], all short reads generated
Santuari et al. Genome Biology 2010, 11:R4
/>Page 7 of 8
in this study are available from the NCBI-GEO short read
archive [NCBI-GEO:SRA009330]. The scripts used for
the bioinformatics analyses of our data are provided in
Additional files 7 and 8.
Additional material
Abbreviations
Col-0: A. thaliana accession Columbia-0; Eil-0: A. thaliana accession Eilenburg-0;
Lc-0: A. thaliana accession Loch Ness-0; MAQ: Mapping and Assembly Quality
software; Sav-0: A. thaliana accession Slavice-0; SNP: single nucleotide poly-
morphism; TAIR: The Arabidopsis Information Resource; Tsu-1: A. thaliana acces-
sion Tsushima-1; UHTS: ultra-high throughput sequencing.
Authors' contributions
CSH, LS, KH, IX and TEJ conceived this study and analyzed the data with help
from SP. CSH wrote the manuscript together with LS and TEJ; JT performed the
UHTS sequencing runs; ED contributed the Sav-0 tiling array data; AMAV exper-
imentally verified deletions; all bioinformatics analyses were performed by LS.
All authors read and approved the final manuscript.
Acknowledgements
We would like to thank O Hagenbüchle and A Paillusson for Affymetrix tiling
array hybridizations and S Plantegenet for DNA samples and help with primer
design. The computations were performed at the Vital-IT Center for high-per-
formance computing of the Swiss Institute of Bioinformatics. This study was
supported by the University of Lausanne, by a Marie-Curie post-doctoral fel-
lowship awarded to ED, by National Science Foundation grant DEB 0823305
awarded to TEJ, and by SystemsX 'Plant growth in a changing environment'
funding for CSH, IX and LS.
Author Details
1
Department of Plant Molecular Biology, University of Lausanne, Biophore
Building, CH-1015 Lausanne, Switzerland,
2
Swiss Institute of Bioinformatics, Genopode Building, CH-1015 Lausanne,
Switzerland,
3
Lausanne DNA Array Facility, Center for Integrative Genomics, University of
Lausanne, Genopode Building, CH-1015 Lausanne, Switzerland and
4
Section of Integrative Biology and Institute for Cellular and Molecular Biology,
The University of Texas at Austin, 1 University Station C0930, Austin, Texas
78712, USA
References
1. Hillier LW, Marth GT, Quinlan AR, Dooling D, Fewell G, Barnett D, Fox P,
Glasscock JI, Hickenbotham M, Huang W, Magrini VJ, Richt RJ, Sander SN,
Stewart DA, Stromberg M, Tsung EF, Wylie T, Schedl T, Wilson RK, Mardis
ER: Whole-genome sequencing and variant discovery in C. elegans. Nat
Methods 2008, 5:183-188.
2. Lister R, Gregory BD, Ecker JR: Next is now: new technologies for
sequencing of genomes, transcriptomes, and beyond. Curr Opin Plant
Biol 2009, 12:107-118.
3. Ossowski S, Schneeberger K, Clark RM, Lanz C, Warthmann N, Weigel D:
Sequencing of natural strains of Arabidopsis thaliana with short reads.
Genome Res 2008, 18:2024-2033.
4. Srivatsan A, Han Y, Peng J, Tehranchi AK, Gibbs R, Wang JD, Chen R: High-
precision, whole-genome sequencing of laboratory strains facilitates
genetic studies. PLoS Genet 2008, 4:e1000139.
5. Wei W, McCusker JH, Hyman RW, Jones T, Ning Y, Cao Z, Gu Z, Bruno D,
Miranda M, Nguyen M, Wilhelmy J, Komp C, Tamse R, Wang X, Jia P, Luedi
P, Oefner PJ, David L, Dietrich FS, Li Y, Davis RW, Steinmetz LM: Genome
sequencing and comparative analysis of Saccharomyces cerevisiae
strain YJM789. Proc Natl Acad Sci USA 2007, 104:12825-12830.
6. Chen K, Wallis JW, McLellan MD, Larson DE, Kalicki JM, Pohl CS, McGrath
SD, Wendl MC, Zhang Q, Locke DP, Shi X, Fulton RS, Ley TJ, Wilson RK, Ding
L, Mardis ER: BreakDancer: an algorithm for high-resolution mapping of
genomic structural variation. Nat Methods 2009, 6:677-681.
7. Clark RM, Schweikert G, Toomajian C, Ossowski S, Zeller G, Shinn P,
Warthmann N, Hu TT, Fu G, Hinds DA, Chen H, Frazer KA, Huson DH,
Scholkopf B, Nordborg M, Ratsch G, Ecker JR, Weigel D: Common
sequence polymorphisms shaping genetic diversity in Arabidopsis
thaliana. Science 2007, 317:338-342.
8. Gilad Y, Pritchard JK, Thornton K: Characterizing natural variation using
next-generation sequencing technologies. Trends Genet 2009,
25:463-471.
9. Zhang X, Byrnes JK, Gal TS, Li WH, Borevitz JO: Whole genome
transcriptome polymorphisms in Arabidopsis thaliana. Genome Biol
2008, 9:R165.
10. Borevitz JO, Liang D, Plouffe D, Chang HS, Zhu T, Weigel D, Berry CC,
Winzeler E, Chory J: Large-scale identification of single-feature
polymorphisms in complex genomes. Genome Res 2003, 13:513-523.
11. Vaughn MW, Tanurdzic M, Lippman Z, Jiang H, Carrasquillo R, Rabinowicz
PD, Dedhia N, McCombie WR, Agier N, Bulski A, Colot V, Doerge RW,
Martienssen RA: Epigenetic natural variation in Arabidopsis thaliana.
PLoS Biol 2007, 5:e174.
12. Plantegenet S, Weber J, Goldstein DR, Zeller G, Nussbaumer C, Thomas J,
Weigel D, Harshman K, Hardtke CS: Comprehensive analysis of
Arabidopsis expression level polymorphisms with simple inheritance.
Mol Syst Biol 2009, 5:242.
Additional file 1
Distribution of the read coverage for the five Arabidopsis chromo-
somes across the different accessions
Distribution of the read coverage for the five Arabidopsis chromosomes
across the different accessions.
Additional file 2
Experimentally tested deletions predicted in Eil-0 and Tsu-1, posi-
tions and primer sequences
Experimentally tested deletions predicted in Eil-0 and Tsu-1, positions and
primer sequences.
Additional file 3
Unique Col-0 tiles without UHTS coverage at different thresholds
Number of unique tiles from the Col-0 genome without UHTS coverage in
the four accessions for different tiling array signal ratios.
Additional file 4
Deletions predicted from paired end reads of the Eil-0 and Lc-0
genomes by the Breakdancer algorithm
Deletions predicted from paired end reads of the Eil-0 and Lc-0 genomes
by the Breakdancer algorithm.
Additional file 5
Genes affected by deletions in the four accessions as compared to
Col-0
Genes carrying deletions as predicted from intersection of UHTS and til-
ing arrays.
Additional file 6
Subset of genes whose coding region is affected by deletions
The subset of genes whose coding sequence is carrying deletions as pre-
dicted from intersection of UHTS and tiling arrays.
Additional file 7
Script for intersection of UHTS and tiling array data
Script for computing the UHTS coverage and signal ratio of array tiles.
Additional file 8
Script for deletion detection
Script for deletion prediction based on intersection of UHTS coverage and
tiling array signal.
Received: 30 November 2009 Revised: 5 January 2010
Accepted: 12 January 2010 Published: 12 January 2010
This article is available from: 2010 Santuari et al.; licensee BioMed Central Ltd. This is an open access article distributed under the te rms of the Creative Commons Attribution License ( s/by/2.0), which permits unrestricted use, distribution, and reproduction in any medium, provided the original work isproperly cited.Genome Biology 2010, 11:R4
Santuari et al. Genome Biology 2010, 11:R4
/>Page 8 of 8
13. Emerson JJ, Cardoso-Moreira M, Borevitz JO, Long M: Natural selection
shapes genome-wide patterns of copy-number polymorphism in
Drosophila melanogaster. Science 2008, 320:1629-1631.
14. Butler J, MacCallum I, Kleber M, Shlyakhter IA, Belmonte MK, Lander ES,
Nusbaum C, Jaffe DB: ALLPATHS: de novo assembly of whole-genome
shotgun microreads. Genome Res 2008, 18:810-820.
15. Simpson JT, Wong K, Jackman SD, Schein JE, Jones SJ, Birol I: ABySS: a
parallel assembler for short read sequence data. Genome Res 2009,
19:1117-1123.
16. Zeller G, Clark RM, Schneeberger K, Bohlen A, Weigel D, Ratsch G:
Detecting polymorphic regions in Arabidopsis thaliana with
resequencing microarrays. Genome Res 2008, 18:918-929.
17. Maq: Mapping and Assembly with Qualities [http://
maq.sourceforge.net]
18. Dohm JC, Lottaz C, Borodina T, Himmelbauer H: Substantial biases in
ultra-short read data sets from high-throughput DNA sequencing.
Nucleic Acids Res 2008, 36:e105.
19. Pinard R, de Winter A, Sarkis GJ, Gerstein MB, Tartaro KR, Plant RN, Egholm
M, Rothberg JM, Leamon JH: Assessment of whole genome
amplification-induced bias through high-throughput, massively
parallel whole genome sequencing. BMC Genomics 2006, 7:216.
20. Harismendy O, Ng PC, Strausberg RL, Wang X, Stockwell TB, Beeson KY,
Schork NJ, Murray SS, Topol EJ, Levy S, Frazer KA: Evaluation of next
generation sequencing platforms for population targeted sequencing
studies. Genome Biol 2009, 10:R32.
21. The Arabidopsis Genome Initiative: Analysis of the genome sequence of
the flowering plant Arabidopsis thaliana. Nature 2000, 408:796-815.
22. Shen Y, Sarin S, Liu Y, Hobert O, Pe'er I: Comparing platforms for C.
elegans mutant identification using high-throughput whole-genome
sequencing. PLoS ONE 2008, 3:e4012.
23. Bentley DR: Whole-genome re-sequencing. Curr Opin Genet Dev 2006,
16:545-552.
24. Tian D, Wang Q, Zhang P, Araki H, Yang S, Kreitman M, Nagylaki T, Hudson
R, Bergelson J, Chen JQ: Single-nucleotide mutation rate increases close
to insertions/deletions in eukaryotes. Nature 2008, 455:105-108.
25. The Arabidopsis Information Resource []
26. Bioconductor []
27. Sibout R, Plantegenet S, Hardtke CS: Flowering as a condition for xylem
expansion in Arabidopsis hypocotyl and root. Curr Biol 2008, 18:458-463
.
doi: 10.1186/gb-2010-11-1-r4
Cite this article as: Santuari et al., Substantial deletion overlap among diver-
gent Arabidopsis genomes revealed by intersection of short reads and tiling
arrays Genome Biology 2010, 11:R4