Báo cáo y học: "Genomic features defining exonic variants that modulate splicing" ppt
Bạn đang xem bản rút gọn của tài liệu. Xem và tải ngay bản đầy đủ của tài liệu tại đây (1.47 MB, 23 trang )
RESEARC H Open Access
Genomic features defining exonic variants that
modulate splicing
Adam Woolfe
1*
, James C Mullikin
2
, Laura Elnitski
1*
Abstract
Background: Single point mutations at both synonymous and non-synonymous positions within exons can have
severe effects on gene function through disruption of splicing. Predicting these mutations in silico purely from the
genomic sequence is difficult due to an incomplete understanding of the multiple factors that may be responsible.
In addition, little is known about which computational prediction approaches, such as those involving exonic
splicing enhancers and exonic splicing silencers, are most informative.
Results: We assessed the features of single-nucleotide genomic variants verified to cause exon skipping and
compared them to a large set of coding SNPs common in the human population, which are likely to have no
effect on splicing. Our findings implicate a number of features important for their ability to discriminate splice-
affecting variants, including the naturally occurring density of exonic splicing enhancers and exonic splicing
silencers of the exon and intronic envi ronment, extensive changes in the number of predicted exonic splicing
enhancers and exonic splicing silencers, proximity to the splice junctions and evolutionary constraint of the region
surrounding the variant. By extending this approach to additional datasets, we also identified relevant features of
variants that cause increased exon inclusion and ectopic splice site activation.
Conclusions: We identified a number of features that have statistically significant representation among exonic
variants that modulate splicing. These analyses highlight putative mechanisms responsible for splicing outcome
and emphasize the role of features important for exon definition. We developed a web-tool, Skippy, to score
coding variants for these relevant splice-modulating features.
Background
The majority of genes in mammalian genomes are made
up of multiple exons separated by much longer intr ons.
TocreateamaturemRNA,exonsmustbeidentified
accurately from within the transcript and then spliced
tog ether by removing the intervening introns. This pro-
cess is carried out by a large complex of small nuclear
RNAs and polypeptides known as the spliceosome. Dis-
ruption to the fidelity of splicing, particularly of exons
that are constitutively spliced, can effectively inactivate a
gen e by creating unstable mRNAs and defective protei n
structure, or cause disease by disrupting the balance of
expression of different splice isoforms [1]. The most
important features for exon recognition are the splice
junctions that define the boun daries of the exons, at
which the spliceosome must assemble. Mutations at
sites causing splicing abnormalities make up around
15% of all point mutations that result in human genetic
disease[2].However,thisfigureislikelytobeasignifi-
cant underestimate of the contribution of splicing in dis-
ease, as there is an increasing number of studies
showing that mutations within both exons and introns,
but outside of the canonical splice sites, can also disrupt
splicing [3]. In particular, the ability of nonsense, mis-
sense and even synonymous (silent) mutations to cause
exon skipping is often overlooked due to the strong
association of exonic mutations solely with protein cod-
ing changes. Indeed, as the skipping of the exon can
lead to the removal of an entire protein domain or
degra dation of the mRNA via nonsense-mediated decay,
splice-affecting variants (including synonymous changes)
are much more deleterious than most missense muta-
tions that substitute a single amino acid. Similarly, exo-
nic variants can also result in deleterious effects by
activating a de novo (that is, not pre-existing) ectopic
* Correspondence: ;
1
Genomic Functional Analysis Section, National Human Genome Research
Institute, National Institutes of Health, Rockville, Maryland 20892, USA
Woolfe et al. Genome Biology 2010, 11:R20
/>© 2010 Woolfe et al.; licensee BioMed Central Ltd. This is an open access article distributed under the terms of the Creative Commons
Attribution License ( censes/by/2.0), which permits unrestricted use, distribution, and reproduction in
any medium, provide d the original work is properly cited.
splice site, which is then used in preference to the nat-
ural splice site, shortening the exon. A well- known
example of this is a synonymous mutation in exon 11 of
the human LMNA gene that creates a 5’ ectopic splice
site. This shortens the protein sequence through frame-
shift, and causes the rare premature aging disorder
Hutchinson-Gilford progeria [4].
The mechanism by which these internal exonic muta-
tions exert their effect is still not full y understood, but
they are most commonly associated with changes in reg-
ulatory elements within the exon that are important for
exon definition. The spliceosome must distinguish genu-
ine splice sites from a collection of sequences in the
intron that resemble them but are never used (known as
pseudo splice-sites). Therefore, correct exon recognition
requires additional auxiliary signals present both within
the exon and in the introns, as canonical splice sites are
notsufficienttodefinetheproper splice sites. These
regulatory sequences, important in both constitutive and
alternative splicing, can bebroadlydefinedbytheir
intergenic location and their effects on splicing. Those
located within the exon and promoting e xon inclusion
are referred to as exonic splicin g enhancers (ESE s) and
those inhibiting exon inclusion are referred to as exonic
splicing silencers (ESSs). Similarly those located in the
intro n are referred to as intronic splicing enhancers and
intronic splicing silencers, although these are more com-
monly associated with specifying alternative splicing [5]
or splicing of non-canonical introns [6].
Although identification and characterization o f the
complement of proteins that bind specific exonic enhan-
cer and silencer elements is far from complete, most
enhancer sequences within exons have been found to
bind members of the serine/arginine-rich (SR) protein
family, while many silencing elements are bound by
members of the heterogeneous ribonuclearprotein
(hnRNP) family [7]. E SE-bound SR proteins promote
exon definition by directly recruiting and stabilizing the
spl icing machinery through protein-protein inter actions
[8] and/or antagonizing the funct ion of nearby silencer
elements [9]. Silencers are not as well characterized as
enhancers, but ESS-bound hnRNPs are thought to med-
iate silencing through direct antagonism of the splicing
machinery or by direct compe tition for overlapping
enhancer-binding sites. The intrinsic strength by which
the splice sites are recognized by the spliceosome as
well as the antagonistic dynamics of p roteins binding
ESEs and E SSs control much of exon recognition and
alternative splicing. It is therefore not surprising that
exonic splicing regulatory sequences (ESRs) are now
increasingly recognized as a major target and a common
mechanism for disease-causing mutations leading to
exon skipping in functionally diverse genes. Examples of
disease mutations reported to destroy ESE motifs and
cause exon skipping include those in the BRCA1 [10 ],
SMN1/2 [11], PDHA1 [12] and GH [13] genes.
Given the critical role of these sequences in exon spli-
cing, significant research efforts are focused on identify-
ing the complement of ESE and ESS binding sites
involved in constitutive splicing. The assortment of
enhancer and silencer sequences recognized by known
splicingfactorsisconsiderable[3].Thissuggeststhat
ESRs may represent num erous functionally distinct
classes, or may be recognized in a degenerate fashion.
This ‘fuzzy’ defini tion of ESRs has meant that their pre-
cise characterization has proved challenging. A large
group of existing ESE/ESS datasets has been identified
either experimentally [14,15] or through the use of com-
putational approaches followed by some form of experi-
mental verification of a subset of predictions [16-19]
(for an overview see Table 1 and [20]). The motifs
defined in each dataset are commonly represented as
hexamers or octomers, or encoded as position weight
matrices analog ous to tran scription factor binding sites.
Motifs predic ted by these approaches are partially over-
lapping, but also yield certain proportions that are
unique or even contradictory. Rec ent studies have also
suggested that both global and local RNA secondary
structure may also play a role in the recognition and
activity of splicing regulatory motifs in certain c ases
[21,22]. Despite ou r access to these varied splicing regu-
latory datasets, the question of whether they are effec-
tive in detecting the appropriate splicing regulatory
changes associated with splice modulating variants has
yet to be systematically assessed.
The development of high throughput sequencing tech-
nologies provides an unprecedented opportunity to
identify disease alleles associated with both common
and rare disorders. In the likelihood that exonic splice-
affecting mutations are a commonly overlooked phe-
nomena in disease and transcript variation, it is impor-
tant to identify the genomic features most relevant in
characterizing novel splice-affecting genome variants
(SAVs). We performed a comparative analysis using sets
of experimentally verified SAV s against SNPs common
in the human population, the majority of which are
likely to be splicing-neutral. Comparative analysis of
SNP datasets is a powerful approach to highlight charac-
teristics that define disruptive sequence variants. A simi-
lar approach has been employed previously to predict
SNPs affecting transcriptional cis-regulation [23] as well
as to measure selective pressure on genomic elements
such as conserved non-coding sequences [24] and spli-
cing enhancers [25]. Here, we focused our main analyses
on the most prevalent and least characterized SAVs,
those that cause exon skipping, using a battery of bioin-
formatics approaches as well as a systematic comparison
of all currently available ESE/ESS datasets, to identify
Woolfe et al. Genome Biology 2010, 11:R20
/>Page 2 of 23
the features of these SAVs and their ex onic/intronic
environment that are most likely to be predictive for
exon skipping events. Extending this analysis, we also
identified relevant features associated with SAVs causing
increased exon inclusion and ectopic splice site creation.
Combined, these features are useful to predict t he prob-
ability of novel splice-modulatory events and are made
available through a web server.
Results
To identify features associated with exon skipping SAVs,
we collated a set of experimentally verified variants in the
human genome that independently cause exon skipping
from extensive literature searches and the Alternative
Splicing Mutation Database [26]. We excluded all var-
iants from this list that may affect splicing through other
well-defined mechanisms, such as nonsense-mediated
exon skipping or disruption of canonical splice sites (see
Materials and methods). A total of 87 variants were iden-
tified (currently the largest dataset of its kind), and their
genomic positions mapped back onto the human genome
(hg18). As the majority of analyses in this paper involve
exon-skipping SAVs, we refer to thes e variants simply as
‘SAVs’, unless otherwise indicated. This set is made up of
32 synonymous and 55 missense SAVs distributed across
43 genes and 47 individual exons (Additional file 1). Of
these, 87% (41) were constitutively spliced and 13% (6)
were alternatively spliced cassette exons.
In addition to known SAVs, a set of spicing-neutral
variants (that is, that have little or no effect on exon
splicing) served as a standard for comparison.
Although no large-scale set of experimentally verified
splice-neutra l variants has been published, through lit-
erature searches we i dentified a set of 80 variants that
were tested in mini-gene splicing assays and were
found to have no effect on splicing (Additional file 2).
Unfortunately, around half of these derive from artifi-
cial mutagenesis studies, and may therefore include
certain artificial biases. As an alternative, since exon-
skipping events are likely to be largely deleterious, we
exploited the principle that SAVs will be largely absent
from polymorphisms common in the human popula-
tion. Phase II HapMap SNPs represent both a high
quality and extensive genome-wide set of human poly-
morphisms, as they have been genotyped f or 270 i ndi-
viduals in four populations [27]. From this set of 3.1
million SNPs, we took all SNPs that fell in internal
(that is, spliced) coding exons that were polymorphic
in at least one individual and filtered them in the same
way as SAVs (see Materials and methods). In addition,
we only retained SNP s where we could determine the
ancestral and derived allele with high confidence by
utilizing orthologous positions in the chimp and maca-
que genomes. This approach allowed us to make an
assumption of the allele directionality, which was
important for detecting loss or gain of splice regulatory
elements. The resulting dataset contained 15,547 SNPs
with roughly equal numbers of synonymous and mis-
sense alleles (7,922 and 7,625, respectively). These
SNPs fell within 13,163 individual exons from 7,038
genes. For ease of reference, we refer to this set of
HapMap SNPs as ‘hSNPs’.
Using these sets of variants, we carried out compara-
tive analyses to identify the features that discriminate
Table 1 Exonic splicing regulatory elements datasets used in this study
ESR
dataset
Format Method Reference
ESEFinder 4 ESE PWMs Set of four experimentally derived ESE binding site matrices for four SR proteins (SF2, SC35, SRp40,
SRp55) identified by an in vitro SELEX approach with specific SR protein complementation
[14]
Fas- (hex3)
ESS
176 ESS hexamers Set of experimentally derived ESSs identified in vivo through cloning of random decamers into
fluorescence activated minigene reporter by selecting those sequences that cause exon skipping.
Unique candidates were clustered and represented by non-degenerate hexamers
[15]
RESCUE-
ESE
238 ESE hexamers Set of putative ESEs derived from overrepresented hexamer motifs in exons versus introns and exons
with weak splice sites versus exons with strong splice sites
[17]
PESX 2,096 ESE/974 ESS
octomers
Set of putative ESEs (PESE) and ESSs (PESS) overrepresented and underrepresented in internal non-
coding exons versus unspliced pseudoexons and 5’ UTRs of intronless genes
[18]
NI-ESR 979 ESE/496 ESS
hexamers
Uses the neighborhood inference (NI) algorithm to identify new candidate ESEs and ESSs using a set
of previously identified ESEs/ESSs. The NI algorithm searches the sequence neighborhood of a
particular hexamer and scores it by whether the surrounding sequences contain mostly known ESEs,
ESSs or neither. Predicted candidates were verified by cross-validation and a subset was
experimentally validated
[19]
Ast-ESR 285 hexamers Motifs based on computational analysis of overrepresented and conserved dicodons in orthologous
human-mouse exons. Putative ESRs are not labeled as ESEs or ESSs as a number were found to act as
both enhancers and silencers in minigene assays depending on sequence context.
[16]
Composite-
ESR
400 ESE/217 ESS
hexamers
Combined set of ESE/ESS based on RESCUE-ESE, PESE, PESS and Fas-ESS datasets [60]
PWM, position weight matrix.
Woolfe et al. Genome Biology 2010, 11:R20
/>Page 3 of 23
SAVs from hSNPs, which can be described at the
sequence level (such as changes in the underlying spli-
cing regulatory sequences and physical location within
exons), or at the exon level (to predispose an exon to
exon-skipping events) to enableapredictiveframework
for uncharacterized variants.
Variant-based features
Changes in exonic splicing regulatory sequences
Our systematic assessment of all seven currently avail-
able ESR datasets examined their ability to identify
splice-regulatory elements in the verified SAV
sequences. This approach assessed the types of motif-
altering changes associated with SAVs and provided
benchmarking of the seven ESR collections (Table 1) to
determine which most strongly differentiated real splice-
affecting variants from common polymorphisms. Of
these seven sets, two contain ESEs (ESEFinder and RES-
CUE-ESE), one represents ESSs (Fas-ESS) and the
remaining four sets contain both ESEs and ESSs (PESX,
NI-ESR, Ast-ESR and Composite-ESR). For both SAV
and hSNP sequences we measured three possible types
of changes in t he ancestral versus derived allele (or wild
type versus disease allele) as a result of the variant: ESR
loss, ESR gain and ESR alteration (see Materials and
methods).
We first examined whether the proportion of SAVs
with a particular type of ESR c hange was significantly
different from that of hSNPs. Our comparative analyses
identified two significant changes associated with va r-
iants that cause exon skipping: the gain of sequences
defined as ESSs and the loss of sequences defined as
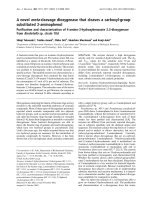
ESEs (Figure 1; Additional file 3). Of these, we found
that ESS gains had stronger discriminatory p ower than
ESE losses. All the ESS datasets identified a significantly
greater proportion of SAVs causing gains of ESSs. In
contrast, results for ES E losses were split. NI-ESE, RES-
CUE-ESE and Comp-ESE showed a moderate but
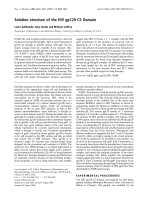
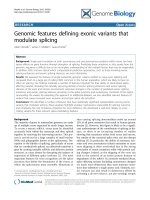
Figure 1 Proportion of variants with gains or losses in exonic splicing regulatory sequence with significant differences between
splice-affecting genome variants and HapMap SNPs. SAVs were characterized by (a) the loss of ESEs and (b) the gain of ESSs. As a
comparison, ESEfinder, Ast-ESR and PESE losses are also included. These were not significantly different between SAVs and hSNPs. Z score P-
values from random bootstrap sampling relating to each type of change are located on the right of the histogram.
Woolfe et al. Genome Biology 2010, 11:R20
/>Page 4 of 23
significantly greater proportion of ESE losses in SAVs
than hSNPs. Lo sses of ESEfind er motifs wer e roughly
equal between SAVs and hSNPs, both as a group of
motifs and individually (Figure 1; Additional file 3).
Nevertheless, we hypothesized that b ecause the thre sh-
old set for each ESEFinder binding site is somewhat
arbitrary, single base changes that cause a bin ding site
to be ‘lost’ may n ot be functionally equivalent and that
changes in certain positions may be less tolerated than
others. We found one position in each binding matrix
that occurred at significantly higher numbers in SAVs
compa red to hSNPs (by c
2
test, P < 0.05; Additional file
4). Hence, there may be different functional constraints
acting along the binding sites that are not properly cap-
tured by the default scoring thresholds and the po sition
weight matrix scores as currently employed. Ast-ESRs,
while not explicitly defined as ESEs or ESS s, showed no
significant difference between variant groups for losses,
alterations or gains [16]. Consistent with the direction
of the previous ESR changes, SAVs were also signifi-
cantly diminished for gains of ESEs using t he NI-ESE
dataset (Figure 1; Additional file 3).
The extent of ESR changes further differentiates SAVs from
hSNPs
We investigated whether SAVs are further distinguished
by the cumulative extent of the ESE losses and ESS
gains. Many of the sets of putative ESRs are represented
as hexamers (for example, RESCUE-ESE, NI-ESRs,
PESXs, and so on), either because this is often the size
of a single protein-binding site (for example, the GAA-
GAA ESE [28]), or because they are a reduced represen-
tation of larger binding sites. Because point variants may
modulate sever al overlapping binding sites simulta-
neously, those affecting larger numbers of predicted
sites are more likely to have significant impact, for
which we assessed predictive power. The results showed
that in all ESR sets except ESEfinder, numbers of ESS
gains and ESE losses were much greater in SAVs than
hSNPs (Additional file 3). We saw the g reatest separa-
tion from hSNPs using NI-ESSs gains (98 gains in SAVs
versus a mean of 32 in hSNPs, Z-score P = 1.92 × 10
-17
)
and NI-ESEs losses (138 losses in S AVs versus a mean
of 69 in hSNPs, Z-score P =2.68×10
-10
), although
RESCUE-ESE, Fas-ESS and Composite-ESR also give
good, strongly statistically significant separations, despite
the much smaller size of these datasets compared to NI-
ESRs (Table 1).
For NI-ESR, losses or gains of two or more motifs were
prevalent, with the divergence between SAVs and hSNPs
becoming larger as the total number of occurrences
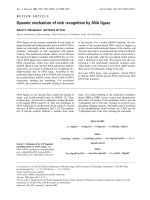
increased (Figure 2a, b). When the extent of ESS gains and
ESE losses were combined as a total number of changes,
46% of SAVs had four or more such changes compared to
only 9% for hSNPs (Figure 2c). Furthermore, we compared
the set of 80 experimentally verified splice-neutral variants
against the hSNP dataset and found that no category of
ESR change was significantly different (Additional file 3).
This supports our assumption that hSNPs act as an appro-
priate proxy for splice-neutral variants and confirms that
significant ESR difference s are detectable between splice-
affecting and splicing-neutral datasets.
Finally, using a recently established computational
method [22], we investigated whether taking local RNA
secondary structure into consideration improved the
ability to distinguish functionally relevant ESR changes
in SAVs from those in hSNPs. We found little evidence
that lo cal RNA secondary structure, as implemented by
this method, improved our ability to differentiate these
two datasets further (see Additional file 5 for methods
and results).
Splice-altering sequence changes are under negative
selection in common SNPs
In the previous comparative analyses, we assumed that
the differential signal in ESR changes between SAVs and
hSNPs was a composite consequence of both functional
ESR changes in SAVs and selective pressure to avoid
those changes in common hSNPs [25]. To test this
assumption, we investigated whether the proportion of
each type of ESR change in SAVs a nd hSNPs, using the
NI-ESR dataset, would differ when compared to an
‘expected’ neutral distribution created through permuta-
tion (see Materials and methods). This permuted dist ri-
bution represents what we would expect if variants
occurred randomly under no selective pressure for spli-
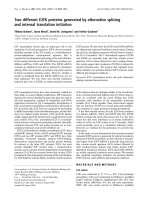
cing. We found that while hSNPs followed the expected
distribution closely for many of the changes, SAVs had
almost two-fold higher proportions of ESS gain s and ESE
losses (Figure 3), confirming that these types of changes
were a non-random, characteristic property of SAVs.
Moreover, the highly significant difference in ESS gains
between SAVs and hSNPs can be further explained by a
significant reduction for this type of change in hSNPs
compared to the expected distribution (5.6% of changes
inhSNPsversus8.3%underneutrality,c
2
test P =1.7×
10
-8
), suggesting negative selection against the gain of
silencers in common variants. We also identified a five-
fold increase in the proportion of variants that cause
direct changes from an ESE to an ESS in SAVs compared
to both the expected and hSNP distributions (4.1% of
changes in SAVs versus 0.8% unde r neutrality/hSNPs, c
2
test P =3.8×10
-12
; Figure 3), indicating that this type of
change represents a strong indicator of splice-affecting
changes.
Significant ESR changes in variants that increase exon
inclusion
We carried out the same comparative analysis a gainst
hSNPs using a smaller set of 20 exonic variants that
have been experimentally verified to cause increased
Woolfe et al. Genome Biology 2010, 11:R20
/>Page 5 of 23
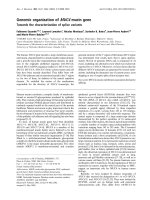
Figure 2 Splice-affecting genome variants are characterized by losses of large numbers of NI-ESEs and the gain of large numbers of
NI-ESSs, often in combination. For both ESE losses and ESS gains, the proportion of SAVs with changes of two or more were significantly
greater compared to hSNPs. Combinations of ESE losses and ESS gains, as opposed to each occurring independently, are highly enriched in
SAVs compared to hSNPs (bottom graph).
Woolfe et al. Genome Biology 2010, 11:R20
/>Page 6 of 23
exon inclusi on (Additional file 6). A lthough lacking
some of the s tatistical power of the larger exon skip-
ping SAV set, we found that these variants were signif-
icantly enriched for ESSs losses (21 losses versus a
mean of 5 in hSNPs, empirical P =1×10
-4
; Additional
file 3). They also exhibited greater numbers of ESE
gains(25gainsversusameanof15inhSNPs,empiri-
cal P = 0.034) and lower numbers of ESE losses (5
losses versus a mean of 16 in hSNPs, empirical P =
0.0097).Thesechangesweretheoppositeofthe
changes caused by skipping SAVs and consistent with
regulatory changes expected to increa se exon defini-
tion. These results highlighted the antagonistic inter-
play between ESEs and ESSs in stabilizing or
destabilizing exonic splicing.
Proximity to exon boundaries
Previous studies have shown that a number of exonic
characteristics are affected by proximity to the exon
junction, including ESE density [25], evolutionary con-
straint [16,29] and codon bias [30]. Although
circumstantial, this evidence supports the view that the
boundaries of exons contain regulatory ‘hotspots’ that
maybemorecriticaltosplicingthancentralized
regions. To investiga te whether SAVs are more likely to
be disruptive if located preferentially in these hotspot
regions, we divided all SAV exons and HapMap exons
into six equal parts and binned the SAV or hSNP var-
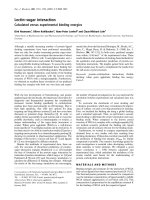
iants according to their locations. Figure 4 shows that
hSNPs were distributed roughly equally across the
exons, with a small depletion at exon boundaries,
whereasSAVswereenrichedclosetotheexonbound-
aries and depleted towards the center (46% of SAVs
located at the peripheral sections of exons versus 28.5%
of hSNPs, P = 0.005). Nevertheless, over a quarter of
the SAVs are located within the central sections of the
exon, suggesting that while variants located at the per-
ipheries of the exon are likely to have the greatest effect
on splicing, other elements important for splicing may
be found at positions across the exon, but not with dis-
criminatory power for this analysis.
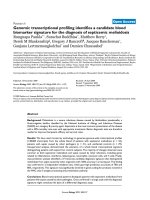
Figure 3 Distribution of specific types of NI-ESR changes for SAVs and hSNPs compared to neutral expectation. The tilde symbol (~)
signifies an alteration where the hexamer is designated an ESE, neutral or ESS in both the wild-type and variant sequences. The arrow
represents the direction of the change as a consequence of the change between wild type and variant hexamer. The neutral expected
distribution reflects the underlying probability of each type of change given the ESE/ESS distribution among NI hexamers and the genome-wide
nucleotide substitution bias in coding regions.
Woolfe et al. Genome Biology 2010, 11:R20
/>Page 7 of 23
Regulatory evolutionary constraint of SAV regions
The availability of multiple sequenced mammalian gen-
omes provides the opportunity for evolutionary compar-
isons of functional constraint across related species.
Splicing patterns and exonic splicing regulatory ele-
ments are generally conserved across mammals [31].
Therefore, sequences important for splicing should be
detectable by greater evolutionary sequence conserva-
tion; a case that is proven for intronic factors [32]. We
hypothesized that the regions surrounding SAVs should
be under greater evolutionary constraint than regions
surrounding neutral v ariants. However, within coding
exons, the constraint on the sequence due to splicing
has to be decoupled from pre-existing protein-coding
constraint. One solution is to measure conservation at
synonymous codon positions, which are normally con-
sidered to be neutrally evolving. Several studies have
demonstrated that ESRs increase selective constraint on
synonymous positions [16,33]. An extreme example is
the ultra-conservation of coding sequences that are
associated with auto-regulatory alternative splicing of
‘poison exons’ in SR proteins [34].
To score regulatory constraint in coding regions, we
created an expectati on-based scoring matrix for each of
the 192 positions of the genetic code. The scores were
invers ely proportional to conservation levels in genome-
wide human/mouse/rat/dog DNA multiple alignments
(see Materials and methods). By using a scoring scheme
based on real evolutionary data, the scoring matrix not
only preferentially scores synonymous over non-synon-
ymous positions, but also incorporates other influences,
such as codon bias and hypermutability. For example,
the highest scores in the matrix are at synonymous posi-
tions in hypermutable CpGs ( that is, TC
G, ACG, CCG
and GC
G) as these are the least conserved coding posi-
tions genome-wide (Figure 5a). U sing this scoring
matrix, w e calculated regulatoryconstraint(RC)scores
in localized coding regions, representing all possible
hexamer positions surrounding a variant, for all SAVs
and hSNPs (Figure 5b) and compared the mean RC
scores of all non-overlapping regions for each set.
Results showed that sequences containing SAVs had sig-
nificantly higher mean conservation scores than a ran-
dom sampled distribution of hSNPs (1.583 versus a
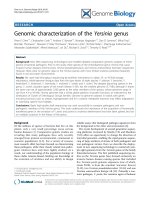
Figure 4 SAVs are enriched at the borders of exons. SAV and hSNP containing exons were divided into six equal sections and the
proportion of variants falling into each section was plotted. While hSNPs were roughly distributed equally across the exon (with some depletion
towards the edges), SAVs are significantly enriched at both edges of the exon (P = 0.005).
Woolfe et al. Genome Biology 2010, 11:R20
/>Page 8 of 23
mean of 1.233 in hSNPs, Z score P = 5.71 × 10
-9
; Figure
5c, orange distribution).
We addressed a variety of sources of bias that could
confound the outcome of the conservation analysis. For
example, rates of synonymous and non-synonymous
substitutions decrease close to splice junctions [29,30].
Data from hSNPs confirmed this result by showing that
the RC scores were negatively correlated with distance
from the s plice junction (Additional file 7). However,
since SAVs are enriched close to splice junctions, we
repeated the analysis choosing hSNPs with similar dis-
tances from the splice junction as those in the SAV set.
This shifted the hSNP distribution to greater mean RC
scores (Figure 5c, blue distribution), but the difference
with SAVs remained highly significant (1.583 versus a
mean of 1.266 in hSNPs, Z score P = 1.92 × 10
-8
).
Figure 5 Regions surrounding SAVs are under greater non-coding evolutionary constraint. (a) We created a 192-codon position-specific
scoring matrix based on genome-wide conservation levels across mammals. Matrix scores are visualized increasing from green to red. As scores
are inversely proportional to the genome-wide conservation of each codon position, conservation levels can also be visualized using the same
matrix, decreasing from green to red. (b) For each variant, four-way mammalian multiple DNA alignments were extracted for a region
surrounding the variant, and a score assigned to each fully conserved column via the scoring matrix, and the total normalized by the length of
the alignment. An example of a random synonymous CgG variant is shown. (c) The mean conservation score for all SAVs (blue arrow) and SAVs
on autosomes (yellow arrow) was compared to a distribution of randomly sampled sets of scores from all hSNPs (orange distribution). Randomly
sampled distributions of hSNPs were also created controlling for minimum distance from a splice junction by having similar distributions in this
regard as SAVs (blue distribution). A distribution of mean conservation scores was also produced for hSNPs from autosomes also controlled by
minimum distance from the splice site (yellow distribution).
Woolfe et al. Genome Biology 2010, 11:R20
/>Page 9 of 23
A second potentially significant source of bias was due
to SAVs on the X chromosome contributing 35% of the
variant set, compared to just 1.38% of the hSNP set.
Prior SNP analyses identified the X chromosome as hav-
ing lower rates of heterozygosity than autosomes [27],
and human-mouse comparisons showed that genes on
this chromosome were under greater evolutionary selec-
tion [35]. It was possible, therefore, that the prevalence
of SAVs from the X chromosome contributed to the sig-
nificantly higher conservation scores. We found that
mean RC scores for hSNPs on the X chromosome were
significantly higher than for other chromosomes (1.34
versus 1.24, Kolmogorov-Smirnov (K-S) test P = 0.008).
Similarly, SAVs on the X chromosome had a higher
mean RC score than SAVs on other chromosomes but
the difference was not statistically significant (1.57 ver-
sus 1.67, K-S test P = 0.33) due to small sample sizes.
We therefore repeated the analysis using only SAVs and
hSNPs on autosomes (also controlling for distance from
the splice junction; Figure 5c, yellow distribution). The
diff erence in mean RC scores was further decreased but
nevertheless remained highly significant (1.55 versus
1.25, Z score P =1.28×10
-5
). Therefore, the predomi-
nance of SAVs from the X chromosome was not suffi-
cient to explain the greater regulatory constraint
surrounding SAVs.
We also examined whether SAV exons w ere more
highly conserved than HapMap exons. We c ompared
percent-identity from fou r-way multiple alignments,
across entire exons or within non-synonymous positions
of exons, excluding the X chromosome. No significant
differences were found in mean percent-identities in
non-synonymous positions (89% in SAV exons versus
88.7% in hSNP exons, Z score P =0.122)oroverall
(77% in SAV exons versus 75% in hSNP exons, Z score
P = 0.063). Furthermore, similar results were obtained
using HapMap exons of all sizes, or those that closely
resembled the size distribution of SAV exons. By con-
trolling for alternative sources of constraint we con-
cluded SAVs occur in regions of exons that a re under
greater non-coding constraint, indicative of negative
selection for important function.
Exonic environment
We addressed features associated with exon definition to
test whether exons containing SAVs (which we will term
‘SAV exons’) are significantly different in these aspects
from exons containing hSNPs (termed ‘HapMap exons’)
or from exons in general, indicative of a pre-existing
weakness or predisposition to the effects of SAVs.
Exon size
AcomparisonofexonlengthsbetweenSAVandHap-
Map exons showed that SAV exons were significantly
smaller ( mean = 125.1 bp versus 197.8 bp, K-S test P =
1.269 × 10
-7
). However, further comparison of the SAV
exons to internal exons from the Hollywood exon anno-
tation database [36] showed that both the mean (125 bp
versus 136 bp, P = 0.39) and median (112 bp versus 120
bp, P = 0.051) values of the SAV exons, although lower,
were not statistically different in a randomized bootstrap
analysis (see Materials and methods). When compared
directly to constitutive Hollywo od exons, HapMap
exons were significant ly larger (K-S test P < 2.2 × 10
-16
).
We examined the potentially confounding problem of
larger HapMap exons through simulation analyses and
showed that the probability of an exon containing a
SNP increased as exon length increased (see Materials
and methods). The simulated exons with SNPs had the
same length distribution as HapMap exons (Additional
file 8). We therefore cont rolled for equivalent exo n size
in all subsequent analyses.
Splice site strengths
Signals critical for exon definition are the 5’ and 3’
spl ice sites and branch point. The strength of these sig-
nals may influence whether an exon is constitutively or
alternatively spl iced, creating conditional dependency on
ESEs and vulnerability to their loss. We found that the
mean 5’ and 3’ splice site scores were lower in SAV
exons than HapMap exons but were not statistically sig-
nificant (Table 2). Assessing exons with large numbers
(≥ 2) of NI-ESEs losses and/or NI-ESS gains revealed
stronger 3’ splice site scores in HapMap exons than
SAV exons (Table 2), suggesting stronger 3’ splice sites
mayshieldsomeHapMapexonsfromtheeffectsof
ESR-changing SNPs. Ne vertheless, the large overlap in
splice site strengths between these two groups indicated
that splice site strength could not be used to uniquely
predict SAV vulnerability in exons.
ESR density in exons and introns
A major feature postulated to distinguish exons from
introns is higher densities of ESEs and low or absent
densities o f ESSs. The exact opposite is true of introns
and pseudoexons. We therefore looked at the density of
exonic splicing regulators in SAV and HapMap exons
using the NI-ESRs. We found that SAV exons have sig-
nificantly lower densities of ESEs and higher densi ties of
ESSs across the exon length (Table 2 and Figure 6). To
confirm that these were features specific to SAV exons
rather than something particular to HapMap exons, we
repeated the compari son to random genome-wide exons
and found very similar results, suggesting t hat this is a
feature characteristic of SAV exons. ESR densities of
SAV exons are, in many cases, more comparable to an
intronic environment represented in flanking introns
(mean ESE density = 0.26, mean ESS density = 0.2; see
Materials and methods). Moreover, directly flanking
SAV exons, we found that intronic sequences showed
higher densities of ESSs and slightly lower densities of
ESEs than around hSNP exons (Table 2).
Woolfe et al. Genome Biology 2010, 11:R20
/>Page 10 of 23
Variants that activate de novo ectopic splice sites
Next, we assessed features that define exonic variants
that create de novo ectopic splice sites. We used a set of
54 experimentally verified examples of de novo ectopic
splice site variants (Additional file 9) to discern features
that distinguish our two sets of SAVs (that is, ‘ectopic
SAVs’ and ‘skipping SAVs’) from each other and from
hSNPs. First, to measure splice site creation, we used a
simple metric, ΔSS, to measure the ma ximum difference
in splice site scores between these two sequences for all
possible 5’ and 3’ splice sites around the variants (see
Materials and methods). A large positive delta score
sugges ts a change in the surro unding sequence towards
a better scoring splice site. Requiring a relatively low
ΔSS score of at least 1 captured the majority of ectopic
SAVs (approximately 85%) compared to 20% of skipping
SAVs and 8% of hSNPs. We also compared the highest-
scoring variant-generated splice site to the natural splice
site score. Over half of ectopic SAVs created ectopic
splice sites that were comparable to or stronger than the
natural splice site, in contrast to a tiny proportion of
skipping SAVs and hSNPs (Figure 7a). Thus, these two
metrics represent excellent features to discriminate ecto-
pic SAVs from splicing SAVs. In support of this conclu-
sion, one of the two exon skipping SAVs we predicted
to also create strong ectopic splice sites, a synonymous
mutation in the ATR gene, has been shown
experimentally to cause a combination of both exon
skipping and ectopic 5’ splice site activation [37].
An additional feature of ectopic SAVs was a highly sig-
nificant excess of ESS gains (P =2.85×10
-15
)andESS
alterations (P = 1.95 × 10
-3
) comp ared to hSNPs, similar
to that seen in skipping SAVs. The degree of ESS gains
in ectopic SAVs was even greater than that for skipping
SAVs, averaging 1.28 ESS gains per variant compared to
1.12 for skipping SAVs and 0.39 in hSNPs. When aver-
aged across all internal constitutive exons, we found NI-
ESS density spiked near splice j unctions (Figure 7b),
which was consistent with previous studies on smaller
ESS datasets [15,38], suggesting a possible explanation
for the excess in ESS gains. To address this further, we
compared the ectopic SAVs to a set of 54 hSNPs that
were tightly scored as ‘ectopic-like’ (but showed no evi-
dence of splice site creation in mRNA or EST datasets;
see Materials and methods). We found that ec topic
SAVs had almost a 2.5-fold greater number of ESS gains
(68 versus 28) and a 1.8-fold greater number of ESS
alterations (23 versus 13), despite both sets having simi-
lar distributions of maximum ectopic splice site scores
(KS-test P = 0.11). The process of creating strongly
scoring splice-site consensus sequences could not, there-
fore, fully explain the enrichment in ESS changes in
SAVs. A dditional ESS creation may facilitate activation
of the new ectopic splice sites by inhibiting the natural
Table 2 Significance of exon and intron-related features for skipping SAV and HapMap exons
Exon feature SAV mean hSNP sampled mean Z-score P-value
Exon splice junction strength
Exon 3’ SS score (all exons) 7.811 8.489 -1.90 0.057
Exon 5’ SS score (all exons) 7.885 8.302 -1.43 0.154
Exon 3’ SS score (with ESR) 7.568 8.534 -2.03 0.022
Exon 5’ SS score (with ESR) 8.008 8.371 -1.71 0.230
Exon ESR density
ESEfinder density FL 0.126 0.152 -3.78 1.53 × 10
-4
NI-ESE density FL 0.323 0.372 -3.37 7.37 × 10
-4
NI-ESS density FL 0.133 0.093 4.30 1.67 × 10
-5
ESEfinder density W40 0.129 0.153 -3.15 0.0016
NI-ESE density W40 0.324 0.379 -3.47 5.18 × 10
-4
NI-ESS density W40 0.140 0.094 4.50 6.85 × 10
-6
Intronic ESR densities
Upstream NI-ESE density 0.201 0.224 -1.55 0.122
Downstream NI-ESE density 0.235 0.250 -1.06 0.314
Upstream NI-ESS density 0.295 0.241 2.44 0.014
Downstream NI-ESS density 0.258 0.210 2.36 0.018
For each feature, the mean values for non-redundant SAV exons were compared to a bootstrap distribution of sampled means for HapMap exons of similar sizes
(hSNP sampled mean). For exon splice junction strength, results marked ‘all exons’ indicate that the comparison was done using all exons in both datasets and
those marked ‘with ESR’ indicate comparisons using only exons containing a variant with splice-associated ESR changes, that is, ESE loss and/or ESS gain. For
exon ESR densities, densities were e ither measured across the full length of the exon (FL) or in windows of 40 bp at either side of the exon (W40). For exons <80
bp in length, the W40 density is the same as full length density to avoid redundancy. Intronic ESR densities were measured in the first 100 bp upstream and
downstream of the exon. SS, splice site.
Woolfe et al. Genome Biology 2010, 11:R20
/>Page 11 of 23
splice site. This is consistent with a functional study by
Wang et al. [38] whereby E SS motifs placed between
competing 5’ and 3’ splice sites consistently inhibited
the use of the intron-proximal splice site.
Finally, the location of ectopic SAVs and ‘ectopic-like’
hSNPs across exons revealed very different distributions
(Figure 7c). Ectopic SAVs were predominantly located
in the half of the exon closest to the natural splice site
they replaced. The reverse was true of ‘ ectopic-like’
hSNPs, which were distributed across the exon in an
opposite manner. These differences, in addition to the
lack of silencer gains, likely account for the lack of activ-
ity of these ‘ectopic-like’ hSNPs.
Skippy - a web tool for the detection of splice-modulating
exonic variants
It is important for researchers screening for causative
variants associated with disease to have access t o user-
friendly bioinformatics tools that can score variants for
relevant splice-associated features. In this way, variants
can be either prioritized for further splicing-based func-
tional assays or the results can be used to furthe r eluci-
date the mechanism of aberra nt splicing when a causal
variant has been implicated. T o this end, we deve loped
a publicly accessible web-based tool, Skippy, to allow
users to rapidly score human exonic variants for all rele-
vant exon-skipping features identified in this study. As
well as these features, Skippy can also be used to iden-
tify potential ectopic SAVs.
Unlike other splicing assessment tools that require
laborio us ext raction of the exonic/intronic sequence for
input and only allow a single sequence to be submitted
at a time (for example, [22,39]), Skippy requires only the
chromosomal location and identity of the variant alleles
as input, accepting up to 200 variants at a time. Results
are returned in HTML tabular form as well as a tab-
delimited text file. To facilitate interpretation of results,
Figure 6 Exons containing SAVs have significantly lower ESE and significantly higher ESS densities than exons containing hSNPs.Asan
illustration, the proportion of overlapping hexamers that are considered ESEs (green), ESSs (red) or splice neutral (grey) was plotted for 35 exons
containing SAVs (that cause ESE/ESS changes) and a set of 35 randomly selected, length-matched hSNP-containing exons. Exons in both sets are
sorted in descending order by ESS density.
Woolfe et al. Genome Biology 2010, 11:R20
/>Page 12 of 23
all scored features can be compared to distributions o f
hSNPs from similar genomic contexts. For example, the
RC score for a candidate variant can be compared to a
distribution of RC scores for hSNPs having similar fea-
tures, such as equivalent minimum distances from the
splice junctions. The web tool is freely available at [40].
Discussion
The emergence in recent years of high throughput geno-
typing and resequencing technologies provides an
unprecedented opportunity to identify disease alleles
associated with both common and rare disorders. As
functional characterization is highly laborious and time
consuming, computational prioritization is a preferred
approach to assessing disease candidates. Exonic muta-
tions are traditionally assessed for an effect on protein
function; however, t hose that are translationally silent
are often overlooked for roles in exon skipping and
ectopic splice site creation. Moreover, variants are
traditionally only considered in the vicinity of splice
sites if they fall directly at splice boundaries, whereas we
have shown that SAVs are enriched in regions near, but
not at, the splice junctions. Any of these seemingly
innocuous sequence changes may have greater conse-
quences for gene functio n than a single missense muta-
tion. We therefore showed that SAVs have novel
features distinguishing them from common human poly-
morphisms through a succession of bioinformatics
approaches and built a novel web tool for examining
genomic sequence changes that are likely to affect
splicing.
Exon skipping SAVs cause local changes in splice
regulatory elements
Our comparative analyses identify two main types of ESR
changes associated with exon skipping: the gain of
sequences defined as ESSs and the loss of sequences
definedasESEs.WearethefirsttoreportthatallESS
Figure 7 Features that characterize variants that activate de novo ectopic splice sites (’ectopic SAVs’). (a) Most ectopic SAVs, in contrast
to hSNPs and skipping SAVs, have a large ΔSS value and create an ectopic splice site that is stronger than the natural splice site. (b) Hexamers
in the vicinity of the splice junctions are largely made up of ESSs. The graph represents the proportion of positions occupied either by an ESE or
ESS motif across approximately 25,000 internal exons. Each position on the graph represents the first base of a hexamer sliding across 100 bp of
the upstream and downstream introns and the first and last 50 bp of the exon. (c) Ectopic SAVs are located predominantly in the vicinity of the
splice site of the same type created, that is, the majority of ectopic splice sites created are 5’ ectopic sites and are located towards the end of
the exon close to the 5’ splice site. hSNPs that create a strong ectopic splice site computationally (’ectopic-like’ hSNPs) are distributed across the
exon in quite the opposite way, indicating the same constraints do not apply to these variants.
Woolfe et al. Genome Biology 2010, 11:R20
/>Page 13 of 23
datasets showed a strong statistical enrichment for gain
of ESSs in known SAVs with a moderate to high signal to
noise ratio. Surprisingly, we also found that solely consid-
ering whether a variant causes ESE loss was a relatively
weak predictor of splice-affecting events. Although the
widely used ESEfinder matrices did not discriminate the
known SAVs from the control groups, other ESE datasets
(NI-ESE, RESCUE-ESE and Comp-ESE) showed statisti-
cally significant enrichments for ESE loss.
The study of ESR changes may not be a binary endea-
vor, as a single SNP can affect a number of putative
overlapping binding sites. We found that SAVs are
more strongly associated with the loss of large numbers
of ESEs and the gain of large numbers of ESSs. This
analysis also highlig hted the neigh borhood inference set
of putative ESRs (’NI-ESRs’) as providing the strongest
signal for exon skipping variants. NI-ESRs are a rela-
tively new set of predicted splice regulatory elements
and have therefore been little used in clinically asso-
ciated splicing studies to date. The neighborhood infer-
ence algorithm greatly enlarged the set of previously
known ESEs and ESSs to cover over a third of all possi-
ble hexamers, increasing the likeliho od of false positives
in our ESR change analysis. We nevertheless saw
impressive separation between SAVs and hSNPs, sug-
gesting that many of these novel ESRs represent func-
tional elements. None of our test set of known exon-
skipping variants was originally identified, nor confirmed
using this dataset.
As an illustration, a publishe d missense mutation in
exon 12 of the HEXB gene causes full exon skipping
and is responsible for chronic Sandhoff ’sdisease.The
variant was identified experimentally and subsequently
predicted to cause the loss of two ESEfinder sites [41].
Our analysis using NI-ESRs revealed that this mutation
caused the loss of five overlapping ESEs and the creation
of two overlapping ESSs (both of which were direct con-
versions from ESEs to ESSs). Notably, this extent of NI-
ESR changes, unlike those for ESEfinder, scored as
highly discriminative forSAVscomparedtohSNPs.
Furthermore, we found tha t concurrent loss and gain
events were b etter predictors t han single e vents. This
fact is illustrated by t he synonymous skipping mutation
of exon 7 in SMN2 that destroys t wo overlapping ESE
hexamers and creates two overlapping ESS hexamers.
Functiona l studies of SF2/ASF and hnRNPA1 binding in
this exon proved that reduced binding of SF2/ASF [11]
and increased binding of hnRNPA1 [42] were responsi-
ble for reduced inclusion of the SMN2 exon.
Increased silencer activity is likely for many SAVs
Although the loss of ESEs is the most commonly
assigned change in published splice-associated variant
studies, increased silencer f unction was seen in 37% of
our known exon skipping SAVs, in which each caused
the gain of two or more ESSs. The clear enrichment for
silencer creation in SAVs and selection against silencer
acquisition in common polymorphisms suggests that
this may be a major mechanism responsible for exon
skipping. Furthermore, for mutations in which the
mechanism of action has been experimentally studied,
with the exception of SMN2,nonewerestudiedforthe
possibility of increased silencer function. The impor-
tance of exonic silencers in splicing is further high-
lighted by our results showing that SAVs that cause
increased exon-inclusion are likely to operate largely by
thelossofESSs.Weconclude that newly c reated ESS
sites also facilitate formation of de novo ectopic splice
sites. The action of inhibiting a natural existing proximal
splice site, as ESS are known to do, would be similar to
those causing exon skipping when no other alternative
splice site was available.
Caveats
It is important to note that despite the strong signals we
identified, there are a number of limitations to solely
using ESR analyses in a predictive manner. For example,
even using the NI-ESR set, some SAVs were not cap-
tured with expected regulatory changes. Around 9% of
the SAVs had no relevant changes in any of the ESR
datasets, indicating that putative ESRs do not cover t he
full spectrum of functional splicing regulatory elements
or these variants act through an alternative mechanism
(for example, RNA secondary structure). Furthermore,
context is very important for ESR function. This fact
was highlighted by a recent study of ‘ designer’ exons
that placed different combinations of known ESEs and
ESSs within a minigene exon and found that exons with
the same proportion of enhancers and sile ncers exhib-
ited highly variable inclusion levels that were context
specific according to the order of r egulatory elements
across the exon [43].
Exon skipping SAVs occur in weakly defined exons
Our analyses of the exonic environment suggested that
an exon-skipping outcome was not necessarily solely
dependant on the changes in splice regul atory elements,
but may also be influenced by pre-existing features of
exon definition. In this analysis SAV exons were not dis-
cernibly weaker at splice sites than other exons. How-
ever, experimental studies have indicated that weak
splice sites are a factor. For example, the 5’ splice site of
SMN2 exon 7 was reported to be suboptimal through
experimental and compensatory analyses [44]. This find-
ing was not reproducible u sing solely computational
scoring, highlighting the limitations of current in silico
methods in detecting subtle but po tentially significant
features of exon definition.
Woolfe et al. Genome Biology 2010, 11:R20
/>Page 14 of 23
Along with context and strength of the splice sites,
exon definition is influenced by ESE and ESS motif den-
sities [43]. It is revealing, therefore, that SAV exons
have significantly lower densities of ESEs and signifi-
cantly greater densities of ESSs - a clear attribute of
weak exon definition. It is currently thought that spli-
cing efficiency increases linearly as the number of
enhancer elements increases because the role of multi-
site splice-regulatory elements is to increase the prob-
ability of an interaction between the regulatory complex
and the splicing machinery [45,46]. Conversely, as the
number of silencer elements increases, splicing efficiency
decreases [43]. Indeed, we found that ESS density of
many SAV exons was more comparable to that of
introns than exons. As weakly defined exons, they
appear vulnerable to variants that further modulate the
ESE/ESS density. Illustrating the point, some exons are
vulnerable to exon skipping by numerous SAVs. Seven
SAVs occur in constitutively spliced exon 12 of the
CFTR gene [47,48], whic h has a low ESE density (0.280
versus 0.371) and exceptionally high ESS density (0.293
versus 0.091) compared to mean densities in HapMap
exons.
Our results also suggest that ESS elements in the
introns may play a role in the susceptibility of exons to
SAVs. However, the function of ESSs in intro ns is not
fully elucidated [49,50]. If ESSs in introns act mainly as
intronic splicing silencers, they may make the exon
increasi ngly reliant on exonic splicing enhancers. Such a
case has been demonstrated for one of the SAVs in
exon 7 of SMN1 /SMN2, where removal of a flanking
intronic splicing silencer sequence compensated for the
exon skipping effect [51].
Conclusions
It is becomi ng increas ingly clear that both missense and
synonymous mutations within exons can have devastat-
ing effects on gene function by modulating splicing. The
location of these mutations in coding sequence, as well
as the lack of a clear strategy for their identification,
means that their effects are often overlooked. As a con-
sequence, known examples are currently small in num-
ber, but are likely to be underestimated. This work
provides the first la rge-scale analysis of exon skipp ing
variants to computationally characterize their genomic
context. We identified a number of features associated
with the variants and t heir exonic and intronic environ-
ments that are significantly different from common spli-
cing-neutral polymorphisms. Exon skipping SAVs are
characterized by extensive loss of exonic splicing enhan-
cers and gain of splicing silencers, often in combination.
They tend to occur in regions close to splice s ites and
in regions under greater non-coding evo lutionary selec-
tion. They also tend to occur in exons with a fairly weak
environment for exon definition that is the likely cause
of their vulnerability to skipping events.
Our comparative approach proved robust in identify-
ing relevant features in other types of SAVs too. Var-
iants that cause increased exon inclusion are
characterized by ESS loss and, to a lesser degree, the
gain of ESEs. Variants that activate an ectopic splice site
simultaneously create large numbers of ESSs, in addition
to a strong consensus splice site, and inhibit use of the
natural splice site. These results provide greater insights
into the possible mechanism ofactionofthesevariants
and should improve strategies for identifying disease
candidates. To this end, we have developed a web-based
tool, Skippy, to score candidate human genomic variants
for features predictive of an exon-skipping outcome or
creation of an ectopic splice site.
Materials and met hods
Collation of a set of known exonic variants causing exon
skipping
In total we collated a set of 87 SAVs by extracting synon-
ymous and missense variants from the Alternative Spli-
cing Mutation Database [26] (with a splicing effect score
<0), and from our own extensive literature searches. Only
single-point variants that had been experimentally veri-
fied for exon skipping were used in the re ference set. We
excluded the following: nonsense variants [3] (that is,
those that create a stop codon); and variants that affect
the splice junction (that is, 3 bp or les s from either splice
junction). Genomic p ositions for all 87 identified cases
(32 synonymous, 55 missense) were mapped back onto
the reference human genome (assembly Hg18). For the
analysis of the types of ESR changes involved in increased
exon inclusion, we used a set of 20 variants from the
Alternative Splicing Mut ation Database with splicing
effect scores >0 (7 synonymous, 13 missense).
Obtaining a comparator set of putatively splicing-neutral
coding SNPs
All ‘phase II’ HapMap SNPs (release 22), termed ‘hSNPs’,
that were polymorphic in at least one individual were
downloaded from the website [27]. SNPs had to fall
within an internal coding exon (using the Ensembl
known gene set, v45.36 g) and more than 3 bp away fr om
a splice junction. Directionality of mutations (that is, the
derived alleles) util ized three-way human-chimp-maca-
que MulitZ alignments (hg18, panTro2, rheMac2)
obtained from the UCSC Genome Bro wser [52] via
Galaxy [53]. SNPs were retained only if t here was a full
three-way alignment available, chimp and macaq ue bases
were identical, and one of the human alleles matched the
ancestral chimp-macaque base. hSNPs included within
the set of known SAVs were excluded from the compara-
tor set (rs2306159, rs4647603 and rs2295682 [54], rs688
Woolfe et al. Genome Biology 2010, 11:R20
/>Page 15 of 23
[55] and rs17612648 [56]). In addition, four hSNPs
(rs17658212, rs4963793, rs591 and rs3818562) with
reported correlations to splicing changes (but unverified)
[57] were also excluded. A total of 15,547 hSNPs (7,922
synonymous, 7,625 missense) were obtained. Derived
allele frequencies of >5% and >10% in at least one popu-
latio n were assessed. We found no appreciable difference
for any of our analyses when using SNPs with greater
derived a llele frequencies. In addition to our hSNP com-
parator set, we also identified a set of 80 variants from
the literature that have been experimentally tested in
mini-gene assays and found to have no effect on exon
splicing (Additional file 2).
Changes in exonic ESRs
For our analysis, we obtained six sets of ESR sequence
prediction datasets. Three comprised sets of bioinforma-
tically defined hexamers (RESCUE-ESEs (238 ESEs) [58],
NI-ESRs (979 ESEs and 496 ESSs) [19] and Ast-ESRs
(285 undefined hexamers) [16]). PESX ha s bioinformati-
cally defined octamers (2,096 PESEs and 974 PESSs)
[18]). Fas-Hex2 contains experimentally defined ESS
hexamers (176 ESSs) [15]). ESEfinder has four experi-
mentally defined position weight matrices for SR protein
binding sites [59]. Composite-ESRs are a combined set
of hexamers derived from PESX, RESCUE-ESE, and Fas-
Hex2 ESS, representing 400 ESEs and 217 ESSs [60].
The e ffect of SNP changes on ESR predictions was cal-
culated using a sliding window that covered all hexam-
ers surrounding the variant. N -mers that did not ‘score’
as an ESE or ESS were considered splicing-neutral.
Comparisons between the wild-type sequence (or ances-
tral allele) and the variant sequence (or derived allele)
measured ESR loss (for example, an ESE to a neutral),
ESR gain (for example, neutral to an ESE) and ESR
alteration (for example, ESE to a different ESE). In the
case of NI-ESRs, PESXs and c omposite ESRs, ESEs and
ESSs were considered separately. For the analysis of
changes in NI-ESRs, the types of changes between
alleles were counted for all overlapping hexamers in
which the variant was p resent. Expected proport ions for
each of the nine categories of change were calculated by
permutating every base of 4,096 hexamers to all remain-
ing bases (for example, A would be permutated to T, G
and C) to give 73,728 (4096 × 3 × 6) permuta tions. Base
substitution biases were taken into account by measur-
ing base substitutions in the hSNP derived allele set
(Additional file 10) and for each permutation, weighting
the ESR-chan ge category by the proportion of base sub-
stitutions of that type.
Regulatory evolutionary constraint
An expectation-based scoring matrix measuring regula-
tory constraint in coding sequences was created by
measuring the proportion of columns fully conserved
for each of the 192 codon positions using a randomly
selected set of 62,000 internal human exons in 6,428
genes from Ensembl (v47.36i). Exons were distributed
genome-wide and had conserved counterparts in mouse,
rat and dog genomes. Scores were assigned for each
codo n position by (1 - Pr
CODi
) × 10 where Pr
CODi
is the
proportion of columns in all the alignments that were
fully conserved for codon
COD
,positioni.Scoresfor
each codon position are therefore weighted so that they
are inversely proportional to their overall conservation
level. Conservation scores, measuring non-coding con-
straint in coding sequence, were calculated for regions
surrounding variants in the hSNP and SAV sets. Ortho-
logous sequences from human, mouse, rat and dog were
extracted from 17-way Mu ltiZ multiple alignments from
the UCSC Genome Browser [52] for 5 bp either side of
the SNP (representing all hexamers containing a SNP (a
total of 11 bp) using Galaxy python scripts [53]. Smaller
flanking regions were extracted if the variant was
located less than 5 bp from the splice junction. Only
ungapped alignments c ontaining at least two species in
addition to human were used. The RC score surround-
ing a variant RC
Var
was calculated as follows:
RC
s
ici
i
N
N
Var
1
where N is the number of columns in the alignment, i
is the column position, S
i
is the conservation status of
the column (1 for conserved across the alignment, 0 if
not fully conserved) and δ
ci
is the weight of the score
depending on the codon position of the sequence of i in
human (using the 192 codon scoring matrix). Pre-com-
puted conservation scores for each base of all internal
codingexonsinthehumangenome(assemblyHg18)
are available as a custom wiggle track on the UCSC gen-
ome b rowser from [40]. For all statistic al analyses, only
variants with non-overlapping regions were used to
avoid bias. To compare conservation in SAV exons and
HapMap exons, human/m ouse/rat/dog multiple align-
ments were extracted across all exons represented in
both sets. We computed the proportion of non-synon-
ymous sites and proportion of columns that were fully
conserved across the alignment within each exon.
Exon-based features
All exons (and their flanking intronic sequences) con-
taining SAVs and hSNPs were extracted from the
human genome (assembly Hg18) u sing the Ensembl
API [61] always using the largest exon isoform (except
in the case of i ntron retention events). A genome-wide
Woolfe et al. Genome Biology 2010, 11:R20
/>Page 16 of 23
set of internal human cassette exons was downl oaded
from the Hollywood exo n annotation database [36].
We retained exons between 20 and 1,000 bp with
canonical GT-AG splice junctions, solely annotated as
constitutive or alternatively spliced, obtaining 105,932
exons. Of these, 98,692 were annotated as constitutive
and 7,240 were alternatively spliced. A simulated dis-
tribution of expected exon lengths for hSNPs, given a
random distribution across the genome of 1 every
thousand bases [27], was calculated for each exon
length n (going from 20 bp to 1,000 bp) using the for-
mula fr(n)=pSNP × obs(n)wherepSNP =0.001and
obs(n) is the observed number of exons for length n in
the set of Hollywood exons. Splice site strength at
both the 5’ and 3’ splice junctions was measured using
the MaxEntScan maximum entropy scoring program
[62] with default settings. We calculated ESR density
within an exon by scanning a window of size n
(depending on size of the ESR) across the length of the
exon, and then dividing by the number of windows
that scored as an ESE or ESS by the total number of
windows. ESEfinder densities were calculated differ-
ently due to their encoding as position weight matrices
of differing length. The density of each of the four
position weight matrices within the exon was calcu-
lated separately using the windowing method and
summed to make an overall density. We e xcluded the
possibility of ascertainment bias for exon features due
to expression levels by comparing 68 exons from SAV-
containi ng genes that contai ned hSNPs but not SAVs
to the rest of the hSNP exon dataset. We found no sig-
nificant differences for ESR change or exon character-
istics (such as exon length, splice site strength, ESE/
ESS density, and so on) compared to other hSNPs or
their exons.
Intron-based features
All ESE/ESS densities of intronic sequences were mea-
sured u sing the NI-ESR set in the same way as for
exons, on 100 bp of sequence directly flanking each side
of the exon (excluding the conserved GT-AG splice site
dinucleotides). Any exons with a flanking intron of less
than 102 bp were excluded.
Variants that activate de novo cryptic splice sites
From the DBASS3 [63] and D BASS5 [64] databases, we
obtained 54 experimentally verified examples of exonic
mutations that activate a de novo (that is, not pre-exist-
ing) ectopic 5’ or 3’ splice site and are located more
than 3 bp away f rom either splice junction and mapped
them back on to the human genome assembly hg18
(Additional file 9). We measured potential creation of
de novo splice sites by a variant using a metric ΔSS. ΔSS
represents the maximum change in values for either 5’
or 3’ MaxEnt splice site scores between variant and wild
type, that is, ΔSS = max(Δ5’ SS|Δ3’SS). Δ5’SS =(ME
var
-
ME
wt
)whereME
var
and ME
wt
are the 5’ MaxEntScan
scores for the sequence including the variant and wild-
type allele, respectively. Similarly Δ3’SS is calculated in
the same way but us ing the 3 ’ MaxEntScan scoring pro-
gram. Δ5’SS and Δ3’SS were calculated for every appro-
priate sequence window (9 bp for 5’ splice sites and 23
bp for 3’ splice sites) in which a variant could play a
role, sliding the window 1 bp each time. A comparator
set of the top 54 ectopic-like hSNPs were created by
choosing those hSNPs with the greatest scores for puta-
tive ectopic splice sites created by the variant, a ΔSS ≥ 1
and no evidenc e of ectopic splice site creation as judged
by mRNA and EST evidence from GenBank. Interest-
ingly, prior to using the last filter, we found two of the
top 56 hSNPs have strong evidence of causing ectopic
splice site creation (rs7529443 (G->A) and rs2863095
(G->A )). This strategy, used with other evi dence, can be
used to identify novel ectopic splice site creating SNPs.
To identify whether natural splice sites are predomi-
nantly made up from sequences defined as ESSs, we
used DNA sequence from 100 bp w ithin the exon (the
first and last 50 bp in cases where the exon length >100
bp) in addition to 100 bp from the flanking upstream
and downstream introns from a subset of the constitu-
tively spliced exons with canonical GT-AG splice junc-
tions from the Hollywood database. We therefore
required that exons be at least 100 bp in length and
contai n flanking intro ns of at least 200 bp in length (so
as not to contain mixed signal from nearby exons), leav-
ing 24,924 exons.
Statistical analysis
Unless otherwise indicated, we carried out a bootstrap
analysis to compare SAVs against the hSNP set by ran-
domly sampling sets of the same size and propo rtion
of synonymous and non-synonymous as the SAVs
without replacement (using the Perl module Math::
Random)fromthehSNPs1×10
5
times. For the analy-
sis involving ectopic SAVs, only hSNPs with a ΔSS
score of 0 were compared. The number of cases
sampled from the hSNP set for bootstrap analysis
depended on whether the parameter was variant-based
(that is, dependant on the variant, such as changes in
ESRs) or exo n-based. For variant-based parameters, all
variants were used. As some SAVs or hSNPs fall
within the same exon, exon-based parameters utilized
only unique exons within the set to avoid biasing the
analysis. Z-scores were calculated as long as the distri-
bution of sampled values passed t he Shapiro-Wilk test
for normality (P > 0.05) otherwise the lowest empirical
P-value was presented. P-values were d erived from Z-
scores calculated using:
Woolfe et al. Genome Biology 2010, 11:R20
/>Page 17 of 23
z
x
where x is the feature value (or mean value) for SAVs,
μ is the mean and s is the standard deviation of a distri-
bution of feature values ( or mean values) of randomly
sampled hSNPs. A more stringent a value of 0.01 was
use d to determine statistical significance given the large
number of st atistical comparisons carried o ut. Compari-
son of the proportion of SNPs showing c hanges in dif-
ferent motif positions within ESEfinder motifs for SAVs
and hSNPs was carried out using c
2
with Yates correc-
tion. Exon length distributions were compared using
both the sampling approach above, as well as the K-S
test as implemented in the R statistics package.
Additional file 1: Table S1 List of 87 synonymous and missense splice-
affecting genome variants (SAVs) that cause exon skipping used for
analysis in this study. The variants are derived from
[12,13,37,41,44,47,48,54-56,65-103].
Click here for file
[ 010-11-2-
r20-S1.pdf ]
Additional file 2: Table S4 List of 80 synonymous and missense variants
that have been experimentally tested in mini-gene constructs and do
not cause changes in splicing. The variants are derived from
[74104105106].
Click here for file
[ 010-11-2-
r20-S2.pdf ]
Additional file 3: Table S5 (a) Full results of ESR changes and bootstrap
analysis of exon skipping SAVs vs. hSNPs, (b) splice-neutral variants vs.
hSNPs, (c) SAVs that cause exon inclusion vs. hSNPs, (d) ectopic SAVs vs.
hSNPs and (e) ectopic-like hSNPs vs. hSNPs with a ΔSS of 0.
Click here for file
[ 010-11-2-
r20-S3.pdf ]
Additional file 4: Figure S2. Proportion of exon skipping SAVs and
hSNPs that destroy an ESEfinder motif and the position in which
they occur across four binding sites Set of graphs illustrating that
exon-skipping SAVs are significantly overrepresented within certain
positions across the four ESEfinder matrices.
Click here for file
[ 010-11-2-
r20-S4.pdf ]
Additional file 5: Methods and Results S1. Local RNA secondary
structure analysis Methods and results for an analysis on whether using
local RNA secondary structure as a filter improves our ability to
distinguish exon skipping SAVs from hSNPs. Our results suggest that
using this filter does not improve our ability to predict SAVs although a
small number of SAVs may arise from the indirect uncovering of ESS
motifs by changes in local RNA secondary structure.
Click here for file
[ 010-11-2-
r20-S5.pdf ]
Additional file 6: Table S2 List of 20 variants that cause increased exon
inclusion. The variants are derived from [4447104107108].
Click here for file
[ 010-11-2-
r20-S6.pdf ]
Additional file 7: Figure S3. The RC score is influenced by distance
from the splice junction but not by exon length Two plots that show
that mean RC score is negatively correlated with minimum distance from
a splice junction (top) but not correlated with exon length (bottom).
Click here for file
[ 010-11-2-
r20-S7.pdf ]
Additional file 8: Figure S4. Distribution of exon lengths for SAV
exons versus HapMap and genome-wide exons Only distributions of
exon lengths up to 600 bp were plotted for clarity. Genome-wide exons
were divided into constitutively spliced (CE) and alternatively spl iced (AS)
as defined by the Hollywood database [36]. A fifth, expected set of exons
represents a set of exon lengths we would expect given the average
distribution of hSNPs across the genome and fits the real distribution of
HapMap exons closely.
Click here for file
[ 010-11-2-
r20-S8.pdf ]
Additional file 9: Table S3 List of 54 variants that cause de novo 5’ or 3’
ectopic splice site activation. The variants are derived from [4,37,86,109-
154].
Click here for file
[ 010-11-2-
r20-S9.pdf ]
Additional file 10: Figure S1. Distribution of nucleotide
substitutions types in 15,547 HapMap derived alleles (’hSNPs’), 87
exon skipping SAVs (’skipping SAVs’) and 54 SAVs that create a de
novo ectopic splice site (’ectopic SAVs’) Base substitution distributions
in hSNPs were used a background nucleotide substitution rates in
calculating an expected distribution of ESE/ESS changes of the NI-ESR
hexamer set (Figure 3). Significant differences in distributions between
skipping SAVs and hSNPs (such as that seen in A->T, T->C and G->T) and
ectopic SAVs (A->T, A->C, T->A, C->G) while potentially of biological
interest, should be treated with caution due to small number of skipping
and ectopic SAVs and large discrepancy in dataset size between these
sets and HapMap SNPs.
Click here for file
[ 010-11-2-
r20-S10.pdf ]
Abbreviations
bp: base pair; ESE: exonic splicing enhancer; ESR: exonic splicing regulatory
sequence; ESS: exonic splicing silencer; EST: expressed sequence tag; hnRNP:
heterogeneous nuclear ribonucleoprotein; hSNP: HapMap single nucleotide
polymorphism; K-S: Kolmogorov-Smirnov; NI: neighbor hood inference; RC:
regulatory constraint; SAV: splice-affecting genome variant; SNP: single
nucleotide polymorphism; SR: serine/arginine rich.
Acknowledgements
We thank Giovanni Parmigiani for statistical advice, Michael Hiller for help on
calculating RNA structure probability of unpaired values and Dirk Holste for
help on extracting data from the Hollywood database. Thanks must also go
to Tyra Wolfsberg, Chris Pan, Mark Fredriksen and Gongwei Jiang for help
setting up the Skippy database. We would also like to thank Lawrence Brody
and the NIH Fellows Editorial Board for advice and critical reading of the
manuscript. This work was supported by the Intramural Program of the
National Human Genome Research Institute.
Author details
1
Genomic Functional Analysis Section, National Human Genome Research
Institute, National Institutes of Health, Rockville, Maryland 20892, USA.
2
Comparative Genomics Unit, National Human Genome Research Institute,
National Institutes of Health, Rockville, Maryland 20892, USA.
Woolfe et al. Genome Biology 2010, 11:R20
/>Page 18 of 23
Authors’ contributions
AW collated all splice variant datasets, designed and performed the
experiments, analyzed the data, coded and implemented the Skippy
program/webtool and drafted the manuscript. JCM contributed the hSNP
variant dataset and conceived of the SNP density/exon length analysis. LE
conceived of the study, and participated in its design and coordination and
helped write the manuscript. All authors read and approved the final
manuscript.
Received: 16 December 2009 Revised: 3 February 2010
Accepted: 16 February 2010 Published: 16 February 2010
References
1. Ingram EM, Spillantini MG: Tau gene mutations: dissecting the
pathogenesis of FTDP-17. Trends Mol Med 2002, 8:555-562.
2. Krawczak M, Reiss J, Cooper DN: The mutational spectrum of single base-
pair substitutions in mRNA splice junctions of human genes: causes and
consequences. Hum Genet 1992, 90:41-54.
3. Cartegni L, Chew SL, Krainer AR: Listening to silence and understanding
nonsense: exonic mutations that affect splicing. Nat Rev Genet 2002,
3:285-298.
4. Eriksson M, Brown WT, Gordon LB, Glynn MW, Singer J, Scott L, Erdos MR,
Robbins CM, Moses TY, Berglund P, Dutra A, Pak E, Durkin S, Csoka AB,
Boehnke M, Glover TW, Collins FS: Recurrent de novo point mutations in
lamin A cause Hutchinson-Gilford progeria syndrome. Nature 2003,
423:293-298.
5. Venables JP: Downstream intronic splicing enhancers. FEBS Lett 2007,
581:4127-4131.
6. Murray JI, Voelker RB, Henscheid KL, Warf MB, Berglund JA: Identification of
motifs that function in the splicing of non-canonical introns. Genome Biol
2008, 9:R97.
7. Jurica MS, Moore MJ: Pre-mRNA splicing: awash in a sea of proteins. Mol
Cell 2003, 12:5-14.
8. Zuo P, Maniatis T: The splicing factor U2AF35 mediates critical protein-
protein interactions in constitutive and enhancer-dependent splicing.
Genes Dev 1996, 10:1356-1368.
9. Kan JL, Green MR: Pre-mRNA splicing of IgM exons M1 and M2 is
directed by a juxtaposed splicing enhancer and inhibitor. Genes Dev
1999, 13:462-471.
10. Liu HX, Cartegni L, Zhang MQ, Krainer AR: A mechanism for exon skipping
caused by nonsense or missense mutations in BRCA1 and other genes.
Nat Genet 2001, 27:55-58.
11. Cartegni L, Krainer AR: Disruption of an SF2/ASF-dependent exonic
splicing enhancer in SMN2 causes spinal muscular atrophy in the
absence of SMN1. Nat Genet 2002, 30:377-384.
12. Boichard A, Venet L, Naas T, Boutron A, Chevret L, de Baulny HO, De
Lonlay P, Legrand A, Nordman P, Brivet M: Two silent substitutions in the
PDHA1 gene cause exon 5 skipping by disruption of a putative exonic
splicing enhancer. Mol Genet Metab 2008, 93:323-330.
13. Moseley CT, Mullis PE, Prince MA, Phillips JA: An exon splice enhancer
mutation causes autosomal dominant GH deficiency. J Clin Endocrinol
Metab 2002, 87:847-852.
14. Mayeda A, Screaton GR, Chandler SD, Fu XD, Krainer AR: Substrate
specificities of SR proteins in constitutive splicing are determined by
their RNA recognition motifs and composite pre-mRNA exonic elements.
Mol Cell Biol 1999, 19:1853-1863.
15. Wang Z, Rolish ME, Yeo G, Tung V, Mawson M, Burge CB: Systematic
identification and analysis of exonic splicing silencers. Cell 2004,
119:831-845.
16. Goren A, Ram O, Amit M, Keren H, Lev-Maor G, Vig I, Pupko T, Ast G:
Comparative analysis identifies exonic splicing regulatory sequences -
the complex definition of enhancers and silencers. Mol Cell 2006,
22:769-781.
17. Fairbrother WG, Yeh RF, Sharp PA, Burge CB: Predictive identification of
exonic splicing enhancers in human genes. Science 2002, 297:1007-1013.
18. Zhang XH, Chasin LA: Computational definition of sequence motifs
governing constitutive exon splicing. Genes Dev 2004, 18:1241-1250.
19. Stadler MB, Shomron N, Yeo GW, Schneider A, Xiao X, Burge CB: Inference
of splicing regulatory activities by sequence neighborhood analysis. PLoS
Genet 2006, 2:e191.
20. Hartmann L, Theiss S, Niederacher D, Schaal H: Diagnostics of pathogenic
splicing mutations: does bioinformatics cover all bases?. Front Biosci
2008, 13:3252-3272.
21. Buratti E, Baralle FE: Influence of RNA secondary structure on the pre-
mRNA splicing process. Mol Cell Biol 2004, 24:10505-10514.
22. Hiller M, Zhang Z, Backofen R, Stamm S: Pre-mRNA secondary structures
influence exon recognition. PLoS Genet 2007, 3:e204.
23. Andersen MC, Engstrom PG, Lithwick S, Arenillas D, Eriksson P, Lenhard B,
Wasserman WW, Odeberg J: In silico detection of sequence variations
modifying transcriptional regulation. PLoS Comput Biol 2008, 4:e5.
24. Drake JA, Bird C, Nemesh J, Thomas DJ, Newton-Cheh C, Reymond A,
Excoffier L, Attar H, Antonarakis SE, Dermitzakis ET, Hirschhorn JN:
Conserved noncoding sequences are selectively constrained and not
mutation cold spots. Nat Genet 2006, 38:223-227.
25. Fairbrother WG, Holste D, Burge CB, Sharp PA: Single nucleotide
polymorphism-based validation of exonic splicing enhancers. PLoS Biol
2004, 2:E268.
26. Bechtel JM, Rajesh P, Ilikchyan I, Deng Y, Mishra PK, Wang Q, Wu X,
Afonin KA, Grose WE, Wang Y, Khuder S, Fedorov A: The Alternative
Splicing Mutation Database: a hub for investigations of alternative
splicing using mutational evidence. BMC Res Notes 2008, 1:3.
27. Frazer KA, Ballinger DG, Cox DR, Hinds DA, Stuve LL, Gibbs RA, Belmont JW,
Boudreau A, Hardenbol P, Leal SM, Pasternak S, Wheeler DA, Willis TD, Yu F,
Yang H: A second generation human haplotype map of over 3.1 million
SNPs. Nature 2007, 449:851-861.
28. Xu R, Teng J, Cooper TA:
The cardiac troponin T alternative exon
contains a novel purine-rich positive splicing element. Mol Cell Biol 1993,
13:3660-3674.
29. Parmley JL, Urrutia AO, Potrzebowski L, Kaessmann H, Hurst LD: Splicing
and the evolution of proteins in mammals. PLoS Biol 2007, 5:e14.
30. Parmley JL, Hurst LD: Exonic splicing regulatory elements skew
synonymous codon usage near intron-exon boundaries in mammals.
Mol Biol Evol 2007, 24:1600-1603.
31. Yeo G, Hoon S, Venkatesh B, Burge CB: Variation in sequence and
organization of splicing regulatory elements in vertebrate genes. Proc
Natl Acad Sci USA 2004, 101:15700-15705.
32. Sorek R, Ast G: Intronic sequences flanking alternatively spliced exons are
conserved between human and mouse. Genome Res 2003, 13:1631-1637.
33. Parmley JL, Chamary JV, Hurst LD: Evidence for purifying selection against
synonymous mutations in mammalian exonic splicing enhancers. Mol
Biol Evol 2006, 23:301-309.
34. Lareau LF, Inada M, Green RE, Wengrod JC, Brenner SE: Unproductive
splicing of SR genes associated with highly conserved and
ultraconserved DNA elements. Nature 2007, 446:926-929.
35. Waterston RH, Lindblad-Toh K, Birney E, Rogers J, Abril JF, Agarwal P,
Agarwala R, Ainscough R, Alexandersson M, An P, Antonarakis SE,
Attwood J, Baertsch R, Bailey J, Barlow K, Beck S, Berry E, Birren B, Bloom T,
Bork P, Botcherby M, Bray N, Brent MR, Brown DG, Brown SD, Bult C,
Burton J, Butler J, Campbell RD, Carninci P, et al: Initial sequencing and
comparative analysis of the mouse genome. Nature 2002, 420:520-562.
36. Holste D, Huo G, Tung V, Burge CB: HOLLYWOOD: a comparative
relational database of alternative splicing. Nucleic Acids Res 2006, 34:
D56-62.
37. O’Driscoll M, Ruiz-Perez VL, Woods CG, Jeggo PA, Goodship JA: A splicing
mutation affecting expression of ataxia-telangiectasia and Rad3-related
protein (ATR) results in Seckel syndrome. Nat Genet 2003, 33:497-501.
38. Wang Z, Xiao X, Van Nostrand E, Burge CB: General and specific functions
of exonic splicing silencers in splicing control. Mol Cell 2006, 23:61-70.
39. Schwartz S, Hall E, Ast G: SROOGLE: webserver for integrative, user-
friendly visualization of splicing signals. Nucleic Acids Res 2009, 37:
W189-192.
40. SKIPPY. />41. Santoro M, Modoni A, Sabatelli M, Madia F, Piemonte F, Tozzi G, Ricci E,
Tonali PA, Silvestri G: Chronic GM2 gangliosidosis type Sandhoff
associated with a novel missense HEXB gene mutation causing a double
pathogenic effect. Mol Genet Metab 2007,
91:111-114.
42. Kashima T, Manley JL: A negative element in SMN2 exon 7 inhibits
splicing in spinal muscular atrophy. Nat Genet 2003, 34:460-463.
43. Zhang XH, Arias MA, Ke S, Chasin LA: Splicing of designer exons reveals
unexpected complexity in pre-mRNA splicing. Rna 2009, 15:367-376.
Woolfe et al. Genome Biology 2010, 11:R20
/>Page 19 of 23
44. Singh NN, Androphy EJ, Singh RN: In vivo selection reveals combinatorial
controls that define a critical exon in the spinal muscular atrophy genes.
Rna 2004, 10:1291-1305.
45. Hertel KJ, Maniatis T: The function of multisite splicing enhancers. Mol Cell
1998, 1:449-455.
46. Graveley BR, Hertel KJ, Maniatis T: A systematic analysis of the factors that
determine the strength of pre-mRNA splicing enhancers. EMBO J 1998,
17:6747-6756.
47. Pagani F, Raponi M, Baralle FE: Synonymous mutations in CFTR exon 12
affect splicing and are not neutral in evolution. Proc Natl Acad Sci USA
2005, 102:6368-6372.
48. Tzetis M, Efthymiadou A, Strofalis S, Psychou P, Dimakou A, Pouliou E,
Doudounakis S, Kanavakis E: CFTR gene mutations - including three novel
nucleotide substitutions - and haplotype background in patients with
asthma, disseminated bronchiectasis and chronic obstructive pulmonary
disease. Hum Genet 2001, 108:216-221.
49. Yeo GW, Nostrand EL, Liang TY: Discovery and analysis of evolutionarily
conserved intronic splicing regulatory elements. PLoS Genet 2007, 3:e85.
50. Wang Z, Burge CB: Splicing regulation: from a parts list of regulatory
elements to an integrated splicing code. Rna 2008, 14:802-813.
51. Singh NK, Singh NN, Androphy EJ, Singh RN: Splicing of a critical exon of
human Survival Motor Neuron is regulated by a unique silencer element
located in the last intron. Mol Cell Biol 2006, 26:1333-1346.
52. Kuhn RM, Karolchik D, Zweig AS, Trumbower H, Thomas DJ,
Thakkapallayil A, Sugnet CW, Stanke M, Smith KE, Siepel A, Rosenbloom KR,
Rhead B, Raney BJ, Pohl A, Pedersen JS, Hsu F, Hinrichs AS, Harte RA,
Diekhans M, Clawson H, Bejerano G, Barber GP, Baertsch R, Haussler D,
Kent WJ: The UCSC genome browser database: update 2007. Nucleic
Acids Res 2007, 35:D668-673.
53. Giardine B, Riemer C, Hardison RC, Burhans R, Elnitski L, Shah P, Zhang Y,
Blankenberg D, Albert I, Taylor J, Miller W, Kent WJ, Nekrutenko A: Galaxy: a
platform for interactive large-scale genome analysis. Genome Res 2005,
15:1451-1455.
54. Hull J, Campino S, Rowlands K, Chan MS, Copley RR, Taylor MS, Rockett K,
Elvidge G, Keating B, Knight J, Kwiatkowski D: Identification of common
genetic variation that modulates alternative splicing. PLoS Genet 2007, 3:
e99.
55. Zhu H, Tucker HM, Grear KE, Simpson JF, Manning AK, Cupples LA, Estus S:
A common polymorphism decreases low-density lipoprotein receptor
exon 12 splicing efficiency and associates with increased cholesterol.
Hum Mol Genet 2007, 16:1765-1772.
56. Zilch CF, Walker AM, Timon M, Goff LK, Wallace DL, Beverley PC: A point
mutation within CD45 exon A is the cause of variant CD45RA splicing in
humans. Eur J Immunol 1998, 28:22-29.
57. Kwan T, Benovoy D, Dias C, Gurd S, Provencher C, Beaulieu P, Hudson TJ,
Sladek R, Majewski J: Genome-wide analysis of transcript isoform
variation in humans. Nat Genet 2008,
40:225-231.
58. Fairbrother WG, Yeo GW, Yeh R, Goldstein P, Mawson M, Sharp PA,
Burge CB: RESCUE-ESE identifies candidate exonic splicing enhancers in
vertebrate exons. Nucleic Acids Res 2004, 32:W187-190.
59. Cartegni L, Wang J, Zhu Z, Zhang MQ, Krainer AR: ESEfinder: A web
resource to identify exonic splicing enhancers. Nucleic Acids Res 2003,
31:3568-3571.
60. Ke S, Zhang XH, Chasin LA: Positive selection acting on splicing motifs
reflects compensatory evolution. Genome Res 2008, 18:533-543.
61. Flicek P, Aken BL, Beal K, Ballester B, Caccamo M, Chen Y, Clarke L,
Coates G, Cunningham F, Cutts T, Down T, Dyer SC, Eyre T, Fitzgerald S,
Fernandez-Banet J, Graf S, Haider S, Hammond M, Holland R, Howe KL,
Howe K, Johnson N, Jenkinson A, Kahari A, Keefe D, Kokocinski F, Kulesha E,
Lawson D, Longden I, Megy K, et al: Ensembl 2008. Nucleic Acids Res 2008,
36:D707-714.
62. Yeo G, Burge CB: Maximum entropy modeling of short sequence motifs
with applications to RNA splicing signals. J Comput Biol 2004, 11:377-394.
63. Vorechovsky I: Aberrant 3’ splice sites in human disease genes: mutation
pattern, nucleotide structure and comparison of computational tools
that predict their utilization. Nucleic Acids Res 2006, 34:4630-4641.
64. Buratti E, Chivers M, Kralovicova J, Romano M, Baralle M, Krainer AR,
Vorechovsky I: Aberrant 5’ splice sites in human disease genes: mutation
pattern, nucleotide structure and comparison of computational tools
that predict their utilization. Nucleic Acids Res 2007, 35:4250-4263.
65. Eeds AM, Mortlock D, Wade-Martins R, Summar ML: Assessing the
functional characteristics of synonymous and nonsynonymous mutation
candidates by use of large DNA constructs. Am J Hum Genet 2007,
80:740-750.
66. McVety S, Li L, Gordon PH, Chong G, Foulkes WD: Disruption of an exon
splicing enhancer in exon 3 of MLH1 is the cause of HNPCC in a
Quebec family. J Med Genet 2006, 43:153-156.
67. Lorson CL, Hahnen E, Androphy EJ, Wirth B: A single nucleotide in the
SMN gene regulates splicing and is responsible for spinal muscular
atrophy. Proc Natl Acad Sci USA 1999, 96:6307-6311.
68. Montera M, Piaggio F, Marchese C, Gismondi V, Stella A, Resta N, Varesco L,
Guanti G, Mareni C: A silent mutation in exon 14 of the APC gene is
associated with exon skipping in a FAP family. J Med Genet 2001,
38:863-867.
69. Auricchio A, Griseri P, Carpentieri ML, Betsos N, Staiano A, Tozzi A, Priolo M,
Thompson H, Bocciardi R, Romeo G, Ballabio A, Ceccherini I: Double
heterozygosity for a RET substitution interfering with splicing and an
EDNRB missense mutation in Hirschsprung disease. Am J Hum Genet
1999, 64:1216-1221.
70. Llewellyn DH, Scobie GA, Urquhart AJ, Whatley SD, Roberts AG, Harrison PR,
Elder GH: Acute intermittent porphyria caused by defective splicing of
porphobilinogen deaminase RNA: a synonymous codon mutation at -22
bp from the 5’ splice site causes skipping of exon 3. J Med Genet 1996,
33:437-438.
71. Liu W, Qian C, Francke U: Silent mutation induces exon skipping of
fibrillin-1 gene in Marfan syndrome. Nat Genet 1997, 16:328-329.
72. Ploos van Amstel JK, Bergman AJ, van Beurden EA, Roijers JF, Peelen T,
Berg van den IE, Poll-The BT, Kvittingen EA, Berger R: Hereditary
tyrosinemia type 1: novel missense, nonsense and splice consensus
mutations in the human fumarylacetoacetate hydrolase gene; variability
of the genotype-phenotype relationship. Hum Genet 1996, 97:51-59.
73. Colapietro P, Gervasini C, Natacci F, Rossi L, Riva P, Larizza L: NF1 exon 7
skipping and sequence alterations in exonic splice enhancers (ESEs) in a
neurofibromatosis 1 patient. Hum Genet 2003, 113:551-554.
74. Baralle M, Skoko N, Knezevich A, De Conti L, Motti D, Bhuvanagiri M,
Baralle D, Buratti E, Baralle FE: NF1 mRNA biogenesis: effect of the
genomic milieu in splicing regulation of the NF1 exon 37 region. FEBS
Lett 2006, 580:4449-4456.
75. Ferrari S, Giliani S, Insalaco A, Al-Ghonaium A, Soresina AR, Loubser M,
Avanzini MA, Marconi M, Badolato R, Ugazio AG, Levy Y, Catalan N,
Durandy A, Tbakhi A, Notarangelo LD, Plebani A: Mutations of CD40 gene
cause an autosomal recessive form of immunodeficiency with hyper
IgM. Proc Natl Acad Sci USA 2001, 98:12614-12619.
76. Cardozo AK, De Meirleir L, Liebaers I, Lissens W: Analysis of exonic
mutations leading to exon skipping in patients with pyruvate
dehydrogenase E1 alpha deficiency. Pediatr Res 2000, 48:748-753.
77. Tran VK, Takeshima Y, Zhang Z, Yagi M, Nishiyama A, Habara Y, Matsuo M:
Splicing analysis disclosed a determinant single nucleotide for exon
skipping caused by a novel intraexonic four-nucleotide deletion in the
dystrophin gene. J Med Genet 2006, 43:924-930.
78. Ramser J, Abidi FE, Burckle CA, Lenski C, Toriello H, Wen G, Lubs HA,
Engert S, Stevenson RE, Meindl A, Schwartz CE, Nguyen G: A unique exonic
splice enhancer mutation in a family with X-linked mental retardation
and epilepsy points to a novel role of the renin receptor. Hum Mol Genet
2005, 14:1019-1027.
79. Lenski C, Kooy RF, Reyniers E, Loessner D, Wanders RJ, Winnepenninckx B,
Hellebrand H, Engert S, Schwartz CE, Meindl A, Ramser J: The reduced
expression of the HADH2 protein causes X-linked mental retardation,
choreoathetosis, and abnormal behavior. Am J Hum Genet 2007,
80:372-377.
80. Steingrimsdottir H, Rowley G, Dorado G, Cole J, Lehmann AR: Mutations
which alter splicing in the human hypoxanthine-guanine
phosphoribosyltransferase gene. Nucleic Acids Res 1992, 20:1201-1208.
81. Nielsen KB, Sorensen S, Cartegni L, Corydon TJ, Doktor TK, Schroeder LD,
Reinert LS, Elpeleg O, Krainer AR, Gregersen N, Kjems J, Andresen BS:
Seemingly neutral polymorphic variants may confer immunity to
splicing-inactivating mutations: a synonymous SNP in exon 5 of MCAD
protects from deleterious mutations in a flanking exonic splicing
enhancer. Am J Hum Genet 2007, 80:416-432.
Woolfe et al. Genome Biology 2010, 11:R20
/>Page 20 of 23
82. Gromoll J, Lahrmann L, Godmann M, Muller T, Michel C, Stamm S,
Simoni M: Genomic checkpoints for exon 10 usage in the luteinizing
hormone receptor type 1 and type 2. Mol Endocrinol 2007, 21:1984-1996.
83. Nystrom-Lahti M, Holmberg M, Fidalgo P, Salovaara R, de la Chapelle A,
Jiricny J, Peltomaki P: Missense and nonsense mutations in codon 659 of
MLH1 cause aberrant splicing of messenger RNA in HNPCC kindreds.
Genes Chromosomes Cancer 1999, 26:372-375.
84. Amr S, Heisey C, Zhang M, Xia XJ, Shows KH, Ajlouni K, Pandya A, Satin LS,
El-Shanti H, Shiang R: A homozygous mutation in a novel zinc-finger
protein, ERIS, is responsible for Wolfram syndrome 2. Am J Hum Genet
2007, 81:673-683.
85. Matern D, He M, Berry SA, Rinaldo P, Whitley CB, Madsen PP, van Calcar SC,
Lussky RC, Andresen BS, Wolff JA, Vockley J: Prospective diagnosis of 2-
methylbutyryl-CoA dehydrogenase deficiency in the Hmong population
by newborn screening using tandem mass spectrometry. Pediatrics 2003,
112:74-78.
86. Teraoka SN, Telatar M, Becker-Catania S, Liang T, Onengut S, Tolun A,
Chessa L, Sanal O, Bernatowska E, Gatti RA, Concannon P: Splicing defects
in the ataxia-telangiectasia gene, ATM: underlying mutations and
consequences. Am J Hum Genet 1999, 64:1617-1631.
87. Fackenthal JD, Cartegni L, Krainer AR, Olopade OI: BRCA2 T2722R is a
deleterious allele that causes exon skipping. Am J Hum Genet 2002,
71:625-631.
88. Houdayer C, Dehainault C, Mattler C, Michaux D, Caux-Moncoutier V, Pages-
Berhouet S, d’Enghien CD, Lauge A, Castera L, Gauthier-Villars M, Stoppa-
Lyonnet D: Evaluation of in silico splice tools for decision-making in
molecular diagnosis. Hum Mutat 2008, 29:975-982.
89. Vockley J, Rogan PK, Anderson BD, Willard J, Seelan RS, Smith DI, Liu W:
Exon skipping in IVD RNA processing in isovaleric acidemia caused by
point mutations in the coding region of the IVD gene. Am J Hum Genet
2000, 66:356-367.
90. Vuillaumier-Barrot S, Barnier A, Cuer M, Durand G, Grandchamp B, Seta N:
Characterization of the 415G>A (E139K) PMM2 mutation in
carbohydrate-deficient glycoprotein syndrome type Ia disrupting a
splicing enhancer resulting in exon 5 skipping. Hum Mutat 1999,
14:543-544.
91. Ohno K, Milone M, Shen XM, Engel AG: A frameshifting mutation in
CHRNE unmasks skipping of the preceding exon. Hum Mol Genet 2003,
12:3055-3066.
92. Zatkova A, Messiaen L, Vandenbroucke I, Wieser R, Fonatsch C, Krainer AR,
Wimmer K: Disruption of exonic splicing enhancer elements is the
principal cause of exon skipping associated with seven nonsense or
missense alleles of NF1. Hum Mutat 2004, 24:491-501.
93. Mazoyer S, Puget N, Perrin-Vidoz L, Lynch HT, Serova-Sinilnikova OM,
Lenoir GM: A BRCA1 nonsense mutation causes exon skipping. Am J
Hum Genet 1998, 62:713-715.
94. Ryther RC, Flynt AS, Harris BD, Phillips JA, Patton JG: GH1 splicing is
regulated by multiple enhancers whose mutation produces a dominant-
negative GH isoform that can be degraded by allele-specific small
interfering RNA (siRNA). Endocrinology 2004, 145
:2988-2996.
95. Ozsahin H, Arredondo-Vega FX, Santisteban I, Fuhrer H, Tuchschmid P,
Jochum W, Aguzzi A, Lederman HM, Fleischman A, Winkelstein JA,
Seger RA, Hershfield MS: Adenosine deaminase deficiency in adults. Blood
1997, 89:2849-2855.
96. Chun K, MacKay N, Petrova-Benedict R, Federico A, Fois A, Cole DE,
Robertson E, Robinson BH: Mutations in the X-linked E1 alpha subunit of
pyruvate dehydrogenase: exon skipping, insertion of duplicate
sequence, and missense mutations leading to the deficiency of the
pyruvate dehydrogenase complex. Am J Hum Genet 1995, 56:558-569.
97. Okajima K, Warman ML, Byrne LC, Kerr DS: Somatic mosaicism in a male
with an exon skipping mutation in PDHA1 of the pyruvate
dehydrogenase complex results in a milder phenotype. Mol Genet Metab
2006, 87:162-168.
98. Das S, Levinson B, Whitney S, Vulpe C, Packman S, Gitschier J: Diverse
mutations in patients with Menkes disease often lead to exon skipping.
Am J Hum Genet 1994, 55:883-889.
99. Wang E, Huang Z, Hobson GM, Dimova N, Sperle K, McCullough A,
Cambi F: PLP1 alternative splicing in differentiating oligodendrocytes:
characterization of an exonic splicing enhancer. J Cell Biochem 2006,
97:999-1016.
100. Valentine CR: The association of nonsense codons with exon skipping.
Mutat Res 1998, 411:87-117.
101. Yang JL, Lin JG, Hu MC, Wu CW: Mutagenicity and mutational spectrum
of N-methyl-N’-nitro-N-nitrosoguanidine in the hprt gene in G1-S and
late S phase of diploid human fibroblasts. Cancer Res 1993, 53:2865-2873.
102. Burkhart-Schultz KJ, Thompson CL, Jones IM: Spectrum of somatic
mutation at the hypoxanthine phosphoribosyltransferase (hprt) gene of
healthy people. Carcinogenesis 1996, 17:1871-1883.
103. Theophilus BD, Enayat MS, Williams MD, Hill FG: Site and type of
mutations in the factor VIII gene in patients and carriers of haemophilia
A. Haemophilia 2001, 7:381-391.
104. Pagani F, Buratti E, Stuani C, Baralle FE: Missense, nonsense, and neutral
mutations define juxtaposed regulatory elements of splicing in cystic
fibrosis transmembrane regulator exon 9. J Biol Chem 2003,
278:26580-26588.
105. Elsharawy A, Hundrieser B, Brosch M, Wittig M, Huse K, Platzer M, Becker A,
Simon M, Rosenstiel P, Schreiber S, Krawczak M, Hampe J: Systematic
evaluation of the effect of common SNPs on pre-mRNA splicing. Hum
Mutat 2009, 30:625-632.
106. Lastella P, Resta N, Miccolis I, Quagliarella A, Guanti G, Stella A: Site
directed mutagenesis of hMLH1 exonic splicing enhancers does not
correlate with splicing disruption. J Med Genet 2004, 41:e72.
107. D’Souza I, Poorkaj P, Hong M, Nochlin D, Lee VM, Bird TD, Schellenberg GD:
Missense and silent tau gene mutations cause frontotemporal dementia
with parkinsonism-chromosome 17 type, by affecting multiple
alternative RNA splicing regulatory elements. Proc Natl Acad Sci USA 1999,
96:5598-5603.
108. Lee VM, Goedert M, Trojanowski JQ: Neurodegenerative tauopathies. Annu
Rev Neurosci 2001, 24:1121-1159.
109. Pomponio RJ, Reynolds TR, Mandel H, Admoni O, Melone PD, Buck GA,
Wolf B: Profound biotinidase deficiency caused by a point mutation that
creates a downstream cryptic 3’ splice acceptor site within an exon of
the human biotinidase gene. Hum Mol Genet 1997, 6:739-745.
110. Asselta R, Duga S, Spena S, Peyvandi F, Castaman G, Malcovati M,
Mannucci PM, Tenchini ML: Missense or splicing mutation? The case of a
fibrinogen Bbeta-chain mutation causing severe hypofibrinogenemia.
Blood 2004, 103:3051-3054.
111. Tamouza R, El Kassar N, Schaeffer V, Carbonnelle E, Tatari Z, Marzais F,
Fortier C, Poirier JC, Sadki K, Bernaudin F, Toubert A, Krishnamoorthy R,
Charron D: A novel HLA-B*39 allele (HLA-B*3916) due to a rare mutation
causing cryptic splice site activation. Hum Immunol 2000, 61:467-473.
112. Nakamura K, Fukao T, Perez-Cerda C, Luque C, Song XQ, Naiki Y, Kohno Y,
Ugarte M, Kondo N: A novel single-base substitution (380C>T) that
activates a 5-base downstream cryptic splice-acceptor site within exon 5
in almost all transcripts in the human mitochondrial acetoacetyl-CoA
thiolase gene. Mol Genet Metab 2001, 72:115-121.
113. Bruce LJ, Ghosh S, King MJ, Layton DM, Mawby WJ, Stewart GW,
Oldenborg PA, Delaunay J, Tanner MJ: Absence of CD47 in protein 4.2-
deficient hereditary spherocytosis in man: an interaction between the
Rh complex and the band 3 complex. Blood 2002, 100:1878-1885.
114. Pohlenz J, Rosenthal IM, Weiss RE, Jhiang SM, Burant C, Refetoff S:
Congenital hypothyroidism due to mutations in the sodium/iodide
symporter. Identification of a nonsense mutation producing a
downstream cryptic 3’ splice site. J Clin Invest 1998, 101:1028-1035.
115. Tran VK, Takeshima Y, Zhang Z, Habara Y, Haginoya K, Nishiyama A, Yagi M,
Matsuo M: A nonsense mutation-created intraexonic splice site is active
in the lymphocytes, but not in the skeletal muscle of a DMD patient.
Hum Genet 2007, 120:737-742.
116. Frattini A, Orchard PJ, Sobacchi C, Giliani S, Abinun M, Mattsson JP,
Keeling DJ, Andersson AK, Wallbrandt P, Zecca L, Notarangelo LD,
Vezzoni P, Villa A: Defects in TCIRG1 subunit of the vacuolar proton
pump are responsible for a subset of human autosomal recessive
osteopetrosis. Nat Genet 2000, 25:343-346.
117. Bourbon M, Sun XM, Soutar AK: A rare polymorphism in the low density
lipoprotein (LDL) gene that affects mRNA splicing. Atherosclerosis 2007,
195:e17-20.
118. Tavassoli K, Eigel A, Dworniczak B, Valtseva E, Horst J: Identification of four
novel mutations in the factor VIII gene: three missense mutations
(E1875G, G2088S, I2185T) and a 2-bp deletion (1780delTC). Hum Mutat
1998, , Suppl 1: S260-262.
Woolfe et al. Genome Biology 2010, 11:R20
/>Page 21 of 23
119. Reynolds DM, Hayashi T, Cai Y, Veldhuisen B, Watnick TJ, Lens XM,
Mochizuki T, Qian F, Maeda Y, Li L, Fossdal R, Coto E, Wu G, Breuning MH,
Germino GG, Peters DJ, Somlo S: Aberrant splicing in the PKD2 gene as a
cause of polycystic kidney disease. J Am Soc Nephrol 1999, 10:2342-2351.
120. Baumgartner MR, Almashanu S, Suormala T, Obie C, Cole RN, Packman S,
Baumgartner ER, Valle D: The molecular basis of human 3-methylcrotonyl-
CoA carboxylase deficiency. J Clin Invest 2001, 107:495-504.
121. Verlaan DJ, Siegel AM, Rouleau GA: Krit1 missense mutations lead to
splicing errors in cerebral cavernous malformation. Am J Hum Genet
2002, 70:1564-1567.
122. Reifenberger J, Rauch L, Beckmann MW, Megahed M, Ruzicka T,
Reifenberger G: Cowden’s disease: clinical and molecular genetic findings
in a patient with a novel PTEN germline mutation. Br J Dermatol 2003,
148:1040-1046.
123. Kaurah P, MacMillan A, Boyd N, Senz J, De Luca A, Chun N, Suriano G,
Zaor S, Van Manen L, Gilpin C, Nikkel S, Connolly-Wilson M, Weissman S,
Rubinstein WS, Sebold C, Greenstein R, Stroop J, Yim D, Panzini B,
McKinnon W, Greenblatt M, Wirtzfeld D, Fontaine D, Coit D, Yoon S,
Chung D, Lauwers G, Pizzuti A, Vaccaro C, Redal MA, et al: Founder and
recurrent CDH1 mutations in families with hereditary diffuse gastric
cancer. JAMA 2007, 297:2360-2372.
124. Wimmer K, Roca X, Beiglbock H, Callens T, Etzler J, Rao AR, Krainer AR,
Fonatsch C, Messiaen L: Extensive in silico analysis of NF1 splicing defects
uncovers determinants for splicing outcome upon 5’ splice-site
disruption. Hum Mutat 2007, 28:599-612.
125. Ars E, Serra E, Garcia J, Kruyer H, Gaona A, Lazaro C, Estivill X: Mutations
affecting mRNA splicing are the most common molecular defects in
patients with neurofibromatosis type 1. Hum Mol Genet 2000, 9:237-247.
126. Yang Y, Swaminathan S, Martin BK, Sharan SK: Aberrant splicing induced
by missense mutations in BRCA1: clues from a humanized mouse
model. Hum Mol Genet 2003, 12:2121-2131.
127. Symoens S, Nuytinck L, Legius E, Malfait F, Coucke PJ, De Paepe A: Met>Val
substitution in a highly conserved region of the pro-alpha1(I) collagen
C-propeptide domain causes alternative splicing and a mild EDS/OI
phenotype. J Med Genet 2004, 41:e96.
128. Hashimoto S, Tsukada S, Matsushita M, Miyawaki T, Niida Y, Yachie A,
Kobayashi S, Iwata T, Hayakawa H, Matsuoka H, Tsuge I, Yamadori T,
Kunikata T, Arai S, Yoshizaki K, Taniguchi N, Kishimoto T: Identification of
Bruton’s tyrosine kinase (Btk) gene mutations and characterization of
the derived proteins in 35 X-linked agammaglobulinemia families: a
nationwide study of Btk deficiency in Japan. Blood 1996, 88:561-573.
129. O’Neill JP, Rogan PK, Cariello N, Nicklas JA: Mutations that alter RNA
splicing of the human HPRT gene: a review of the spectrum. Mutat Res
1998, 411:179-214.
130. Ramesh N, Fuleihan R, Swinton P, Rosen FS, Geha R: A point mutation in
exon 2 of the CD40 ligand gene causes the simultaneous expression of
two defective mRNA species in X-linked hyperimmunoglobulinemia M.
Hum Mol Genet 1995, 4:759-761.
131. Jonsson JJ, Aronovich EL, Braun SE, Whitley CB: Molecular diagnosis of
mucopolysaccharidosis type II (Hunter syndrome) by automated
sequencing and computer-assisted interpretation: toward mutation
mapping of the iduronate-2-sulfatase gene. Am J Hum Genet 1995,
56:597-607.
132. Parrini E, Ramazzotti A, Dobyns WB, Mei D, Moro F, Veggiotti P, Marini C,
Brilstra EH, Dalla Bernardina B, Goodwin L, Bodell A, Jones MC,
Nangeroni M, Palmeri S, Said E, Sander JW, Striano P, Takahashi Y, Van
Maldergem L, Leonardi G, Wright M, Walsh CA, Guerrini R: Periventricular
heterotopia: phenotypic heterogeneity and correlation with Filamin A
mutations. Brain 2006, 129:1892-1906.
133. Paradisi M, McClintock D, Boguslavsky RL, Pedicelli C, Worman HJ, Djabali K:
Dermal fibroblasts in Hutchinson-Gilford progeria syndrome with the
lamin A G608G mutation have dysmorphic nuclei and are hypersensitive
to heat stress. BMC Cell Biol 2005, 6:27.
134. Dominissini S, Buratti E, Bembi B, Baralle M, Pittis MG: Characterization of
two novel GBA mutations causing Gaucher disease that lead to aberrant
RNA species by using functional splicing assays. Hum Mutat 2006, 27:119.
135. Baklouti F, Marechal J, Wilmotte R, Alloisio N, Morle L, Ducluzeau MT,
Denoroy L, Mrad A, Ben Aribia MH, Kastally R, et al: Elliptocytogenic alpha
I/36 spectrin Sfax lacks nine amino acids in helix 3 of repeat 4. Evidence
for the activation of a cryptic 5’-splice site in exon 8 of spectrin alpha-
gene. Blood 1992, 79:2464-2470.
136. Chen W, Kubota S, Teramoto T, Nishimura Y, Yonemoto K, Seyama Y: Silent
nucleotide substitution in the sterol 27-hydroxylase gene (CYP 27) leads
to alternative pre-mRNA splicing by activating a cryptic 5’ splice site at
the mutant codon in cerebrotendinous xanthomatosis patients.
Biochemistry 1998, 37:4420-4428.
137. Gardella R, Zoppi N, Zambruno G, Barlati S, Colombi M: Different
phenotypes in recessive dystrophic epidermolysis bullosa patients
sharing the same mutation in compound heterozygosity with two novel
mutations in the type VII collagen gene. Br J Dermatol 2002, 147:450-457.
138. Denecke J, Kranz C, Kemming D, Koch HG, Marquardt T: An activated 5’
cryptic splice site in the human ALG3 gene generates a premature
termination codon insensitive to nonsense-mediated mRNA decay in a
new case of congenital disorder of glycosylation type Id (CDG-Id). Hum
Mutat 2004, 23:477-486.
139. Baumbach L, Schiavi A, Bartlett R, Perera E, Day J, Brown MR, Stein S,
Eidson M, Parks JS, Cleveland W: Clinical, biochemical, and molecular
investigations of a genetic isolate of growth hormone insensitivity
(Laron’s syndrome). J Clin Endocrinol Metab 1997, 82:444-451.
140. Berg MA, Guevara-Aguirre J, Rosenbloom AL, Rosenfeld RG, Francke U:
Mutation creating a new splice site in the growth hormone receptor
genes of 37 Ecuadorean patients with Laron syndrome. Hum Mutat 1992,
1:24-32.
141. Yamada S, Tomatsu S, Sly WS, Islam R, Wenger DA, Fukuda S, Sukegawa K,
Orii T: Four novel mutations in mucopolysaccharidosis type VII including
a unique base substitution in exon 10 of the beta-glucuronidase gene
that creates a novel 5’
-splice site. Hum Mol Genet 1995, 4:651-655.
142. Suwanmanee T, Sierakowska H, Fucharoen S, Kole R: Repair of a splicing
defect in erythroid cells from patients with beta-thalassemia/HbE
disorder. Mol Ther 2002, 6:718-726.
143. Goldsmith ME, Humphries RK, Ley T, Cline A, Kantor JA, Nienhuis AW:
“Silent” nucleotide substitution in a beta+-thalassemia globin gene
activates splice site in coding sequence RNA. Proc Natl Acad Sci USA
1983, 80:2318-2322.
144. Hospach T, Lohse P, Heilbronner H, Dannecker GE, Lohse P:
Pseudodominant inheritance of the hyperimmunoglobulinemia D with
periodic fever syndrome in a mother and her two monozygotic twins.
Arthritis Rheum 2005, 52:3606-3610.
145. Cockerill FJ, Hawa NS, Yousaf N, Hewison M, O’Riordan JL, Farrow SM:
Mutations in the vitamin D receptor gene in three kindreds associated
with hereditary vitamin D resistant rickets. J Clin Endocrinol Metab 1997,
82:3156-3160.
146. Wicklow BA, Ivanovich JL, Plews MM, Salo TJ, Noetzel MJ, Lueder GT,
Cartegni L, Kaback MM, Sandhoff K, Steiner RD, Triggs-Raine BL: Severe
subacute GM2 gangliosidosis caused by an apparently silent HEXA
mutation (V324V) that results in aberrant splicing and reduced HEXA
mRNA. Am J Med Genet A 2004, 127A:158-166.
147. Harteveld CL, Wijermans PW, van Delft P, Rasp E, Haak HL, Giordano PC: An
alpha-thalassemia phenotype in a Dutch Hindustani, caused by a new
point mutation that creates an alternative splice donor site in the first
exon of the alpha2-globin gene. Hemoglobin 2004, 28:255-259.
148. Lavery GG, Ronconi V, Draper N, Rabbitt EH, Lyons V, Chapman KE,
Walker EA, McTernan CL, Giacchetti G, Mantero F, Seckl JR, Edwards CR,
Connell JM, Hewison M, Stewart PM: Late-onset apparent
mineralocorticoid excess caused by novel compound heterozygous
mutations in the HSD11B2 gene. Hypertension 2003, 42:123-129.
149. Xie J, Pabon D, Jayo A, Butta N, Gonzalez-Manchon C: Type I Glanzmann
thrombasthenia caused by an apparently silent beta3 mutation that
results in aberrant splicing and reduced beta3 mRNA. Thromb Haemost
2005, 93:897-903.
150. Candotti F, Oakes SA, Johnston JA, Giliani S, Schumacher RF, Mella P,
Fiorini M, Ugazio AG, Badolato R, Notarangelo LD, Bozzi F, Macchi P,
Strina D, Vezzoni P, Blaese RM, O’Shea JJ, Villa A: Structural and functional
basis for JAK3-deficient severe combined immunodeficiency. Blood 1997,
90:3996-4003.
151. Dale DC, Person RE, Bolyard AA, Aprikyan AG, Bos C, Bonilla MA, Boxer LA,
Kannourakis G, Zeidler C, Welte K, Benson KF, Horwitz M: Mutations in the
gene encoding neutrophil elastase in congenital and cyclic neutropenia.
Blood 2000, 96:2317-2322.
152. Yip KL, Chan SY, Ip WK, Lau YL: Bruton’s tyrosine kinase mutations in 8
Chinese families with X-linked agammaglobulinemia. Hum Mutat 2000,
15:385.
Woolfe et al. Genome Biology 2010, 11:R20
/>Page 22 of 23
153. Donati MA, Malvagia S, Pasquini E, Morrone A, La Marca G, Garavaglia B,
Toniolo D, Zammarchi E: Barth syndrome presenting with acute
metabolic decompensation in the neonatal period. J Inherit Metab Dis
2006, 29:684.
154. Flomen RH, Green PM, Bentley DR, Giannelli F, Green EP: Detection of
point mutations and a gross deletion in six Hunter syndrome patients.
Genomics 1992, 13:543-550.
doi:10.1186/gb-2010-11-2-r20
Cite this article as: Woolfe et al.: Genomic features defining exonic
variants that modulate splicing. Genome Biology 2010 11:R20.
Submit your next manuscript to BioMed Central
and take full advantage of:
• Convenient online submission
• Thorough peer review
• No space constraints or color figure charges
• Immediate publication on acceptance
• Inclusion in PubMed, CAS, Scopus and Google Scholar
• Research which is freely available for redistribution
Submit your manuscript at
www.biomedcentral.com/submit
Woolfe et al. Genome Biology 2010, 11:R20
/>Page 23 of 23