Báo cáo y học: "ptimized design and data analysis of tag-based cytosine methylation assays" pps
Bạn đang xem bản rút gọn của tài liệu. Xem và tải ngay bản đầy đủ của tài liệu tại đây (806.58 KB, 11 trang )
Suzuki et al. Genome Biology 2010, 11:R36
/>Open Access
METHOD
BioMed Central
© 2010 Suzuki et al.; licensee BioMed Central Ltd. This is an open access article distributed under the terms of the Creative Commons
Attribution License ( which permits unrestricted use, distribution, and reproduction in
any medium, provided the original work is properly cited
Method
Optimized design and data analysis of tag-based
cytosine methylation assays
Masako Suzuki, Qiang Jing, Daniel Lia, Marién Pascual, Andrew McLellan and John M Greally*
Cytosine methylationGenome-wide, tag-based cytosine methylation analysis is optimized.
Abstract
Using the type III restriction-modification enzyme EcoP15I, we isolated sequences flanking sites digested by the
methylation-sensitive HpaII enzyme or its methylation-insensitive MspI isoschizomer for massively parallel sequencing.
A novel data transformation allows us to normalise HpaII by MspI counts, resulting in more accurate quantification of
methylation at >1.8 million loci in the human genome. This HELP-tagging assay is not sensitive to sequence
polymorphism or base composition and allows exploration of both CG-rich and depleted genomic contexts.
Background
Epigenetic mechanisms of transcriptional regulation are
increasingly being studied for their potential influences in
human disease pathogenesis. Much of this interest is
based on the paradigm of neoplastic transformation, in
which epigenetic changes appear to be universal, wide-
spread throughout the genome, causative of critical tran-
scriptional changes and predictive of disease prognosis
(reviewed in [1]). Furthermore, these epigenetic changes
represent potential pharmacological targets for reversal
and amelioration of the disease process [2].
Of the large number of regulatory processes referred to
as epigenetic, there exist numerous assays to study chro-
matin component distribution, cytosine methylation and
microRNA expression genome-wide. The chromatin
components include a large number of post-translational
modifications of histones, variant histones, DNA-binding
proteins and associated complexes, all tested by chroma-
tin immunoprecipitation (ChIP) approaches coupled
with microarray hybridization or massively parallel
sequencing (MPS). MicroRNAs can be identified and
quantified by using microarrays and MPS, while cytosine
methylation can be definitively studied by converting the
DNA of the genome using sodium bisulfite, shotgun
sequencing the product using MPS and mapping this
back to the genome to count how frequently cytosines
remain unconverted, indicating their methylation in the
starting material, due to the resistance of methylcytosine
to bisulfite conversion compared with unmethylated
cytosines. This allows nucleotide resolution, strand-spe-
cific, quantitative assessment of cytosine methylation,
with such studies performed in Arabidopsis [3-5] and
human cells to date [6].
While this approach represents the ideal means of test-
ing cytosine methylation, the amount of sequencing nec-
essary (for the human genome, over 1 billion sequences of
~75 bp each [6]) to generate quantitative information
genome-wide remains prohibitive in terms of cost, limit-
ing these studies to the few referred to above. When
studying human disease, the emphasis remains on cyto-
sine methylation assays, as it is generally easier to collect
clinical samples for DNA purification than for ChIP or
even RNA assays. However, the cell populations har-
vested are rarely of high purity, and we generally do not
know the degree of change in cytosine methylation in the
disease of interest and thus the quantitative discrimina-
tion required for an assay, with some studies to date indi-
cating that the changes may be quite subtle [7]. These
concerns emphasize the need for cytosine methylation
assays that can detect methylation levels intermediate in
value and changes in disease that are relatively modest in
magnitude. Certain microarray-based assays to study
cytosine methylation have addressed this issue, with the
methylated DNA immunoprecipitation (meDIP) assay
amenable to such quantification when used for CpG
islands [8] and possibly also for less CG dinucleotide-rich
regions [9]. Restriction enzyme-based assays used with
microarrays have also proven to be reasonably quantita-
tive, whether based on methylation-sensitive (for exam-
* Correspondence:
Department of Genetics (Computational Genetics), Center for Epigenomics,
Albert Einstein College of Medicine, 1301 Morris Park Avenue, Bronx, NY 10461,
USA
Suzuki et al. Genome Biology 2010, 11:R36
/>Page 2 of 11
ple, the HELP assay [10]) or methylation-dependent (for
example, MethylMapper [11]) enzymes. A promising new
MPS-based assay is reduced representation bisulfite
sequencing (RRBS), which is designed to study the CG-
dense regions defined by short MspI fragments, and pro-
vides nucleotide resolution, quantitative data [12].
The use of MPS for what were previously microarray-
based assays has been associated with improved perfor-
mance [13], as we found when we modified our HELP
(HpaII tiny fragment Enrichment by Ligation-mediated
PCR) assay [10] for MPS, creating an assay similar to
Methyl-Seq [14]. The strength of the HELP assay involves
the comparison of the HpaII with the methylation-insen-
sitive MspI representation, allowing a normalization step
that makes the assay semi-quantitative [10]. The HELP
representation approach was improved upon by Ball et al.
[15], who developed the Methyl-Sensitive Cut Counting
(MSCC) assay, which involves digesting DNA with HpaII,
ligating an adapter to the cohesive end formed, using a
restriction enzyme site within the adapter to digest at a
flanking sequence and thus capturing the sequence
immediate adjacent to the HpaII site. By adding a second
MPS-compatible adapter, a library can be generated for
MPS, allowing the counting of reads at these sites to rep-
resent the degree of methylation at the site. The authors
demonstrated the assay to be reasonably quantitative,
testing over 1.3 million sites in the human genome, repre-
senting not only HpaII sites clustered in CG-dense
regions of the genome (approximately 12% of all HpaII
sites are located in annotated CpG islands in the human
genome [16]) but also the remaining majority of the
genome in which CG dinucleotides are depleted, a
genomic compartment not tested by RRBS as currently
designed. A focus on the CG-dense minority of the
genome will fail to observe changes such as those at CG-
depleted promoters (such as OCT4 [17]) and CpG island
shores [18], and within gene bodies where cytosine meth-
ylation has been found to be positively correlated with
gene transcription [15]. It is likely, therefore, that an assay
system that can study both CG-dense and CG-depleted
regions will acquire substantially more information about
epigenomic states than those directed at the CG-dense
compartment alone.
In the current study, we tested whether the use of an
MspI control would improve MSCC assay performance,
as we had found for microarray-based HELP, and whether
we could develop an analytical pipeline for routine use of
this assay in epigenome-wide association studies. We also
explored the use of longer tags than those employed in
the MSCC, and added T7 RNA polymerase and reverse
transcription steps to allow the generation of libraries
without contaminating products, thus obviating the need
for gel extraction. The influence of base composition and
fragment length parameters as potential sources of bias
were also tested, using the H1 (WA01) human embryonic
stem (ES) cell line. The outcome is a modified assay that
combines the strengths of MSCC and HELP-seq/Methyl-
seq, and the supporting analytical workflow that maxi-
mizes the quantitative capabilities of the data generated.
Results and discussion
Library preparation and sequencing
We generated HELP tagging libraries with HpaII- or
MspI-digested DNA derived from human ES cells using
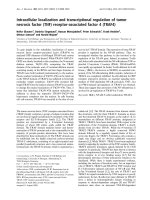
the experimental approach shown in Figure 1. The assay
differs from MSCC [15] by using EcoP15I instead of
MmeI, generating longer flanking sequences (27 as
opposed to 18 to 19 bp) and the addition of a T7 poly-
merase and reverse transcription step to allow the gener-
ation of the library without contaminating single-adapter
products, while in addition obviating the need for gel
extraction. After the library preparation, a single band of
125 bp in length was generated, as expected. Libraries
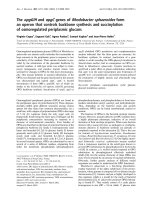
Figure 1 HELP-tagging assay design and library preparation. The
genomic DNA is digested by HpaII or MspI, the former only cutting at
CCGG sequences where the central CG dinucleotide is unmethylated.
The first Illumina adapter (AE) is ligated to the compatible cohesive
end created, juxtaposing an EcoP15I site beside the HpaII/MspI diges-
tion site and allowing EcoP15I to digest within the flanking DNA se-
quence as shown. An A overhang is created, allowing the ligation of
the second Illumina adapter (AS, green). This will create not only AE-in-
sert-AS products but also AS-insert-AS molecules. By performing a T7
polymerase-mediated in vitro transcription from a promoter sequence
located on the AE adapter, we can selectively enrich for the AE-insert-
AS product, following which limited PCR amplification is performed to
generate a single sized product for Illumina sequencing. RT, reverse
transcription.
T7
A
A
A
A
RNA
cDNA
T7
T7
T7
T7
T7
CGG
CGG
CCGG
CGG
me
MspI/HpaII digestion
First adapter ligation
EcoP15I digestion
Second adapter ligation
In vitro transcription
RT reaction
T
T
PCR amplification
Massively parallel sequencing with Illumina GA
A
A
T
A
T
A
CGG
C
C
CGG
CGG
C
C
C
C
Suzuki et al. Genome Biology 2010, 11:R36
/>Page 3 of 11
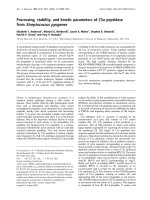
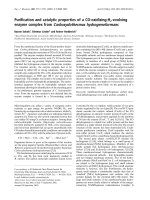
Figure 2 Data transformation and bisulfite validation. (a) Scatter plot showing the relationship between the number of HpaII and MspI reads at
each locus. (b) The location of the data point on the scatter plot indicates whether it is likely to be less or more methylated with larger or smaller angles
B subtended as shown, while the confidence of the measurement will be greater when more reads represent the data point, represented by the
length of line c. (c) The HpaII count correlates negatively with the degree of methylation, with more counts occurring at loci with less methylation.
(d) Transformation of the data to the B angle measure to normalize HpaII by MspI counts substantially improves the correlation with bisulfite MassAr-
ray validation data.
b
a
A
BC
Angle B=degree(arctan2(b,a))
HpaII count
Less methylated
(HpaII count>MspI count)
MspI count
a
(b,a)
b
(b,a)
b
HpaII count
MspI count
a
More methylated
(HpaII count<MspI count)
c
Length c=
√
R = 0.826
0 20 40 60 80 100
Angle (degrees)
% methylation
Angle
R = 0.502
0 20 40 60 80 100
HpaII counts
% methylation
HpaII counts
(a)
(b)
(d)(c)
0 1020304050
0 1020304050
MspI count
HpaII count
2
2
0
30
60
90
0
2.0
4.0
6.0
Suzuki et al. Genome Biology 2010, 11:R36
/>Page 4 of 11
were sequenced using an Illumina Genome Analyzer (36
bp single end reads) and the sequences were analyzed and
aligned using Illumina pipeline software version 1.3 or
1.4. A summary of the Illumina analysis results for each
replicate is shown in Table S1 in Additional file 1.
Data quality and reproducibility
Based on our experimental design, successfully generated
products would be expected to possess a 5'-CGCTGCTG
sequence at the 3' end of the read, the first two nucle-
otides (CG) representing the cohesive end for ligation of
HpaII/MspI digestion products, the remaining six nucle-
otides the EcoP15I restriction enzyme recognition site. In
order to evaluate the yield of desired products, we
counted the number of reads containing this sequence
and plotted the starting positions of this sequence within
the reads obtained. We observed that approximately two-
thirds of the reads contained the expected sequence, and
found that the majority was located at base positions 25
and 26, consistent with the known digestion properties of
the restriction enzyme [19]. Removal of the approxi-
mately 30% of reads lacking the CG-EcoP15I sequence
was performed to eliminate spurious sequences. In order
to investigate sequence quality further, we also deter-
mined the number and relative position of Ns (ambigu-
ous base calls) within the reads obtained. Overall, few
reads were found to contain Ns, and where they were
present, they were found to be evenly distributed by posi-
tion within the sequence. To test data reproducibility, we
compared the results of three experimental replicates
against each other using the Pearson correlation coeffi-
cient metric. The results of this study showed that all rep-
licates were highly correlated (all the r values exceed 0.9),
which confirmed that the technical reproducibility of this
assay was excellent (Table S2 in Additional file 1).
Distribution of MspI/HpaII sequence tags
We merged three lanes of MspI data and observed that
approximately 80% of the 2,292,198 annotated HpaII sites
in the human genome (hg18) were represented by at least
one read, for a total of over 1.8 million loci throughout
the genome. The mean numbers of reads per locus for
MspI and HpaII were 3.94 and 1.82, respectively, and
MspI counts were distributed evenly across all genomic
compartments examined (Table S3 in Additional file 1).
We hypothesize that a combination of incomplete
genomic coverage and polymorphisms within some
CCGG sites (as we have previously observed [10])
accounts for the 20% of HpaII sites that were not repre-
sented by any reads.
Normalization of HpaII by MspI counts and data
transformation
When we plot the MspI count on the x-axis and HpaII
count on the y-axis for each HpaII site, we can see two
major groups of values in the plot (Figure 2a), separated
into loci with high or with minimal HpaII counts. This
plot helped us to develop a new method for normalizing
HpaII counts in terms of variability of the MspI represen-
tation. We recognize that hypomethylated loci are associ-
ated with relatively greater HpaII counts and a larger
angle B (Figure 2b, left) whereas methylated loci will be
defined by smaller angle values (Figure 2b, middle). Fur-
thermore, some loci will tend to be sequenced more read-
ily than others, and may have identical B values but
differing distances from the origin (c distance), allowing a
confidence score for identical methylation values (B) in
terms of the c distance values (Figure 2b, right). To test
this model, we used bisulfite MassArray to test quantita-
tively the cytosine methylation values for 61 HpaII sites
(Tables S4, S5 and S6 in Additional file 1), choosing loci
representing all components of the B angle spectrum of
values. In Figure 2c, d we show the correlations between
these gold standard cytosine methylation values and raw
HpaII counts or B angle values. We find that there is the
same negative correlation (R
2
= 0.502) between HpaII
counts and cytosine methylation values as demonstrated
in the MSCC technique [15], and that the angular trans-
formation of the data incorporating the MspI normaliza-
tion substantially improves this correlation (R
2
= 0.826),
defining the optimal approach for processing of these
data. We represent the data for University of California
Santa Cruz (UCSC) genome browser visualization as wig-
gle tracks, with higher B angle values defining less methy-
lated loci. Methylated loci with zero values that would be
otherwise difficult to visualize as having been tested are
represented as small negative values. We show the details
of the analytical workflow in Figure 3 and an example of a
UCSC genome browser representation of HELP-tagging
data in Figure S1 in Additional file 1. All data are available
through the Gene Expression Omnibus database (acces-
sion number [GEO:GSE19937]) and as UCSC genome
browser tracks [20].
Potential sources of bias: base composition and fragment
length
As the number of reads at CCGG sites following MspI
digestion should not be influenced by methylation, the
representation obtained from MspI digestion allowed us
to look for systematic sources of bias inherent to the
assay. A major concern was that base composition could
be a source of such bias, as it has been reported that Illu-
mina sequencing can be influenced by GC composition
[21], possibly because of the gel extraction step [22]. Our
protocol does not require gel extraction and only begins
to show an under-representation of sequences when the
(G+C) content exceeds approximately 80% (Figure 4a).
We also tested to see whether the sizes of the MspI frag-
ments generated influenced the counts obtained, as the
Suzuki et al. Genome Biology 2010, 11:R36
/>Page 5 of 11
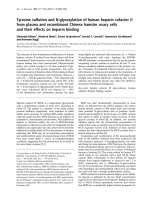
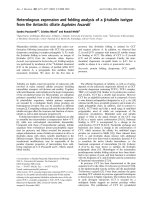
Figure 3 HELP-tagging analysis workflow. The analysis workflow for HELP-tagging data is illustrated. Only sequence reads that contain the adapter
sequence and map to a single or ≤ 10 sites are retained, the latter repetitive sequences distributed by weighting among the matched loci. Potential
polymorphic loci are annotated. Normalization of HpaII by MspI using the angle calculation described in the previous figure is performed and files are
generated for genome browser visualization. UCSC, University of California Santa Cruz.
ELAND (1-36 bp alignment)
Scan for EcoP15I tag
Mask tag sequence as “n”
ELAND (2-28 bp alignment)
Map to annotated HpaII site?
Count hit number
Normalize HpaII with MspI by angle calculation
UCSC genome browser
Yes
No
Discard the reads
Yes
No
Putative polymorphic HpaII sites
dbSNP check
MspI>0
MspI=0
dbSNP check
Unique
hit
Quality failed/not aligned
Discard the reads
Unique/multiple aligned
Multiple
aligned hits
aligned >10
Discard the reads
Weighted based on aligned number
Putative polymorphic HpaII sites
aligned ≤10
Distance from neighboring HpaII site
< 27 bp
Discard the reads
≥27 bp
Suzuki et al. Genome Biology 2010, 11:R36
/>Page 6 of 11
digestion by type III endonucleases like EcoP15I is most
efficient when a pair of enzymes is present in convergent
orientation on the same DNA molecule [19]. We find that
there is indeed an over-representation for shorter (≤300
bp) and a corresponding modest under-representation
for larger MspI fragments (Figure 4b).
Identification of polymorphic CCGG sequences
Whereas MSCC used MmeI and generates an 18- to 19-
bp sequence flanking the HpaII site [15], our use of
EcoP15I generates a 27-bp flanking sequence. We asked
whether this size difference influenced our ability to align
sequences to the reference genome. We truncated our
sequence reads to 19 bp to mimic the MSCC read length
and found that this caused a profound loss of ability to
align reads unambiguously (Table S7 in Additional file 1).
To compensate for the low alignment rate, the MSCC
report described an ingenious strategy of alignment to
the sequences immediately flanking the annotated HpaII
sites in the reference genome [15], an approach suffi-
ciently powerful that it generated the well-validated data
that they described. However, it does not offer the possi-
bility of identifying polymorphic HpaII sites at the high
frequencies that we previously observed for our HELP-
seq assay [10]. We tested whether our longer sequences
allowed the identification of loci at which an HpaII site is
annotated in the reference genome but we obtain no
sequence reads, and the opposite situation where we
observed at least four MspI reads (the average number
per annotated MspI/HpaII site) flanking a locus not
annotated in the reference genome. In Table S8 in Addi-
tional file 1 we list approximately 6,600 candidate poly-
morphic HpaII sites, of which examples are shown in
Figure 5, confirmed by targeted resequencing of those
loci. The 6,600 loci were selected based on overlap with
dbSNP entries, allowing us to evaluate the pattern of
sequence variability at these loci. Approximately 80% of
the SNPs are C:G to T:A transversions, consistent with
deamination-mediated decay of methylcytosine being the
cause of the polymorphism [23]. Polymorphic CG dinu-
cleotides are major potential sources of error not only for
microarrays, which are designed to a consensus genomic
sequence, but also for both bisulfite sequencing, which
would read the C to T transversion as unmethylated, and
mass spectrometry-based assays, requiring the develop-
ment of specific analytical approaches such as we have
described [24].
DNA methylation studies of human embryonic stem cells
To test whether the HELP-tagging assay was generating
data that are biologically plausible, we tested the methyla-
tion of different genomic sequence compartments as den-
sity plots of B angle values for the human ES cells used in
these studies. In Figure S2a in Additional file 1 we show
how promoters (defined as -2 kb to 2 kb from the tran-
scription start site of RefSeq genes), gene bodies (the
remaining region within the RefSeq gene) and intergenic
(all other) sequences compare, finding the expected
enrichment of hypomethylated loci with larger B angle
values in promoter regions. When we compared unique
with repetitive sequences, again we found the expected
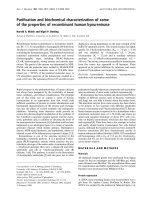
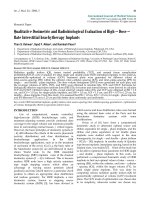
Figure 4 Base composition and fragment length influences on se-
quence counts. (a) The proportion of (G+C) nucleotides was calculat-
ed for the 50-bp sequence centered around each annotated CCGG in
the reference human genome. The base composition of all of the MspI
sequences generated from the human ES cell line studied was also cal-
culated. The relative proportion for (G+C) content in 2% bins for each
set of data was calculated and plotted as shown. The black line shows
the proportions in the reference genome, while the red line illustrates
the distribution we observed in our MspI experiment. Two peaks rep-
resenting base composition in repetitive sequences are apparent. The
MspI distribution closely matches the expected distribution except
when the base composition exceeds approximately 80%, when it is
slightly under-represented. (b) We calculated the relative frequencies
of MspI digestion product sizes in the human reference genome. In
this case we found that the shorter fragments are more likely to be se-
quenced than larger (≥300 bp) fragments. The three major peaks ob-
served represent Alu short interspersed repetitive element (SINE)
sequences.
0
0.02
0.04
0.06
0.08
0.10
0.12
0 20406080100
GC content (%)
Counts relative to total
(a)
(b)
0
0.005
0.010
0.015
0.020
0.025
0 100 200 300 400 500
Length (bp)
Actual
MspI count
Actual
MspI count
Counts relative to total
Suzuki et al. Genome Biology 2010, 11:R36
/>Page 7 of 11
pattern of increased methylation of repetitive DNA com-
pared with unique sequences (Figure S2b in Additional
file 1). Combining these observations, we tested whether
the transposable element component of annotated repeti-
tive DNA sequences showed any tendency to unusual
methylation near gene promoters. In Figure 6 we show
that while transposable elements are generally methy-
lated and are depleted near gene promoters, those that
are proximal to promoters tend to be less methylated
than those located more distally. While many types of
transposable elements were represented in this pro-
moter-proximal hypomethylated group, we found a sub-
Figure 5 Polymorphic HpaII sites identified by HELP-tagging. Examples of HpaII sites (a) annotated in the reference genome sequence but not
represented by MspI reads or (b) not annotated in the reference human genome and represented by at least four MspI reads are shown. In each case
there is a SNP defined by dbSNP that indicates the C:T to G:A transversion that eliminates or restores the CCGG HpaII site.
chr15:
25725400 25725500 25725600 25725700 25725800 25725900
OCA2
chr15:
25725640 25725650 25725660 25725670 25725680
AGTCTCTTCACTCTCACAT TCTAGCCC G GGCTCCTGCCCACA TTCTGCATGGCA TGGCCT
OCA2
rs12916836 rs12905726
chr2:
3882300 3882310 3882320 3882330 3882340 3882350
G T C TGG A GC AG AGGC T TC TA AG CA CA GC AT C T GGCCAACGAAGCCAGCACCACAGGCAGGCACT
rs6748872
GTCTGGAGCAGAGGCTTCTAAGCACAGCAT GGCCAACGAAGCCAGCACCACAGGCAGGCACT
MspI hit
Reference
dbSNP
Observed
Trace data
AGTCT CTTCACTCTCACATTCTAGCCC A GGCTCCTGCCCACACTCTGCATGG CATGGCCT
dbSNP
Observed
Reference
Trace data
HpaII
dbSNP
HpaII
MspI hit
CpG island
chr2:
3870000 3875000 3880000 3885000 3890000 3895000
HpaII
dbSNP
MspI hit
G
A
A
T
(a)
(b)
Suzuki et al. Genome Biology 2010, 11:R36
/>Page 8 of 11
set to be the most markedly over-represented, as shown
in Figure 6c.
The outcome of these studies was an improvement in
the previously described MSCC [15] and HELP-seq [10]
assays, not only by means of technical modifications such
as the use of EcoP15I but also because of the concurrent
use of MspI for normalization. The effect of these modifi-
cations was not only to increase the accuracy of the assay
but also to enhance the ability to align sequences to the
genome and thus identify polymorphic HpaII/MspI sites.
The means of normalization of HpaII by MspI using an
angular metric is an innovation that improved the data
accuracy substantially and may have applications in other
MPS assay normalization strategies. We were also able to
discard reads that did not contain the expected adapter
sequences, and created a straightforward data analytical
pipeline that will facilitate processing of these HELP-tag-
ging data by others.
The potential sources of systematic artifacts due to base
composition or digestion product size were evaluated.
Apart from a modest decrease in representation in
regions above approximately 80% (G+C) content, base
composition did not cause biases in representations, pos-
sibly in part due to our avoidance of a gel purification step
in library preparation [22]. Fragment length does influ-
ence the outcome, most likely due to effects on EcoP15I
digestion [19], although the effects should be similar for
both HpaII and MspI and should, therefore, largely cancel
each other out in the normalization step. It is possible
that endogeneous EcoP15I sites could influence the rep-
resentations, but to have an effect they would have to be
located within the 27 bp adjacent to HpaII/MspI sites and
would cause digestion of the ligated adapter, causing
those loci to be under-represented in both HpaII and
MspI datasets. The most likely effect of these endoge-
neous sites is that they contribute to the proportion of
loci at which we could not obtain sequence reads.
Our exploration of the distribution of cytosine methy-
lation in the same human ES cell line studied by Lister et
al. [6] showed consistent results, with hypomethylation
of transcription start sites and methylation of transpos-
able elements, as expected from long-standing observa-
tions in the field. We furthermore discovered a limited
subset of transposable elements that is hypomethylated
when in close proximity to transcription start sites. When
this subset was studied to determine whether certain
types of transposable elements were disproportionately
over-represented, we found two broad classes, one of
transposable element fossils with no innate capacity to
replicate themselves (the ancient DNA, long interspersed
repetitive elements (LINEs) and short interspersed repet-
itive elements (SINEs) shown in Figure 6c) and younger
ERV1 long terminal repeat retroelements. Loss of methy-
lation of functionally inactive transposable elements is
likely to be of no negative consequence to the host
genome, consistent with the host defense hypothesis [25],
while the young ERV long terminal repeats represent a
group of transposons whose function has been harnessed
as promoters of endogeneous genes [26,27]. This obser-
vation demonstrates the value of a high-resolution,
genome-wide assay like HELP-tagging to define potential
functional elements in an unbiased manner.
Conclusions
We propose that MPS-based assays such as RRBS [12],
MSCC [15] and HELP-tagging will prove to be the assays
of choice for epigenome-wide association studies in
human disease, with the latter two preferable as we begin
to explore the CG-depleted majority of the genome. It
should not be necessary to run MspI assays every time a
HELP-tagging assay is performed, suggesting that a com-
Figure 6 Identification of a position effect on DNA methylation in transposable elements located close to gene promoters. The distance
from RefSeq gene transcription start sites and DNA methylation status are shown. The x-axis displays the distance from transcription start sites (TSSs).
HpaII sites were categorized into three groups by angle, 0 to 30 (blue), 31 to 60 (red) and 61 to 90 (green)). (a) Number of HpaII sites; (b) proportions
of each angle category (%).
0%
20%
40%
60%
80%
100%
-10000
-9000
-8000
-7000
-6000
-5000
-4000
-3000
-2000
-1000
0
1000
2000
3000
4000
5000
6000
7000
8000
9000
10000
61-90
31-60
0-30
0
200
400
600
800
1000
-10000
-9000
-8000
-7000
-6000
-5000
-4000
-3000
-2000
-1000
0
1000
2000
3000
4000
5000
6000
7000
8000
9000
10000
Angle
HpaII counts
Length from TSS (bp) Length from TSS (bp)
(b)(a)
Percentage
Suzuki et al. Genome Biology 2010, 11:R36
/>Page 9 of 11
mon MspI dataset can serve as a universal reference for a
species, allowing a single lane of Illumina sequencing of
the HpaII library to provide the methylation data for that
sample. The development of analytical pipelines to sup-
port analysis of these datasets will be critical to the suc-
cess of these projects, while the careful ongoing
assessment of potential sources of bias will also be essen-
tial for improving assay performance.
Materials and methods
Cell preparation and DNA purification
H1 human ES cells (NIH code WA01 from Wicell
Research Institute, Madison, WI, USA) were cultured on
matrigel (BD Biosciences, San Diego, CA, USA), at 37°C,
5% O
2
and 5% CO
2
. Amplified human ES cell pluripo-
tency was assessed by flow cytometry with SSEA4, CD24
and Oct4 markers. To extract DNA, the cells were sus-
pended in 10 ml of a solution of 10 mM Tris-HCl (pH
8.0), 0.1 M EDTA and 1 ml of 10% SDS to which 10 μl of
RNase A (20 mg/ml) was added. After incubation for 1
hour at 37°C, 50 μl of proteinase K (20 mg/ml) was added
and the solution was gently mixed and incubated in a
50°C water bath overnight. To purify the lysate, it was
extracted three times using saturated phenol, then twice
with chloroform, and dialyzed for 16 hours at 4°C against
three changes of 0.2× SSC. Following dialysis, the DNA
was concentrated by coating the dialysis bags in polyeth-
ylene glycol (molecular weight 20,000). The purity and
final concentration of the purified DNA was checked by
spectrometry (Nanodrop, Wilmington, DE, USA).
Illumina library preparation
The sample preparation steps are illustrated in Figure 1.
Two custom adapters were created for HELP-tagging,
referred to as AE and AS. As well as an Illumina adapter
sequence, adapter AE contains an EcoP15I recognition
site and a T7 promoter sequence. Adapter AS contains an
Illumina sequencing primer sequence. The adapter and
primer sequences for library preparation are listed in
Table S9 in Additional file 1. Genomic DNA (5 μg) was
digested with HpaII and MspI in separate 200 μl reactions
and purified by phenol/chloroform extraction followed
by ethanol precipitation. The digested genomic DNA was
ligated to adapter AE using a New England Biolabs Quick
Ligation Kit (25 μl of 2× Quick ligase buffer, 3 μg of
HpaII-digested DNA or 1 μg of MspI-digested DNA, 0.1
μl of Adapter AE (1 μM), 3 μl of Quick Ligase in a final
volume of 50 μl). After AE ligation, the products were
purified using Agencourt AMpure beads (Beckman
Coulter, Brea CA, USA), then digested with EcoP15I
(New England Biolabs). The restriction fragments were
end-repaired to inhibit to dimerization of adapters, and
tailed with a single dA, at the 3' end. After the dA tailing
reaction, adapter AS was ligated to the dA-tailed frag-
ments using a New England Biolabs Quick Ligation Kit
(25 μl of 2× Quick ligase buffer, 2.5 μl of adapter AS (10
μM), 2.5 μl of Quick Ligase in a final volume 50 μl). After
ligation, products were purified using the MinElute PCR
purification kit (Qiagen, Hilden, Germany) and in vitro-
transcribed using the Ambion MEGAshortscriptkit (Life
Technologies, Carlsbad, CA, USA). Following in vitro
transcription, products were purified with an RNeasy
clean-up kit (Qiagen) before reverse transcription was
performed using the Invitrogen SuperScript III kit (Life
Technologies). The first strand cDNA produced was used
as a template for PCR using the following conditions:
96°C for 2 minutes, then 18 cycles of 96°C for 15 seconds
and 72°C for 15 seconds followed by 5 minutes at 72°C for
the final extension. After PCR, the library was purified
using a QIAQuick PCR clean-up kit (Qiagen).
Single-locus quantitative validation assays
Bisulfite conversion and MassArray (Sequenom, San
Diego, CA, USA) were performed using an aliquot of the
same sample of DNA as was used for the high-through-
put assays described above. Bisulfite conversion was per-
formed with an EZ DNA Methylation kit (Zymo
Research, Orange, CA, USA). Bisulfite primers were
designed using MethPrimer [28], specifying the desired
product length (250 to 450 bp), primer length (23 to 29
bp) and primer Tm (56 to 62°C). PCR was performed
using FastStart High Fidelity Taq polymerase (Roche,
Basel, Switzerland) with the following conditions: 95°C
for 10 minutes, then 42 cycles of 95°C for 30 seconds,
primer-specific Tm for 30 seconds and 72°C for 1 minute,
followed by 72°C for 10 minutes for the final extension.
Primer-specific Tm and sequence information are pro-
vided in Table S6 in Additional file 1. Bisulfite MassArray
assays were performed by the institutional Genomics
Core Facility. The data were analyzed using the analytical
pipeline we have previously described [24].
Bioinformatic analysis
Four lanes of sequencing were performed using an Illu-
mina GA IIx Sequencer at the institutional Epigenomics
Shared Facility. Three lanes were used for technical repli-
cates of MspI, for the methylation-insensitive reference
dataset. Images generated by the Illumina sequencer were
analyzed by Illumina pipeline software (versions 1.3 to
1.4). Initial data processing was performed using the
default read length of 36 bp, after which we isolated the
sequences in which we found adapter sequences on the
3'-end, replaced the adapter sequence with a poly(N)
sequence of the same length, and re-ran the Illumina
ELAND pipeline again on these sequences with the
sequence length set at 27 bp (the 2 to 28 bp subsequence).
The data within the ELAND_extended.txt files were used
for counting the number of aligned sequences adjacent to
Suzuki et al. Genome Biology 2010, 11:R36
/>Page 10 of 11
each CCGG (HpaII/MspI) site annotated in the hg18
freeze of the human genome at the UCSC genome
browser. We permitted up to two mismatches in each
sequence, and allowed a sequence to align to up to a max-
imum of 10 locations within the genome. For non-unique
alignments, a sequence was assigned a partial count for
each alignment location amounting to 1/n, where n rep-
resents the total number of aligned positions. To normal-
ize the data between experiments, the number of
sequences associated with each HpaII site was divided by
the total number of sequences (including partial counts)
aligning to all HpaII sites in the same sample. We refer to
this figure as the fixed count below.
To examine an influence of (G+C) mononucleotide
content on counts of sequences obtained, we extracted
the (G+C) annotation from the hg18 freeze of the human
genome at UCSC and examined the distribution of
sequence counts according to (G+C) content. Annotated
percentages of (G+C) content were available for adjacent
5-bp windows. For each annotated HpaII site, we calcu-
lated the mean percentage (G+C) for a 50-bp region cen-
tered at the restriction site. Counts of sequences
associated with HpaII sites were obtained for 50 sequen-
tial non-overlapping windows of 2% (G+C) (the mini-
mum possible in a sample of 50-bp regions). These data
were then normalized as a proportion of the total number
of fragments. Comparisons were made to the expected
frequencies, which for each 2% (G+C) bin was repre-
sented by the counts of HpaII sites falling within a range
relative to the total number of HpaII sites in the genome.
This analysis was performed on both HpaII and MspI-
digested DNA for comparison.
The potential effect of distance between HpaII sites on
sequences counts obtained at each HpaII site was mea-
sured by summing the counts of sequences aligning
within each restriction fragment, and normalizing the
result with respect to total sequence count. As with the
(G+C) analysis above, this was performed for both MspI
and HpaII digested restriction fragments. The data were
compared with the expected distribution determined by
performing virtual restriction digestion using genomic
HpaII site coordinates, and normalizing the number of
virtual fragments of each size with respect to the total
number of these virtual fragments.
Additional material
Abbreviations
bp: base pair; CG/CpG: cytosine-guanine dinucleotide; ChIP: chromatin immu-
noprecipitation; ES: embryonic stem; (G+C): guanine and cytosine mononucle-
otides; HELP: HpaII tiny fragment Enrichment by Ligation-mediated PCR; MPS:
massively-parallel sequencing; MSCC: methyl-sensitive cut counting; RRBS:
reduced representation bisulfite sequencing; UCSC: University of California
Santa Cruz.
Authors' contributions
MS and JMG designed the assays and strategies for its analysis, MS performed
all library preparation and characterization, MS, DL and MP performed bisulfite
validation studies, while QJ and AMcL performed computational analyses. JMG
and MS prepared the manuscript.
Acknowledgements
This work is supported by a grant from the National Institute of Health (NIH,
R01 HG004401) to JMG. The authors thank Shahina Maqbool PhD, Raul Olea
and Gael Westby of the Einstein Epigenomics Shared Facility for their contribu-
tions, Drs Eric Bouhassira and Emmanuel Olivier (Einstein) for the WA01/H1
human ES cell line, and Einstein's Center for Epigenomics.
Author Details
Department of Genetics (Computational Genetics), Center for Epigenomics,
Albert Einstein College of Medicine, 1301 Morris Park Avenue, Bronx, NY 10461,
USA
References
1. Esteller M: Epigenetics in cancer. N Engl J Med 2008, 358:1148-1159.
2. Kopelovich L, Crowell JA, Fay JR: The epigenome as a target for cancer
chemoprevention. J Natl Cancer Inst 2003, 95:1747-1757.
3. Zilberman D, Gehring M, Tran RK, Ballinger T, Henikoff S: Genome-wide
analysis of Arabidopsis thaliana DNA methylation uncovers an
interdependence between methylation and transcription. Nat Genet
2007, 39:61-69.
4. Cokus SJ, Feng S, Zhang X, Chen Z, Merriman B, Haudenschild CD,
Pradhan S, Nelson SF, Pellegrini M, Jacobsen SE: Shotgun bisulphite
sequencing of the Arabidopsis genome reveals DNA methylation
patterning. Nature 2008, 452:215-219.
5. Lister R, O'Malley RC, Tonti-Filippini J, Gregory BD, Berry CC, Millar AH,
Ecker JR: Highly integrated single-base resolution maps of the
epigenome in Arabidopsis. Cell 2008, 133:523-536.
6. Lister R, Pelizzola M, Dowen RH, Hawkins RD, Hon G, Tonti-Filippini J, Nery
JR, Lee L, Ye Z, Ngo QM, Edsall L, Antosiewicz-Bourget J, Stewart R, Ruotti
V, Millar AH, Thomson JA, Ren B, Ecker JR: Human DNA methylomes at
base resolution show widespread epigenomic differences. Nature
2009, 462:315-322.
7. Heijmans BT, Tobi EW, Stein AD, Putter H, Blauw GJ, Susser ES, Slagboom
PE, Lumey LH: Persistent epigenetic differences associated with
prenatal exposure to famine in humans. Proc Natl Acad Sci USA 2008,
105:17046-17049.
8. Yamashita S, Hosoya K, Gyobu K, Takeshima H, Ushijima T: Development
of a novel output value for quantitative assessment in methylated DNA
immunoprecipitation-CpG island microarray analysis. DNA Res 2009,
16:275-286.
9. Down TA, Rakyan VK, Turner DJ, Flicek P, Li H, Kulesha E, Graf S, Johnson N,
Herrero J, Tomazou EM, Thorne NP, Backdahl L, Herberth M, Howe KL,
Jackson DK, Miretti MM, Marioni JC, Birney E, Hubbard TJ, Durbin R, Tavare
S, Beck S: A Bayesian deconvolution strategy for immunoprecipitation-
based DNA methylome analysis. Nat Biotechnol 2008, 26:779-785.
10. Oda M, Glass JL, Thompson RF, Mo Y, Olivier EN, Figueroa ME, Selzer RR,
Richmond TA, Zhang X, Dannenberg L, Green RD, Melnick A, Hatchwell E,
Bouhassira EE, Verma A, Suzuki M, Greally JM: High-resolution genome-
wide cytosine methylation profiling with simultaneous copy number
analysis and optimization for limited cell numbers. Nucleic Acids Res
2009, 37:3829-3839.
11. Ordway JM, Bedell JA, Citek RW, Nunberg AN, Jeddeloh JA:
MethylMapper: a method for high-throughput, multilocus bisulfite
sequence analysis and reporting. Biotechniques 2005, 39:. 464, 466, 468
passim.
12. Meissner A, Mikkelsen TS, Gu H, Wernig M, Hanna J, Sivachenko A, Zhang
X, Bernstein BE, Nusbaum C, Jaffe DB, Gnirke A, Jaenisch R, Lander ES:
Genome-scale DNA methylation maps of pluripotent and
differentiated cells. Nature 2008, 454:766-770.
Additional file 1 Supplemental data containing two figures (Figures S1
and S2) and nine tables (Tables S1 to S9).
Received: 8 January 2010 Revised: 16 March 2010
Accepted: 1 April 2010 Published: 1 April 2010
This article is available from: 2010 Suzuki et al.; licensee BioMed Central Ltd. This is an open access article distributed under the terms of the Creative Commons Attributi on License ( which permits unrestricted use, distribution, and reproduction in any medium, provided the original work is properly citedGenome Biology 2010, 11:R36
Suzuki et al. Genome Biology 2010, 11:R36
/>Page 11 of 11
13. t Hoen PA, Ariyurek Y, Thygesen HH, Vreugdenhil E, Vossen RH, de
Menezes RX, Boer JM, van Ommen GJ, den Dunnen JT: Deep sequencing-
based expression analysis shows major advances in robustness,
resolution and inter-lab portability over five microarray platforms.
Nucleic Acids Res 2008, 36:e141.
14. Brunner AL, Johnson DS, Kim SW, Valouev A, Reddy TE, Neff NF, Anton E,
Medina C, Nguyen L, Chiao E, Oyolu CB, Schroth GP, Absher DM, Baker JC,
Myers RM: Distinct DNA methylation patterns characterize
differentiated human embryonic stem cells and developing human
fetal liver. Genome Res 2009, 19:1044-1056.
15. Ball MP, Li JB, Gao Y, Lee JH, LeProust EM, Park IH, Xie B, Daley GQ, Church
GM: Targeted and genome-scale strategies reveal gene-body
methylation signatures in human cells. Nat Biotechnol 2009, 27:361-368.
16. Fazzari MJ, Greally JM: Epigenomics: beyond CpG islands. Nat Rev Genet
2004, 5:446-455.
17. Hattori N, Nishino K, Ko YG, Hattori N, Ohgane J, Tanaka S, Shiota K:
Epigenetic control of mouse Oct-4 gene expression in embryonic stem
cells and trophoblast stem cells. J Biol Chem 2004, 279:17063-17069.
18. Irizarry RA, Ladd-Acosta C, Wen B, Wu Z, Montano C, Onyango P, Cui H,
Gabo K, Rongione M, Webster M, Ji H, Potash JB, Sabunciyan S, Feinberg
AP: The human colon cancer methylome shows similar hypo- and
hypermethylation at conserved tissue-specific CpG island shores. Nat
Genet 2009, 41:178-186.
19. Moncke-Buchner E, Rothenberg M, Reich S, Wagenfuhr K, Matsumura H,
Terauchi R, Kruger DH, Reuter M: Functional characterization and
modulation of the DNA cleavage efficiency of type III restriction
endonuclease EcoP15I in its interaction with two sites in the DNA
target. J Mol Biol 2009, 387:1309-1319.
20. Greallylab [ />21. Dohm JC, Lottaz C, Borodina T, Himmelbauer H: Substantial biases in
ultra-short read data sets from high-throughput DNA sequencing.
Nucleic Acids Res 2008, 36:e105.
22. Quail MA, Kozarewa I, Smith F, Scally A, Stephens PJ, Durbin R, Swerdlow
H, Turner DJ: A large genome center's improvements to the Illumina
sequencing system. Nat Methods 2008, 5:1005-1010.
23. Duncan BK, Miller JH: Mutagenic deamination of cytosine residues in
DNA. Nature 1980, 287:560-561.
24. Thompson RF, Suzuki M, Lau KW, Greally JM: A pipeline for the
quantitative analysis of CG dinucleotide methylation using mass
spectrometry. Bioinformatics 2009, 25:2164-2170.
25. Yoder JA, Walsh CP, Bestor TH: Cytosine methylation and the ecology of
intragenomic parasites. Trends Genet 1997, 13:335-340.
26. Conley AB, Piriyapongsa J, Jordan IK: Retroviral promoters in the human
genome. Bioinformatics 2008, 24:1563-1567.
27. Cohen CJ, Lock WM, Mager DL: Endogenous retroviral LTRs as
promoters for human genes: a critical assessment. Gene 2009,
448:105-114.
28. MethPrimer [ />]
doi: 10.1186/gb-2010-11-4-r36
Cite this article as: Suzuki et al., Optimized design and data analysis of tag-
based cytosine methylation assays Genome Biology 2010, 11:R36