Báo cáo y học: " Restriction Site Tiling Analysis: accurate discovery and quantitative genotyping of genome-wide polymorphisms using nucleotide arrays" pptx
Bạn đang xem bản rút gọn của tài liệu. Xem và tải ngay bản đầy đủ của tài liệu tại đây (1.21 MB, 14 trang )
Pespeni et al. Genome Biology 2010, 11:R44
/>Open Access
METHOD
BioMed Central
© 2010 Pespeni et al.; licensee BioMed Central Ltd. This is an open access article distributed under the terms of the Creative Commons
Attribution License ( which permits unrestricted use, distribution, and reproduction in
any medium, provided the original work is properly cited.
Method
Restriction Site Tiling Analysis: accurate discovery
and quantitative genotyping of genome-wide
polymorphisms using nucleotide arrays
Melissa H Pespeni*
1
, Thomas A Oliver
1
, Mollie K Manier
1,2
and Stephen R Palumbi
1
Restriction Site Tiling AnalysisA method for the simultaneous identification of polymorphic loci and the quantitative geno-typing of thousands of loci in individuals is presented.
Abstract
High-throughput genotype data can be used to identify genes important for local adaptation in wild populations,
phenotypes in lab stocks, or disease-related traits in human medicine. Here we advance microarray-based genotyping
for population genomics with Restriction Site Tiling Analysis. The approach simultaneously discovers polymorphisms
and provides quantitative genotype data at 10,000s of loci. It is highly accurate and free from ascertainment bias. We
apply the approach to uncover genomic differentiation in the purple sea urchin.
Background
Uncovering the genetic underpinnings of adaptive evolu-
tion is key to understanding the evolutionary processes
that generate biodiversity [1]. The combined use of
genome scans and population genetic analyses has been
applied in both model and non-model organisms to dis-
cover and document the role of specific genes in adaptive
evolution [2-6]. Surveys of hundreds to thousands of
genome-wide markers identified from SNP databases,
microarray-based SNP survey methods, or sequences
have been applied in humans, yeast, dogs, the malaria
parasite Plasmodium falciparum, Drosophila, and Arabi-
dopsis [7-14]. Based on massive sequencing efforts to
identify polymorphisms, these approaches have led to
insightful evaluation of genetic adaptation. However,
these data sets can be complicated by ascertainment bias
[15,16] and have historically required a large investment
in SNP development.
Approaches to non-model organisms have also resulted
in powerful tools to characterize the imprint of selection
across the genome at smaller numbers of loci. Tens to
hundreds of anonymous genome-wide markers, such as
amplified fragment length polymorphisms or microsatel-
lites, have shown genetic patterns correlated to environ-
mental conditions, indicating local adaptation in
organisms, including periwinkle snails, lake whitefish,
Atlantic salmon, common frogs, and beech trees [17-21].
These methods require little prior marker or sequence
information. However, they are limited by the number of
loci that can be examined (usually hundreds) and the
focus on anonymous loci limits identification of function-
ally relevant genes [22].
Genome-wide scans of genetic diversity at tens of thou-
sands of loci have become more accessible for non-model
study systems with the development of microarray-based
polymorphism detection approaches and as the synthesis
of species-specific cDNA and high-density oligonucle-
otide arrays has become more affordable [23]. Specifi-
cally, array platforms have been used to detect single
feature polymorphisms (SFPs) and restriction-site-asso-
ciated DNA (RAD) markers by hybridization to species-
specific arrays [24-26]. In these methods, a polymor-
phism is detected as a binding signal difference between
individuals or pooled population samples hybridized to
arrays. In the SFP approach, labeled genomic DNA from
different samples is separately hybridized to high-density
arrays of species-specific 25-bp oligonucleotides. In the
case of RAD, two individuals are labeled with different
fluorescent dyes and co-hybridized to a single array to
identify differences. Each approach has advantages: SFP
markers are not restricted to restriction cut sites, and
RAD markers can be identified using pre-existing cDNA
arrays. However, these approaches generate binary data
about the presence or absence of a polymorphism at a
locus (rather than genotype data of an individual), and
* Correspondence:
1
Department of Biology, Stanford University, Hopkins Marine Station,
Oceanview Blvd Pacific Grove, CA 93950, USA
Full list of author information is available at the end of the article
Pespeni et al. Genome Biology 2010, 11:R44
/>Page 2 of 14
RAD requires pairwise competitive hybridization among
samples to identify differences. In addition, these
approaches have primarily been applied in inbred, geneti-
cally tractable study organisms: yeast, Arabidopsis
strains, Drosophila isofemale lines, stickleback lines,
zebrafish lines, and Neurospora mold [25-31], with the
exception of wild caught Anopheles mosquitoes [32].
Another potential approach for generating genome-
wide polymorphism data in non-model organisms is the
combination of next-generation sequencing with targeted
SNP genotyping [33-35]. For example, for a species with-
out a sequenced genome, the transcriptomes of multiple
individuals could be labeled and pooled ('multiplexed')
and sequenced in a single 454 sequencing run [36]. These
sequence data can be used to identify common polymor-
phisms that can then be assayed across more study indi-
viduals using a SNP genotyping platform (for example,
Illumina's GoldenGate or Infinium platforms or Affyme-
trix GeneChips). Though this is an attractive approach,
there are two major disadvantages. First, only genes
expressed in sampled individuals can be compared; geno-
types at other genetic loci cannot be assayed, emphasiz-
ing an important balance in 454 transcriptome
sequencing - breadth of gene coverage across the genome
and depth of coverage necessary for polymorphism iden-
tification. Second, ascertainment bias would be intro-
duced by surveying only common polymorphisms
identified from a subset of individuals. Rare polymor-
phisms would not be detected in the sequence data or
may be excluded as potential sequencing errors. The
importance of rare polymorphisms was recently empha-
sized in two independent studies on human disease. Data
from the complete genome sequences of 14 healthy and
diseased individuals suggested that diseases, whether rare
or common, were caused by rare mutations [37,38]. As a
result, an approach that detects even rare substitutions is
advantageous.
For population genomics studies, there is a need for
higher resolution genome-wide genotype data free from
ascertainment bias and a less cumbersome ability to com-
pare numerous individuals across multiple, wild popula-
tions. Though future resequencing technologies may
allow genetic studies to map traits or search for adaptive
genes by whole genome sequence comparisons [23,39],
population level studies require comparing numerous
individuals at the same loci. The sequencing coverage
necessary to repeatedly sample many individuals across
the same large set of loci drives resequencing strategies to
be less cost-effective than array-based polymorphism dis-
covery and genotyping assays.
Here we present a generally applicable technique,
Restriction Site Tiling Analysis (RSTA), which scans for
restriction cut site polymorphisms across the genome of
an individual using a microarray platform. The technique
requires the sequence of a single genome, transcriptome,
or large EST library from which to design a species-spe-
cific, high-density microarray. The approach allows
simultaneous identification of polymorphic loci and the
genotyping of individuals as homozygous for a cut site,
homozygous for a mutation in a cut site, or heterozygous
at thousands of loci. The approach is free from ascertain-
ment bias and does not require competitive hybridization
among individuals to identify polymorphisms. These
qualities make it well suited for population genomics
studies. Genotype data can be used to calculate F
ST
or
heterozygosity, or look for patterns of linkage disequilib-
rium in two or more populations. We first validate the
accuracy of the method in detecting polymorphic loci
and genotyping individuals. Second, we explore its appli-
cation for population genomics studies by comparing the
genomes of 20 purple sea urchins from two geographi-
cally and environmentally distant populations.
We developed this method using the purple sea urchin,
Strongylocentrotus purpuratus (Stimpson, 1857), as a
model system because we are ultimately interested in
studying the balance between gene flow and adaptive
evolution along environmental gradients. The purple sea
urchin lives in intertidal and shallow subtidal habitats
from the cold waters of Alaska to the warmer waters of
Baja California, Mexico [40]. There is great potential for
genetic mixing because larvae may travel far during a 4-
to 12-week development phase [41,42]. In accordance
with their high dispersal potential, previous studies have
found little or no population structure along the coast of
the United States [43,44]. In addition, the purple sea
urchin is a highly fecund species [42] and has dramati-
cally large population sizes [45]. Theoretically, these
characteristics maximize the effects of natural selection
and minimize the effects of random genetic drift, making
this species a good system in which to study adaptive evo-
lution across the genome. Finally, the purple sea urchin
has a published genome sequence [46] and has been the
subject of ecological studies for decades [47,48]. How-
ever, little is known about the adaptive potential of purple
sea urchins despite their broad latitudinal distribution,
ecological importance, and their role as a model species
in developmental biology.
The purple sea urchin genome is approximately 800 Mb
in size, encoding approximately 28,000 genes. There is a
similar number of genes and gene structure as seen in the
human genome, about 8 exons and 7 introns per gene
with each gene spanning on average 8 kb [46]. Exon size is
just over 100 nucleotides and intron size is about 750
nucleotides, shorter than introns in the human genome
as expected with the smaller genome size. The species is
highly polymorphic relative to other species with
sequenced genomes. Using thermal DNA reassociation
experiments, it was estimated that two individual urchins
Pespeni et al. Genome Biology 2010, 11:R44
/>Page 3 of 14
differ from each other in about 4% of the nucleotide pairs
in single-copy DNA [49]. Genome assembly revealed
about one SNP per 100 bases and a comparable number
of indel polymorphisms [46] when aligning the
sequenced DNA from the single inbred diploid individual
sea urchin. Such high heterozygosity has impeded a more
complete assembly of the genome. In the most recent
build of the genome sequence (Spur_v2.1, September
2006), there were 114,222 scaffolds of which 16,057 had
multiple contigs with an N50 of 183 kb. Scaffolds are not
physically mapped to chromosomes.
Results
RSTA hybridization results
RSTA is based on differential binding of restriction
digested and non-digested DNA from a single individual
to a single array with 50-bp tiles designed to be centered
on known restriction cut sites (Figure 1). Specifically, for
each individual, genomic DNA is randomly sheared by
sonication, restriction digested and internally labeled
with fluorescent dCTP using random octomers (Cy3,
green). Non-digested DNA from the same individual is
labeled with a different color (Cy5, red). These genomic
preparations from the same individual are then pooled
and hybridized under conditions that favor binding of
uncut DNA over cut DNA to the array tiles. DNA that
matches the known genome sequence is cut by the
restriction enzyme, resulting in poor binding to the array
tiles, low Cy3 signal intensity, and a high Cy5 to Cy3 ratio.
In contrast, DNA with a polymorphic mutation in the cut
site remains intact, resulting in a high Cy3 signal inten-
sity, and a more even Cy5 to Cy3 ratio (Figure 1).
We designed several types of tiles in order to confirm
that genomic DNA from a diploid organism with a large,
complex genome interacted with the array platform as
predicted. There were five tile types on the array: restric-
tion cut site centered tiles (n = 50,935), control tiles cen-
tered on non-cut sites in single copy genes (n = 10,523),
negative control tiles that did not match anywhere in the
genome based on BLASTN results (n = 1,036), positive
control tiles that matched multi-copy ribosomal DNA (n
= 100), and a degradation series to examine the effect of
mutational differences between sample DNA and tile
sequence on binding efficiency (n = 1,100). We surveyed
TaqáI restriction cut sites, though any restriction enzyme
or number of enzymes could be used as long as each 50-
bp probe is non-overlapping. TaqáI recognizes four base
pairs (TCGA) and in doing so is predicted to occur, on
average, every 256 bases. The average intermarker dis-
tance was 15.7 kb between restriction cut site centered
tiles across the 800 Mb genome.
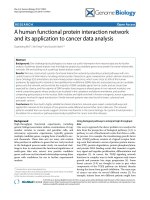
Both experimental and control tiles yielded expected
signal intensities (a proxy for binding efficiency). Restric-
tion digestion resulted in a significantly lower distribu-
tion of green (Cy3) signal intensities for restriction cut
site centered tiles compared to the control red (Cy5)
channel (Figure 2a; KS test, P < 0.0001). Control non-cut
site tiles showed strong Cy3 (digested DNA) signal inten-
sities, indicating no effect of restriction digestion (KS
test, P < 0.0001). Negative control tiles had very low sig-
nal intensities, significantly lower than experimental tiles
(Figure 2b; KS test, P < 0.0001). Positive control tiles
designed to match ribosomal DNA had much greater sig-
nal intensity than experimental tiles designed to single-
copy loci (Figure 2b; KS test, P < 0.0001). We assessed the
repeatability of the RSTA approach by performing exper-
imental and technical replicates (that is, independent
extraction, processing and hybridization of DNA from a
single individual to multiple arrays, and replicate tiles
synthesized in triplicate on a single array). These experi-
ments revealed that the signal intensities of correspond-
ing tiles among replicate arrays were highly consistent (R
2
= 0.92) and that there was low variance among replicate
tiles on a single array (coefficient of variation = 0.08).
Identification of polymorphic loci
We compared the genomes of 10 individual purple sea
urchins from Boiler Bay, Oregon and 10 individuals from
San Diego, California at 50,935 restriction cut sites using
20 RSTA arrays. We genotyped the ten northern sea
urchins and the ten southern sea urchins at five known
polymorphic restriction cut sites through PCR amplifica-
tion and restriction digestion and sequencing. We then
examined the RSTA array data from 50-bp tiles designed
around each of these five loci. We found for each locus
that RSTA data across the 20 individuals consisted of
three clusters corresponding to the two homozygous and
the heterozygous genotypes (Figure 3a). The homozygote
clusters were separated by more than 0.7 log ratio units.
We used these log ratio characteristics (three clusters and
a range greater than 0.7) to identify polymorphic loci
among the other 50,930 loci based on their RSTA array
data. We used the Bayesian hierarchical clustering algo-
rithm Mclust [50] to determine the number of clusters
that best described the log ratio data for the 20 individu-
als for each locus. These criteria identified 12,431 loci as
polymorphic out of the 50,935 loci surveyed (24%). There
were 6,859 polymorphisms in coding regions, 2,253 in
putative regulatory regions, and 3,319 in intergenic
regions. We confirmed individual genotypes for a subset
of loci using PCR amplification and sequencing (see
below) or restriction digestion gels (Figure 3b). We used
the resulting genotype data to look for signals of popula-
tion differentiation at specific loci (Figure 3c).
Accuracy of detecting polymorphic loci and genotyping
To determine the accuracy of the RSTA method and to
determine the log ratio range for each genotype, we
Pespeni et al. Genome Biology 2010, 11:R44
/>Page 4 of 14
designed primers to amplify and sequence 15 loci, 7 puta-
tive polymorphic loci and 8 putative monomorphic loci,
across the 20 individuals. We found 99.6% accuracy in
genotypes called from RSTA array data (252 correct out
of 253 genotypes surveyed). Of the 8 putative monomor-
phic loci, all were monomorphic; 139 out of 139 (100%) of
the genotypes across the 20 individuals were homozygous
for the TaqáI cut site (TCGA). Out of the 114 polymor-
phic genotypes we confirmed with sequence data, 113
(99.1%) matched genotypes called from the RSTA array.
From these confirmed genotypes, log ratio data for differ-
ent genotypes reliably fell into three distinct clusters (less
than -0.6 for homozygous uncut, between -0.6 and -0.1
for heterozygotes, and greater than -0.1 for homozygous
cut). We used these cutoffs to call individual genotypes
among all polymorphic loci from the population data set.
These results show that our method of polymorphism
identification and genotype calling was highly accurate
under these conditions, distinguishing monomorphic and
polymorphic loci and correctly calling genotypes of poly-
morphic loci.
We were also able to detect insertion-deletion poly-
morphisms (indels) in the RSTA array data. Indels
affected the Cy5 (non-digested) signal such that alleles
with a deletion had a low binding signal (signal intensity
<50), in the same range as background and negative con-
trol tiles. Alleles that matched the published genome
sequence had a normal binding signal (signal intensity
>150, depending on tile sequence). To identify loci with
indel polymorphisms, we used these signal intensity cut-
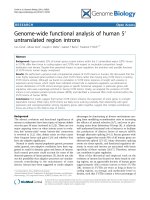
Figure 1 Restriction site tiling analysis identifies polymorphisms and genotypes individuals by hybridization to a custom microarray. Fifty
base pair tiles (white circles) are designed to be centered on restriction enzyme cut sites. DNA from an individual is extracted and randomly sheared
by sonication. The sample is then divided in half: one part is treated with the restriction enzyme and labeled with green fluorescent dye (Cy3), the
other part is treated as a control (without restriction enzyme) and labeled with red fluorescent dye (Cy5). The two parts are mixed and hybridized to
the array. This DNA processing and hybridization result in different fluorescent signals reflecting the three possible genotypes for a polymorphic locus:
when an individual is homozygous for the cut site (blue triangle) the digested DNA is cut and does not hybridize to the tile, resulting in a high red-to-
green ratio (log2 Cy5/Cy3, left panel); however, if an individual is homozygous for a mutation in the cut site (yellow star) then the DNA remains intact
and hybridizes to the tile, resulting in high green signal intensity or a low red-to-green ratio (right panel). Heterozygous individuals yield an interme-
diate red-to-green ratio. Polymorphic loci are identified based on the bi- or trimodal distribution of log ratios across sampled individuals. Individuals
can be genotyped based on their log ratio.
1. Extract and
randomly shear
genomic DNA
4. Combine and
hybridize to
arrays
2. Divide sample
and restriction
digest half
3. Label fragments
with red or green
Higher red (Cy5) to
green (Cy3) ratio
Homozygous for cut site
Digest
Lower red (Cy5) to
green (Cy3) ratio
Homozygous for mutation
Digest
Heterozygous
Intermediate red (Cy5)
to green (Cy3) ratio
Digest
Cut site
Mutation
Microarray
feature
Pespeni et al. Genome Biology 2010, 11:R44
/>Page 5 of 14
offs and the presence of two or three clusters in the Cy5
signal intensity data. We found that 3% of loci in coding
regions had indel polymorphisms. We sequence-con-
firmed one particularly interesting locus, a mannose
receptor, and found that RSTA array data matched
sequence data in all cases. The sequence data revealed a
3-bp deletion in seven of seven predicted deletions while
five out of five sequences matched the tile sequence as
predicted. Genes with indels could be top candidates for
further study as they likely result in an amino acid
sequence change, possibly affecting protein function.
We found that approximately 24% of surveyed restric-
tion cut sites contained a mutation among the 20 individ-
uals surveyed, which equates to about one polymorphism
per approximately 200 bp of the purple sea urchin
genome. This is less than expected based on the genome
assembly, which found at least one SNP every approxi-
mately 100 bp and an equal proportion of indels. Due to
the high degree of genetic diversity in this species, it is
likely that a large proportion of polymorphisms among
the 20 individuals sampled went undetected. In highly
polymorphic genomic regions, the sampled DNA will not
bind to the microarray tile and polymorphisms cannot be
detected in the surveyed cut site. This is supported by the
observation that we had a significantly greater fraction of
tiles with poor binding signal in non-coding regions
(7.8%) where higher rates of polymorphism were
expected than in coding regions (4.3%, chi-square =
5049.6, P < 0.0001). To determine the effect on hybridiza-
tion of mutational differences between sample DNA and
microarray tiles designed from the published genome
sequence, we designed tiles that were a perfect match to
one place in the genome, then randomly mutated 1 to 10
bases, resulting in a series of 11 tiles per perfect match
tile. We did this for 100 perfect match tiles, resulting in a
degradation series data set of 1,100 tiles. We found that
there was an 80% reduction in signal intensity with four
mutational differences in the 50-bp tiles, resulting in near
background signal intensity range. These data suggest
that 8% sequence difference between a DNA sample and
microarray tile results in near complete hybridization
loss.
Population patterns of polymorphic loci
For the 12,431 polymorphic loci, we constructed a geno-
type matrix for the 20 individuals. We used this matrix to
calculate heterozygosity and F
ST
. We found that San
Diego individuals had a significantly higher mean
heterozygosity (0.2427) than Oregon individuals (0.2258;
KS test, P = 1.38 × 10
-7
), supporting the hypothesis of
higher gene flow (larval dispersal) from the north to the
south along the US West coast [51]. As expected, we
found a higher frequency of the uncut homozygous geno-
type (different from the published genome sequence,
where the individual sequenced was from southern Cali-
fornia) in Oregon individuals (0.1035) than San Diego
individuals (0.0869; KS test, P = 5.014 × 10
-11
). We used
the genotype matrix to calculate F
ST
for each locus as F
ST
= (H
T
- H
S
)/H
T
, using allele frequencies to estimate
heterozygosity, where H
T
is the total heterozygosity
across populations and H
S
is the mean of heterozygosity
within populations [52]. The genome-wide mean F
ST
was
0.0029 among populations, with single locus F
ST
values
ranging from 0 to 0.5.
Genome-wide population patterns revealed that all loci
were in Hardy-Weinberg equilibrium after multiple test
correction. Among the top 100 highest F
ST
coding loci
and the top 100 highest F
ST
loci overall, we found no link-
age disequilibrium among any locus pairs after multiple
test correction (using Genepop [53]). We looked for pat-
terns of linkage in 687 paired loci in coding regions and
corresponding upstream regions of the same genes. We
found a highly significant correlation between the F
ST
val-
ues of the paired loci (correlation coefficient = 0.3288, P <
0.0001). These data suggest that similar forces are acting
on genetic differentiation in coding and upstream
regions, either because of linkage across the two tile sites
(2 to 10 kb apart) or the joint action of selection.
Genetic differentiation along the species range
We applied Principal Components Analysis (PCA) to
determine if there was a signal of population differentia-
tion in the array data set. Analyzing the log ratio data of
Figure 2 Frequency histograms of signal intensities for experi-
mental and control tiles. (a) Digested DNA (green, labeled with Cy3)
and non-digested DNA (red, Cy5) binding to restriction cut site cen-
tered tiles. (b) Cy5 signal intensities for negative control tiles (blue, ran-
domly generated tiles that did not match anywhere in the genome
according to BLASTN) and positive control tiles (magenta, matching
multi-copy ribosomal DNA).
0 1,000 2,000 3,000 4,000 5,000 6,000 7,000
0
2,000
4,000
6,000
8,000
10,000
12,000
0 1,000 2,000 3,000 4,000 5,000 6,000 7,000 8,000
0
500
1,000
1,500
2,000
2,500
3,000
0
2
4
6
8
10
12
8,000
Digested DNA, Cy3
Non-digested DNA, Cy5
Negative controls
Positive controls
Signal intensity
Number of probesNumber of probes
(a)
(b)
Pespeni et al. Genome Biology 2010, 11:R44
/>Page 6 of 14
all polymorphic loci, we found that principal components
two and three spatially separated Oregon and San Diego
populations (Figure 4a). By removing loci in the tail of the
F
ST
distribution (F
ST
>0.1, defined by the mean F
ST
plus
two times the standard deviation, approximately the top
4%), we found that the spatial split between populations
was lost (Figure 4b). These results suggest that >95% of
the purple sea urchin genome has no signal of population
differentiation, in accord with previously published
descriptions of a few loci [43,44]. As expected, the high
F
ST
loci (top 4%) show a strong separation of Oregon and
San Diego individuals along PC2 (Figure 4c; see Addi-
tional file 1 for a list of the top 100 loci and the corre-
sponding gene annotations).
Overall F
ST
was low: 0.0029. To test the significance of
this value, we randomly shuffled the alleles from all 20
individuals and recalculated F
ST
over 10,000 permuta-
tions for each polymorphic locus. We compared the
observed genome-wide F
ST
distribution to the permuted
distributions to determine if the observed F
ST
s were
higher than would be predicted under panmixia. The
observed distribution was significantly broader than
9,991 (99.91%) of the permuted distributions (KS test, P <
0.0001; Figure 5). The observed mean was higher than the
permuted mean (observed: 0.0029 > permuted: 0.0026)
over all the 10,000 simulations. The mean and median of
the observed distribution was higher than 100% of the
simulated distributions. These results show that the
Figure 3 Polymorphic restriction cut site in pyruvate kinase muscle isozyme across 20 individuals. (a) RSTA array log ratio data separate gen-
otypes of individuals sampled. Cool colored circles represent individuals from Boiler Bay, Oregon; warm colored triangles represent individuals from
San Diego, California. The data for each individual are in triplicate. (b) Individual genotypes confirmed by restriction digest gels. Lane 1 is an undigested
PCR fragment for size reference, while lanes 2 to 10 are treated with the restriction enzyme; lanes 2, 3, 5, 6, 9, and 10 are from heterozygous individuals;
lane 4 is from an individual homozygous for the cut site; lanes 7 and 8 are individuals homozygous for a mutation in the cut site. (c) Genotype data
resulting from RSTA can be used to look for differences across populations.
Uncut
Heterozygote Cut - TCGA
F
ST
= 0.091
Pyruvate kinase muscle isozyme - GLEAN 01817
UncutHetC ut
123 4567 8 910
Uncut Het Cut
(a)
(b) (c)
Log ratio (Cy5/Cy3)
Log Cy5
No. of individuals
Boiler Bay, OR
San Diego, CA
-1
-0.5 0 0.5 1 1.5
3
4
5
6
7
8
0
2
4
6
8
10
Pespeni et al. Genome Biology 2010, 11:R44
/>Page 7 of 14
observed data consistently had a higher F
ST
than expected
under panmixia. Moreover, the observed distribution
always had more loci with F
ST
>0.2 than seen in the per-
muted distributions. The higher levels of F
ST
in the
observed data set suggest that there is low but significant
genetic differentiation between populations. Such differ-
entiation could be due to low gene flow among popula-
tions, selection at some loci, or both.
Detecting loci under selection depends on evaluating
the distribution of F
ST
s among loci compared to that
expected under neutrality [3]. We searched for loci that
showed significantly high F
ST
values using the procedure
of Beaumont and Nichols as implemented in LOSITAN
[54]. Three significant loci were identified by this analysis
(P < 0.000002), along with a fourth marginally significant
(P < 0.00003). These conclusions are limited by the large
number of multiple tests, requiring a strong multiple test
correction factor, but the distribution of P-values sug-
gests selection acts on more loci than just these three.
Seven loci show P-values < 0.0001 whereas less than one
is expected. Likewise, the number of loci with P-values <
0.001 or < 0.01 is higher than expected (22 versus 7, and
93 versus 69, respectively).
A separate procedure, in which selection on loci is esti-
mated from the data and the distribution of selection fac-
tors (α) is tested against Bayesian expectation, was
suggested by Beaumont and Balding [55] and augmented
by Foll and Gaggiotti [56]. This test returns three strongly
significant loci (Bayes factor >10) - two of which were
detected in the previous analysis. The third significant
locus is ranked fourth in the previous test. These values
show selection factors (α) of 1.3 to 1.4. Simulations sug-
gest that these values correspond to mild selection coeffi-
cients (s) of about 0.02 per generation [56]. In summary,
our data suggest selection is acting on a small number of
loci, but also suggest that selection occurs at other loci as
well. In this high gene flow species, increased sampling at
the individual and population levels using RSTA or other
more targeted approaches would be needed to test
robustly for selection across the genome.
The top five genes in which loci were identified as outli-
ers were mannose receptor C1, transcription factor 25,
cubilin, a chromatin assembly factor (retinoblastoma
binding protein 4 (RBBP4)), and a Golgi autoantigen.
Mannose receptors bind to foreign cells and target them
for destruction by the immune system [57]. Polymor-
phisms in mannose-binding proteins in humans are asso-
ciated with infection frequency [58], but no data exist yet
on the role of sea urchin polymorphisms. Transcription
factor 25 (TCF25) and the chromatin assembly factor
(RBBP4) both negatively regulate transcription. Cubilin is
a multi-ligand endocytic receptor important for the
endocytosis of proteins, nutrients and vitamins, and is
massively expressed in the yolk sac during development
[59]. The Golgi autoantigen (Golgin subfamily A member
3 (GOLGA3)) is an autoimmune antigen associated with
the Golgi complex and has been shown to be important
for successful spermatogenesis [60]. These genes suggest
important roles for immunity, transcriptional regulation,
and reproduction and development. These processes
have previously been shown to be targets of natural selec-
tion in other systems [61-63].
Several other particularly interesting genes were among
the highest F
ST
loci (Additional file 1) as potential targets
Figure 4 Principal Components Analysis using RSTA array log ra-
tio data show a signal of population differentiation in a high gene
flow species. Symbols represent individuals from Oregon (blue cir-
cles) and San Diego (red triangles). (a) All polymorphic coding loci,
6,859; (b) polymorphic coding loci excluding top F
ST
loci, 6,555; and (c)
top F
ST
polymorphic coding loci, 304. Patterns were similar for other
tiles in non-coding regions.
-0.6 -0.4 -0.2 0 0.2 0.4 0.6
-0.4
-0.2
0
0.2
0.4
0.6
-0.6
-0.4
-0.2
0
0.2
0.4
-0.6
-0.6 -0.4 -0.2 0 0.2 0.4 0.6
PC2
PC3 PC3
PC2
(a)
(c)
(b)
Figure 5 Genome-wide distribution of F
ST
values. Open bars show
the observed distribution for 12,431 polymorphisms. Solid bars show
the mean of 10,000 random permutations. Error bars represent stan-
dard deviation for permuted distributions. Numbers in boxes show ex-
cess number of loci observed over mean permuted.
Permuted
Observed
Number of loci
F
ST
0 - 0.05
0.05 - 0.1
0.1 - 0.15
0.15 - 0.2
0.2 - 0.25
0.25 - 0.3
0.3 - 0.35
0.35 - 0.4
> 0.4
166
95
39
9
7
2
2
3
- 322
10,000.0
1,000.0
100.0
10.0
1.0
0.1
0.0
Pespeni et al. Genome Biology 2010, 11:R44
/>Page 8 of 14
of natural selection. These include a toll-like receptor
(Tlr2.1), cytochrome P450, receptor for egg jelly 7, and a
GABA-receptor, among others. Toll-like receptors and
cytochrome P450 are environmental response genes that
function during bacterial outbreaks [64,65] and environ-
mental stress [66,67]. Receptors of egg jelly are expressed
on the apical tip of sperm heads and are critical proteins
in gamete recognition [63]. GABA receptors function in
some taxa as signals for larval settlement [68], and could
play a role in habitat selection during early life. Alterna-
tively, it could play some other role in larval nervous sys-
tem function.
Discussion
Comparison of RSTA to other high-throughput
polymorphism discovery methods
RSTA significantly advances other related high-through-
put polymorphism discovery and genotyping methods by
providing quantitative genotype data for each individual
surveyed for each polymorphic locus identified (Table 1).
Such data can be used to examine population allele fre-
quencies at tens of thousands of loci, calculate F
ST
or
Hardy-Weinberg equilibrium, model neutrality, identify
outlier loci, or apply any other downstream population
genetic analysis that requires genotype data. We also
demonstrate that RSTA is highly accurate in outcrossed
populations sampled from the wild, making it useful for
species that cannot be crossed in the lab. The application
of RSTA for genome-wide surveys of wild populations
can generate hypotheses regarding genes important for
local adaptation in species that do not have a visible trait
that might confer a fitness advantage.
RAD tagging, like RSTA, surveys the genome of a spe-
cies for restriction cut site polymorphisms using an array
platform [25]. The RAD system compares the hybridiza-
tion signal between two genome preparations that are co-
hybridized, and provides a view of the relative degree of
restriction digestion in the two genome preparations.
Applying the RAD approach in our study system at the
level of individual DNAs would have required 190 hybrid-
izations in order to compare all individuals to one
another in the way that 20 RSTA hybridizations allowed.
In addition, the resulting 190 RAD hybridizations would
produce a qualitative ranking of allele content among
individuals, but not the precise genotypes at all loci.
Applying the SFP [26] approach, however, though this has
not been demonstrated, could yield quantitative data
because, like RSTA and unlike RAD, there is no PCR
amplification step in DNA processing and each individual
is hybridized to a single array. PCR amplification can gen-
erate differences in allele copy numbers between samples,
making detecting differences between samples qualitative
rather than quantitative. However, the short oligonucle-
otide size (25 bp) in the SFP approach could add noise to
the data through non-specific binding, particularly in
species with large complex genomes, and could yield
more subtle differences between genotypes at each poly-
morphic locus. This would necessitate large sample sizes
to improve the signal to noise ratio for quantitative SFP
genotype data. RSTA may be better suited for species
with large genomes or high heterozygosity and may yield
cleaner data for heterozygotes because of the longer oli-
gonucleotides used (50 bp).
RSTA, RAD, and SFP approaches can be applied to
'bulk' DNA pooled from individuals from a single popula-
tion. This drastically reduces the number of arrays
needed but also reduces the data to a qualitative assess-
ment of gene frequency differences between pooled sam-
ples because there is not a precise relationship between
hybridization signal difference and gene frequency differ-
ence. By contrast, the RSTA approach applied at the indi-
vidual level allows gene frequencies to be precisely
quantified among populations and produces multi-locus
data sets of high accuracy at the individual and popula-
tion levels.
RAD tagging has been extended to use next-generation
sequencing to identify polymorphisms [30]. RAD
sequencing reduces representation of the genome by
sequencing adjacent to conserved restriction cut sites.
The approach identifies a similar number of markers as
RSTA, although it does not provide genotype data. Half
of one Illumina run yielded approximately 0.4- to 1-fold
coverage across the 96 individuals studied [30]. An esti-
mated 13-fold coverage is necessary for accurate identifi-
cation of heterozygotes [69], making next-generation
sequencing costly for genotype data at this stage.
In applying RSTA, DNA processing and data analysis is
simpler than in other approaches. DNA processing pro-
ceeds as follows: shear by sonication, restriction digest
with chosen enzyme, fluorescently label, then competi-
tively hybridize with control, non-digested DNA from the
same individual. Hybridization against control DNA from
the same individual and screening for trimodal data
across the population data set nicely separates signal
from noise in microarray data, likely resulting in the low
false discovery rate (<1%). The RSTA approach can also
distinguish SNP and indel polymorphisms using the
hybridization signal of the control, non-digested DNA.
The major advantage of the RSTA system is that it pro-
duces highly accurate genotypes of individuals at many
loci simultaneously without ascertainment bias. Other
platforms can provide this information for well-defined
systems, though there will be ascertainment bias if tar-
geted SNPs are surveyed - for example, the Affymetrix
platform used for humans, dogs, or yeast. In addition,
there is a high upfront cost for microarrays that require
mask development and there is little chance that such
gene chips will become available for many species. In the
Pespeni et al. Genome Biology 2010, 11:R44
/>Page 9 of 14
field of population genomics, there is a need for and keen
interest in generating genome-wide genotype data for
wild populations of a species. RSTA provides such quan-
titative genome-wide genotype data in a technically and
analytically straightforward approach and without an
upfront microarray design cost.
Opportunities for expanded genome-wide population
genetics
We present an accurate genome scanning method that
allows simultaneous discovery of polymorphisms and
genotyping of thousands of loci by surveying for restric-
tion cut site polymorphisms using an affordable, species-
specific microarray. The RSTA array approach can be
applied to any species with a cDNA library database or
454 transcriptome sequence, for example. A combination
of 454 transcriptome sequencing with a breadth of gene
coverage and RSTA polymorphism discovery and geno-
typing could be very fruitful for the discovery of function-
ally important genes in non-model species. A breadth of
gene coverage in transcriptome sequencing could be
accomplished by pooling across multiple tissues and life
history stages and tissues sampled after treatment with
various environmental stimuli. Because 4-base restriction
sites occur at random about every 256 bp (for gene
regions with equal nucleotide frequencies), 10,000 kb of
sequence data (comparable to what was generated for the
Glanville fritillary butterfly using 454 sequencing [35])
would provide on the order of 40,000 RSTA tiles. There is
also great potential to increase genome-wide coverage by
increasing the number of restriction cut sites surveyed.
There is no compromise in data quality in assays of sites
from multiple restriction enzymes as long as sites are fur-
ther than 50 bases apart such that tiles are not overlap-
ping (data not shown).
The application of RSTA in species with lower genetic
diversity than purple sea urchins could reveal a lower
proportion of polymorphic RSTA tiles. However, the high
Table 1: Comparison of four high-throughput polymorphism detection approaches
Parameter SFP RAD tagging RAD sequencing RSTA
Marker type SNPs and indels Restriction cut site
polymorphisms
Sequence data: SNPs
next to restriction cut
sites
Restriction cut site
polymorphisms:
distinguishes SNPs and
indels
Number of loci
surveyed
92,924 19,200 (elements on an
enriched RAD-tag
microarray designed
from stickleback)
26 nucleotides at
41,622 RAD tags
50,935
Number of
polymorphisms
identified (informative
marker rate)
3,806 (4% at a 5% false
discovery rate cutoff)
1,990 (10% at a two-
fold signal difference
cutoff)
Approximately 13,000
(31%)
12,431 (24%)
False discovery rate 3% (117 out of 121
confirmed correct by
sequencing)
9% (20 out of 22
confirmed correct by
sequencing)
Not reported <1% (113 out of 114
confirmed correct by
sequencing)
Platform Custom high-density
oligonucleotide array
(Affymetrix), 25 bp
oligo
cDNA or genomic
tiling array (in house
synthesis)
Illumina sequencing Custom high-density
oligonucleotide array
(Agilent), 50 bp oligo
Prior information
required
EST, 454 or genome
sequence
EST or RAD-tag library
for array synthesis
EST or genome
sequence to map short
sequence reads
EST, 454 or genome
sequence
Polymorphism
identification
Hybridization signal
difference among
study individuals
Hybridization signal
difference between
two study individuals
Custom Perl scripts for
sequence alignment
Genotype clusters
across all study
individuals
Individual genotype
data
No No No Yes
Organisms studied Yeast, Arabidopsis,
Anopheles, several
seed plants
a
Drosophila,
stickleback, zebrafish,
Neurospora
Neurospora Purple sea urchin
Numbers are from studies that describe each method: SFP [26]; RAD tagging [25]; RAD sequencing [50].
a
See Gupta et al. [23] for review of
high-throughput applications in crop plants.
Pespeni et al. Genome Biology 2010, 11:R44
/>Page 10 of 14
degree of genetic diversity in purple sea urchins (approxi-
mately 4% in single copy genes [49]) may have dramati-
cally reduced the proportion of polymorphic RSTA tiles
detected in sections of the genome that have multiple
substitutions, largely because such areas may not hybrid-
ize well. Thus, in species with less genetic diversity, it
could be possible to identify an equal or greater propor-
tion of polymorphisms as were observed in this study,
depending on the polymorphism rate in the species and
the number of individuals sampled in the study.
The absence of ascertainment bias in RSTA is a major
advantage in SNP determination compared to targeted
SNP genotyping. RSTA also has the ability to identify rare
polymorphisms; the Mclust clustering algorithm defines
the number of clusters that best describe the data regard-
less of the number of data points in each cluster. How-
ever, RSTA does not identify all polymorphisms in a gene,
and there are many SNPs that remain undetected using
this method.
In species without a complete genome sequence, noise
could be added to the data by failure to exclude probes
that match multiple places in the genome. We excluded
approximately 19% of probes due to redundancy when
RSTA features were compared back to coding regions.
This fraction of redundant probes could also be excluded
if using a 454 transcriptome sequence that has a good
breadth of gene coverage.
Differences in gene frequencies between two sea urchin
populations suggest that S. purpuratus is mildly differen-
tiated along the US west coast, just as it is along the coast
of Baja Mexico [70]. Previous assays of population struc-
ture were derived from relatively few mitochondrial
DNA, allozyme or microsatellite loci [43,44,71], and
reported no population differentiation except for the
southern end of the species range [44,70], or between age
classes at one locus [71]. In the present study, population
structure is indicated by F
ST
values that are higher than
expected, from a greater fraction of homozygous uncut
genotypes in Oregon than in California, and a higher
heterozygosity in the southern end of the species range.
In addition, several loci appear more differentiated than
expected under neutral evolution, a result that might be
due to natural selection on these loci. Selection on single
loci has been inferred in other marine species living
across environmental gradients with allozymes [72,73] or
through outlier F
ST
analyses [74]. Conclusions about
selection from our data are preliminary due to the poten-
tial impact of mild population structure on the distribu-
tion of F
ST
among loci. However, the outlier loci and
highest F
ST
loci play roles in biological processes that we
would predict to be important for local adaptation in this
species: immunity, transcriptional regulation, environ-
mental response, and reproduction and development.
Conclusions
We have presented a new genome scanning technique
that allows the discovery of polymorphic loci and returns
quantitative genotype data at tens of thousands of mark-
ers. The approach requires genome or transcriptome
sequence data from one individual, though is free from
ascertainment bias as polymorphisms are discovered
without any prior knowledge by screening all individuals
studied. Genotype data can be paired with locus position
information to map disease-related or adaptive pheno-
type-related traits to specific genomic regions or paired
with coalescent simulations to identify divergent (F
ST
)
outlier loci. This approach, and others like it that generate
data on genome-wide distributions of polymorphisms,
promises to aid in the identification of ecologically rele-
vant genes and traits in both model and non-model
organisms. Such high-throughput genotype data will
allow a much greater understanding of the role of envi-
ronmental variation in shaping genetic diversity patterns
and help reveal the genetic basis of adaptive evolution in
natural populations.
Materials and methods
RSTA array design
We designed 50-bp oligonucleotide tiles by screening the
published purple sea urchin genome sequence [46] for
TaqαI restriction enzyme cut sites (TCGA). We centered
tiles on TaqαI cut sites and screened for uniqueness and
complexity using BLASTN (NCBI), comparing tiles to
the full genome sequence to reduce cross-reactivity. We
excluded tiles with more than one hit greater than 90%
sequence similarity. Across the genome, we included
50,935 TaqαI cut sites: 27,128 in protein coding regions,
9,418 within 1,000 bases upstream of genes, and 14,389 in
intergenic 'non-coding' regions. The average inter-marker
distance was 15.7 kb across the 800 Mb purple urchin
genome. We designed control tiles to non-cut sites
(TTGA, n = 10,523), ribosomal DNA (positive control for
hybridization efficiency, n = 100), and randomly gener-
ated tiles that did not match anywhere in the genome
according to BLASTN results (negative control for back-
ground signal and cross-reactivity, n = 1,036). We also
designed a degradation series of tiles in which we ran-
domly changed 1 to 10 bases of a 50-bp tile that matched
only one place in the genome (based on BLASTN). We
did this for 100 unique tiles, resulting in 1,100 tiles. We
used these tiles to estimate the effect of mutational differ-
ences between sample DNA and the published genome
sequence from which tiles were designed. Tile design was
done using MATLAB (2007a, The MathWorks, Natick,
MA, USA). All tiles were synthesized in triplicate in situ
on a 244K-feature high-density custom commercial
microarray (Agilent-015554) by Agilent Technologies
(Santa Clara, CA, USA). Agilent array probe length is
Pespeni et al. Genome Biology 2010, 11:R44
/>Page 11 of 14
typically 60 bp; 10 'T' nucleotides were first synthesized
onto the glass slide before each probe sequence. All raw
data files and array platform descriptions have been
deposited in NCBI's Gene Expression Omnibus and are
accessible through GEO Series accession number [GEO:
GSE20857]. Tile names, sequences, and a detailed
description of how the characters in the tile name reflect
the tile type, position in the genome and gene number are
accessible through GEO accession number [GEO:
GPL10171].
DNA processing
We extracted genomic DNA from tube foot tissue using
Nucleospin columns following the manufacturer's
instructions (Macherey-Nagel, Bethlehem, PA, USA). We
randomly sheared 10 μg of DNA per individual, as quan-
tified by NanoDrop (ThermoScientific, Waltham, MA,
USA), by sonication (Branson Cell Sonifier, Danbury, CT,
USA) for 10 seconds at output control level 3 in a 600 μl
volume, followed by ethanol precipitation. Note that
although we used 10 μg of DNA as this was readily avail-
able in this species, this amount is not required. Based on
our experience and Agilent protocols, 250 ng to 1.5 μg are
recommended depending on the size of the array used, 60
thousand to 1 million features per array, respectively. We
confirmed shearing and DNA recovery on agarose gels
(fragment size ranged from 1,000 to 100 bp) and Nano-
Drop quantification, respectively. We then divided DNA
from an individual into two samples of 5 μg each. We
treated one sample with a total of 10 units TaqαI restric-
tion enzyme (New England Biolabs, Ipswitch, MA, USA)
for 18 hours at 65°C; we then added another 5 units of
enzyme for 6 hours. We carried out restriction digestion
in 2.5 μg batches in 25 μl reaction volumes using New
England Biolabs buffers; we found these conditions
important to ensure complete digestion. We heat inacti-
vated the restriction enzyme by incubation at 80°C for 15
minutes. We treated control DNA in the same buffer and
temperature conditions, but without the restriction
enzyme. We confirmed complete digestion by failure of
PCR amplification for an exon with a known TaqαI cut
site compared to successful amplification of uncut DNA.
We ethanol precipitated DNA before entering labeling
reactions. We internally labeled DNA using random octo-
mers and polymerase to incorporate Cy3 (or Cy5) labeled
dCTPs (Invitrogen BioPrime labeling and purification kit
(Carlsbad, CA, USA), Amersham Cy-dyes (GE Health-
care, Little Chalfont, Buckinghamshire, UK). We labeled
non-digested DNA with Cy5-dCTP; we labeled digested
DNA with Cy3-dCTP. Labeling efficiency, or specific
activity (calculated as picomoles dye per microgram DNA
and measured using NanoDrop), was between 80 and 100
pmol dye per microgram DNA for all samples, above the
minimum recommended 50 pmol/μg. We carried out
ethanol precipitation after sonication and after restric-
tion digestion by adding 1:20 (volume:volume) 3 M
sodium acetate and 125 mM EDTA each, then 3:1 (vol-
ume:volume) ice cold high-grade 100% ethanol. We
quickly vortexed samples then incubated them at -20°C
for 15 minutes then spun them at 14,000 g for 30 minutes
at 2 to 4°C (TOMY centrifuge, TX-160, Fremont, CA,
USA). We found this procedure to yield 95 to 100% DNA
recovery based on NanoDrop quantification.
Microarray processing
We competitively hybridized equal amounts of digested
(Cy3-labeled) and non-digested (Cy5-labeled) DNA from
an individual to our custom microarray for 40 hours at
65°C, rotating at 20 rpm, following the Agilent protocol
for aCGH arrays. Arrays were scanned using a GenePix
4000B scanner (Axon, Molecular Devices, Silicon Valley,
CA, USA) set at 5 μm/pixel resolution. We dynamically
set PMT gains for 650 (Cy5) and 550 (Cy3) wavelengths
for each array such that the overall slide count ratio
equaled one. In microarray scanners, the PMT (photo-
multiplier tube) converts photons into electrical signal,
which is then digitized. Note that PMT gains for 650 and
550 wavelengths could be set such that the count ratio
equaled one for a subset of tiles on the array, particularly
control tiles that are not centered on restriction cut sites
(for example, TTGA centered tiles). This would more
accurately reflect signal intensity for each channel across
the array as equal binding of Cy5 and Cy3 labeled DNA is
expected for such control tiles while reduced Cy3 signal
intensity is expected for restriction cut site centered tiles
(TCGA), the dominant tile type across the array. Though
it does not affect the accuracy of polymorphism detection
or genotyping, setting the overall slide count ratio equal
to one unnecessarily amplifies the Cy3 signal intensity.
We extracted and normalized data from the scanned
microarray image using Agilent Feature Extraction soft-
ware. We used the resulting log ratio data (log2 of the
ratio of Cy5 (non-digested) signal intensity to Cy3
(digested) signal intensity) to identify polymorphisms and
genotype individuals.
SNP identification
To identify polymorphic loci across the population data
set of 20 individuals, we screened for loci with a range in
log ratio greater than 0.7 and more than one cluster
according to a Bayesian hierarchical clustering algorithm,
Mclust [50], implemented in R [75]. We used the average
of triplicate tiles for this and subsequent analyses. We
used Mclust to determine the number of clusters, from
one to four, that best described the log ratio data for all 20
individuals for each locus. We allowed four clusters
rather than three as the maximum because the algorithm
better assigns three clusters if a fourth is an option [50].
Pespeni et al. Genome Biology 2010, 11:R44
/>Page 12 of 14
We used a one-dimensional model, parameterization
identifier 'VII', with log ratio as input data. Data with one
cluster were considered monomorphic. The combined
criteria of clusters and log ratio range resulted in trimodal
data that reflected the three genotypes of homozygous
uncut (low log ratio), heterozygote (intermediate log
ratio), and homozygous cut (high log ratio). Note that the
homozygous uncut genotype did not result in a log ratio
equal to zero (even binding of Cy5 and Cy3) because the
whole array image when scanned was normalized for a
log ratio equal to zero, offsetting the homozygous uncut
genotype to less than zero.
Sequencing
We designed primers using Primer3 [76] and the pub-
lished genome sequence [77] to amplify approximately
200 bp within an exon around each restriction cut site.
We chose primers such that the 3' end of each primer ter-
minated in the second base position of a codon. We per-
formed PCR amplification using a touchdown protocol
for all primer pairs, from 62 to 48°C for 40 cycles. We
sequenced amplified DNA using an ABI3100 sequencer.
Data visualization and analyses
We used MATLAB plotting tools to look at log ratio pat-
terns of the five known polymorphic loci and subsequent
loci identified based on Mclust. We used MATLAB func-
tions to perform Kolmogorov-Smirnov tests and correla-
tion statistics. We wrote programs to calculate
heterozygosity, F
ST
, and Hardy-Weinberg equilibrium,
and to permute the data to simulate panmixia in MAT-
LAB. We used the princomp function in R to perform
PCA with loci as rows and samples as columns. We cor-
rected for multiple tests using the Benjamini-Hochberg
method [78] and Fisher's combined probability test [79].
Additional material
Abbreviations
bp: base pair; EST: expressed sequence tag; GABA: gamma-aminobutyric acid;
NCBI: National Center for Biotechnology Information; PCA: Principal Compo-
nents Analysis; RAD: restriction-site-associated DNA; RSTA: Restriction Site Til-
ing Analysis; SFP: single feature polymorphism; SNP: single nucleotide
polymorphism.
Authors' contributions
MHP and SRP conceived of the study, MHP developed technical aspects of the
method, performed experiments, and performed data analysis with assistance
from SRP. TAO designed tile sequences and contributed intellectually to the
development of the method. MKM performed gene expression studies. MHP
and SRP wrote the manuscript, with contributions from all authors.
Acknowledgements
This work was supported by NSF SGER-0714997 (SRP), NSF Graduate Research
Fellowship (MHP), and the Partnership for Interdisciplinary Studies of Coastal
Oceans (PISCO). We thank D Garfield, E Jacobs-Palmer, B Lockwood, M Pinsky, C
Tepolt, D Hirschberg, and G Nestorova for technical and computing help. We
also thank M Samanta and V Stolc for helpful discussions early in the develop-
ment of the array design and A Sivasundar and V Vacquier for assistance with
sample collections. We also thank two anonymous reviewers for their valuable
comments on this paper.
Author Details
1
Department of Biology, Stanford University, Hopkins Marine Station,
Oceanview Blvd Pacific Grove, CA 93950, USA and
2
Current address:
Department of Biology, 107 Life Sciences Complex, Syracuse University,
Syracuse, NY 13244, USA
References
1. Dobzhansky T: Genetics and the Origin of Species New York, NY: Columbia
University Press; 1937.
2. Black WC, Baer CF, Antolin MF, DuTeau NM, Berenbaum MR, Carde RT,
Robinson GE: Population genomics: Genome-wide sampling of insect
populations. Annu Rev Entomol 2001, 46:441-469.
3. Luikart G, England PR, Tallmon D, Jordan S, Taberlet P: The power and
promise of population genomics: from genotyping to genome typing.
Nat Rev Genet 2003, 4:981-994.
4. Holderegger R, Herrmann D, Poncet B, Gugerli F, Thuiller W, Taberlet P,
Gielly L, Rioux D, Brodbeck S, Aubert S: Land ahead: using genome scans
to identify molecular markers of adaptive relevance. Plant Ecol Diversity
2008, 1:273-283.
5. Nielsen R, Hellmann I, Hubisz M, Bustamante C, Clark AG: Recent and
ongoing selection in the human genome. Nat Rev Genet 2007,
8:857-868.
6. Storz JF: Using genome scans of DNA polymorphism to infer adaptive
population divergence. Mol Ecol 2005, 14:671-688.
7. Wang DG, Fan JB, Siao CJ, Berno A, Young P, Sapolsky R, Ghandour G,
Perkins N, Winchester E, Spencer J: Large-scale identification, mapping,
and genotyping of single-nucleotide polymorphisms in the human
genome. Science 1998, 280:1077-1082.
8. Akey JM, Zhang G, Zhang K, Jin L, Shriver MD: Interrogating a high-
density SNP map for signatures of natural selection. Genome Res 2002,
12:1805-1814.
9. Bustamante CD, Fledel-Alon A, Williamson S, Nielsen R, Hubisz MT,
Glanowski S, Tanenbaum DM, White TJ, Sninsky JJ, Hernandez RD, Civello
D, Adams MD, Cargill M, Clark AG: Natural selection on protein-coding
genes in the human genome. Nature 2005, 437:1153-1157.
10. Liti G, Carter DM, Moses AM, Warringer J, Parts L, James SA, Davey RP,
Roberts IN, Burt A, Koufopanou V, Tsai IJ, Bergman CM, Bensasson D,
O'Kelly MJT, van Oudenaarden A, Barton DBH, Bailes E, Ba ANN, Jones M,
Quail MA, Goodhead I, Sims S, Smith F, Blomberg A, Durbin R, Louis EJ:
Population genomics of domestic and wild yeasts. Nature 2009,
458:337-341.
11. Sutter NB, Bustamante CD, Chase K, Gray MM, Zhao K, Zhu L,
Padhukasahasram B, Karlins E, Davis S, Jones PG: A single IGF1 allele is a
major determinant of small size in dogs. Science 2007, 316:112-115.
12. Volkman SK, Sabeti PC, DeCaprio D, Neafsey D, Schaffner S, Derr A, Milner
D, Stange-Thomann N, Shamovsky O, Onofrio R, Richter DJ, Waggoner S,
Mauceli E, Gnerre S, Zainoun J, Daily JP, Sarr O, Mboup S, Wiegand R, Hartl
DL, Jaffe D, Birren B, Galagan JE, Lander E, Wirth DF: Genome-wide
diversity map of Plasmodium falciparum. Am J Tropical Med Hygiene
2006, 75:95.
13. Begun DJ, Holloway AK, Stevens K, Hillier LW, Poh Y-P, Hahn MW, Nista PM,
Jones CD, Kern AD, Dewey CN, Pachter L, Myers E, Langley CH: Population
genomics: whole-genome analysis of polymorphism and divergence
in Drosophila simulans. PLoS Biol 2007, 5:e310.
14. Cork JM, Purugganan MD: High-diversity genes in the Arabidopsis
genome. Genetics 2005, 170:1897-1911.
Additional file 1: Table of the top 100 highest F
ST
loci. The table
includes five columns of information: gene number (GLEAN3), gene anno-
tation, RSTA array tile name, RSTA array tile oligonucleotide sequence, and
F
ST
value.
Received: 2 February 2010 Revised: 7 April 2010
Accepted: 19 April 2010 Published: 19 April 2010
This article is available from: 2010 Pespeni et al.; licensee BioMed Central Ltd. This is an open access article distributed under the terms of the Creative Commons A ttribution License ( which permits unrestricted use, distribution, and reproduction in any medium, provided the original work is properly cited.Genome Biology 2010, 11:R44
Pespeni et al. Genome Biology 2010, 11:R44
/>Page 13 of 14
15. Kuhner MK, Beerli P, Yamato J, Felsenstein J: Usefulness of single
nucleotide polymorphism data for estimating population parameters.
Genetics 2000, 156:439-447.
16. Nielsen R, Signorovitch J: Correcting for ascertainment biases when
analyzing SNP data: applications to the estimation of linkage
disequilibrium. Theor Popul Biol 2003, 63:245-255.
17. Wilding CS, Butlin RK, Grahame J: Differential gene exchange between
parapatric morphs of Littorina saxatilis detected using AFLP markers. J
Evol Biol 2001, 14:611-619.
18. Campbell D, Bernatchez L: Generic scan using AFLP markers as a means
to assess the role of directional selection in the divergence of
sympatric whitefish ecotypes. Mol Biol Evol 2004, 21:945-956.
19. Vasemagi A, Nilsson J, Primmer CR: Expressed sequence tag-linked
microsatellites as a source of gene-associated polymorphisms for
detecting signatures of divergent selection in Atlantic salmon (Salmo
salar L.). Mol Biol Evol 2005, 22:1067-1076.
20. Bonin A, Taberlet P, Miaud C, Pompanon F: Explorative genome scan to
detect candidate loci for adaptation along a gradient of altitude in the
common frog (Rana temporaria). Mol Biol Evol 2006, 23:773-783.
21. Jump AS, Hunt JM, Martinez-Izquierdo JA, Penuelas J: Natural selection
and climate change: temperature-linked spatial and temporal trends in
gene frequency in Fagus sylvatica. Mol Ecol 2006, 15:3469-3480.
22. Stinchcombe JR, Hoekstra HE: Combining population genomics and
quantitative genetics: finding the genes underlying ecologically
important traits. Heredity 2007, 100:158-170.
23. Gupta PK, Rustgi S, Mir RR: Array-based high-throughput DNA markers
for crop improvement. Heredity 2008, 101:5-18.
24. Winzeler EA, Richards DR, Conway AR, Goldstein AL, Kalman S,
McCullough MJ, McCusker JH, Stevens DA, Wodicka L, Lockhart DJ: Direct
allelic variation scanning of the yeast genome. Science 1998,
281:1194-1197.
25. Miller MR, Dunham JP, Amores A, Cresko WA, Johnson EA: Rapid and
cost-effective polymorphism identification and genotyping using
restriction site associated DNA (RAD) markers. Genome Res 2007,
17:240-248.
26. Borevitz JO, Liang D, Plouffe D, Chang HS, Zhu T, Weigel D, Berry CC,
Winzeler E, Chory J: Large-scale identification of single-feature
polymorphisms in complex genomes. Genome Res 2003, 13:513-523.
27. Winzeler EA, Castillo-Davis CI, Oshiro G, Liang D, Richards DR, Zhou Y, Hartl
DL: Genetic diversity in yeast assessed with whole-genome
oligonucleotide arrays. Genetics 2003, 163:79-89.
28. Miller MR, Atwood TS, Eames BF, Eberhart JK, Yan YL, Postlethwait JH,
Johnson E: RAD marker microarrays enable rapid mapping of zebrafish
mutations. Genome Biol 2007, 8:R105.
29. Lewis ZA, Shiver AL, Stiffler N, Miller MR, Johnson EA, Selker EU: High-
density detection of restriction-site-associated DNA markers for rapid
mapping of mutated loci in Neurospora. Genetics 2007, 177:1163.
30. Baird NA, Etter PD, Atwood TS, Currey MC, Shiver AL, Lewis ZA, Selker EU,
Cresko WA, Johnson EA: Rapid SNP discovery and genetic mapping
using sequenced RAD markers. PLoS ONE 2008, 3:e3376.
31. Dettman JR, Anderson JB, Kohn LM: Genome-wide investigation of
reproductive isolation in experimental lineages and natural species of
Neurospora : identifying candidate regions by microarray-based
genotyping and mapping. Evolution 2009, 64:694-709.
32. Turner TL, Hahn MW, Nuzhdin SV: Genomic islands of speciation in
Anopheles gambiae. PLoS Biol 2005, 3:e285.
33. Wang S, Zhang L, Meyer E, Matz M: Construction of a high-resolution
genetic linkage map and comparative genome analysis for the reef-
building coral Acropora millepora. Genome Biol 2009, 10:R126.
34. Wheat CW: Rapidly developing functional genomics in ecological
model systems via 454 transcriptome sequencing. Genetica 2010,
138:433-451.
35. Vera JC, Wheat CW, Fescemyer HW, Frilander MJ, Crawford DL, Hanski I,
Marden JH: Rapid transcriptome characterization for a nonmodel
organism using 454 pyrosequencing. Mol Ecol 2008, 17:1636-1647.
36. Meyer M, Stenzel U, Hofreiter M: Parallel tagged sequencing on the 454
platform. Nat Protoc 2008, 3:267-278.
37. Lupski JR, Reid JG, Gonzaga-Jauregui C, Rio Deiros D, Chen DCY, Nazareth
L, Bainbridge M, Dinh H, Jing C, Wheeler DA: Whole-genome sequencing
in a patient with Charcot-Marie-Tooth neuropathy. New Engl J Med
2010, 362:1181-1191.
38. Roach JC, Glusman G, Smit AFA, Huff CD, Hubley R, Shannon PT, Rowen L,
Pant KP, Goodman N, Bamshad M, Shendure J, Drmanac R, Jorde LB, Hood
L, Galas DJ: Analysis of genetic inheritance in a family quartet by whole-
genome sequencing. Science 2010 in press.
39. Mardis ER: The impact of next-generation sequencing technology on
genetics. Trends Genet 2008, 24:133-141.
40. Schultz H: Sea-urchins, a Guide to Worldwide Shallow Water Species
Germany: Heinke & Peter Schultz Partner Scientific Publications; 2005.
41. Strathmann R: Length of pelagic period in echinoderms with feeding
larvae from the Northeast Pacific. J Exp Marine Biol Ecol 1978, 34:23-28.
42. Strathmann MF: Phylum Echinodermata, Class Echinoidea. In
Reproduction and Development of Marine Invertebrates of the Northern
Pacific Coast: Data and Methods for the Study of Eggs, Embryos, and Larvae
Seattle, WA: University of Washington Press; 1987:511-534.
43. Palumbi SR, Wilson AC: Mitochondrial DNA diversity in the sea urchins
Strongylocentrotus purpuratus and S. droebachiensis. Evolution 1990,
44:403-415.
44. Edmands S, Moberg PE, Burton RS: Allozyme and mitochondrial DNA
evidence of population subdivision in the purple sea urchin
Strongylocentrotus purpuratus. Marine Biol 1996, 126:443-450.
45. Ebert TA, Russell MP: Latitudinal variation in size structure of the west
coast purple sea urchin: a correlation with headlands. Limnol
Oceanography 1988, 33:286-294.
46. Sea Urchin Genome Sequencing C, Sodergren E, Weinstock GM, Davidson
EH, Cameron RA, Gibbs RA, Angerer RC, Angerer LM, Arnone MI, Burgess
DR, Burke RD, Coffman JA, Dean M, Elphick MR, Ettensohn CA, Foltz KR,
Hamdoun A, Hynes RO, Klein WH, Marzluff W, McClay DR, Morris RL,
Mushegian A, Rast JP, Smith LC, Thorndyke MC, Vacquier VD, Wessel GM,
Wray G, Zhang L, et al.: The genome of the sea urchin Strongylocentrotus
purpuratus. Science 2006, 314:941-952.
47. Pearse JS: Ecological role of purple sea urchins. Science 2006, 314:940.
48. Rogers-Bennett L: The ecology of Strongylocentrotus franciscanus and
Strongylocentrotus purpuratus. Edible Sea Urchins Biol Ecol 2007:393-425.
49. Britten RJ, Cetta A, Davidson EH: The single-copy DNA sequence
polymorphism of the sea urchin Strongylocentrotus purpuratus. Cell
1978, 15:1175-1186.
50. Fraley C, Raftery AE: Enhanced model-based clustering, density
estimation, and discriminant analysis software: MCLUST. J Classification
2003, 20:263-286.
51. Wares JP, Gaines SD, Cunningham CW: A comparative study of
asymmetric migration events across a marine biogeographic
boundary. Evolution 2001, 55:295-306.
52. Wright S: Isolation by distance. Genetics 1943, 28:114-138.
53. Raymond M, Rousset F: GENEPOP: population genetics software for
exact tests and ecumenicism. J Heredity 1995, 86:248-249.
54. Antao T, Lopes A, Lopes RJ, Beja-Pereira A, Luikart G: LOSITAN: A
workbench to detect molecular adaptation based on a Fst-outlier
method. BMC Bioinformatics 2008, 9:323.
55. Beaumont MA, Balding DJ: Identifying adaptive genetic divergence
among populations from genome scans. Mol Ecol 2004, 13:969-980.
56. Foll M, Gaggiotti O: A genome-scan method to identify selected loci
appropriate for both dominant and codominant markers: a Bayesian
perspective. Genetics 2008, 180:977-993.
57. East L, Isacke CM: The mannose receptor family. BBA-General Subjects
2002, 1572:364-386.
58. Sutherland AM, Walley KR, Russell JA: Polymorphisms in CD14, mannose-
binding lectin, and Toll-like receptor-2 are associated with increased
prevalence of infection in critically ill adults*. Crit Care Med 2005,
33:638.
59. Christensen EI, Birn H: Megalin and cubilin: multifunctional endocytic
receptors. Nat Rev Mol Cell Biol 2002, 3:258-268.
60. Banu Y, Matsuda M, Yoshihara M, Kondo M, Sutou S, Matsukuma S: Golgi
matrix protein gene, Golga3/Mea2, rearranged and re-expressed in
pachytene spermatocytes restores spermatogenesis in the mouse. Mol
Reprod Dev 2002, 61:288-301.
61. Schlenke TA, Begun DJ: Natural selection drives Drosophila immune
system evolution. Genetics 2003, 164:1471.
62. Wray GA, Hahn MW, Abouheif E, Balhoff JP, Pizer M, Rockman MV, Romano
LA: The evolution of transcriptional regulation in eukaryotes. Mol Biol
Evol 2003, 20:1377-1419.
Pespeni et al. Genome Biology 2010, 11:R44
/>Page 14 of 14
63. Mah SA, Swanson WJ, Vacquier VD: Positive selection in the
carbohydrate recognition domains of sea urchin sperm receptor for
egg jelly (suREJ) proteins. Mol Biol Evol 2005, 22:533-541.
64. Loker ES, Adema CM, Zhang SM, Kepler TB: Invertebrate immune
systems-not homogeneous, not simple, not well understood. Immunol
Rev 2004, 198:10.
65. Rast JP, Smith LC, Loza-Coll M, Hibino T, Litman GW: Genomic insights
into the immune system of the sea urchin. Science 2006, 314:952-956.
66. Snyder MJ: Cytochrome P450 enzymes belonging to the CYP4 family
from marine invertebrates. Biochem Biophys Res Commun 1998,
249:187-190.
67. Goldstone JV, Hamdoun A, Cole BJ, Howard-Ashby M, Nebert DW, Scally
M, Dean M, Epel D, Hahn ME, Stegeman JJ: The chemical defensome:
environmental sensing and response genes in the Strongylocentrotus
purpuratus genome. Dev Biol 2006, 300:366-384.
68. Morse DE, Hooker N, Duncan H, Jensen L: Gamma-aminobutyric acid, a
neurotransmitter, induces planktonic abalone larvae to settle and
begin metamorphosis. Science 1979, 204:407-410.
69. Wheeler DA, Srinivasan M, Egholm M, Shen Y, Chen L, McGuire A, He W,
Chen YJ, Makhijani V, Roth GT: The complete genome of an individual by
massively parallel DNA sequencing. Nature 2008, 452:872-876.
70. Olivares-Banuelos NC, Enriquez-Paredes LM, Ladah LB, De La Rosa-Velez J:
Population structure of purple sea urchin Strongylocentrotus
purpuratus along the Baja California peninsula. Fisheries Sci 2008,
74:804-812.
71. Flowers JM, Schroeter SC, Burton RS: The recruitment sweepstakes has
many winners: genetic evidence from the sea urchin
Strongylocentrotus purpuratus. Evolution 2002, 56:1445-1453.
72. Schmidt PS, Rand DM: Adaptive maintenance of genetic polymorphism
in an intertidal barnacle: habitat-and life-stage-specific survivorship of
MPI genotypes. Evolution 2001, 55:1336-1344.
73. Koehn RK, Newell RIE, Immermann F: Maintenance of an
aminopeptidase allele frequency cline by natural selection. Proc Natl
Acad Sci USA 1980, 77:5385-5389.
74. Gaggiotti OE, Bekkevold D, Jorgensen HBH, Foll M, Carvalho GR, Andre C,
Ruzzante DE: Disentangling the effects of evolutionary, demographic,
and environmental factors influencing genetic structure of natural
populations: Atlantic herring as a case study. Evolution 2009,
63:2939-2951.
75. Team RDC: R: A Language and Environment for Statistical Computing
Vienna, Austria: Foundation for Statistical Computing; 2009.
76. Rozen S, Skaletsky H: Primer3 on the WWW for general users and for
biologist programmers. Methods Mol Biol 2000, 132:365-386.
77. Genboree. [ />index.jsp?isPublic=Yes]
78. Benjamini Y, Hochberg Y: Controlling the false discovery rate: a practical
and powerful approach to multiple testing. J Roy Stat Soc Series B
(Methodological) 1995, 51:289-300.
79. Fisher RA: Combining independent tests of significance. Am Stat 1948,
2:30.
doi: 10.1186/gb-2010-11-4-r44
Cite this article as: Pespeni et al., Restriction Site Tiling Analysis: accurate dis-
covery and quantitative genotyping of genome-wide polymorphisms using
nucleotide arrays Genome Biology 2010, 11:R44