Báo cáo y học: "Nucleosome rotational setting is associated with transcriptional regulation in promoters of tissue-specific human genes" pot
Bạn đang xem bản rút gọn của tài liệu. Xem và tải ngay bản đầy đủ của tài liệu tại đây (3.51 MB, 13 trang )
Hebert and Roest Crollius Genome Biology 2010, 11:R51
/>Open Access
RESEARCH
BioMed Central
© 2010 Hebert and Roest Crollius; licensee BioMed Central Ltd. This is an open access article distributed under the terms of the Creative
Commons Attribution License ( which permits unrestricted use, distribution, and repro-
duction in any medium, provided the original work is properly cited.
Research
Nucleosome rotational setting is associated with
transcriptional regulation in promoters of
tissue-specific human genes
Charles Hebert and Hugues Roest Crollius*
Nucleosome rotationHuman genes contain a 10 bp repeat of RR dinucleotides focused around the first nucleosome position suggesting a role in tran-scriptional control.
Abstract
Background: The position of a nucleosome, both translational along the DNA molecule and rotational between the
histone core and the DNA, is controlled by many factors, including the regular occurrence of specific dinucleotides
with a period of approximately 10 bp, important for the rotational setting of the DNA around the histone octamer.
Results: We show that such a 10 bp periodic signal of purine-purine dinucleotides occurs in phase with the
transcription start site (TSS) of human genes and is centered on the position of the first (+1) nucleosome downstream
of the TSS. These data support a direct link between transcription and the rotational setting of the nucleosome. The
periodic signal is most prevalent in genes that contain CpG islands that are expressed at low levels in a tissue-specific
manner and are involved in the control of transcription.
Conclusions: These results, together with several lines of evidence from the recent literature, support a new model
whereby the +1 nucleosome could be more efficiently disassembled from gene promoters by H3K56 acetylation marks
if the periodic signal specifies an optimal rotational setting.
Background
Nucleosomes, composed of 147 bp of DNA wrapped
around a histone octamer, play a fundamental role of
compacting DNA molecules inside the nucleus of eukary-
otic cells [1], but also in the regulation of gene expression
[2,3]. Elucidating the molecular mechanisms that specify
the position of nucleosomes in a genome is important to
understand their role at the crossroads of essential cellu-
lar functions.
Factors influencing nucleosome positioning likely
include DNA sequence-based information (either to
specify a favorable or unfavorable DNA structure or to
allow for DNA-histone interactions), contacts between
neighboring nucleosomes, and chromatin remodeling
proteins. The extent and the modalities of these contribu-
tions are still being investigated, and different models
have been proposed to explain whole genome
nucleosome mapping data in different organisms [4-7].
These results, while primarily focusing on the transla-
tional positions of nucleosomes along the DNA molecule,
also show that the rotational position of the histone
octamer with respect to the DNA molecule is important.
High-resolution maps indicate that individual
nucleosomes tend to settle at approximately 10-bp inter-
vals around an average position in the genome [4,6,8].
Histone cores, when forming a nucleosome with the
DNA, thus appear to locally select one of several alterna-
tive positions on the DNA, as long as they are separated
by distances multiple of a helical turn. Importantly,
selecting one position rather than the next will translate
the nucleosome by 10 bp, but will not change the rota-
tional angle of the histone core with respect to the DNA
molecule and its molecular environment. To wedge his-
tones in their preferred rotational setting, the main theo-
retic constraint is a periodic occurrence of specific
dinucleotides at approximately 10-bp intervals in phase
with nucleosome positions [9-11]. This signal is signifi-
cantly different between species. In yeast, it has been
* Correspondence:
Dyogen Group, Institut de Biologie de l'Ecole Normale Supérieure (IBENS), 46
rue d'Ulm, CNRS UMR8197, INSERM U1024, 75005 Paris Cedex 05, France
Full list of author information is available at the end of the article
Hebert and Roest Crollius Genome Biology 2010, 11:R51
/>Page 2 of 13
characterized as periodic frequencies of dinucleotides
containing only adenine and/or thymidine (WW dinucle-
otides), with antiphased periodic frequencies of dinucle-
otides containing cytidines and/or guanines (SS
dinucleotides) [12]. In mammalian genomes, the most
consistent 10-bp periodic signal is composed of periodic
purine dinucleotides (A or G, abbreviated RR), with anti-
phased pyrimidine dinucleotide frequencies (C or T,
abbreviated YY) [13-16], although other combinations of
di- and trinucleotides have also been observed [17,18].
In yeast, high resolution mapping of nucleosomes con-
taining the H2A.Z histone variant, which is typically
found in nucleosomes flanking the transcription start site
(TSS) of genes [19,20], led to a model where this rota-
tional setting could be important to present the histone
H3 tail in a favorable position at the promoter, or to
expose transcription factor binding sites at the
nucleosome surface [4]. In the human genome, a high-
resolution map of H2A.Z nucleosomes recently led to the
conclusion that, in contrast to the yeast genome, a pro-
nounced 10-bp periodicity of specific dinucleotides is
absent [8] near the TSS. Here we examine sequences
flanking human TSSs, and we find that a 10-bp periodic-
ity of the same magnitude as that seen in yeast, but of RR
rather than WW dinucleotides, does coincide with the
first nucleosome after the TSS (+1 nucleosome). Impor-
tantly, the signal is specifically in phase with the TSS, sug-
gesting a direct link between transcription and the +1
nucleosome. We analyze the periodic signal with respect
to CpG island density, gene expression level and breadth,
gene functional annotations, and histone modification
marks. We conclude that the periodic signal is likely to
play a role in setting the rotational angle of the histone
core in the +1 nucleosome, and we propose a model
where nucleosome interacting proteins, such as the
EP300 histone acetylase, may efficiently trigger histone
disassembly prior to RNA polymerase II (RNA pol II)
elongation if the rotational setting of the nucleosome is
optimal.
Results
A periodic dinucleotide frequency in phase with the TSS
coincides with +1 nucleosomes
Approximately 30,000 human TSSs have previously been
identified experimentally by oligo-capped cDNA
sequencing [21]. From these, we selected a subset of
13,622 well-supported and non-overlapping TSSs (see
Materials and methods) and aligned them at the position
of the first transcribed base. The average nucleotide com-
position profile displays the characteristic pattern of
human promoters, with a progressive increase in GC
content around the TSS due to the concentration of CpG
islands, and two sharp peaks of TA and YR nucleotide
bases at positions [-32:-27] and [-1:+1] due, respectively,
to the TATA box and the initiator sequence (Figure 1a).
Notably, the frequency of C versus G decreases after the
TSS, while the frequency of T versus A increases, as pre-
viously described in the context of transcriptionally
induced mutational biases [22].
After the TSS, the frequencies of both G and C remain
elevated for approximately 200 bases, thus forming a pla-
teau, before slowly decreasing. Closer examination of the
nucleotide composition across the plateau reveals a strik-
ing pattern of oscillating frequencies of all four nucle-
otides, with A and G in phase, and C and T shifted by 5
bp in counter phase (Figure S1A in Additional file 1). The
period of the regular pattern is approximately 10 bases
and the purine nucleotide peaks are separated from the
TSS by a distance multiple of 10 bases, thus residing on
the same side of the DNA double helix as the TSS. To bet-
ter characterize the signal, we analyzed the period of the
16 possible dinucleotide frequencies using discrete Fou-
rier transform (DFT; Figure S1B in Additional file 1; see
Materials and methods) and found that mainly purine-
purine (RR) and pyrimidine-pyrimidine (YY) dinucle-
otides contribute to the periodic signal (Figure 1a, inset)
in phase and counter-phase, respectively, with the TSS.
Randomly shifting the sequences by 1 to 9 bases relative
to the TSS completely abolishes the signal (average power
spectral density (PSD) magnitude at 10 bp = 0.015; P-
value = 2.2 × 10
-16
, Wilcoxon rank sum test).
If this signal is linked to nucleosome positioning, it
should coincide with experimentally defined nucleosome
positions from genome-wide mapping efforts. To verify
this, we realigned the sequence tags from a recent ChIP-
seq experiment aiming at defining the positions of all
nucleosomes in human CD4+ cell lines [23], and we
focused on the region immediately downstream of the
TSS positions used in our study. Remarkably, the 5' ends
of the sequence tags of the forward and reverse strands
from the ChIP-seq experiment, which define the bound-
aries of the nucleosome-bound DNA, show maximal den-
sities that precisely flank the periodic signal (Figure 1b).
Thus, DNA sequences of +1 nucleosomes immediately
downstream of human TSSs display periodic purine-
purine (RR) and pyrimidine-pyrimidine (YY) frequencies.
The periodic signal is correlated with CpG islands
Despite our attempts, the periodic RR and YY signal can-
not be detected in individual sequences beyond those
periodic dinucleotides one would expect by chance alone,
even using standard autocorrelation analysis (data not
shown). This lack of significant periodic dinucleotide pat-
terns in individual human H2A.Z sequences has been
noted previously using autocorrelation analysis, in con-
trast to yeast nucleosomal sequences, where periodic pat-
terns appear readily [8] using these approaches. However,
a more sensitive autocorrelation analysis, called autocor-
Hebert and Roest Crollius Genome Biology 2010, 11:R51
/>Page 3 of 13
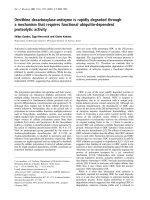
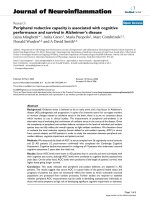
Figure 1 A 10-bp periodic signal is present downstream of human transcription start sites. (a) Average compositional profiles around 13,622
human promoters. A 1,000-bp region on either side of each TSS was extracted from the genome and the 13,622 sequences were aligned at the TSS
(base +1 is the first transcribed base). The average composition at each base-pair position is shown on the y-axis. Inset: average compositional profile
of purine-purine and pyrimidine-pyrimidine dinucleotides between positions +40 and +200. The raw signal is shown in orange and a 3-bp smoothed
distribution is shown in purple (RR) and dark green (YY). (b) DNA sequences of the +1 nucleosome contain the periodic signal. Sequence tags from
nucleosome-bound DNA obtained by a ChIP-seq experiment [23] were remapped to the human genome and their density was smoothed with a
sliding 70-bp window (see Materials and methods). Tags mapped to the forward (magenta) and the reverse (cyan) strand mark the 5' and 3' ends of
nucleosome bound DNA fragments, respectively. Counter-phased RR (purple) and YY (green) dinucleotide frequencies, and base pair coordinates are
as in (a).
60 80 100 120 140 160 180
Genomic Position (bp)
26
27
28
29
30
31
Frequency (%)
RR
YY
-1000 -800 -600 -400 -200 0 200 400 600 800 1000
Genomic Position (bp)
20
30
40
50
Nucleotide Frequency (%)
A
T
C
G
0 50 100 150 200
Genomic Position
26
28
30
32
34
36
Dinucleotide Frequency
RR dinucleotides
YY dinucleotides
0
200
400
600
Sequence Tag Counts
Forward strand
Reverse strand
(a)
(b)
Fr
e
q
uenc
y
Hebert and Roest Crollius Genome Biology 2010, 11:R51
/>Page 4 of 13
relation spectral estimation, recently showed that 10- and
11-bp periodic AA/TT dinucleotide signals exist in
human nucleosomal sequences, while the 11-bp signal is
specific to the regions flanking the TSS [24].
Together, the fact that a periodic signal in the region
following the TSS can only be measured using either sen-
sitive autocorrelation measures on individual sequences
[24] or the average dinucleotide frequencies of a large set
of sequences (this study) suggests that, in contrast to
yeast, the RR/YY dinucleotides in human show only a
weak periodicity at the level of individual sequences. We
thus resolved to use large sets of sequences by partition-
ing the TSSs into classes according to properties conven-
tionally used to describe genes and to examine if the
signal concentrates in a subset of promoters. CpG islands
[25] are featured in a majority of mammalian genes as a
consequence of the hypomethylation of cytosine in CpG
dinucleotides in the germ line. To identify CpG islands in
the 13,622 promoter sequences, we applied a parameter-
ized Gaussian mixture model (see Supporting informa-
tion and Figure S2 in Additional file 1) that has been
shown to be more reliable than using ad hoc length and
frequency thresholds [26]. We found that 9,644 promot-
ers are associated with a CpG island (70.8%) while the
remaining 3,978 promoters (29.2%) show similar levels of
CpG dinucleotides as the rest of the genome. Strikingly,
promoters with CpG islands show a stronger periodic sig-
nal than the complete population of 13,622 promoters,
while those without CpG islands do not show any period-
icity of RR/YY dinucleotides (Figure 2).
In each group of promoters, we performed a DFT anal-
ysis on each of the 16 dinucleotide average frequency
profiles between positions +40 and +190 after the TSS
(Figure S3 in Additional file 1). A differential comparison
between the sets of promoters with and without CpG
islands (Supporting information in Additional file 1)
should identify those dinucleotides that contribute most
to the periodic pattern. Interestingly, in CpG island-con-
taining promoters, GA and AG rank highest among RR
dinucleotides, and their complementary CT and TC rank
highest among YY dinucleotides (Table S1 in Additional
file 1). Notably, dinucleotides AA, TT and TA, which
show strong periodic patterns in yeast nucleosome-
bound DNA [4,12], do not contribute to the periodic pat-
tern seen here in human CpG-containing promoters.
Within promoters with CpG islands, the strength of the
periodic signal is not, however, correlated with the over-
representation of CpG dinucleotides (Supporting infor-
mation in Additional file 1).
The periodic signal is most prevalent in tissue-specific
genes involved in transcription control
Because the periodic pattern is evident only when pro-
moters are aligned to their TSS, properties related to gene
transcription may be correlated with the strength of the
signal. We partitioned the 9,644 TSSs with CpG islands
into two groups with, respectively, low (L
E
) and high (H
E
)
median expression levels in 72 non-cancerous tissues (see
Materials and methods) and measured the distribution of
the magnitude of the 10-bp RR periodicity for each group
(Figure 3a). TSSs associated with lower expression levels
(L
E
group) show significantly stronger periodic signals
than TSSs with high expression values (P-value = 2.2 ×
10
-16
, Wilcoxon rank sum test). When genes are parti-
tioned according to their tissue specificity (see Materials
and methods), genes with high tissue specificity (H
S
)
show a significantly stronger periodic signal than genes
that are more broadly expressed (medium (M
S
) or low
(L
S
) tissue specificity; L
S
or M
S
group versus H
S
group P-
value = 2.2 × 10
-16
, Wilcoxon rank sum test; Figure 3b). In
line with this, genes from the H
S
group also show a
reduced expression level compared to genes of the L
S
or
M
S
group (P-value = 2.0 × 10
-16
, Wilcoxon rank sum test).
Compared with the L
S
group, the H
S
group is also
enriched in Gene Ontology terms associated with DNA-
dependent transcription, and the regulation of transcrip-
tion (Methods and Table S2 in Additional file 1). The
enrichment for DNA-dependent transcription is mainly
due to an excess of genes coding for transcription factors.
Thus, genes with lower expression levels and high tissue
specificity coding for proteins involved in transcription
regulation show a stronger periodic RR and YY dinucle-
otide frequency in phase with their TSS and overlapping
the first nucleosome in the transcribed sequence.
EP300 activity is correlated with increased periodic RR/YY
dinucleotides
Genes coding for tissue-specific transcription factors are
themselves highly regulated, and given their significant
association with a nucleosome rotational positioning sig-
nal, we hypothesized that the control of their transcrip-
tion and information carried by the first nucleosome are
somehow connected. Histone modifications are obvious
candidates for this potential connection. Histones tran-
siently harbor acetylation and methylation marks depos-
ited by chromatin-modifying enzymes recruited by a
diverse array of proteins. One such modifying enzyme is
EP300, which directly associates with the pre-initiation
complex that includes RNA Pol II [27], and also binds
DNA at a known consensus sequence [28]. EP300 is
known to acetylate histones at the following sites: H3K14,
H3K18, H4K5, H4K8, H2AK5, H2BK12, H2BK15 [29]. Of
these seven marks, six were recently part of a genome-
wide mapping of histone modifications in human CD4+
cells [30]. We first tested for the presence of EP300 DNA
binding sites in the 13,622 TSSs studied here, and found
that they are significantly associated with genes where
Hebert and Roest Crollius Genome Biology 2010, 11:R51
/>Page 5 of 13
the first nucleosome carries at least one of the six acetyla-
tion marks (P-value = 3 × 10
-5
, randomization test), in
line with expectations. Second, we also searched for the
EP300 DNA binding site in all 13,622 TSSs independently
of their histone modification status and found that it is
significantly associated with the periodic 10-bp RR fre-
quency signal (P-value = 1 × 10
-3
, randomization test).
Third, the intensity of histone acetylations by EP300 on
the first nucleosome, as measured by the ChIP-seq
sequence tag counts, is also correlated with an increasing
magnitude of the periodic signal (P-value = 2 × 10
-15
,
Pearson correlation test; Figure S4 in Additional file 1).
Most strikingly, this is also verified for an acetylation
mark recently attributed to EP300 on H3K56 [31], in the
globular domain of histone H3. Using recent ChIP-chip
results obtained using H3K56ac in the human genome
[32], we show here that the level of H3K56 acetylation is
correlated with an increased 10-bp periodicity (Figure 3c,
d; low H3K56ac enrichment ratio group versus high
H3K56ac enrichment ratio group P-value = 2.2 × 10
-16
,
one-sided Wilcoxon rank sum test). This evidence
strongly supports the above hypothesis that a histone-
modifying enzyme such as EP300 involved in the first
steps of transcription elongation may require a specific
rotational setting of the first nucleosome to efficiently
carry out its functions (see Discussion).
Conservation of the periodic signal in eukaryotic genomes
The periodic signal observed here appears to be univer-
sally present in eukaryotes, albeit involving different
dinucleotides. The same periodic RR/YY dinucleotide
frequency is seen in human and mouse promoters, but
interestingly the medaka fish Oryzias latipes displays a
strong periodic signal contributed by AA and TT dinu-
cleotides downstream of the TSS, similar to yeast (Figure
S5 in Additional file 1). In yeast, however, the periodic
signal appears shorter and is immediately downstream of
the TSS [33], instead of being shifted to the +40 position
as in vertebrates.
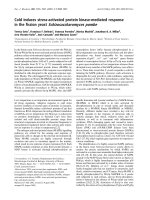
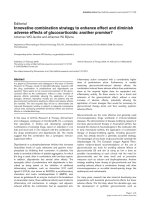
Figure 2 CpG islands separate transcription start sites with and without the 10-bp RR periodic signal. (a, b) The 9,622 TSSs associated with a
CpG island show a clear periodic signal (a) that translates into a strong and specific 10-bp periodic signal after DFT analysis (b). (c, d) In contrast, the
3,978 TSSs without CpG islands do not display an obvious periodic pattern (c), with no associated distinctive signal after DFT analysis (d).
40 60 80 100 120 140 160 180
27
28
29
30
31
32
(a)
40 60 80 100 120 140 160 180
Position from TSS (bp)
27
28
29
30
31
32
RR dinucleotide frequency (%)
(c)
5101520
Period (bp)
0
0.1
0.2
0.3
PSD magnitude
(d)
5 101520
Period (bp)
0
0.1
0.2
0.3
PSD magnitude
(b)
Hebert and Roest Crollius Genome Biology 2010, 11:R51
/>Page 6 of 13
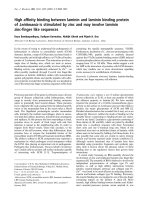
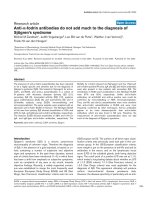
Figure 3 The periodic signal varies with expression level and specificity, and H3K56 acetylation. (a) We divided 4,372 genes into two groups
(low expression (L
E
) and high expression (H
E
)) according to their median expression level across 72 tissues. The boxplots show the distribution of the
magnitude of the 10-bp periodic signal for 5,000 bootstrap iterations on 1,000 randomly selected TSSs in each group (see Materials and methods).
The 10-bp periodic signal is stronger in the low expression group than in the high expression group. (b) The same set of genes were divided into three
groups according to their tissue specificity (low, medium and high tissue specificity) and the same bootstrap analysis was performed. (c) The distribu-
tion of the normalized H3K56ac enrichment (log2 ratio) for the 6,518 TSSs that possess an H3K56ac sequence tag (see Materials and methods) is
shown. The TSSs were divided into three groups of equal size with, respectively, low (L, blue) medium (M, green) and high (H, orange) H3K56ac en-
richment ratios. (d) The three groups of H3K56ac enrichment are associated with different strengths of the periodic RR/YY signal. A randomization test
shows that increased H3K56 acetylation levels is significantly correlated with increased 10-bp periodic signal (Wilcoxon rank sum test, one sided: L
versus M P-value = 2.2 × 10
-16
; M versus H P-value = 3.8 × 10
-07
; L versus H P-value = 2.2 × 10
-16
).
-2
-1 123
0 400 800
0
log2ratio H3K56 acetylation
Number of TSSs
(c)
LMH
0.00 0.10 0.20
H3K56 acetylation
PSD magnitude
(d)
L
E
H
E
0.00 0.05 0.10 0.15 0.20
L
S
M
S
H
S
0.00 0.05 0.10 0.15 0.20
(b)
10 bp PSD magnitude
10 bp PSD magnitude
(a)
Hebert and Roest Crollius Genome Biology 2010, 11:R51
/>Page 7 of 13
Discussion
We describe here a new 10-bp periodic signal present
downstream of human TSSs that is concentrated in genes
that possess CpG islands, that are expressed at low level
in a tissue specific pattern, and that are enriched in func-
tions related to transcription control. Importantly, the
signal is centered over the position of experimentally
mapped nucleosomes. This result contrasts with a recent
study describing the mapping of H2A.Z-containing
nucleosomes in the human genome, which concluded
that such a periodic signal is essentially absent in human
promoters, whereas it had been previously observed in
yeast [8]. However, this former study aligned promoters
on the predicted +1 nucleosome dyad position, not on
experimentally annotated TSSs as here. Tolstorukov et al.
[8] discuss the possibility that a periodic dinucleotide
profile may arise in the average frequencies of a set of
sequences, even if the periodic signal is not directly
related to nucleosome positioning. Such a signal may
occur if, for example, a short motif has strong
nucleosome positioning properties, but would still allow
the histone core to shift by a few base pairs along the
sequence to settle in the most favorable configuration in
terms of deformation energy cost. Once sequences are
obtained by the ChIP-seq technology and aligned at the
dyad, their average nucleotide profile may theoretically
show such a periodic pattern as a consequence of
nucleosome rotational positioning rather than as a cause.
Here, however, we align nucleosome sequences indepen-
dently of the ChIP-seq technology, using the TSS as sole
reference. The above scenario may only be applicable to
our data if a strong nucleosome positioning motif is itself
aligned to the TSS, unrelated to the periodic pattern
which, in this case, would be secondary to the motif. Even
under this non-parsimonious scenario, however, the con-
clusion that the rotational setting of the nucleosome is
linked to the TSS remains unchanged.
Our work thus underlines a tight coupling between the
periodic signal and transcription. We show that the
strength of the periodic signal can be correlated with pro-
moters that contain EP300 binding sites, and histones of
the +1 nucleosome that are acetylated at residues known
to be targets of EP300. Based on these results, we propose
a theoretical model that explains how EP300 may effi-
ciently trigger transcription elongation in genes that
require rapid and coordinated expression.
EP300 was recently found to acetylate lysine 56 of his-
tone H3 (H3K56) in human and Drosophila [31], a modi-
fication that promotes nucleosome disassembly during
transcription [34] in yeast. Instead of residing on histone
tails, as for many acetylation and methylation targets,
H3K56 is located on the globular histone core [35,36], a
location that restricts its accessibility to EP300. As an
additional source of spatial constraint, EP300 interacts
with unphosphorylated RNA pol II [37] and binds DNA,
and is likely to be subject to one or both of these interac-
tions while depositing an acetylation mark on H3K56.
EP300 is therefore unable to freely move on its histone
target. To remain efficient, it is reasonable that this
important step in the elongation phase of RNA pol II
transcription must be spatially optimized. We propose
that RR and YY dinucleotides located at key positions in
the DNA sequence wrapped around the histone core may
be the information required to position the nucleosome
at the optimal spatial coordinates for EP300 interaction.
Indeed, histones interact with DNA in regions where the
minor groove of the double helix faces inwards. If the
nucleosome shifts its position by 1 bp, it must rotate by
approximately 36° around the DNA helical axis in order
for histones to remain in contact with the minor groove.
If the nucleosome shifts by a full 10.2- to 10.5-bp helical
turn, it completes a 360° circular motion around the heli-
cal axis. The spatial positioning of the nucleosome with
respect to the DNA molecule and its associated protein
complexes is thus precisely dependent on its local posi-
tion, at single base pair resolution (Figure 4).
It is tempting to link our model to the phenomenon of
RNA Pol II 'pausing' after transcription initiation [38,39].
RNA pol II pausing is thought to poise the polymerase for
transcription, enabling rapid induction of the elongation
phase, upon receiving the appropriate signal. This
requires, amongst other processes, that the histone core
be removed from the DNA molecule, and strikingly,
H3K56 acetylation is thought to be a determining factor
in tipping the nucleosome assembly/disassembly equilib-
rium towards disassembly [34]. Our model therefore pre-
dicts that the periodic signal may be a mechanism by
which genes that need rapid activation of the elongation
phase after RNA Pol II pausing may expedite nucleosome
disassembly by efficiently acetylating H3K56. Indeed, it
may be expected that genes poised for rapid expression
through RNA Pol II stalling would be subjected to a fol-
lowing step that is also optimized for its efficiency (Figure
5). This model offers a possible mechanism for the release
of the paused Pol II, after its conversion to an elongation-
compatible form by P-TEFb [40,41]. Remarkably, our
model also provides a possible explanation for the some-
what counterintuitive observation that genes harboring
elongating Pol II show well-positioned +1 nucleosomes
[23]. Indeed, a +1 nucleosome that is in phase with a rota-
tional positioning signal will show little translational vari-
ability in mapping experiments yet will be efficiently
disassembled to make way for Pol II elongation. Our
model also explains the observation that Pol II appears to
pause primarily at 20, 30 or 40 bp from the TSS, that is, at
positions that are multiples of 10 bp [23,42,43]. Indeed, if
the nucleosome itself is resting at positions that are dis-
tant from the TSS by such a unit length, then the abutting
Hebert and Roest Crollius Genome Biology 2010, 11:R51
/>Page 8 of 13
RNA Pol II would be tied to the same positional con-
straints. Finally, our model predicts that modulating the
rotational orientation of a nucleosome may be an efficient
mechanism to regulate gene activation, in a way that is
epigenetically heritable. In such circumstances, chroma-
tin remodeling factors would promote the shifting of the
histone core by a few base pairs from an unfavorable to a
favorable orientation and back, thus controlling the
potential for H3K56 acetylation and nucleosome disas-
sembly. The fact that the SWI/SNF complex is required
to stimulate transcription elongation in mammalian cells
[44] by remodeling the +1 nucleosome is consistent with
this prediction. It would be interesting to compare our
model based on human TSS sequence analysis to the situ-
ation in Drosophila, where more experimental data are
available. Currently, the precision of annotated TSSs in
the Drosophila genome is not sufficient to allow the iden-
tification of a periodic signal as described in yeast or
human, although this is likely to change in the near
future.
A different model was recently proposed to account for
H2A.Z-related dinucleotide periodicities near the yeast
TSS [3,4]. In this model, the preferred rotational setting
exposes transcription factor binding sequences on the
surface of the nucleosome that would otherwise be facing
the histone core. Binding of transcription factors would
play a role in regulating the translational displacement of
the nucleosome, which may be important for gene activa-
tion. While our findings are not incompatible with this
model developed in yeast, we did not find evidence for
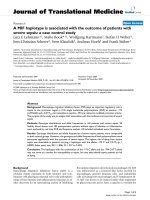
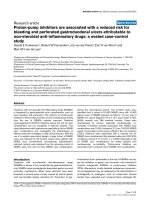
Figure 4 Schematic representation of the spatial relationships between the nucleosome, the DNA molecule and RNA Pol II. (a) The nu-
cleosome histone core (grey) is positioned on the DNA molecule (blue) with the first three minor groove-histone contact points containing RR dinu-
cleotides (red). The RNA Pol II complex (gold) is shown here without its associated co-factors for clarity. (b) The same as in (a) but a side view, showing
the RR dinucleotide in intimate contact with the histones. (c) If the nucleosome is shifted 5 bases closer to the RNA Pol II, it must rotate in space by 5
× 36° = 180° around the helical axis with respect to RNA pol II in order to preserve the contacts between the histones and the minor groove. (d) The
same as in (c) but a side view, showing how the RR dinucleotides are now facing outwards and how the RNA Pol II 'sees' the first nucleosome from an
entirely different angle.
The nucleosome translates by 5 bases, thus rotating by
5 x 36° = 180 ° around the DNA helical axis
C
D
(a)
(b)
(c)
(d)
Hebert and Roest Crollius Genome Biology 2010, 11:R51
/>Page 9 of 13
Figure 5 A theoretical model of how the rotational setting of a nucleosome may facilitate its own disassembly by EP300 acetylation. (a) RNA
pol II (Pol II) after transcription initiation at the TSS (black arrow). Our model is consistent with Pol II that is paused at this stage, although this is not a
requirement. (b, c) Subsequent steps leading to elongation if the nucleosome is rotationally constrained (b), and the process for fuzzier nucleosome
positioning (c). In (b), red triangles indicate the positions of two RR dinucleotides at a distance multiple of 10 bp from the TSS. Several hundred pro-
moters carrying such a signal in the human genome would generate the pattern shown in Figure 2a. On a given sequence, this may be sufficient to
constrain the +1 nucleosome to remain set at a specific position and thus at a specific rotational angle with respect to the advancing Pol II. After bind-
ing to its DNA recognition site and/or being recruited by other proteins, EP300 binds to Pol II and is now optimally located in space to deposit acety-
lation marks on the +1 nucleosome. These may include several targets on histone tails but critically includes H3K56 located on the globular part of H3
(orange circle), required for tipping the nucleosome assembly/disassembly equilibrium towards disassembly. Next, Pol II is free to engage in the elon-
gation phase. In (c), RR dinucleotides occur randomly in the sequence and the +1 nucleosome may therefore adopt any rotational angle. Shown here
are three possible nucleosome locations (+0, +1 and +5 bp from the position shown in (b)), each with a different angle. For instance, a 5-bp shift equiv-
alent to half the helical pitch would rotate the nucleosome by approximately 180° with reference to the position at +0 bp, as shown in Figure 4. De-
pending on the nucleosome angle, EP300 is not optimally located with respect to its target and needs to search or probe for its histone target, thus
delaying H3K56 acetylation and subsequent nucleosome disassembly.
Weak rotational setting constraints
+1bp (36°)
+5bp (180°)
EP300
Elongating
Pol II
Nucleosome
disassembly
H3K56 acetylation
+40
+200
RR
Elongating
Pol II
+3bp
+2bp
+4bp
H3
H4
H2A
H2B
EP300
EP300
EP300
EP300
EP300
Strong rotational setting constraints
induced by periodic dinucleotides
+60
Histone
probing
Paused
Pol II
CTD
(a)
Initiation
Delayed disassembly
Pol II ?
Paused
(b)
(c)
Hebert and Roest Crollius Genome Biology 2010, 11:R51
/>Page 10 of 13
specific periodic transcription factor binding site occur-
rences downstream of human promoters (Supporting
information and Figures S9 and S10 in Additional file 1).
Several observations may explain why one or several
RR/YY dinucleotides placed at positions separated by
multiples of 10 bp along the wrapped DNA can direct the
histone core to settle in a specific position and thus spec-
ify the rotational setting of the nucleosome. These
include: strong stacking interactions between purines
facilitating the collapse of the minor groove, and weaker
interactions between the complementary pyrimidines
facilitating their deformation in the major groove [15];
the GG = CC and AG = CT steps are, of all steps, the only
two that form cross-chain hydrogen bonds in the minor
groove, which is probably a determinant of the energeti-
cally more favorable smooth versus kinked bending of the
DNA [10]; and an arginine side-chain is located in the
minor groove of all histone-DNA binding sites except for
one, where the potential discriminator for direct read out
is the adenine C2 group versus the guanine N2 group [45]
(Figure S8 in Additional file 1). However, any structural
explanation for the RR/YY periodicity in human and
mouse should account for the fact that different eukary-
otic species appear to rely on different combinations of
dinucleotides in the periodic signal.
Conclusions
The RR and YY periodic signals described here suggest a
new model where sequence information is directly
exploited to create an optimal spatial topology between at
least three entities: the RNA Pol II associated with cofac-
tors and EP300, the DNA molecule and the +1
nucleosome (Figure 5). The convergence of many obser-
vations leading to this model is striking, yet it is possible
that EP300 and nucleosome rotational orientations are
not mechanistically linked as suggested, because EP300
activity may be linked to CpG island-containing TSSs due
to their role as transcriptional co-activators. Our ability
to design experiments that would directly test the model
is limited because we currently lack a good understand-
ing of the structural basis for the rotational preference for
specific dinucleotides. In particular, we do not know the
minimal number of RR (or YY) dinucleotides in phase
with the TSS that would be required to specify this spatial
topology, but the model nevertheless suggests that if
mutations eliminate the crucial RR (or YY) dinucleotides,
elongation may not proceed with the required efficiency
and may decrease the expression of the gene, thus poten-
tially causing abnormal phenotypes.
Materials and methods
Transcription start site database
All TSSs were extracted from the DBTSS database ver-
sion 6, 15 September 2007 [21]. In case TSSs were within
200 bp of each other, we considered the most frequent
only. TSSs supported by less than two cDNAs mapping to
the exact same position were not considered. Each TSS
was mapped to the NCBI36 human genome assembly and
assigned to the nearest Ensembl gene (version 49). The
final dataset contains 13,622 TSSs associated with 12,028
Ensembl genes.
Power spectral analysis
We applied DFT to compute the PSDs or 'periodograms'
of the periodic signals using R and Python/Numpy func-
tions. The periodogram magnitude is the squared modu-
lus of the Fourier coefficient divided by the length of the
series. Each PSD area is normalized to 1 before extracting
the magnitude of the periodicity at 10 bp. To reduce the
noise caused by the small size of the genomic region over
which the measures are performed (+40 to +190 after the
TSS), we applied a 3-bp smoothing window and multi-
plied the signal with a Hamming window prior to the
DFT analysis.
Alignment to the transcription start site
To test the specificity of the phasing of the signal to the
TSS, regions from position +40 to +190 where extracted
from all 13,622 sequences and a random number
(between 1 and 9) of bases was added at their 5' end to
introduce a random shift. The average RR frequency was
then measured at each position and used to compute the
PSD magnitude at 10 bp. The process was repeated 500
times to obtain a distribution, which was compared to the
PSD magnitude at 10 bp of the compositional profile of
the real sequences (without shift).
ChIP-seq and ChIP-chip data
Nucleosome tags [23] were downloaded from the NCBI
Short Read Archive (SRA) repository under accession
number [SRA:SRA000234]. We considered only the
human activated CD4+ T cell experiment. Histone meth-
ylation and acetylation marks [30] were downloaded from
the SRA repository - [SRA:SRA000206] and
[SRA:SRA000287], respectively. Raw sequences were
aligned on the human genome assembly (NCBI36) using
the Soap 2.01 alignment tool with default options; we
only considered exact matches. To evaluate if the strength
of the periodicity and the intensity of the acetylation are
correlated (Figure S4 in Additional file 1), we computed
the distribution of tag counts in the +40 to +200 region
after the TSS for the six histone marks linked to EP300
(see above), for the 12,270 sequences that possessed at
least one tag. The distribution was divided into quartiles,
the RR periodicity at 10 bp was computed for each
quartile and a Pearson correlation test was performed
between tag count and magnitude of the periodicity at 10
bp. The H3K56 acetylation data [32] consist of ChIP-chip
results on a 244K Agilent Human promoter microarray
Hebert and Roest Crollius Genome Biology 2010, 11:R51
/>Page 11 of 13
using immunoprecipitated DNA sequences bound to
H3K56 acetylated nucleosomes. Of the 13,622 TSSs used
in our study, 6,518 possessed at least one 244K microar-
ray probe positioned between +40 and +200 bp after the
TSS in the region overlapping the +1 nucleosome.
Gene expression and Gene Ontology analyses
Human gene expression data from the HG-U133A and
GNF1B Affymetrix chips were obtained from the
Genomics Institute of the Novartis Research Foundation
[46]. After filtering and remapping of probes (Supple-
mentary information in Additional file 1) we obtained
4,372 genes that were also present in the dbTSS dataset
and were used for the analysis. The distribution of the
median of the normalized expression levels [47] across
the 72 tissues for each gene showed a bimodal distribu-
tion that we partitioned using a Gaussian mixture model
(Figure S6 in Additional file 1). The two sets of low (L;
1,846 genes) and high (H; 2,526 genes) expression level
were analyzed by randomization tests (see below). The
quantification of tissue specificity is described in Sup-
porting information in Additional file 1. The distribution
of the tissue specificity scores for the 4,372 genes was
divided into 3 groups containing 1,199, 2,159 and 1,014
genes (Figure S7 in Additional file 1) with low, medium
and high tissue specificity levels, respectively, and the
periodicity was measured for each group by bootstrap-
ping as described for the median expression level. The
enrichment of Gene Ontology terms in the H versus the L
groups was performed using FatiGO+ software [48],
available through the Babelomics site [49].
EP300 binding
The 7-bp consensus sequence binding site of EP300 [28]
(matrix from Transfac [M00033] release 7; Figure S11 in
Additional file 1) was searched between positions +1 and
+40 after the TSS using the position specific weight
matrices method [50]. We computed a local probability
score using a sliding window of 7 bp (that is, the consen-
sus size) from -500 bp to +500 bp around the TSS. A
match for a putative EP300 binding site occurs if the local
probability is higher than the average probability com-
puted along the region (probability density estimation
[51]). A total of 198 sequences have a unique match
located between 0 and +40 bp after the TSS, and these
were used for further analysis. To further account for
possible compositional biases in this region, we per-
formed multiple random shuffling of the position within
the matrix and computed the distribution of occurrences
in the same region as above. None of the iterations gener-
ated a significant number of matches in the 0 to +40
region, confirming that the 198 sequences are highly
enriched in specific matches to the EP300 position weight
matrix.
Randomization tests
In several steps of the analysis described here, we wished
to test the strength of the PSD magnitude at 10 bp (see
'Power spectral analysis' section above) on a set of TSS
sequences that share a specific property (for example, low
gene expression level, EP300 binding, and so on). Because
calculating a single average PSD value for the whole set of
TSSs that share a given property does not provide any
means to calculate statistical significance, we performed
random sampling with replacement of a subset of TSSs
from this population, and calculated PSD values from
each sample based on its average RR frequencies as a
proxy for both RR and YY frequencies (the 'RR/YY sig-
nal'). The distributions obtained in this way are normal,
and can be compared to assess if they are statistically dif-
ferent between two populations of sequences. The size of
each random sample used here is composed of between
500 and 1,000 sequences (depending on the initial size of
the promoter group). The number of samplings required
to reach a normal distribution (P-value < 1 × 10
-5
, Kolm-
ogorov-Smirnoff test) is between 2,000 and 5,000.
Additional material
Abbreviations
bp: base pair; ChIP: chromatin immunoprecipitation; ChIP-seq: ChIP with DNA
sequencing; DFT: discrete Fourier transform; PSD: power spectral density; RNA
pol II: RNA polymerase II; RR dinucleotide composed of purine bases (A or G);
SRA: Short Read Archive; TSS: transcription start site; WW: dinucleotide com-
posed of A or T; YY: dinucleotide composed of pyrimidine bases (C or T).
Authors' contributions
CH performed the analyses and participated in the design of the study. HRC
conceived the study and wrote the manuscript. All authors read and approved
the final version of the manuscript.
Acknowledgements
We wish to thank David Enard for discussions, Stéphane Lecrom and Alexandra
Louis for technical help, Fiona Francis for critical reading of the manuscript and
Yoichiro Nakatani and Shinichi Morishita for providing medaka TSS mapping
data. This work is funded by the ATIP program of the Centre National de la
Recherche Scientifique (HRC) and by the French Ministère de l'Enseignement
Supérieur et de la Recherche (CH).
Author Details
Dyogen Group, Institut de Biologie de l'Ecole Normale Supérieure (IBENS), 46
rue d'Ulm, CNRS UMR8197, INSERM U1024, 75005 Paris Cedex 05, France
Additional file 1 Supplementary information and Tables S1 and S2
and Figures S1 to S11. This file contains additional details on CpG classifi-
cation, correlation between CpG dinucleotides and periodicity, compari-
sons between promoters with and without CpG islands, methods for
quantifying gene expression and tissue specificity, and the relationship
between transcription factor binding site periodicity and dinucleotide peri-
odicity.
Received: 12 November 2009 Revised: 24 February 2010
Accepted: 12 May 2010 Published: 12 May 2010
This article is available from: 2010 Hebert and Roest Crollius; licensee BioMed Central Ltd. This is an open access article distributed under the terms of the Creative Commons A ttribution License ( which permits unrestricted use, distribution, and reproduction in any medium, provided the original work is properly cited.Genome Biology 2010, 11:R51
Hebert and Roest Crollius Genome Biology 2010, 11:R51
/>Page 12 of 13
References
1. Woodcock CL: Chromatin architecture. Curr Opin Struct Biol 2006,
16:213-220.
2. Henikoff S: Nucleosome destabilization in the epigenetic regulation of
gene expression. Nat Rev Genet 2008, 9:15-26.
3. Jiang C, Pugh BF: Nucleosome positioning and gene regulation:
advances through genomics. Nat Rev Genet 2009, 10:161-172.
4. Albert I, Mavrich T, Tomsho L, Qi J, Zanton S, Schuster S, Pugh B:
Translational and rotational settings of H2A.Z nucleosomes across the
Saccharomyces cerevisiae genome. Nature 2007, 446:572-576.
5. Chung HR, Vingron M: Sequence-dependent nucleosome positioning. J
Mol Biol 2008, 386:1411-1422.
6. Valouev A, Ichikawa J, Tonthat T, Stuart J, Ranade S, Peckham H, Zeng K,
Malek JA, Costa G, McKernan K, Sidow A, Fire A, Johnson SM: A high-
resolution, nucleosome position map of C. elegans reveals a lack of
universal sequence-dictated positioning. Genome Res 2008,
18:1051-1063.
7. Mavrich T, Jiang C, Ioshikhes I, Li X, Venters B, Zanton S, Tomsho L, Qi J,
Glaser R, Schuster S, Gilmour D, Albert I, Pugh B: Nucleosome
organization in the Drosophila genome. Nature 2008, 453:358-362.
8. Tolstorukov MY, Kharchenko PV, Goldman JA, Kingston RE, Park PJ:
Comparative analysis of H2A.Z nucleosome organization in human
and yeast genome. Genome Res 2009, 19:967-977.
9. Drew HR, Travers AA: DNA bending and its relation to nucleosome
positioning. J Mol Biol 1985, 186:773-790.
10. Richmond T, Davey C: The structure of DNA in the nucleosome core.
Nature 2003, 423:145-150.
11. Travers A, Drew H: DNA recognition and nucleosome organization.
Biopolymers 1997, 44:423-433.
12. Segal E, Fondufe-Mittendorf Y, Chen L, Thåström A, Field Y, Moore I, Wang
J, Widom J: A genomic code for nucleosome positioning. Nature 2006,
442:772-778.
13. Kato M, Onishi Y, Wada-Kiyama Y, Abe T, Ikemura T, Kogan S, Bolshoy A,
Trifonov EN, Kiyama R: Dinucleosome DNA of human K562 cells:
experimental and computational characterizations. J Mol Biol 2003,
332:111-125.
14. Kogan S, Trifonov EN: Gene splice sites correlate with nucleosome
positions. Gene 2005, 352:57-62.
15. Kogan SB, Kato M, Kiyama R, Trifonov EN: Sequence structure of human
nucleosome DNA. J Biomol Struct Dyn 2006, 24:43-48.
16. Fraser RM, Keszenman-Pereyra D, Simmen MW, Allan J: High-resolution
mapping of sequence-directed nucleosome positioning on genomic
DNA. J Mol Biol 2009, 390:292-305.
17. Dalal Y, Fleury TJ, Cioffi A, Stein A: Long-range oscillation in a periodic
DNA sequence motif may influence nucleosome array formation.
Nucleic Acids Res 2005, 33:934-945.
18. Pedersen AG, Baldi P, Chauvin Y, Brunak S: DNA Structure in Human RNA
Polymerase II Promoters. J Mol Biol 1998, 281:663-673.
19. Barski A, Cuddapah S, Cui K, Roh T, Schones D, Wang Z, Wei G, Chepelev I,
Zhao K: High-resolution profiling of histone methylations in the human
genome. Cell 2007, 129:823-837.
20. Raisner R, Hartley P, Meneghini M, Bao M, Liu C, Schreiber S, Rando O,
Madhani H: Histone variant H2A.Z marks the 5' ends of both active and
inactive genes in euchromatin. Cell 2005, 123:233-248.
21. Wakaguri H, Yamashita R, Suzuki Y, Sugano S, Nakai K: DBTSS: database of
transcription start sites, progress report 2008. Nucleic Acids Res 2008,
36:D97-101.
22. Touchon M, Arneodo A, d'Aubenton-Carafa Y, Thermes C: Transcription-
coupled and splicing-coupled strand asymmetries in eukaryotic
genomes. Nucleic Acids Res 2004, 32:4969-4978.
23. Schones D, Cui K, Cuddapah S, Roh T, Barski A, Wang Z, Wei G, Zhao K:
Dynamic regulation of nucleosome positioning in the human genome.
Cell 2008, 132:887-898.
24. Reynolds SM, Bilmes JA, Stafford Noble W: On the relationship between
DNA periodicity and local chromatin structure. In Proceedings of the
Twelfth International Conference on Research in Computational Molecular
Biology (RECOMB): May 18-21; Tucson, Arizona Volume 5541. Berlin,
Heidelberg: Springer-Verlag; 2009:434-450. Lecture Notes in
Bioinformatics
25. Bird AP: DNA methylation and the frequency of CpG in animal DNA.
Nucleic Acids Res 1980, 8:1499-1504.
26. Saxonov S, Berg P, Brutlag D: A genome-wide analysis of CpG
dinucleotides in the human genome distinguishes two distinct classes
of promoters. Proc Natl Acad Sci USA 2006, 103:1412-1417.
27. von Mikecz A, Zhang S, Montminy M, Tan EM, Hemmerich P: CREB-
binding protein (CBP)/p300 and RNA polymerase II colocalize in
transcriptionally active domains in the nucleus. J Cell Biol 2000,
150:265-273.
28. Rikitake Y, Moran E: DNA-binding properties of the E1A-associated 300-
kilodalton protein. Mol Cell Biol 1992, 12:2826-2836.
29. Kouzarides T: Chromatin modifications and their function. Cell 2007,
128:693-705.
30. Wang Z, Zang C, Rosenfeld JA, Schones DE, Barski A, Cuddapah S, Cui K,
Roh TY, Peng W, Zhang M, Zhao K: Combinatorial patterns of histone
acetylations and methylations in the human genome. Nat Genet 2008,
40:897-903.
31. Das C, Lucia MS, Hansen KC, Tyler JK: CBP/p300-mediated acetylation of
histone H3 on lysine 56. Nature 2009, 459:113-117.
32. Xie W, Song C, Young NL, Sperling AS, Xu F, Sridharan R, Conway AE,
Garcia BA, Plath K, Clark AT, Grunstein M: Histone h3 lysine 56 acetylation
is linked to the core transcriptional network in human embryonic stem
cells. Mol Cell 2009, 33:417-427.
33. Field Y, Kaplan N, Fondufe-Mittendorf Y, Moore IK, Sharon E, Lubling Y,
Widom J, Segal E: Distinct modes of regulation by chromatin encoded
through nucleosome positioning signals. PLoS Comput Biol 2008,
4:e1000216.
34. Williams SK, Truong D, Tyler JK: Acetylation in the globular core of
histone H3 on lysine-56 promotes chromatin disassembly during
transcriptional activation. Proc Natl Acad Sci USA 2008, 105:9000-9005.
35. Masumoto H, Hawke D, Kobayashi R, Verreault A: A role for cell-cycle-
regulated histone H3 lysine 56 acetylation in the DNA damage
response. Nature 2005, 436:294-298.
36. Xu F, Zhang K, Grunstein M: Acetylation in histone H3 globular domain
regulates gene expression in yeast. Cell 2005, 121:375-385.
37. Cho H, Orphanides G, Sun X, Yang XJ, Ogryzko V, Lees E, Nakatani Y,
Reinberg D: A human RNA polymerase II complex containing factors
that modify chromatin structure. Mol Cell Biol 1998, 18:5355-5363.
38. Gilmour DS, Lis JT: RNA polymerase II interacts with the promoter
region of the noninduced hsp70 gene in Drosophila melanogaster cells.
Mol Cell Biol 1986, 6:3984-3989.
39. Rougvie AE, Lis JT: Postinitiation transcriptional control in Drosophila
melanogaster. Mol Cell Biol 1990, 10:6041-6045.
40. Cheng B, Price DH: Properties of RNA polymerase II elongation
complexes before and after the P-TEFb-mediated transition into
productive elongation. J Biol Chem 2007, 282:21901-21912.
41. Gilmour DS: Promoter proximal pausing on genes in metazoans.
Chromosoma 2009, 118:1-10.
42. Rasmussen EB, Lis JT: In vivo transcriptional pausing and cap formation
on three Drosophila heat shock genes. Proc Natl Acad Sci USA 1993,
90:7923-7927.
43. Rasmussen EB, Lis JT: Short transcripts of the ternary complex provide
insight into RNA polymerase II elongational pausing. J Mol Biol 1995,
252:522-535.
44. Corey LL, Weirich CS, Benjamin IJ, Kingston RE: Localized recruitment of a
chromatin-remodeling activity by an activator in vivo drives
transcriptional elongation. Genes Dev 2003, 17:1392-1401.
45. Davey C, Sargent DF, Luger K, Maeder AW, Richmond T: Solvent mediated
interactions in the structure of the nucleosome core particle at 1.9 a
resolution. J Mol Biol 2002, 319:1097-1113.
46. Su AI, Wiltshire T, Batalov S, Lapp H, Ching KA, Block D, Zhang J, Soden R,
Hayakawa M, Kreiman G, Cooke MP, Walker JR, Hogenesch JB: A gene
atlas of the mouse and human protein-encoding transcriptomes. Proc
Natl Acad Sci USA 2004, 101:6062-6067.
47. Wu Z, Irizarry RA: Stochastic models inspired by hybridization theory for
short oligonucleotide arrays. J Comput Biol 2005, 12:882-893.
48. Al-Shahrour F, Minguez P, Tarraga J, Medina I, Alloza E, Montaner D,
Dopazo J: FatiGO +: a functional profiling tool for genomic data.
Integration of functional annotation, regulatory motifs and interaction
data with microarray experiments. Nucleic Acids Res 2007, 35:W91-96.
49. Al-Shahrour F, Minguez P, Tarraga J, Montaner D, Alloza E, Vaquerizas JM,
Conde L, Blaschke C, Vera J, Dopazo J: BABELOMICS: a systems biology
Hebert and Roest Crollius Genome Biology 2010, 11:R51
/>Page 13 of 13
perspective in the functional annotation of genome-scale
experiments. Nucleic Acids Res 2006, 34:W472-476.
50. Ben-Gal I, Shani A, Gohr A, Grau J, Arviv S, Shmilovici A, Posch S, Grosse I:
Identification of transcription factor binding sites with variable-order
Bayesian networks. Bioinformatics 2005, 21:2657-2666.
51. Scott DW: Multivariate Density Estimation. Theory, Practice and Visualization
New-York: Wiley; 1992.
doi: 10.1186/gb-2010-11-5-r51
Cite this article as: Hebert and Roest Crollius, Nucleosome rotational setting
is associated with transcriptional regulation in promoters of tissue-specific
human genes Genome Biology 2010, 11:R51