Báo cáo y học: "A human functional protein interaction network and its application to cancer data analysis" potx
Bạn đang xem bản rút gọn của tài liệu. Xem và tải ngay bản đầy đủ của tài liệu tại đây (4.22 MB, 23 trang )
Wu et al. Genome Biology 2010, 11:R53
/>
Open Access
RESEARCH
A human functional protein interaction network
and its application to cancer data analysis
Research
Guanming Wu*1, Xin Feng2,3 and Lincoln Stein1,2
candidate protein
onstrated genes. interaction Its utility
action network identification network
A high-quality human functional protein demFunctionalin theis constructed. of cancer isinterAbstract
Background: One challenge facing biologists is to tease out useful information from massive data sets for further
analysis. A pathway-based analysis may shed light by projecting candidate genes onto protein functional relationship
networks. We are building such a pathway-based analysis system.
Results: We have constructed a protein functional interaction network by extending curated pathways with noncurated sources of information, including protein-protein interactions, gene coexpression, protein domain interaction,
Gene Ontology (GO) annotations and text-mined protein interactions, which cover close to 50% of the human
proteome. By applying this network to two glioblastoma multiforme (GBM) data sets and projecting cancer candidate
genes onto the network, we found that the majority of GBM candidate genes form a cluster and are closer than
expected by chance, and the majority of GBM samples have sequence-altered genes in two network modules, one
mainly comprising genes whose products are localized in the cytoplasm and plasma membrane, and another
comprising gene products in the nucleus. Both modules are highly enriched in known oncogenes, tumor suppressors
and genes involved in signal transduction. Similar network patterns were also found in breast, colorectal and
pancreatic cancers.
Conclusions: We have built a highly reliable functional interaction network upon expert-curated pathways and
applied this network to the analysis of two genome-wide GBM and several other cancer data sets. The network
patterns revealed from our results suggest common mechanisms in the cancer biology. Our system should provide a
foundation for a network or pathway-based analysis platform for cancer and other diseases.
Background
High-throughput functional experiments, including
genetic linkage/association studies, examinations of copy
number variants in somatic and germline cells, and
microarray expression experiments, typically generate
multiple candidate genes, ranging from a handful to several thousands. These data sets are noisy and contain
false positives in addition to genes that are truly involved
in the biological process under study. An unsolved challenge is how to understand the functional significance of
multi-gene data sets, extract true positive candidate
genes, and tease out functional relationships among these
genes with confidence for use in further experimental
analysis.
* Correspondence:
1
Ontario Institute for Cancer Research, MaRS Centre, South Tower, 101 College
Street, Suite 800, Toronto, ON M5G 0A3, Canada
Full list of author information is available at the end of the article
Using biological pathways to interpret high-throughput
data
One way to approach the above problem is to analyze the
data from the perspective of biological pathways [1,2]. A
pathway is a set of biochemical events that drives a cellular process. For example, the transforming growth factor
beta (TGFβ) pathway consists of a ligand receptor binding event that initiates a series of protein-protein interaction (PPI), protein degradation, protein phosphorylation,
and protein-DNA binding events that transmit a regulatory signal and regulate proliferation, differentiation and
migration [3]. In cancer, the TGFβ signaling network
functions in complex ways to both suppress early tumor
growth and promote late stage progression [4]. Some
breast cancers [5-9] are thought to arise in part when
components of the TGFβ pathway are deleted, thereby
freeing the tissue from growth inhibition. The same type
of cancer can arise via several different routes [2]. For
example, tumors from two different patients might have
© 2010 Wu et al.; licensee BioMed Central Ltd. This is an open access article distributed under the terms of the Creative Commons At-
BioMed Central tribution License ( which permits unrestricted use, distribution, and reproduction in any
medium, provided the original work is properly cited.
Wu et al. Genome Biology 2010, 11:R53
/>
deleted different components of the TGFβ pathway.
Although the two tumors both share the loss of TGFβ
growth inhibition, they may not share defects in a common gene or gene sets. However, a pathway-based analysis will resolve this confusing finding and point towards
the etiology of the disease. By projecting the list of
mutated, amplified or deleted genes onto biological pathways, one will find that a statistically unlikely subset of
otherwise unrelated genes are closely clustered in 'reaction space'. Pathway-based analysis can thus provide
important insights into the biology underlying disease
etiology. One striking example of this approach is the
finding of the 'exclusivity principle' in cancer: only one
gene is generally mutated in one pathway in any single
tumor [1].
Recently, several large-scale genome-wide screening
projects have revealed common core signaling pathways
in the etiology or progression of several cancer types [1014], indicating the relevance of pathway-based analysis
for the understanding of large scale disease data sets.
Pathway-based analysis accomplishes at least two things:
it marks the genes associated with the disease or other
phenotype and separates them from innocent bystanders
caught in the general instability of the malignant genome
or other false positive hits [15]; and it identifies the biological pathways affected by the genes [16]. The latter
outcome also places the high-throughput analysis results
in an intellectual framework that can be more easily comprehended by the researcher. It connects his results to
prior work from the literature, and allows him to propose
hypotheses that can be tested by further experimental
work.
Resources for pathway analysis
Pathway-based hypothesis generation has been the subject of great interest over the past few years [17]. It is the
basis for several popular data analysis systems, including
GOMiner [18,19], Gene Set Enrichment Analysis [20],
Eu.Gene Analyzer [21], and several commercial tools (for
example, Ingenuity Systems [22]).
Reactome [23] is an expert-curated, highly reliable
knowledgebase of human biological pathways. Pathways
in Reactome are described as a series of molecular events
that transform one or more input physical entities into
one or more output entities in catalyzed or regulated
ways by other entities. Entities include small molecules,
proteins, complexes, post-translationally modified proteins, and nucleic acid sequences. Each physical entity,
whether it be a small molecule, a protein or a nucleic acid,
is assigned a unique accession number and associated
with a stable online database. This connects curated data
in Reactome with online repositories of genome-scale
data such as UniProt [24] and EntrezGenes [25], and
makes it possible to unambiguously associate a position
Page 2 of 23
on the genome with a component of a pathway. A computable data model and highly reliable data sets make
Reactome an ideal platform for a pathway-based data
analysis system. However, since all data in Reactome is
expert-curated and peer-reviewed to ensure high quality,
the usage of Reactome as a platform for high-throughput
data analysis suffers from a low coverage of human proteins. As of release 29 (June 2009), Reactome contains
4,181 human proteins, roughly 20% of total SwissProt
proteins. Other curated pathway databases, including
KEGG [26], Panther Pathways [27], and INOH [28], offer
similarly low coverage of the genome.
In contrast to pathway databases, collections of pairwise relationships among proteins and genes offer much
higher coverage. These include data sets of PPIs and gene
co-expression derived from multiple high-throughput
techniques such as yeast two-hybrid techniques, mass
spectrometry pull down experiments, and DNA microarrays. These kinds of data sets are readily available from
many public databases. For example, PPIs can be downloaded from BioGrid [29], the Database of Interacting
Proteins [30], the Human Protein Reference Database
(HPRD) [31], I2D [32], IntACT [33], and MINT [34], and
expression data sets from the Stanford Microarray Database [35] and the Gene Expression Omnibus [36]. Protein
or gene networks based on these pairwise relationships
have been widely used in cancer and other disease data
analysis with promising results [37-42].
Transforming pairwise interactions into probable
functional interactions
A limitation of pairwise networks is that the presence of
an interaction between two genes or proteins does not
necessarily indicate a biologically functional relationship;
for example, two proteins may physically interact in a
yeast two-hybrid experiment without this signifying that
such an interaction forms a part of a biologically meaningful pathway in the living organism. In addition, some
pairwise interaction data sets may have high false positive
rates [43,44], which contribute noise to the system, and
interfere with pathway-based analyses. For this reason,
groups that make pathway-based inferences on highthroughput functional data sets inevitably draw on
curated pathway projects to cleanse their data and to
train their predictive models.
Our goal is to achieve the best of both worlds by combining high-coverage, unreliable pairwise data sets with
low-coverage, highly reliable pathways to create a pathway-informed data analysis system for high-throughput
data analysis. As the first step towards achieving this goal,
we have created a functional interaction (FI) network that
combines curated interactions from Reactome and other
pathway databases, with uncurated pairwise relationships
gleaned from physical PPIs in human and model organ-
Wu et al. Genome Biology 2010, 11:R53
/>
Page 3 of 23
isms, gene co-expression data, protein domain-domain
interactions, protein interactions generated from text
mining, and GO annotations. Our approach uses a naïve
Bayes classifier (NBC) to distinguish high-likelihood FIs
from non-functional pairwise relationships as well as outright false positives.
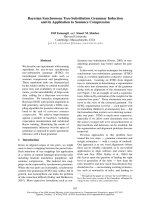
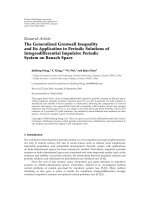
In this report, we describe the procedures to construct
this FI network (Figure 1), and apply this network to the
study of glioblastoma multiforme (GBM) and other cancer types by expanding a human curated GBM pathway
using our FIs, projecting cancer candidate genes onto the
FI network to reveal the patterns of the distribution of
these genes in the network, and utilizing network clustering results on cancer samples to search for common
mechanisms among many samples with different
sequence-altered genes. Finally, we introduce a webbased user interface that gives researchers interactive
access to the derived FIs.
Results
Data sources used to predict protein functional
interactions
We used the following six classes of data to predict protein FIs (Table 1): 1, human physical PPIs catalogued in
IntAct [45], HPRD [46], and BioGrid [47]; 2, human PPIs
projected from fly, worm and yeast in IntAct [45] based
on Ensembl Compara [48]; 3, human gene co-expression
Human PPI [45-47]
Yeast PPI [45]
Fly PPI [45]
GO BP Sharing [51]
Lee s Gene Expression [49]
Worm PPI [45]
Domain Interaction [52]
Prieto s Gene Expression [50]
PPIs from GeneWays [53]
Data sources for predicted FIs
Reactome [23]
trained by
Panther [60]
validated by
NCI-Nature [62]
Na
Naïve Bayes Classifier
r
CellMap [61]
NCI-BioCarta [62]
KEGG [63]
TRED [64]
Predicted FIs
dF
Annotated FIs
t t d FI
Data sources for
annotated FIs
N t
FI Network
Figure 1 Overview of procedures used to construct the functional interaction network. See text for details. BP, biological process.
derived from DNA microarray studies (two data sets
[49,50]); 4, shared GO biological process annotations
[51]; 5, protein domain-domain interactions from PFam
[52]; and 6, PPIs extracted from the biomedical literature
by the text-mining engine GeneWays [53].
Table 1 lists these data sources, the numbers of proteins
and interactions, and estimated coverage of the human
genome expressed as their coverage of the SwissProt protein database.
The coverage ranges from 7% (Worm PPIs) to 70% (GO
biological process sharing). It is notable that the coverage
of human physical PPIs from three public protein interaction databases (IntAct, HPRD, and BioGrid) is close to
50%. Many interactions from IntAct were catalogued
from co-immunoprecipitation experiments combined
with mass spectrometry, and contain multiple proteins in
a single interaction record. An odds ratio analysis showed
that human PPIs based on all interaction records are
much less correlated to FIs (see below) extracted from
Reactome pathways than interactions containing four or
fewer interactors: 13.91 ± 0.52 versus 36.98 ± 9.17 (Pvalue = 2.8 × 10⁻⁵ based on t-test). Therefore, we selected
interactions that contain only four or fewer interactors
from the IntAct database. We also tried to use GO molecular functional annotations as one of the data sources.
The odds ratio of this data set was 2.99 ± 0.02, much
smaller than the GO biological process data set (11.85 ±
0.20). Our results show that this data set contributed little
to the prediction. One reason for this may be that the GO
molecular functional categories are usually broad and the
purpose of our NBC is to predict if two proteins may be
involved in the same specific reactions (see below).
Construction and training of a functional interaction
classifier
Our goal was to create a network of protein functional
relationships that reflect functionally significant molecular events in cellular pathways. The majority of PPIs in
interaction databases are catalogued as physical interactions, and there is rarely direct evidence in the interaction
databases that these interactions are involved in biochemical events that occur in the living cell. Other protein pairwise relationships have similar issues. To
integrate pairwise relationships into a pathway context,
we built a scoring system based on the NBC algorithm, a
simple machine learning technique [54], to score the
probability that a protein pairwise relationship reflects a
functional pathway event.
For our NBC, we used nine features as listed under
'Data source' in Table 1: 1, whether there is a reported PPI
between the human proteins; 2, whether there is a
reported PPI between the fly (Drosophila melanogaster)
orthologs of the two human proteins; 3, whether there is
a reported PPI between the worm (Caenorhabditis ele-
Wu et al. Genome Biology 2010, 11:R53
/>
Page 4 of 23
Table 1: Data sources used to predict protein functional interactions
Data source
Proteins
SwissProt proteins (coverage)
Interactions
Reference
Human PPIs
10,287
Fly PPIs
13,383
10,029 (49%)
53,743
[45-47]
4,088 (20%)
939,639 (26,346a)
[45]
(8,161a)
Worm PPIs
5,223
1,477 (7%)
Yeast PPIs
5,646
1,530 (8%)
Domain interaction
60,569
Lee's Gene Expression
8,250
122,192
[45]
1,900,980 (167,574a)
[45]
15,218 (75%)
NA
[52]
7,647 (38%)
206,117
[49]
Prieto's Gene Expression
3,024
2,901 (14%)
13,441
[50]
GO BP sharing
14,197
14,197 (70%)
NA
[51]
PPIs from GeneWays
5,252
5,252(26%)
51,048
[53]
To calculate the coverage of SwissProt, we used 20,332, the total identifier number in SwissProt (UniProtKB/Swiss-Prot Release 56.9, 3 March
2009), as the denominator. The numbers of interactions from three model organisms have been mapped to human proteins based on
Ensembl Compara [48] (see text for details). aNumbers of PPIs in the original species. BP, biological process.
gans) orthologs of the two human proteins; 4, whether
there is a reported PPI between the yeast (Saccharomyces
cerevesiae) orthologs of the two human proteins; 5,
whether there is a domain-domain interaction between
the human proteins; 6 and 7, whether the genes encoding
the two proteins are co-expressed in expression microarrays based on two independent DNA array data sets; 8,
whether the GO biological process annotations for
human proteins are shared; and 9, whether there is a textmined interaction between the human proteins.
An NBC must be trained using positive and negative
training data sets in order to determine the proper
weighting of different combinations of features. We
developed training sets from the curated information in
Reactome, relying in part on an independent analysis that
reported Reactome as a highly accurate data set for PPI
prediction [55].
An issue in using PPIs and other pairwise relationships
in a pathway context is that the data models used by pathway databases are much richer than a simple binary relationship. A pathway database describes pathways in
terms of proteins, small molecules and cellular compartments that are related by biochemical reactions that have
inputs, outputs, catalysts, cofactors and other regulatory
molecules. To develop the training sets from Reactome
pathways for NBCs, we established a relationship called
'functional interaction' using the following definition: a
functional interaction is one in which two proteins are
involved in the same biochemical reaction as an input,
catalyst, activator, or inhibitor, or as two members of the
same protein complex.
It is important to note that in Reactome a 'reaction' is a
general term used to describe any discrete event in a biological process, including biochemical reactions, binding
interactions, macromolecule complex assembly, trans-
port reactions, conformational changes, and post-translational modifications [23]. We treat two members of the
same protein complex as functionally interacting with
each other because the activity of the complex as a whole
is presumably functionally dependent on the presence of
all of its subunits.
Based on the above definition, we extracted 74,869 FIs
from Reactome, and used these FIs to create a positive
training set for the NBC. After filtering out FIs that did
not have at least one feature derived from the data
sources in Table 1, the positive data set comprised 45,079
FIs.
Creating a good negative training set is more difficult
than creating a positive set due to the incompleteness of
our knowledge of protein interactions [56]: just because
two proteins are not known to interact does not mean
that this does not in fact occur. Research groups have
addressed this problem using a variety of approaches,
including choosing protein pairs from different disjunct
cell compartments [57], or random pairs from all proteins
[58]. For our NBC training, we followed the method in
Zhang et al. [58] using random pairs selected from proteins in the filtered Reactome FI set.
Choosing an appropriate prior probability or ratio
between the positive and negative data sets is important
for NBC training. We calculated the prior probability
based on the total number of proteins in the filtered FIs
from Reactome pathways, which was 5.7 × 10⁻³. To check
the effect of ratio between the sizes of the positive and
negative data sets, we test the NBC performance using a
ratio of either 10 or 100. NBCs trained with these two
ratios yielded similar true and false positive rates, which
indicated that our NBC is robust against the size of the
negative data set.
Wu et al. Genome Biology 2010, 11:R53
/>
The performance of machine learning classifier systems
can be evaluated by cross-validation, or more stringently
by using an independent data set. We used FIs extracted
from pathways in other human curated pathway databases as a testing data set to evaluate the performance of
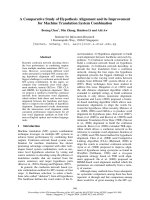
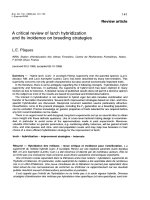
our trained NBC. Figure 2 shows a receiver operating
characteristic curve that relates true positive rates to false
positive rates across a range of thresholds using this testing data set. We chose a threshold score of 0.50, which
trades off a high specificity of 99.8% against a low sensitivity of 20%. The low sensitivity may result, in part, from
high false negative rates existing in some of the data sets
we used for NBC, especially in PPIs [59].
At the threshold score (0.50), a protein pair must have
multiple types of FI evidence in order to be scored as a
true FI (Table S1 in Additional file 1). While most (97%)
of the predicted FIs have at least one PPI feature (Figure
S1 in Additional file 1), there are no predictions supported solely by human PPI data, and fewer than 3% are
supported solely by PPIs in human plus other species.
This greatly reduces the weight given to raw human PPI
features: the 44,819 human PPIs that went in to the classifier as features resulted in fewer than 15,000 predicted
FIs, representing the removal of 68% of the raw PPIs.
Most (75%) of the predicted FIs are derived from GO biological process term sharing and protein domain interactions in addition to PPIs.
As a check on the classifier's ability to enrich for FIs, we
compared the sharing of GO cellular component annotations (which includes compartments such as 'nucleoplasm') among raw human PPIs to the sharing of these
annotations among predicted FIs. Since GO cellular component annotations were not used as a feature during
NBC training, we reasoned that this assessment should
be independent. Among raw PPIs, 62.9% share GO cellular component terms annotated for both proteins
involved in the interaction. In contrast, 96.2% of the predicted FIs share this type of GO term (P-value < 2.2 × 10¹⁶), suggesting a substantial enrichment in true FIs relative to an interaction set derived from raw features alone.
Merging the NBC with pathway data to create an extended
FI network
To construct an extended FI network with high protein
and gene coverage, we merged FIs predicted from our
trained NBC with annotated FIs extracted from five pathway databases. The five pathway databases used were
Reactome [23], Panther [60], CellMap [61], NCI Pathway
Interaction Database [62], and KEGG [63] (Table 2).
To further increase the coverage of our network, we
imported interactions between human transcription factors and their targets from the TRED database [64].
TRED has two parts: one contains highly reliable, human
curated data from published literature and the other is
Page 5 of 23
uncurated and comprises predictions based on several
computational algorithms. For our purposes, we used the
human curated part only to ensure the reliability of our FI
network, and treat these interactions as a part of the
pathway FIs in this report.
The extended FI network contains 10,956 proteins
(9,393 SwissProt accession numbers, splice isoforms not
counted) and 209,988 FIs (Table 3). It covers 46% of SwissProt proteins.
The average connection degree (that is, the number of
interacting partners per protein) of the extended network
is 38, and the maximum degree is 593 for protein P32121
(ARRB2, Beta-arrestin-2). Most proteins in this network
are interconnected: 10,645 proteins are interconnected in
the largest connected graph component. The remaining
311 proteins reside in 124 connected graph components
of size 7 or smaller.
The FI network shows scale-free properties (data not
shown) as do other biological networks [65-68]. GO slim
annotation enrichment analysis results (not shown) show
that our network is enriched in proteins involved in signal
transduction, cell cycle and the central dogma. This
reflects the ascertainment bias of using Reactome as the
training set, as these pathways reflect high priorities for
Reactome curation.
Assessing the utility of functional interactions in the
network
GBM is the most common type of brain tumor in humans
and also has the highest fatality rate. Recently, two data
sets from two independent high throughput screens for
somatic mutations involved in GBM have been released
[12,14]. In this section, we demonstrate that the interactions from our network can be used to automatically
extend a hand-curated GBM pathway developed to support the analysis of one of these data sets [14]; the
extended GBM pathway captures more observed somatic
mutation events and can be used to generate testable biological hypotheses.
In preparation for analysis of The Cancer Genome
Atlas (TCGA) somatic mutation data set [14], a team of
bioinformaticians, molecular biologists and clinical
oncologists based at Memorial Sloan Kettering Cancer
Center and Dana-Farber Cancer Institute developed a
human-curated map of the molecular pathways involved
in GBM (Figures S7 and S8 in [14]; the original Cytoscape
file can be downloaded from [69]). Our network captures
the majority of proteins and interactions in this map: 96%
of proteins (70 of 73) and 69% of interactions (129 of 187).
The TCGA GBM screen captured 341 mutated genes,
including both point mutations and copy number variations (CNVs). Of these genes, 38 (11%) are part of the
original hand-curated GBM pathway, and 237 (70%) are
in the FI network. Of these genes in the FI network, 36
Wu et al. Genome Biology 2010, 11:R53
/>
Page 6 of 23
1.0
NBC ROC Curve
0.6
0.4
0.0
0.2
0.6
0.00
0.01
0.02
0.03
0.04
0.05
0.4
False Positive Rate
0.2
True Positive Rate
True Positive Rate
0.8
0.8
1.0
NBC ROC Curve
0.0
AUC: 0.93
0.0
0.2
0.4
0.6
0.8
1.0
False Positive Rate
Figure 2 Receiver operating characteristic curve for NBC trained with protein pairs extracted from Reactome pathways as the positive data
set, and random pairs as the negative data set. This curve was created using an independent test data set generated from pathways imported
from non-Reactome pathway databases. The positions for the cutoff values 0.25, 0.50 and 0.75 are marked from right to left in the inset. The area under
the curve (AUC) for this receiver operating characteristic (ROC) curve is 0.93.
are in the original GBM pathway (15%), and in addition,
108 directly interact with at least one of the curated GBM
pathway genes, for a total of 42% of the somatic mutations. This degree of interaction between somatically
mutated genes with the GBM pathway is far greater than
would be expected by chance (P-value = 1.3 × 10⁻²³ by the
hypergeometric test), suggesting that the FI network provides an effective way to enrich the hand-curated GBM
pathway for additional genes involved in the disease.
Wu et al. Genome Biology 2010, 11:R53
/>
Page 7 of 23
Table 2: Pathway data sources in the functional interaction network
Data source
Proteins
SwissProt proteins (coverage)
Interactions
Reference
Reactome
4,490
3,863 (19%)
74,869
[23]
Panther
1,912
1,355 (7%)
33,425
[60]
CellMap
567
567 (3%)
1,195
[61]
NCI Nature
1,492
1,486 (7%)
10,845
[62]
NCI BioCarta
1,137
1,136 (6%)
6,695
[62]
KEGG
2,497
2,261 (11%)
13,934
[63]
TRED
1,167
1,166 (6%)
3,030
[64]
SwissProt coverages were calculated as described in Table 1. NCI Pathway Interaction Database has two divisions: batch-imported pathways
from BioCarta [83] and pathways hand-curated by NCI Nature pathway curators. We represent these two divisions separately. TRED is a
transcription factor/target database. We have imported the human curated part of transcription factor-target interactions from this database
for our network.
We then added these potential proteins and interactions to the GBM pathway map to extend it. In order to
do so, we chose proteins that were found to have one or
more somatic mutations in the GBM screen, and had
direct interactions with one or more of the proteins in the
hand-curated GBM pathway. In this way we were able to
extend the hand-curated pathway from 73 proteins and
187 interactions to 181 proteins and 768 interactions. A
total of 581 FIs were added between pathway components and new mutated protein interactions (an increase
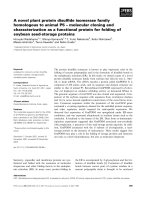
of 148% for proteins and 311% for FIs). Figure 3 shows the
original hand-curated map after extending it with predicted and curated FIs from the FI network involving
mutated genes. Interactions derived from curated pathways are represented as solid lines (with arrows for FIs
involved in catalysis and activation, and with a 'T' bar for
those involved in inhibition), while those predicted from
the NBC are shown as dotted lines. Many mutated proteins interact with more than one pathway component.
For the purposes of readability, Figure 3 shows only proteins that interact with one pathway component. A larger
diagram showing the fully extended map is available in
Figure S2 in Additional file 1.
A total of 23 of the FIs added to the GBM pathway in
Figure 3 were predicted by the NBC. To validate the accuracy of these predicted FIs, we searched the published literature for evidence supporting that two genes in the
predicted FIs are indeed functionally related. Table 4 lists
the literature references that support these interactions.
Out of 23 FIs, a total of 18 (78%) are supported by literature evidence for a functionally significant event. One FI
(ROS1-EGFR) has no literature evidence supporting it,
and the remaining four are confirmed physical interactions but have no evidence of functional significance.
These results suggest that the predicted FIs are sufficiently reliable to be safely integrated into known pathways for systematic analysis.
A detailed examination of the extended GBM pathway
can lead to hypotheses that connect the observed
sequence alteration in the TCGA data set to known biological pathways. For example, NUP50 is required for
degradation of CDKN1B protein [70]. Copy number deletion in NUP50, which occurs in three TCGA GBM samples, may inhibit the degradation of CDKN1B and impact
the cell cycle process. For another example, tenascin-C
(TNC) protein is a ligand for epidermal growth factor
receptor (EGFR) [71]. Three re-sequenced GBM samples
have found TNC mutations, which may disturb the RTK/
RAS signaling pathway via its interaction with EGFR.
It needs to be pointed out that the directionality of the
interaction should be taken into account when using the
FI network to frame hypotheses. For example, two of the
pathway FIs around TP53, BAX-TP53 and GTSE1-TP53
were originally extracted from the KEGG human p53 sig-
Table 3: Protein identifiers and functional interactions in the extended FI network
Source type
Proteins
SwissProt proteins (coverage)
Interaction
6,316
5,496 (27%)
98,590
Predicted
8,345
7,546 (37%)
111,398
Total
10,956
9,393 (46%)
209,988
Pathways
FIs listed in the pathways row include transcription factor-target interactions imported from the TRED database.
Wu et al. Genome Biology 2010, 11:R53
/>
Page 8 of 23
Figure 3 Overlay of predicted functional interactions onto a human curated GBM pathway from the TCGA data set. Many genes can interact
with multiple pathway genes. In this diagram, only genes interacting with one pathway gene are shown to minimize diagram clutter. Newly added
genes are colored in light blue, while original genes are colored in grey. Newly added FIs are in blue, while original interactions are in other colors. FIs
extracted from pathways are shown as solid lines (for example, PHLPP-AKT1), while those predicted based on NBC are shown as dashed lines (for example, KLF6-TP53). Extracted FIs involved in activation, expression regulation, or catalysis are shown with an arrowhead on the end of the line, while
FIs involved in inhibition are shown with a 'T' bar. The original GBM pathway map in the Cytoscape format was downloaded from [69].
naling pathway [72]. The BAX and GTSE1 genes are transcriptionally upregulated by TP53 protein. Though it is
not annotated in the original KEGG database, there is
evidence showing that GTSE1 protein can regulate TP53
protein's activity and localization [73]. However, there is
no evidence to suggest that the P53 pathway is affected by
BAX protein, a protein involved in apoptosis [74]. Hence,
mutations in BAX in a particular tumor do not support
an etiology involving P53 signaling, but instead might
point to events downstream of P53. The same caveat
applies to predicted FIs as well.
Clustering of GBM sequence-altered genes in the extended
FI network
The previous section described how the FI network can
be used to enhance and extract novel hypotheses from a
previously created hand-curated disease pathway. In this
section, we illustrate how studies of distributions of
altered genes in the GBM samples in the FI network can
assist in genome-wide functional analysis when a preexisting disease pathway is unavailable.
Both the TCGA [14] and Parsons et al. [12] GBM studies identified recurrent patterns of somatic gene muta-
Wu et al. Genome Biology 2010, 11:R53
/>
Page 9 of 23
Table 4: Literature references for predicted FIs added to human curated GBM pathway from the TCGA GBM data set
Pathway gene
FI partner
Reference
Comment
CCNE1
FBXW7
[99]
Turnover of CCNE1 protein is dependent on FBXW7 protein
CDK4
ASPM
[100]
Physical interaction: functional relationship is not clear
CDKN1A
PIM1
[101]
Pim-1 kinase dependent phosphorylation of p21Cip1/WAF1 (CDKN1A) influences
subcellular localization of p21
CDKN1B
NUP50
[70]
NUP50 protein is required for degradation of CDKN1B protein, which is important in
cell cycle regulation
E2F1
TRRAP
[102]
TRRAP is required as a cofactor for E2F transcriptional activation
EGFR
ANXA1
[103]
ANXA1 protein and other annexins are involved in degradation of EGFR protein
EGFR
ROS1
EGFR
TNC
[71]
EP300
GLI1
[104]
GLI1 is involved in a GLU1-p53 inhibitory loop
EP300
IQGAP1
[105]
Physical interaction: functional relationship is not clear
EP300
PROX1
[106]
Physical interaction: functional relationship is not clear
EP300
TCF12
[107]
Form a functional complex in neurons
GRB2
SYP
[108]
SYP involvement in the RAS pathway has been reported some time ago
GRB2
TNK2
[109]
TNK2 protein is a target of GRB2 protein
MSH6
PMS2
[110]
PMS2 has been treated as a DNA repair gene
PDPK1
RPS6KA3
[111]
Phosphoserine-mediated recruitment of PDPK1 to RPS6KA3 leads to coordinated
phosphorylation and activation of PDPK1 and RPS6KA3
PRKCA
ANXA7
[112]
Calcium-dependent membrane fusion driven by annexin 7 can be potentiated by
protein kinase C and guanosine triphosphate
SRC
CD46
[113]
CD46 is a substrate of SRC
SRC
MAPK8IP2
[114]
Though no direct evidence shows a functional relationship between these two
genes, it is shown that an isoform of JIP (MAPK8IP2), JIP1, is regulated by Src family
kinases
TP53
CYLD
TP53
KLF4
[115]
KLF4 is a direct suppressor of expression of TP53
TP53
KLF6
[116]
Physical interaction: TP53 may enhance the function of KLF6
TP53
TOP1
[117]
Activity of TOP1 may be modulated by P53
This may be a false positive example
TNC protein is a ligand for EGFR
CYLD is a deubiquitinating enzyme. Several deubiquitinating enzyme have been
shown to be involved in the p53 pathway; however, no evidence has been provided
for CYLD in the p53 pathway
tions involving multiple classical signaling pathways
using a manual process of inspection and correlation to
the literature and a variety of pathway databases. Here,
we use network community analysis to automatically
identify network modules that contain genes and their
products that are involved in common processes.
The edge-betweenness algorithm [75] has been used to
find network modules in protein interaction networks
[76-78]. We applied this algorithm to search for FI network modules for sequence-altered genes identified in
the two GBM data sets. Starting with the TCGA data set,
we collected 341 mutated and CNV genes from 91 GBM
samples that have been re-sequenced in that study. A
total of 237 of these genes (70%) were in the FI network.
Of these, 168 have mutual FIs and are interconnected. We
built a subnetwork around these 168 genes, applied the
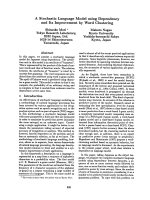
edge-betweenness network clustering to it, and obtained
17 network modules, 6 of which were greater than size 4
(Figure 4).
The sizes of the first two modules (modules 0 and 1) are
63 and 50, respectively. The distribution study showed
that 76 out of 91 GBM samples have altered genes in both
module 0 and module 1 (84%, P-value < 1.0 × 10⁻⁴ from
permutation test). As a cross-validation test, we projected 22 samples from the discovery screen in the Parsons data set, which provided both somatic mutation and
CNV data, onto these network modules. The result
showed that 68% (15 out of 22) have altered genes in both
module 0 and module 1 from the TCGA data set (P-value
< 1.0 × 10⁻⁴). We also did a reciprocal test by applying the
Wu et al. Genome Biology 2010, 11:R53
/>
edge-betweenness clustering algorithm to a subnetwork
composed by altered genes from the Parsons data set, and
checking sample distributions from both GBM data sets
in the network modules. The results are similar to our
results in the TCGA data set: 77% (P-value = 0.0002) of
GBM samples in the Parsons data set, and 71% (P-value <
1.0 × 10⁻⁴) in the TCGA data set have altered genes in two
corresponding modules (Figure S3 in Additional file 1).
To see what biological features these two modules may
connote, we annotated these two modules using pathways and GO terms. GO cellular annotation enrichment
assay indicated that module 0 mainly corresponds to proteins present in the cytoplasm and plasma membrane,
while module 1 mainly involves gene products present in
the nucleus. Many pathways can be assigned to these two
modules, but it is clear that module 0 is mainly related to
signaling transduction pathways while module 1 is related
to the cell cycle, DNA repair and pathways involved in
chromosome maintenance (Table S2 in Additional file 1).
The fact that most of the GBM samples have altered
Page 10 of 23
genes in both modules implies that these two major modules are acting cooperatively in establishing and/or maintaining the GBM phenotype, and suggests that the
development of GBM cancers involve malfunctions in
both signaling transduction and cell-cycle regulation.
Our FI network is composed of a combination of
curated FIs and predicted FIs. To determine whether the
distribution of altered genes is robust, we checked the
above results against FI network modules composed of
FIs derived from curated FIs only. The results are similar
to those obtained using the integrated FI network except
that network modules 0 and 1 are smaller than the modules built with both predicted and pathway FIs (results
not shown). Figure 4 shows that many mutated genes are
brought into modules 0 and 1 based on predicted FIs
only, which are shown with dashed lines.
To further explore the distribution of mutations among
the network modules, we performed a hierarchical clustering of the TCGA GBM samples based on the occurrence of altered genes in the modules (Figure 5). From
this clustering, we obtain five sample clusters of size 61,
Module 1: nucleus
Module 0: cytoplasm, plasma membrane
Figure 4 Edge-betweenness network clustering results for the altered genes from the TCGA data set. Gene nodes in different clusters are displayed in different colors. GO cellular component annotation for clusters 0 and 1 are labeled in the diagram to show the major cellular localizations
for genes in these two clusters. The node size is proportional to the number of samples bearing displayed altered genes.
Wu et al. Genome Biology 2010, 11:R53
/>
13, 6, 9, and 2, respectively. Three types of samples were
used in the original TCGA screening (rightmost column
of Figure 5): recurrent samples (15, blue), secondary samples (4, red), and primary samples (72, green). Sample
cluster 0, which has a signature of mutations in both network modules 0 and 1, is enriched in primary tumor samples (P-value = 0.055 from Fisher test). In contrast,
sample cluster 1, which has additional mutations involving network modules 8, 3, 9, 7 and others, is enriched in
samples from tumor recurrences and metastases (P-value
= 0.026). Indeed, all but one of the four metastatic samples can be found in sample cluster 1 (P-value = 0.0086).
In the original TCGA paper [14], seven of the recurrent
or metastatic samples were labeled as 'hyper-mutated'
because of their much higher rate of somatic mutation.
We found that except for one sample (TCGA-02-0099)
located in sample cluster 0, all of the other six samples are
in cluster 1 (P-value = 1.7 × 10⁻⁵). These results illustrate
how the mutated network modules can be used to differentiate cancer samples.
Defining a GBM core cancer network
It is expected that multiple false positive ('passenger')
genes exist in the set of sequence-altered genes identified
from the GBM samples. It is also expected that true positive ('driver') GBM-related genes should occur more often
in GBM samples than by chance. We plotted the percentage of altered genes versus samples for both GBM data
sets (Figure 6), and compared this distribution against
what would be expected by random assignment of genes
to samples. There are two phases in the distribution of
altered genes across samples. In the first phase, involving
gene alterations occurring between two to five samples,
there is sharing of fewer altered genes than would be
expected by chance. In the second phase, involving genes
altered independently in six or more samples, there are
more altered genes shared among the samples than would
be expected by chance. This result can be explained if
there exist a minimum number of driver genes that must
be mutated in order to produce GBM, and that this 'GBM
core' tends to be recurrently mutated in independent
samples. Figure 6 also shows that the average shortest
path among shared genes from GBM samples decreases
versus sample numbers in contrast to random samples,
which implies that GBM candidate genes tend to be
closer in the FI network than by chance (see below).
To visualize sequence-altered genes and further define
the core set of genes in the GBM samples, we collected
genes altered in at least two samples to reduce the number of false positive GBM candidate genes, performed
hierarchical clustering among them to identify a set of
highly interconnected candidates, and then selected and
built subnetworks containing >70% of altered genes (Fig-
Page 11 of 23
ure 7a, b) by adding the minimum number of linker genes
to form a fully connected subnetwork.
In the TCGA data set, 164 altered genes occurred in
two or more GBM samples, 98 (60%, P-value = 3.2 × 10⁻⁷)
of which were in the FI network. Of these, 71 are in the
GBM subnetwork (72%, P-value < 0.001 from permutation test). An average shortest distance calculation (Table
5) shows that genes in this cluster are linked together
much more tightly than would be expected by chance:
2.29 for subnetwork genes versus 3.83 for a similarly sized
random set of genes treated in the same way as the cancer
subnetwork. In the Parsons data set, 111 genes occur in
two or more GBM samples, 65 (59%, P-value = 8.4 × 10⁻⁵)
of which are in the FI network. Of these, 46 are in the
GBM cancer cluster (71%, P-value < 0.001 from permutation test). Similar to the TCGA data set, the average
shortest path among these genes is shorter than by
chance (2.76 versus 3.82, P-value < 0.001).
In the average shortest path calculation, a potentially
confounding factor in the TCGA data set is that 601
genes pre-selected for sequencing may be more tightly
interconnected than average. Indeed this is the case.
When we performed the permutation test using these
601 pre-selected genes, we obtained an average shortest
path of 2.40, which is shorter than the genome-wide average, but still longer than the length of 2.29 calculated for
the subnetwork formed by recurrently mutated genes (Pvalue = 0.023; connection degrees have been considered
in permutation test (see below)). This consideration does
not apply to the Parsons set, which used an unbiased
resequencing approach.
In summary, results from both GBM data sets indicate
that more than 70% of the recurrently mutated genes are
more tightly interconnected than expected by chance,
and occupy a small corner of the large FI network space.
We found that the average connection degrees in the
GBM clusters are higher than the average connection
degree in the whole FI network (40 based on the biggest
connected graph component using gene names): 87 for
the TCGA cluster (P-value = 1.3 × 10⁻⁵ from t-test), and
60 for the Parsons cluster (P-value = 0.13). The result that
the average shortest path among altered genes in cancer
clusters is shorter than by chance may be an ascertainment bias due to the higher connection degrees in the
cancer clusters resulting from the intensive study of signal transduction pathways, to which most GBM candidate genes belong. To determine whether the differences
in average shortest paths between the cancer clusters and
randomly selected genes are due entirely to the difference
in degree, we performed an additional permutation test
in which the genes picked were stratified by degree in
order to match the distribution of the cancer gene sets
(Table 6, Degree-based permutation column). This correction reduced, but did not eliminate, the differences in
Wu et al. Genome Biology 2010, 11:R53
/>
Page 12 of 23
Recurrence
Module0
Module1
Module8
Module16
Module2
Module5
Module10
Module13
Module12
Module3
Module4
Module15
Module9
Module7
Module6
Module11
Module14
TCGA-02-0024
TCGA-06-0219
TCGA-06-0143
TCGA-02-0038
TCGA-06-0187
TCGA-02-0064
TCGA-02-0089
TCGA-06-0184
TCGA-02-0071
TCGA-02-0116
TCGA-06-0156
TCGA-02-0034
TCGA-06-0145
TCGA-02-0080
TCGA-02-0047
TCGA-06-0208
TCGA-02-0085
TCGA-06-0209
TCGA-02-0003
TCGA-06-0122
TCGA-06-0206
TCGA-06-0166
TCGA-06-0138
TCGA-02-0075
TCGA-02-0046
TCGA-02-0011
TCGA-06-0185
TCGA-06-0129
TCGA-02-0021
TCGA-06-0190
TCGA-06-0148
TCGA-02-0027
TCGA-06-0178
TCGA-06-0197
TCGA-06-0201
TCGA-02-0007
TCGA-02-0060
TCGA-02-0115
TCGA-06-0169
TCGA-02-0001
TCGA-06-0137
TCGA-02-0052
TCGA-02-0086
TCGA-06-0210
TCGA-06-0237
TCGA-06-0174
TCGA-02-0006
TCGA-02-0009
TCGA-02-0033
TCGA-02-0054
TCGA-06-0214
TCGA-02-0074
TCGA-06-0171
TCGA-06-0176
TCGA-06-0157
TCGA-06-0213
TCGA-02-0102
TCGA-02-0037
TCGA-06-0173
TCGA-02-0099
TCGA-02-0055
TCGA-06-0154
TCGA-06-0158
TCGA-06-0188
TCGA-02-0043
TCGA-02-0028
TCGA-06-0126
TCGA-06-0221
TCGA-06-0211
TCGA-06-0195
TCGA-02-0014
TCGA-02-0010
TCGA-02-0083
TCGA-02-0114
TCGA-06-0241
TCGA-06-0128
TCGA-02-0058
TCGA-06-0130
TCGA-02-0057
TCGA-06-0141
TCGA-06-0147
TCGA-02-0069
TCGA-06-0132
TCGA-06-0168
TCGA-02-0113
TCGA-02-0107
TCGA-06-0125
TCGA-06-0133
TCGA-06-0124
TCGA-06-0139
TCGA-06-0189
Figure 5 Hierarchical clustering of GBM samples in the TCGA data set based on altered gene occurrences in the network modules identified
by the edge-betweenness algorithm. The rows are samples, while the columns are 17 network modules. In the central heat map, red rectangles
represent samples having altered genes in modules, while green rectangles represent samples having no altered genes in modules. The vertical blue
dashed line shows the cutoff value we used to select sample clusters from the hierarchical clustering. The right-most column lists sample types: green
for primary GBM samples ('No' in Table S1B in [14]), blue for recurrent ones ('Rec' in Table S1B in [14]), and red for secondary ones ('Sec' in Table S1B in
[14]).
average shortest path between the cancer gene sets and
randomly selected genes, and the differences remained
statistically significant: both P-values < 0.001.
The reason why the average shortest paths for the
TCGA data set are smaller than the those calculated for
the Parsons set for both the cancer cluster and degreebased permutation results is that re-sequenced genes in
the TCGA data set number 601 in total, which are pre-
selected and believed to be more cancer-related, while the
Parsons paper resequenced 20,661 protein coding genes.
Looking at the two GBM cancer subnetworks in more
detail, each subnetwork consists of GBM candidate genes
('cancer genes') plus the minimum number of interacting
genes necessary to interconnect them ('linker genes',
shown in red in Figures 7 and 8). The TCGA subnetwork
contains 77 genes, 5 of them linkers, while the Parsons
subnetwork contains 62 genes, 14 of them linkers. Since
Wu et al. Genome Biology 2010, 11:R53
/>
Page 13 of 23
(a) Altered Genes vs Samples from TCGA
Altered Genes
Random Altered Genes
Shortest Path
Random Shortest Path
1
3
0.9
0.8
2.5
0.6
0.5
2
0.4
Average Shortest Path
Percentage of Altered Genes
0.7
0.3
1.5
0.2
0.1
1
0
1
6
11
16
21
26
Samples
31
36
41
46
(b) Altered Genes vs Samples from Parsons
Altered Genes
Random Altered Genes
Shortest Path
Random Shortest Path
4
1
0.9
3.5
0.8
Percentage of Altered Genes
0.6
2.5
0.5
2
0.4
0.3
Average Shortest Path
3
0.7
1.5
0.2
1
0.1
0.5
0
1
2
3
4
5
6
7
8
9
10
11
Samples
Figure 6 Plots of altered genes versus samples. The horizontal axis is the sample numbers, and the left vertical axis is the percentage of altered
genes occurring in samples related to total altered genes. The right vertical axis is the average shortest path among altered genes occurring in samples. (a) The TCGA data set. (b) The Parsons data set.
Wu et al. Genome Biology 2010, 11:R53
/>
(a)
(b)
Page 14 of 23
unique genes (9%) for altered genes in the FI network).
Intriguingly, 12 out of 13 shared genes in the FI network
are present in the two cancer subnetworks we built independently for the two data sets (Figures 7 and 8, shared
genes are in yellow; P-value = 0.0014 based on permutation test), suggesting that the GBM cancer clusters capture the common candidate genes. Interestingly, with the
exception of COL3A1, all the shared genes directly interact with each other, suggesting that they form the core of
a GBM pathway, and that non-shared cancer genes are
extensions of the core network.
To further narrow down the list of candidate genes to
those that are likely to be drivers, we used the results
shown in Figure 6 to investigate candidate genes altered
in eight or more GBM samples in the TCGA data set, and
five or more samples in the Parsons data set. In the
TCGA data set, a total of 20 genes are altered in 8 or
more GBM samples. Of these 20 genes, 13 are in our FI
network, and 10 are displayed in Figure 7a: CDK2A,
CDK2B, CDK4, EGFR, MDM2, NF1, PTEN, RB1, PIK3R1,
and TP53. In the Parsons data set, 14 genes occur in 5 or
more samples, 10 are in the FI network, and 9 are displayed in Figure 7b: CDKN2A, CDKN2B, EGFR, IFNA1,
IFNA2, IFNA8, IFNE1, PTEN, and TP53. Out of these
genes, five are shared between these two data sets:
CDKN2A, CDKN2B, EGFR, PTEN, and TP53 (P-value =
5.8 × 10⁻¹³). The fact that these genes are altered in multiple samples and shared in two studies further indicates
the existence of a GBM core network.
Application of the FI network to other cancer types
Figure 7 Subnetworks for GBM clusters. (a) The TCGA cluster. (b)
The Parsons cluster. Shared GBM candidate genes are shown in yellow,
non-shared candidate genes in aqua, and linker genes used to connect
cancer genes in red. The node size is proportional to the number of
samples bearing displayed altered genes. Other colors and symbols
are as in Figure 2.
many of our FIs were extracted from human curated
pathways, it is easy to superimpose pathways back to
these subnetworks to see what pathways are involved in
these cancer genes. Many pathways are statistically significantly hit by these genes. Figure 8 shows four pathways:
focal adhesion, signaling by platelet-derived growth factor (PDGF), p53, and cell cycle (false discovery rate <8.0 ×
10-4). As illustrated in Figure 8a, b, there are extensive
overlaps among, and cross-talk between, these pathways.
It is surprising that the two GBM studies identified a
relatively small number of GBM candidate genes in common: just 15 out of a total of 260 unique genes are shared
(6%) for all GBM candidate genes (13 out of a total of 150
In this section, we test whether the network patterns
found in the GBM samples can also be found in other
cancer types. We applied our FI network to the genomewide data sets for breast [10], colorectal [10] and pancreatic cancers [11], and found similar patterns of clustering
of mutations into network modules.
In the breast and colorectal data sets, 18,191 genes
based on 20,857 transcripts were re-sequenced for 11
breast and 11 colorectal tumors during the discovery
phase. Mutated genes found in the discovery phase are
further validated with 24 additional samples of the same
tumor type. For network module analysis, we collected
mutated genes from the 11 discovery phase samples from
both breast and colorectal cancers, built interaction subnetworks based on the FI network, clustered the subnetworks using edge-betweenness, and compared the
resulting network modules to the distribution of patient
samples.
For breast cancer samples, 1,023 genes were mutated in
11 tumor samples. Of these, 524 genes are in our FI network (51%). The edge-betweenness algorithm generated
33 clusters, of which 12 were of size 5 or greater. The sizes
of the first three modules are 55 (module 0), 49 (module
Wu et al. Genome Biology 2010, 11:R53
/>
Page 15 of 23
Table 5: Clustering of GBM-related altered genes occurring in two or more samples in the FI network
Data set
Cancer genes
Genes in FI network (%)
Genes in cluster
Percentage of genes in cluster (P-value via
random permutation)
TCGA
164
98 (60%)
71
72% (<0.001)
Parsons
111
65 (59%)
46
71% (<0.001)
The numbers in the 'Cancer genes' column are for altered genes in two or more samples from the TCGA and Parsons data sets. Genes were
collected using both somatic mutations and CNVs.
1), and 26 (module 2) (Figure S4 in Additional file 1). The
sample distribution analysis showed that all 11 breast
samples had mutated genes in modules 0 and 1, and 9 out
11 breast tumor samples had mutated genes in modules
0, 1, and 2. A GO cellular component annotation enrichment analysis showed that genes in module 0 are mainly
from the extracellular region, cytoplasm and the plasma
membrane, while genes in module 1 are found mainly in
the nucleoplasm, nucleus and nucleolus (Table S3 in
Additional file 1). Pathway annotation shows that genes
in module 0 are involved in integrin and focal adhesion
pathways, while genes in modules 1 and 2 are involved in
transcription, cell cycle and DNA repair (Table S3 in
Additional file 1).
For colorectal cancers, 766 genes were mutated in 11
tumor samples. Of these, 410 genes are in our FI network
(54%). We detected 31 modules from the edge-betweenness algorithm, 8 of which were of size 5 or greater. Nine
out of 11 colorectal cancer samples had mutated genes
involving three network modules, modules 0, 1 and 4
(Figure S5 in Additional file 1). A GO cellular component
enrichment analysis (Table S4 in Additional file 1) demonstrated that module 0 is enriched for plasma membrane and cytosol, while module 1 is enriched in GO
terms describing the extracellular region, and module 4 is
enriched in terms for the nucleoplasm and nucleus. Compared with breast cancer, module 0 in breast cancer has
been split into two modules in colorectal carcinoma.
Pathway annotation showed that genes in module 0 are
highly enriched in components of the endothelin and
Nerve Growth Factor (NGF) pathways, in contrast to
breast cancer and GBM, which show no such enrichment.
Genes in module 1 are involved in focal adhesion and
integrin pathways, while genes in module 4 are involved
in DNA repair (Table S4 in Additional file 1), all of which
are also enriched in breast cancer and GBM.
As with the two GBM data sets, we performed a hierarchical clustering analysis on genes mutated in at least two
or more samples. In this analysis, we used samples from
both the discovery and validation phases to increase the
sample numbers. Table S5 in Additional file 1 lists the
numbers of genes mutated in two or more samples,
mutated genes in the whole FI network, and mutated
genes in the clusters from hierarchical clustering; these
numbers indicate that most of the mutated genes are
clustered together in the FI network, as was previously
observed with GBM candidate genes. Also similar to the
results from the GBM analysis, the majority of cancer
candidate genes in both breast and colorectal cancers are
closer than would be expected by chance (Table S6 in
Additional file 1). Figures S6 and S7 in Additional file 1
show these clusters with their pathway annotations. As
with GBM, many cancer-related pathways are significantly enriched in these clusters.
We performed a similar network module and hierarchical clustering analysis on a pancreatic data set [11]. Our
results show that similar network patterns can be found
in pancreatic cancers (Tables S5, S6, and S7, and Figures
S8 and S9 in Additional file 1). We noted that 75% (Pvalue = 0.38) of pancreatic samples (18 out of 24 samples)
have mutated genes in module 0 (nucleus and cytosol)
and module 1 (extracellular region), and 71% (P-value =
0.24) of samples (17 samples) have mutated genes in
Table 6: Average shortest distance for GBM clusters
Data set
Cancer genes
Random permutation (P-value)
Degree-based permutation (P-value)
TCGA
2.29
3.83 (< 0.001)
2.86 (<0.001)
Parsons
2.76
3.82 (< 0.001)
3.32 (<0.001)
The values in the 'Cancer genes' column are from the cancer clusters, while those in the two permutation columns are from permutation tests.
Random permutation is done via randomly picking up the same number of genes from the biggest connected graph component as for the
cancer genes, and degree-based permutation is done by picking up genes from different bins based on the degree distributions of cancer
genes. The gene bins are dynamically generated based on the sorted list of degrees from the cancer genes.
Wu et al. Genome Biology 2010, 11:R53
/>
Page 16 of 23
(a)
Focal Adhesion
cellular localizations, and that most cancer candidate
genes in the FI network are closer than would be
expected by chance. The results are broadly similar to
those seen with GBM, but there are many intriguing differences as well in the identity of the pathways involved.
Software tools for accessing the functional interactions
Signaling by PDGF
p53 Pathway
Cell Cycle
(b)
Focal Adhesion
p53 Pathway
Cell Cycle
Signaling by PDGF
Figure 8 Subnetworks with pathways annotated for GBM clusters. Many pathways are hit by GBM candidate genes. Only four of
them are labeled for two GBM clusters in this diagram to simplify the
diagram. Colors and symbols are as in Figure 6.
module 0 and module 2 (plasma and integral to membrane) (Figure S8 in Additional file 1).
As in the GBM analysis, we used permutation testing to
assess whether more of the breast, colorectal, or pancreatic cancer samples had mutations involving these modules than would be expected by chance. However, due to
the small number of samples available and the relatively
large number of mutations per specimen (32 to 49 altered
genes per specimen in the breast, colorectal and pancreatic sets, versus 22 per specimen in GBM), we failed to
demonstrate statistically significant overrepresentation of
specimens with mutated genes in these modules.
In conclusion, we found that most samples from breast,
colorectal or pancreatic cancers have sequence-altered
genes involving multiple modules localized in different
To make our FI data sets available to general researchers,
we developed a web-based application. This application
was built upon the current Reactome SkyPainter using
Google Web Toolkit (GWT) and is available at [79]. Figure 9 is a screenshot of the application when first
launched. At the top of the application is a Google-map
style view of all reactions manually curated for Reactome;
at the bottom is a hierarchical tree of all pathways, organized by biological process.
To find FIs, users can upload lists of UniProt accession
numbers or gene names for proteins or genes of interest.
The application will then highlight pathways involving
FIs with the proteins or genes of interest in both the reaction map and the pathway hierarchy. When the user
selects a reaction that has been 'hit', a dialog appears that
provides detailed information on the relationship
between the reaction, its components, and FIs involving
those components (Figure 10a). The user can also select a
hit pathway in the hierarchical tree to bring up a pathway
diagram to show pathway components and its FIs (Figure
10b).
The entire set of FIs can be downloaded as a MySQL
database dump (Additional file 2) or in tab-delimited files
(Additional file 3) from this web application. There is no
restriction on their use or redistribution beyond citing
the source of the information.
Discussion
Increasingly, human diseases and other traits are being
probed by genome-wide screens. For example, several
recent papers [10-14] describe genome-wide screening
efforts to identify somatic mutations in several cancer
types. Placing such lists of genes or proteins into a pathway context can yield information on the relationships
among these genes and has the potential to generate
hypotheses about the mechanism(s) linking these genes
to phenotypes.
Reliable pathway databases are essential for such an
analysis, but because of the effort needed to curate pathways is so human-intensive, even the largest pathway
database has a SwissProt coverage of under 20% (Table 2).
In this report, we describe how we have integrated several large-scale experimental data sets to build and train a
machine-learning system that identifies potential 'functional interactions' among pairs of human proteins. We
have combined the FIs predicted by this classifier with
the curated pathways from Reactome and other pathway
Wu et al. Genome Biology 2010, 11:R53
/>
Page 17 of 23
Figure 9 Front page of the web application for predicted functional interactions.
databases to create an extended database of FIs that covers nearly 50% of the human proteome. Our literature
search for a small set of predicted FIs around a human
curated GBM pathway [14] shows that our prediction has
an accuracy around 78% (Table 4).
An essential step in building this extended FI network
was the construction of a naïve Bayes classifier to predict
FIs from a combination of physical PPI data and other
noisy sources of information.
NBC is a simple, robust method that is usually the first
to be tried in machine learning techniques. NBCs can frequently yield better results than more sophisticated techniques [80]. One requirement for a successful NBC is that
the features used in the classifier be independent. In our
NBC, we used human physical PPIs, protein-protein
interologs from yeast, worm, and fly, two independent
gene co-expression data sets, protein domain interactions, GO biological process annotations and PPIs generated from text mining. Human PPIs, protein interactions
from other species, and gene-expression data sets were
generated experimentally, and meet the requirement for
independence. Many of the GO annotations and protein
domain interactions are based on sequence similarities
among proteins in different species. Hence, there is a
potential dependency among these two data types and
protein-protein interologs from yeast, worm and fly since
they all rely on the same phylogenetic trees. Many human
protein interactions in interaction databases we used
(IntAct, BioGrid, and HPRD) are human curated from
the literature. This literature may be used by the text mining technique to generate PPIs. But we feel both effects
are likely to be small.
Many computational methods have been developed to
generate biological pathways and networks based on
DNA microarray or other similar data sets from scratch
with promising results [81]. Most recently, Vaske et al.
[82] developed a factor-graph-based method to expand
known pathways using array data sets generated from
perturbation experiments. Here we propose a new
approach to expand a known human curated pathway by
Wu et al. Genome Biology 2010, 11:R53
/>
Page 18 of 23
(a)
(b)
Figure 10 Views of predicted functional interactions. (a) FIs in a reaction diagram. (b) FIs in a pathway diagram.
using FIs, with the example of the human curated GBM
pathway. Compared to the computational approach, our
method provides direct supporting evidence for
expanded FIs from curated pathways (for curated FIs)
and high reliability from multiple data sources (for predicted FIs). We are in the process of developing a software tool so human curators can make use of these FIs to
expand known pathways for expedited curating.
By applying our FI network to two independent GBM
data sets from whole-genome screening projects, we are
struck by the finding that most genes with recurrent
mutations (>70%; Table 6) co-cluster into a small corner
of huge FI space. These clusters are highly enriched in
classical signaling pathways as well as the cell cycle, in
agreement with pathway analyses performed by the original authors of the studies. We are also able to identify
extensive crosstalk among the pathways, which indicates
the complexities in tumorigenesis. Furthermore, we show
how the FI network can reveal overlaps - and possibly
common mechanisms - between the two GBM studies.
This suggests a scenario in which the two cancer wholegenome screening projects are sampling from a common
core cancer pathway that can be revealed by FI network
analysis.
Our result that most cancer candidate genes are clustered together is similar to what was reported by Cui et
al. [83] based on a much smaller signaling interaction
network generated from BioCarta [84] and CellMap [61],
Wu et al. Genome Biology 2010, 11:R53
/>
a small subset of our imported pathway databases. The
reason why most cancer genes cluster closely together is
still under investigation. The connection degree contributes to such clustering. However, the degree alone still
cannot interpret the clustering based on our degreebased permutation test. We suspect that the major factor
that governs the clustering is from FIs among cancer
genes. A subset of cancer genes may form a small graph
component via these FIs in the huge FI network. Such a
small graph component may be used as a core to pull
other cancer genes together to form a bigger cluster.
Lin et al. [85] investigated network patterns for breast
and colorectal cancers using a similar but smaller data set
[86], and predicted that over half of the mutated proteins
(59 out of 83) in breast cancers participate in an interaction cluster, but only a very small percentage of mutated
proteins in colorectal cancers form an interaction cluster,
which contains 12 proteins. We used different network
analysis approaches based on a larger and more reliable
FI network. Our results uncovered network modules that
have been mutated in the majority of cancer samples and
show that most recurrently mutated genes form a network cluster that is more interconnected than would be
expected by chance in both breast and colorectal cancers.
The results from multiple cancer types imply that the patterns revealed in our study might be common in all cancer types.
Multiple sources of evidence show that tumorigenesis
in human is a multi-step process and that genomes of
tumors have sequence alterations at multiple sites [1].
Pathway analysis indicates that many pathways are
mutated in cancer samples [2]. A striking finding from
our study is that, for all cancer types examined so far,
most samples have mutations involving a small number
of discrete network modules. One of these modules typically corresponds to cell cycle regulation, DNA repair,
and other nucleus-based processes, while another corresponds to signal transduction events in the plasma membrane and cytoplasm. This result suggests that the
transformation from normal cells to malignant cells
requires functional mutations in both nuclear and cytoplasm/plasma membrane-based pathways. However, our
work also suggests that different cancer types have different network modules. A detailed network module based
comparison analysis is likely to reveal different specific
mechanisms in different cancer types.
A major motivation for this work was the desire to integrate information from multiple pathway databases in
order to reduce the fragmentation of knowledge stored in
these useful resources. Even with common data models
such as BioPAX [87], this is not easy to accomplish due to
different focus of interests among the pathway databases,
and different standard operating procedures, which allow
the same series of biological reactions to be described
Page 19 of 23
quite differently from one database to the next. By reducing the pathway databases into a series of pairwise FIs,
however, we have been able to merge five of the major
pathway databases into a single uniform data model,
although much information about the distinct roles of
each protein has been lost during the process. Much of
our current and future effort will be devoted to developing methods to map the FIs back to their original pathway
contexts in order to find causal and directional relationships among the proteins.
Conclusions
We have built a FI network that covers close to half of
human gene products. This functional network, which
interconnects with the curated pathways available from
Reactome and other human curated pathway databases,
forms the foundation for a pathway-based data analysis
system for high-throughput data analysis. We have
applied this system to the analysis of two genome-wide
GBM data sets and data sets from other cancer types and
revealed common network patterns in cancer related
genes and samples, suggesting that there exists a core network in GBM tumorigenesis.
Materials and methods
Importing data from non-Reactome pathway databases
Data from four non-Reactome human-curated pathway
databases were imported into the Reactome database (28
March 2009 release). These four databases are: Panther
[27], CellMap [61], NCI Pathway Interaction Database
[62], and KEGG [26]. To store these imported data into
the Reactome database, the original Reactome schema
was extended by adding one new class, Interaction, as a
subclass to Event, and a new attribute, dataSource, to the
top-most class DatabaseObject. The latter is used to track
the original data sources of imported instances. The data
formats used for importing were: BioPAX [87] for CellMap (released June 2006) and NCI Pathway Interaction
Database (released March 2009), SBML [88] with CellDesigner additions for Panther (version 2.5, August
2008), and KGML for KEGG (released on March 8 2009).
After importing, all data from Reactome and the four
external databases were maintained in a database, which
was also used to store PPI data (see below). We have also
imported human transcription factor and target interactions from the TRED database [64]. There are two types
of data in the TRED database: human curated data from
the published literature and predictions based on computational methods. Only the human data were imported to
ensure high quality. Panther uses protein families generated from hidden Markov models for pathway annotations [60]. We only imported human UniProt proteins
that could be mapped to pathway components reliably
based on evidence codes used in the mapping file.
Wu et al. Genome Biology 2010, 11:R53
/>
Importing protein-protein interaction datasets
Human PPIs were extracted from three PPI databases:
BioGrid [29] (release 2.0.50, February 2009), HPRD [31]
(released August 2007) and IntAct [33] (released March
2009). Data dumps in PSI-MI version 2.5 format from
these three databases were processed by an in-house Java
PSI-MI parser, converted into the extended Reactome
data format, and stored in the extended Reactome database. An odds ratio analysis was used to check the correlation between a PPI or other pairwise data set and FIs
extracted from Reactome pathways. The control groups
were generated from random pairs by using proteins
from the Reactome FIs. The reported odds ratio values in
the results section were based on ten permutations.
PPIs in S. cerevisiae, C. elegans and D. melanogaster PPI
data sets were downloaded from IntAct (released March
2009). Ensembl Compara [48] was used to map nonhuman proteins onto putative human orthologs.
Other data sets for naïve Bayes classifier
The protein domain-domain interaction data set was
downloaded from pFam [52] (release 23.0, July 2008).
Two microarray co-expression data sets were used in
the NBC: one downloaded from [89], which was compiled from 60 data sets that contained a total of about
4,000 microarrays [49], and another generated by Prieto
et al. [50].
Protein GO annotations were downloaded from [90]
(gene_association.goa_human, released March 2009). A
PPI data set generated from a text-mining technique was
kindly provided by Rzhetsky et al. [53].
Training of naïve Bayes classifier
We used a NBC to score protein-protein pairwise relationships. These pairwise relationships were extracted
from nine data sources described above and used as features to train the NBC. We used a closed-world hypothesis [91] to assign values to a protein pair: if there was a
pairwise relationship between the two proteins in the
data set, we used true, otherwise false.
To integrate protein-protein pairwise relationships into
the pathway context, we extracted pairwise relationships
from reactions and complexes annotated in pathways by
defining a FI as an interaction in which two proteins are
involved in the same reaction as input, catalyst, activator
and/or inhibitor, or as components in a complex. To train
the NBC, we extracted a positive data set from Reactome
using this definition, and filtered out pairs that do not
have any feature. We generated a negative training set
using random pairs from proteins in the positive data set.
Clustering of cancer genes in the functional interaction
network
Two human GBM data sets [12,14] were used in our cancer data analysis. For sequence-altered genes in GBM, we
Page 20 of 23
chose mutated genes and CNV genes for each sample.
Many genes exist in CNV chromosome fragments. For
our study, we chose those genes that have been labeled
'Genes with gene expression correlated with copy number' in the TCGA data set (Table S3 in [14]) or 'Candidate
target' and 'Other genes' in the Parsons data set (Tables
S5 and S6 in [12]). Note that CNV genes in the TCGA
data set have been pre-filtered based on gene expression
data sets, while CNV genes in the Parsons have not since
only SAGE expression data are available, which were not
used for filtering because of their lower sensitivity for
under-regulated genes. To get CNV genes for each sample in the TCGA data set, we used a file, TCGA-GBMRAE-genemap-n216-20080510-dscrt.txt,
downloaded
from [92], which lists CNVs for individual samples [93].
For edge-betweenness network clustering [75], we
lumped all sequence-altered genes from samples
together, searched FIs among these genes, and constructed a subnetwork based on these interactions. A Java
graph library, Jung2 [94], was used for edge-betweenness
network clustering. Hierarchically clustering of TCGA
GBM samples was done using the hclust method in R [95]
based on the complete linkage method with the binary
distance between binary vectors generated for each GBM
sample according to occurrence of altered genes in network modules identified by the edge-betweenness algorithm. The heat map from hclust was drawn using the R
package heatplus [96].
To search for GBM cancer clusters, we collected
sequence-altered genes occurring in two or more samples
(GBM candidate genes), calculated pairwise shortest
paths among genes in the FI network, hierarchically clustered them based on the average linkage method, and
then selected a cluster containing more than 70% altered
genes. To estimate P-value for GBM cancer clusters, we
did a 1,000-fold permutation test by randomly choosing
the same numbers of genes from the biggest connected
graph component as the GBM candidate genes to subject
to the same hierarchical procedures for the candidate
genes.
To construct a subnetwork spanning a set of genes, we
implemented a search algorithm guided by the hierarchical clustering results based on shortest path between two
clusters in order to keep the number of linking genes to a
minimum. To calculate the P-value for the average shortest distance for cancer clusters, we performed a 1,000fold permutation test by randomly selecting the same
numbers of genes from the biggest connected graph component. To check if the connection degree is a confounder to clustering of cancer genes, we repeated this
analysis after dynamically generating gene bins based on
the sorted list of degrees in the cancer genes, and then
randomly choosing genes from these bins in the same distribution as the cancer genes.
Wu et al. Genome Biology 2010, 11:R53
/>
For other cancer types, we used Table S3 from [10] for
somatic mutated genes in breast and colorectal cancers,
and Tables S3, S4, and S5 from [11] for somatic mutated
and CNV genes in pancreatic cancers.
All network diagrams were drawn with Cytoscape [97].
The functional enrichment analyses for pathways and GO
annotations were based on binomial test. False discovery
rates were calculated based on 1,000 permutations on all
genes in the FI network.
Page 21 of 23
2.
3.
4.
5.
6.
7.
Enhanced experimental SkyPainter
Skypainter is a web application implemented in the Reactome web site for gene or protein over-representation
analysis [23]. We augmented the function of the original
Skypainter by adding predicted FI data. The enhanced
Skypainter was implemented using the Google web toolkit [98].
8.
9.
10.
Additional material
Additional file 1 Supplementary materials.
Additional file 2 FI database mysql dump file.
Additional file 3 Six FI files plus one read-me file explaining what
these files are.
Abbreviations
CNV: copy number variation; EGFR: epidermal growth factor receptor; FI: functional interaction; GBM: glioblastoma multiforme; GO: Gene Ontology; HPRD:
Human Protein Reference Database; NBC: naïve Bayes classifier; PPI: proteinprotein interaction; TCGA: The Cancer Genome Atlas; TGF: transforming growth
factor; TNC: tenascin-C.
Authors' contributions
GW designed the study, constructed the FI network, did network analysis for
cancer data sets, and drafted the manuscript. XF studied biological properties
of the FI network. LS conceived of the study, participated in its design, and
edited the manuscript. All authors have read and approved the final manuscript.
Acknowledgements
The authors wish to thank the whole Reactome team: Ewan Birney, Michael
Caudy, David Croft, Bernard de Bono, Peter D'Eustachio, Phani Garapati, Marc
Gillespie, Gopal Gopinath, Jill Hemish, Henning Hermjakob, Bijay Jassal, Alex
Kanapin, Suzanna Lewis, Shahana Mahajan, Lisa Matthews, Bruce May, Esther
Schmidt, and Imre Vastrik. The data and data model from the Reactome project
form the basis of this work. We thank Ethan Cerami of MSKCC for discussions
on network module discovery that inspired our choice of the edge-betweenness algorithm [78]. We also wish to thank Paul Boutros, Irina Kalatskaya and
Shannon McWeeney for their comments on the draft manuscript. We are also
indebted to Rzhetsky's group, who provided us with the text-mined PPI data
set, and to Zhang's group, who provided us with the TRED database. This work
was supported by a NIH grant (P41 HG003751).
Author Details
1Ontario Institute for Cancer Research, MaRS Centre, South Tower, 101 College
Street, Suite 800, Toronto, ON M5G 0A3, Canada, 2Cold Spring Harbor
Laboratory, One Bungtown Road, Cold Spring Harbor, NY 11724, USA and
3Stony Brook University, Stony Brook, NY 11794, USA
Received: 12 January 2010 Revised: 16 March 2010
Accepted: 19 May 2010 Published: 19 May 2010
Genome Biologyaccess 11:R53distributed under the terms of the Creative Commons Attribution License ( which permits unrestricted use, distribution, and reproduction in any medium, provided the original work is properly cited.
© 2010 Wu et al.;2010, from:
This article is available article />is an open licensee BioMed Central Ltd.
References
1. Hanahan D, Weinberg RA: The hallmarks of cancer. Cell 2000, 100:57-70.
11.
12.
13.
14.
15.
16.
17.
18.
19.
Vogelstein B, Kinzler KW: Cancer genes and the pathways they control.
Nat Med 2004, 10:789-799.
Itoh S, Itoh F, Goumans MJ, Ten Dijke P: Signaling of transforming
growth factor-beta family members through Smad proteins. Eur J
Biochem 2000, 267:6954-6967.
Massagué J: TGFbeta in cancer. Cell 2008, 134:215-230.
Dumont N, Arteaga CL: Transforming growth factor-beta and breast
cancer: Tumor promoting effects of transforming growth factor-beta.
Breast Cancer Res 2000, 2:125-132.
Donovan J, Slingerland J: Transforming growth factor-beta and breast
cancer: Cell cycle arrest by transforming growth factor-beta and its
disruption in cancer. Breast Cancer Res 2000, 2:116-124.
Kretzschmar M: Transforming growth factor-beta and breast cancer:
Transforming growth factor-beta/SMAD signaling defects and cancer.
Breast Cancer Res 2000, 2:107-115.
Wakefield LM, Yang YA, Dukhanina O: Transforming growth factor-beta
and breast cancer: Lessons learned from genetically altered mouse
models. Breast Cancer Res 2000, 2:100-106.
Barcellos-Hoff MH, Ewan KB: Transforming growth factor-beta and
breast cancer: Mammary gland development. Breast Cancer Res 2000,
2:92-109.
Wood LD, Parsons DW, Jones S, Lin J, Sjöblom T, Leary RJ, Shen D, Boca
SM, Barber T, Ptak J, Silliman N, Szabo S, Dezso Z, Ustyanksky V, Nikolskaya
T, Nikolsky Y, Karchin R, Wilson PA, Kaminker JS, Zhang Z, Croshaw R, Willis
J, Dawson D, Shipitsin M, Willson JK, Sukumar S, Polyak K, Park BH,
Pethiyagoda CL, Pant PV, et al.: The genomic landscapes of human
breast and colorectal cancers. Science 2007, 318:1108-1113.
Jones S, Zhang X, Parsons DW, Lin JC, Leary RJ, Angenendt P, Mankoo P,
Carter H, Kamiyama H, Jimeno A, Hong SM, Fu B, Lin MT, Calhoun ES,
Kamiyama M, Walter K, Nikolskaya T, Nikolsky Y, Hartigan J, Smith DR,
Hidalgo M, Leach SD, Klein AP, Jaffee EM, Goggins M, Maitra A, IacobuzioDonahue C, Eshleman JR, Kern SE, Hruban RH, et al.: Core signaling
pathways in human pancreatic cancers revealed by global genomic
analyses. Science 2008, 321:1801-1806.
Parsons DW, Jones S, Zhang X, Lin JC, Leary RJ, Angenendt P, Mankoo P,
Carter H, Siu IM, Gallia GL, Olivi A, McLendon R, Rasheed BA, Keir S,
Nikolskaya T, Nikolsky Y, Busam DA, Tekleab H, Diaz LA Jr, Hartigan J, Smith
DR, Strausberg RL, Marie SK, Shinjo SM, Yan H, Riggins GJ, Bigner DD,
Karchin R, Papadopoulos N, Parmigiani G, et al.: An integrated genomic
analysis of human glioblastoma multiforme. Science 2008,
321:1807-1812.
Ding L, Getz G, Wheeler DA, Mardis ER, McLellan MD, Cibulskis K, Sougnez
C, Greulich H, Muzny DM, Morgan MB, Fulton L, Fulton RS, Zhang Q, Wendl
MC, Lawrence MS, Larson DE, Chen K, Dooling DJ, Sabo A, Hawes AC,
Shen H, Jhangiani SN, Lewis LR, Hall O, Zhu Y, Mathew T, Ren Y, Yao J,
Scherer SE, Clerc K, et al.: Somatic mutations affect key pathways in lung
adenocarcinoma. Nature 2008, 455:1069-1075.
The Cancer Genome Atlas Research Network (TCGA): Comprehensive
genomic characterization defines human glioblastoma genes and core
pathways. Nature 2008, 455:1061-1068.
Gortzak-Uzan L, Ignatchenko A, Evangelou AI, Agochiya M, Brown KA, St
Onge P, Kireeva I, Schmitt-Ulms G, Brown TJ, Murphy J, Rosen B, Shaw P,
Jurisica I, Kislinger T: A proteome resource of ovarian cancer ascites:
integrated proteomic and bioinformatic analyses to identify putative
biomarkers. J Proteome Res 2008, 7:339-351.
Sodek KL, Evangelou AI, Ignatchenko A, Agochiya M, Brown TJ, Ringuette
MJ, Jurisica I, Kislinger T: Identification of pathways associated with
invasive behavior by ovarian cancer cells using multidimensional
protein identification technology (MudPIT). Mol Biosyst 2008, 4:762-773.
Wang K, Li M, Bucan M: Pathway-based approaches for analysis of
genomewide association studies. Am J Hum Genet 2007 in press.
Zeeberg BR, Feng W, Wang G, Wang MD, Fojo AT, Sunshine M, Narasimhan
S, Kane DW, Reinhold WC, Lababidi S, Bussey KJ, Riss J, Barrett JC,
Weinstein JN: GoMiner: a resource for biological interpretation of
genomic and proteomic data. Genome Biol 2003, 4:R28.
Zeeberg BR, Qin H, Narasimhan S, Sunshine M, Cao H, Kane DW, Reimers
M, Stephens RM, Bryant D, Burt SK, Elnekave E, Hari DM, Wynn TA,
Cunningham-Rundles C, Stewart DM, Nelson D, Weinstein JN: HighThroughput GoMiner, an 'industrial-strength' integrative gene
ontology tool for interpretation of multiple-microarray experiments,
with application to studies of common variable immune deficiency
(CVID). BMC Bioinformatics 2005, 6:168.
Wu et al. Genome Biology 2010, 11:R53
/>
20. Subramanian A, Tamayo P, Mootha VK, Mukherjee S, Ebert BL, Gillette MA,
Paulovich A, Pomeroy SL, Golub TR, Lander ES, Mesirov JP: Gene Set
Enrichment Analysis: a knowledge-based approach for interpreting
genome-wide expression profiles. Proc Natl Acad Sci USA 2005,
102:15545-15550.
21. Cavalieri D, Castagnini C, Toti S, Maciag K, Kelder T, Gambineri L, Angioli S,
Dolara P: Eu.Gene Analyzer a tool for integrating gene expression data
with pathway database. Bioinformatics 2007, 23:2631-2632.
22. Ingenuity Pathway Analysis Software - Complete Pathways Database
[]
23. Vastrik I, D'Eustachio P, Schmidt E, Gopinath G, Croft D, de Bono B,
Gillespie M, Jassal B, Lewis S, Matthews L, Wu G, Birney E, Stein L:
Reactome: a knowledge base of biologic pathways and processes.
Genome Biol 2007, 8:R39.
24. UniProt []
25. Entrez [ />26. KEGG Pathway Database [ />27. Panther - Pathways [ />28. INOH Pathway Database []
29. BioGRID: Database of Protein and Genetic Interactions [http://
thebiogrid.org]
30. Database of Interacting Proteins []
31. Human Protein Reference Database []
32. I2D - Interologous Interaction Database [ />33. IntAct [ />34. MINT Database [ />35. Stanford Microarray Database []
36. Gene Expression Omnibus [ />37. Guda P, Chittur SV, Guda C: Comparative analysis of protein-protein
interactions in cancer-associated genes. Genomics Proteomics
Bioinformatics 2009, 7:25-36.
38. Chuang HY, Lee E, Liu YT, Lee D, Ideker T: Network-based classification of
breast cancer metastasis. Mol Syst Biol 2007, 3:140.
39. Goh KI, Cusick ME, Valle D, Childs B, Vidal M, Barabási AL: The human
disease network. Proc Natl Acad Sci USA 2007, 104:8685-8690.
40. Rambaldi D, Giorgi FM, Capuani F, Ciliberto A, Ciccarelli FD: Low
duplicability and network fragility of cancer genes. Trends Genet 2008,
24:427-430.
41. Jonsson PF, Bates PA: Global topological features of cancer proteins in
the human interactome. Bioinformatics 2006, 22:2291-2297.
42. Plaisier CL, Horvath S, Huertas-Vazquez A, Cruz-Bautista I, Herrera MF,
Tusie-Luna T, Aguilar-Salinas C, Pajukanta P: A systems genetics
approach implicates USF1, FADS3 and other causal candidate genes
for familial combined hyperlipidemia. PloS Genet 2009, 5:e1000642.
43. von Mering C, Krause R, Snel B, Cornell M, Oliver SG, Fields S, Bork P:
Comparative assessment of large-scale data sets of protein-protein
interactions. Nature 2002, 417:399-403.
44. Formstecher E, Aresta S, Collura V, Hamburger A, Meil A, Trehin A, Reverdy
C, Betin V, Maire S, Brun C, Jacq B, Arpin M, Bellaiche Y, Bellusci S, Benaroch
P, Bornens M, Chanet R, Chavrier P, Delattre O, Doye V, Fehon R, Faye G,
Galli T, Girault JA, Goud B, de Gunzburg J, Johannes L, Junier MP, Mirouse
V, Mukherjee A, et al.: Protein interaction mapping: a Drosophila case
study. Genome Res 2005, 15:376-384.
45. Kerrien S, Alam-Faruque Y, Aranda B, Bancarz I, Bridge A, Derow C, Dimmer
E, Feuermann M, Friedrichsen A, Huntley R, Kohler C, Khadake J, Leroy C,
Liban A, Lieftink C, Montecchi-Palazzi L, Orchard S, Risse J, Robbe K,
Roechert B, Thorneycroft D, Zhang Y, Apweiler R, Hermjakob H: IntAct open source resource for molecular interaction data. Nucleic Acids Res
2007, 35:D561-265.
46. Peri S, Navarro JD, Amanchy R, Kristiansen TZ, Jonnalagadda CK,
Surendranath V, Niranjan V, Muthusamy B, Gandhi TK, Gronborg M,
Ibarrola N, Deshpande N, Shanker K, Shivashankar HN, Rashmi BP, Ramya
MA, Zhao Z, Chandrika KN, Padma N, Harsha HC, Yatish AJ, Kavitha MP,
Menezes M, Choudhury DR, Suresh S, Ghosh N, Saravana R, Chandran S,
Krishna S, Joy M, et al.: Development of human protein reference
database as an initial platform for approaching systems biology in
humans. Genome Res 2003, 13:2363-2371.
47. Breitkreutz BJ, Stark C, Reguly T, Boucher L, Breitkreutz A, Livstone M,
Oughtred R, Lackner DH, Bähler J, Wood V, Dolinski K, Tyers M: The
BioGRID Interaction Database: 2008 update. Nucleic Acids Res 2008,
36:D637-D640.
Page 22 of 23
48. Flicek P, Aken BL, Ballester B, Beal K, Bragin E, Brent S, Chen Y, Clapham P,
Coates G, Fairley S, Fitzgerald S, Fernandez-Banet J, Gordon L, Gräf S,
Haider S, Hammond M, Howe K, Jenkinson A, Johnson N, Kähäri A, Keefe
D, Keenan S, Kinsella R, Kokocinski F, Koscielny G, Kulesha E, Lawson D,
Longden I, Massingham T, McLaren W, et al.: Ensembl's 10th year. Nucleic
Acids Res 2010:D557-562.
49. Lee HK, Hsu AK, Sajdak J, Qin J, Pavlidis P: Coexpression analysis of
human genes across many microarray data sets. Genome Res 2004,
14:1085-1094.
50. Prieto C, Risueno A, Fontanillo C, De Las Rivas J: Human gene
coexpression landscape: confident network derived from tissue
transcriptomic profiles. PLoS ONE 3:e3911.
51. Ashburner M, Ball CA, Blake JA, Botstein D, Butler H, Cherry JM, Davis AP,
Dolinski K, Dwight SS, Eppig JT, Harris MA, Hill DP, Issel-Tarver L, Kasarskis
A, Lewis S, Matese JC, Richardson JE, Ringwald M, Rubin GM, Sherlock G:
Gene ontology: tool for the unification of biology. Nat Genet 2000,
25:25-29.
52. Finn RD, Mistry J, Schuster-Böckler B, Griffiths-Jones S, Hollich V, Lassmann
T, Moxon S, Marshall M, Khanna A, Durbin R, Eddy SR, Sonnhammer EL,
Bateman A: Pfam: clans, web tools and services. Nucleic Acids Res 2006,
34:D247-D251.
53. Rzhetsky A, Iossifov I, Koike T, Krauthammer M, Kra P, Morris M, Yu H,
Duboué PA, Weng W, Wilbur WJ, Hatzivassiloglou V, Friedman C:
GeneWays: a system for extracting, analyzing, visualizing, and
integrating molecular pathway data. J Biomed Inform 2004, 37:43-53.
54. Witten IH, Frank E: Data Mining: Practical Machine Learning Tools and
Techniques San Francisco, CA: Morgan Kaufmann; 2005.
55. Ramani AK, Bunescu RC, Mooney RJ, Marcotte EM: Consolidating the set
of known human protein-protein interactions in preparation for largescale mapping of the human ineractome. Genome Biol 2005, 6:R40.
56. Qi Y, Bar-Joseph Z, Klein-Seetharaman J: Evaluation of different
biological data and computational classification methods for use in
protein interaction prediction. Proteins 2006, 63:490-500.
57. Ben-Hur A, Noble WS: Choosing negative examples for the predication
of protein-protein interactions. BMC bioinformatics 2006, 7(Suppl 1):S2.
58. Zhang LV, Wong SL, King OD, Roth FP: Predicating co-complexed protein
pairs using genomic and proteomic data integration. BMC
Bioinformatics 2004, 5:38.
59. Venkatesan K, Rual JF, Vazquez A, Stelzl U, Lemmens I, Hirozane-Kishikawa
T, Hao T, Zenkner M, Xin X, Goh KI, Yildirim MA, Simonis N, Heinzmann K,
Gebreab F, Sahalie JM, Cevik S, Simon C, de Smet AS, Dann E, Smolyar A,
Vinayagam A, Yu H, Szeto D, Borick H, Dricot A, Klitgord N, Murray RR, Lin C,
Lalowski M, Timm J, et al.: An empirical framework for binary
interactome mapping. Nat Methods 2009, 6:83-90.
60. Mi H, Guo N, Kejariwal A, Thomas PD: PANTHER version 6: protein
sequence and function evolution data with expanded representation
of biological pathways. Nucleic Acids Res 2007, 35:D247-D252.
61. CellMap []
62. NCI Pathway Interaction Database []
63. Kanehisa M, Goto S, Kawashima S, Okuno Y, Hattori M: The KEGG resource
for deciphering the genome. Nucleic Acids Res 2004, 32:D277-280.
64. Jiang C, Xuan Z, Zhao F, Zhang MQ: TRED: a transcriptional regulatory
element database, new entries and other development. Nucleic Acids
Res 2007:D137-140.
65. Watts DJ, Strogatz SH: Collective dynamics of 'small-world' networks.
Nature 1998, 393:440-442.
66. Barabasi A-L, Albert R: Emergence of scaling in random networks.
Science 1999, 286:509-512.
67. Wagner A, Fell DA: The small world inside large metabolic networks.
Proc Biol Sci 2001, 268:1803-1810.
68. van Noort V, Snel B, Huynen MA: The yeast coexpression network has a
small-world, scale-free architecture and can be explained by a simple
model. EMBO Rep 2004, 5:280-284.
69. CancerGenomics at cBio - Glioblastoma (TCGA) [ />cancergenomics/gbm/]
70. Müller D, Thieke K, Bürgin A, Dickmanns A, Eilers M: Cyclin E-mediated
elimination of p27 requires its interaction with the nuclear poreassociated protein mNPAP60. EMBO J 2000, 19:2168-2180.
71. Swindle CS, Tran KT, Johnson TD, Banerjee P, Mayes AM, Griffith L, Wells A:
Epidermal growth factor (EGF)-like repeats of human tenascin-C as
ligands for EGF receptor. J Cell Biol 2001, 154:459-468.
Wu et al. Genome Biology 2010, 11:R53
/>
72. KEGG Pahway: p53 signaling pathway - Homo sapiens (human) [http://
www.genome.jp/kegg/pathway/hsa/hsa04115.html]
73. Monte M, Benetti R, Collavin L, Marchionni L, Del Sal G, Schneider C:
hGTSE-1 expression stimulates cytoplasmic localization of p53. J Biol
Chem 2004, 279:11744-11752.
74. Lee J, Huang MS, Yang IC, Lai TC, Wang JL, Pang VF, Hsiao M, Kuo MY:
Essential roles of caspases and their upstream regulators in rotenoneinduced apoptosis. Biochem Biophys Res Commun 2008, 371:33-38.
75. Girvan M, Newman MEJ: Community structure in social and biological
networks. Proc Natl Acad Sci USA 2002, 99:7821-7826.
76. Dunn R, Dudbridge F, Sanderson CM: The use of edge-betweenness
clustering to investigate biological function in protein interaction
networks. BMC Bioinformatics 2005, 6:39.
77. Yoon J, Blumer A, Lee K: An algorithm for modularity analysis of directed
and weighted biological networks based on edge-betweenness
centrality. Bioinformatics 2006, 22:3106-3108.
78. Cerami E, Demir E, Schultz N, Taylor BS, Sander C: Automated network
analysis identifies core pathways in glioblastoma. PLoS One 5:e8918.
79. Experimental Enhanced Skypainter [:8080/
caBigR3WebApp/hosted/org.reactome.r3.fiview.gwt.FIView/FIView.html]
80. Hand DJ, Yu K: Idiot's Bayes: not so stupid after all? Int Stat Rev 2001,
69:385-398.
81. Markowetz F, Spang R: Inferring cellular networks - a review. BMC
Bioinformatics 2007, 8(Suppl 6):S5.
82. Vaske CJ, House C, Luu T, Frank B, Yeang CH, Lee NH, Stuart JM: A factor
graph nested effects model to identify networks from genetic
perturbations. PLoS Comput Biol 2009, 5:e1000274.
83. Cui Q, Ma Y, Jaramillo M, Bari H, Awan A, Yang S, Zhang S, Liu L, Lu M,
O'Connor-McCourt M, Purisima EO, Wang E: A map of human cancer
signaling. Mol Syst Biol 2007, 3:152.
84. BioCarta - Charting Pathways of Life [ />index.asp]
85. Lin J, Gan CM, Zhang X, Jones S, Sjöblom T, Wood LD, Parsons DW,
Papadopoulos N, Kinzler KW, Vogelstein B, Parmigiani G, Velculescu VE: A
multidimensional analysis of genes mutated in breast and colorectal
cancers. Genome Res 2007, 17:1304-1318.
86. Sjöblom T, Jones S, Wood LD, Parsons DW, Lin J, Barber TD, Mandelker D,
Leary RJ, Ptak J, Silliman N, Szabo S, Buckhaults P, Farrell C, Meeh P,
Markowitz SD, Willis J, Dawson D, Willson JK, Gazdar AF, Hartigan J, Wu L,
Liu C, Parmigiani G, Park BH, Bachman KE, Papadopoulos N, Vogelstein B,
Kinzler KW, Velculescu VE: The consensus coding sequences of human
breast and colorectal cancers. Science 2006, 314:268-274.
87. BioPAX []
88. SBML []
89. Tmm: Analysis of multiple microarray data sets [http://
bioinformatics.ubc.ca/tmm/]
90. The Gene Ontology []
91. Brachman RJ, Levesque HJ: Knowledge Representation and Reasoning San
Francisco, California: Morgan Kaufmann Publishers; 2004.
92. CancerGenomics at cBio - Glioblatom (TCGA) - DNA Copy Number
[ />93. Taylor BS, Barretina J, Socci ND, Decarolis P, Ladanyi M, Meyerson M,
Singer S, Sander C: Functional copy-number alterations in cancer. PLoS
One 2008, 3:e3179.
94. JUNG - Java Universal Network/Graph Framework [http://
jung.sourceforge.net]
95. The R Project for Statistical Computing []
96. Heatplus [ />Heatplus.html]
97. Shannon P, Markiel A, Ozier O, Baliga NS, Wang JT, Ramage D, Amin N,
Schwikowski B, Ideker T: Cytoscape: a software environment for
integrated models of biomolecular interaction networks. Genome Res
2003, 13:2498-2504.
98. Goolge Web Toolkit - Google Code [ />webtoolkit]
99. Strohmaier H, Spruck CH, Kaiser P, Won KA, Sangfelt O, Reed SI: Human Fbox protein hCdc4 targets cyclin E for proteolysis and is mutated in a
breast cancer cell line. Nature 2001, 413:316-322.
100. Ewing RM, Chu P, Elisma F, Li H, Taylor P, Climie S, McBroom-Cerajewski L,
Robinson MD, O'Connor L, Li M, Taylor R, Dharsee M, Ho Y, Heilbut A,
Moore L, Zhang S, Ornatsky O, Bukhman YV, Ethier M, Sheng Y, Vasilescu J,
Abu-Farha M, Lambert JP, Duewel HS, Stewart II, Kuehl B, Hogue K, Colwill
Page 23 of 23
101.
102.
103.
104.
105.
106.
107.
108.
109.
110.
111.
112.
113.
114.
115.
116.
117.
K, Gladwish K, Muskat B, et al.: Large-scale mapping of human proteinprotein interactions by mass spectrometry. Mol Syst Biol 2007, 3:89.
Wang Z, Bhattacharya N, Mixter PF, Wei W, Sedivy J, Magnuson NS:
Phosphorylation of the cell cycle inhibitor p21Cip1/WAF1 by Pim-1
kinase. Biochim Biophys Acta 2002, 1593:45-55.
Lang SE, McMahon SB, Cole MD, Hearing P: E2F transcriptional activation
requires TRRAP and GCN5 cofactors. J Biol Chem 2001,
276:32627-32634.
Grewal T, Enrich C: Annexins - modulators of EGF receptor signalling
and trafficking. Cell Signal 2009, 21:847-858.
Stecca B, Ruiz i Altaba A: A GLI1-p53 inhibitory loop controls neural
stem cell and tumour cell numbers. EMBO J 2009, 28:663-676.
Cooper MP, Qu L, Rohas LM, Lin J, Yang W, Erdjument-Bromage H, Tempst
P, Spiegelman BM: Defects in energy homeostasis in Leigh syndrome
French Canadian variant through PGC-1alpha/LRP130 complex. Genes
Dev 2006, 20:2996-3009.
Chen Q, Dowhan DH, Liang D, Moore DD, Overbeek PA: CREB-binding
protein/p300 co-activation of crystallin gene expression. J Biol Chem
2002, 277:24081-24089.
Mandolesi G, Gargano S, Pennuto M, Illi B, Molfetta R, Soucek L, Mosca L,
Levi A, Jucker R, Nasi S: NGF-dependent and tissue-specific transcription
of vgf is regulated by a CREB-p300 and bHLH factor interaction. FEBS
Lett 2002, 510:50-56.
Marengère LE, Waterhouse P, Duncan GS, Mittrücker HW, Feng GS, Mak
TW: Regulation of T cell receptor signaling by tyrosine phosphatase
SYP association with CTLA-4. Science 1996, 272:1170-1173.
Kato-Stankiewicz J, Ueda S, Kataoka T, Kaziro Y, Satoh T: Epidermal
growth factor stimulation of the ACK1/Dbl pathway in a Cdc42 and
Grb2-dependent manner. Biochem Biophys Res Commun 2001,
284:470-477.
Schafmayer C, Buch S, Egberts JH, Franke A, Brosch M, El Sharawy A,
Conring M, Koschnick M, Schwiedernoch S, Katalinic A, Kremer B, Fölsch
UR, Krawczak M, Fändrich F, Schreiber S, Tepel J, Hampe J: Genetic
investigation of DNA-repair pathway genes PMS2, MLH1, MSH2, MSH6,
MUTYH, OGG1 and MTH1 in sporadic colon cancer. Int J Cancer 2007,
121:555-558.
Frödin M, Jensen CJ, Merienne K, Gammeltoft S: A phosphoserineregulated docking site in the protein kinase RSK2 that recruits and
activates PDK1. EMBO J 2000, 19:2924-2934.
Caohuy H, Pollard HB: Protein kinase C and guanosine triphosphate
combine to potentiate calcium-dependent membrane fusion driven
by annexin 7. J Biol Chem 2002, 277:25217-25225.
Lee SW, Bonnah RA, Higashi DL, Atkinson JP, Milgram SL, So M: CD46 is
phosphorylated at tyrosine 354 upon infection of epithelial cells by
Neisseria gonorrhoeae. J Cell Biol 2002, 156:951-957.
Nihalani D, Wong H, Verma R, Holzman LB: Src family kinases directly
regulate JIP1 module dynamics and activation. Mol Cell Biol 2007,
27:2431-2441.
Rowland BD, Bernards R, Peeper DS: The KLF4 tumour suppressor is a
transcriptional repressor of p53 that acts as a context-dependent
oncogene. Nat Cell Biol 2005, 7:1074-1082.
Rubinstein M, Idelman G, Plymate SR, Narla G, Friedman SL, Werner H:
Transcriptional activation of the insulin-like growth factor I receptor
gene by the Kruppel-like factor 6 (KLF6) tumor suppressor protein:
potential interactions between KLF6 and p53. Endocrinology 2004,
145:3769-3777.
Gobert C, Bracco L, Rossi F, Olivier M, Tazi J, Lavelle F, Larsen AK, Riou JF:
Modulation of DNA topoisomerase I activity by p53. Biochemistry 1996,
35:5778-5786.
doi: 10.1186/gb-2010-11-5-r53
Cite this article as: Wu et al., A human functional protein interaction network and its application to cancer data analysis Genome Biology 2010, 11:R53