Báo cáo y học: "Global fitness profiling of fission yeast deletion strains by barcode sequencing" pptx
Bạn đang xem bản rút gọn của tài liệu. Xem và tải ngay bản đầy đủ của tài liệu tại đây (3 MB, 13 trang )
Han et al. Genome Biology 2010, 11:R60
/>Open Access
METHOD
© 2010 Han et al.; licensee BioMed Central Ltd. This is an open access article distributed under the terms of the Creative Commons At-
tribution License ( which permits unrestricted use, distribution, and reproduction in any
medium, provided the original work is properly cited.
Method
Global fitness profiling of fission yeast deletion
strains by barcode sequencing
Tian Xu Han
†
, Xing-Ya Xu
†
, Mei-Jun Zhang, Xu Peng and Li-Lin Du*
Abstract
A genome-wide deletion library is a powerful tool for probing gene functions and one has recently become available
for the fission yeast Schizosaccharomyces pombe. Here we use deep sequencing to accurately characterize the barcode
sequences in the deletion library, thus enabling the quantitative measurement of the fitness of fission yeast deletion
strains by barcode sequencing.
Background
Over the past decade, the availability of whole genome
sequences for several major model organisms has spurred
the development of many powerful reverse genetics
approaches and, as a consequence, brought about dra-
matic changes to the way gene functions are analyzed.
The ultimate reverse genetics tool, whole-genome dele-
tion mutant libraries, were first created for the budding
yeast Saccharomyces cerevisiae [1,2]. This resource allows
all predicted open reading frames in the budding yeast
genome to be studied by analyzing the phenotypes of
their deletion mutants. Numerous screens have been
conducted with the budding yeast deletion libraries to
uncover new genes involved in various biological path-
ways [3]. In addition, new approaches based on the dele-
tion libraries, such as synthetic genetic array analysis,
have been developed to map global genetic interaction
networks [4]. The utility of the deletion libraries goes
even beyond studying gene functions, as profiling drug-
sensitive yeast mutants has allowed the targets of thera-
peutic compounds to be defined [5-8].
The construction of the budding yeast deletion libraries
incorporated the ingenious idea of molecular barcodes,
which are a pair of 20-nucleotide-long unique DNA
sequences flanking each deletion cassette [9]. The two
barcodes for each gene are called uptag (barcode
upstream of the KanMX marker gene) and dntag (bar-
code downstream of the KanMX marker gene), respec-
tively. These barcodes revolutionized the way yeast
mutants are phenotyped by allowing thousands of mutant
strains to be pooled and analyzed together in a highly
parallel fashion. The barcodes can be easily amplified by
PCR from genomic DNA extracted from the yeast cells in
the mutant pool. The amounts of barcode PCR products
serve as a quantitative measure of the cell number of each
deletion strain in the mutant pool. Traditionally, oligonu-
cleotide microarrays have been used to deconvolute the
identity of the strains in the mutant pool and quantify the
amount of each barcode PCR product. Recently, deep
sequencing was found to perform equally well [10]. Com-
pared to one-by-one screen of individual deletion
mutants, barcode-based analyses of pooled mutants sig-
nificantly improve the throughput of screens, reduce the
amount of reagents used, and avoid the problems associ-
ated with strain cross-contamination. The most fre-
quently analyzed phenotype of pooled mutants is the
growth rates, or fitness, of the mutant strains. Fitness
profiling of mutants under hundreds of growth condi-
tions has led to the conclusion that 97% of the genes in
the budding yeast genome are required for optimal
growth under at least one condition [11]. In addition to
phenotyping single-gene mutants, barcode-based analy-
sis has also been used to study gene-gene interactions
[12,13].
Besides budding yeast, the only other major eukaryotic
model organism in which gene deletion can be carried
out with ease is the fission yeast Schizosaccharomyces
pombe. With its facile genetics, fission yeast has long
been a favorite for biologists studying cell cycle control
and chromosome dynamics [14,15]. The fission yeast
genome contains about 5,000 protein-coding genes, the
* Correspondence:
National Institute of Biological Sciences, 7 Science Park Road, Zhongguancun
Life Science Park, Beijing, 102206, PR China
†
Contributed equally
Full list of author information is available at the end of the article
Han et al. Genome Biology 2010, 11:R60
/>Page 2 of 13
smallest number among the commonly used eukaryotic
model organisms [16]. Comparative genomic analysis
showed that around 500 fission yeast genes have no
homologs in the budding yeast, but are conserved in
other eukaryotic species, including human, apparently
due to lineage-specific gene losses that happened during
the evolution of S. cerevisiae [17]. The recent availability
of genome-wide fission yeast deletion libraries has paved
the way for global analysis of fission yeast genes, allowing
researchers to take full advantage of the differences
between the two yeast models [18]. Importantly, the fis-
sion yeast deletion libraries have built-in DNA barcodes,
similar to the ones used in the budding yeast deletion
libraries. The barcode sequences in each strain need to be
experimentally characterized as up to 30% of the bar-
codes in the budding yeast deletion libraries are known to
deviate from the original design [10,19]. Here we report a
deep sequencing-based characterization of the barcode
sequences in the deletion library and describe a fitness-
profiling pipeline that allows the analysis of a fission yeast
haploid deletion library in pooled cultures by deep
sequencing of the DNA barcodes.
Results
We used two independent deep sequencing approaches
to sequence and deduce the 20-mer barcodes in the hap-
loid Bioneer version 1.0 deletion library (Additional files
1 and 2). We obtained at least one unique barcode
sequence for 2,560 strains, which represent about 90% of
the strains in the library; and for 2,235 strains, both
unique uptag and unique dntag sequences were obtained
(Additional file 3). A byproduct of our characterization of
the barcodes is the identification of certain defects of the
deletion library, including duplicated barcodes, mis-
placed strains, and contaminated wells (Additional files 4,
5, 6, and 7).
The Illumina Genome Analyzer II sequencing platform
can generate over 10 million sequence reads in one
sequencing lane. On average, one million reads are suffi-
cient to allow each barcode in a library of 3,000 mutants
to be sequenced more than 100 times. To take advantage
of the sequencing depth and to reduce the cost of barcode
sequencing per screen, we adopted a multiplexing strat-
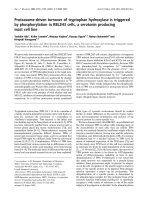
egy to sequence multiple samples in a single lane. A 4-
nucleotide sequence called the multiplex index was
incorporated into the PCR primers that harbor the Illu-
mina sequencing primer sequence (Figure 1) [20,21].
Thus, all sequencing reads begin with the index
sequences, which allow reads from different samples to
be separated. Any two indexes differ by at least two nucle-
otide substitutions, so that sample misassignment due to
sequencing errors is unlikely to happen [22]. Using such
multiplex indexes, we routinely combined six-to-nine
samples in each sequencing lane. We sequenced the PCR
products for 42 sequencing cycles. After parsing the
reads into different samples according to their 4-nucle-
otide index sequences and removing the 18-nucleotide
universal primer sequences, the remaining 20-nucleotide
sequences were compared to the barcode sequences
listed in Additional file 3. Only sequence reads perfectly
matching the barcode sequences were kept for further
analysis, which typically represented 60 to 70% of the
total reads.
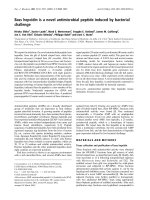
The barcode sequencing results showed good repro-
ducibility. When two technical replicates were compared,
we observed correlation coefficients > 0.95 (Figure 2a).
When two independent biological replicates were com-
pared, we observed correlation coefficients > 0.91 (Figure
2b). The presence of two barcodes in each strain allowed
the fitness to be assessed by the log ratios of both the
uptag and dntag read numbers. When we calculated the
log ratios of reads from strains grown in rich medium
(yeast extract medium with supplements (YES)) versus
minimal medium (Edinburgh minimal medium (EMM)),
the values derived from uptags agreed well with those
from dntags (Figure 2c). We further evaluated the linear-
ity and dynamic range of barcode sequencing by adding
specific amounts of spike-in cells with barcode sequences
not in the pooled library. The barcode sequence reads of
the spike-in strains showed a linear relationship with the
amounts of spike-in cells over two orders of magnitude
(Figure 2d; Additional file 8).
As a proof-of-principle test of fitness profiling based on
barcode sequencing, we analyzed the growth of deletion
mutants in rich medium (YES), minimal medium (EMM),
and lysine supplemented minimal medium (EMM+K).
We anticipated barcode sequencing to reveal auxotrophic
mutants with specific growth defects in the minimal
medium. Samples were taken after the mutant pools had
grown for one, two, three, four, and five generations in
these three types of media. We calculated the fold
changes of barcode sequencing read numbers between
control condition (YES or EMM+K) and treatment con-
dition (EMM) at multiple time points and combined
them into a single value that we called the growth inhibi-
tion score (GI), which denotes the level of depletion of
the mutants in the treatment condition (see Materials
and methods for details of the calculation; Additional
Figure 1 PCR primer design for barcode sequencing.
4-nt multiplex index
Illumina sequencing
primer sequence
dntaguptag
KanMX4
Han et al. Genome Biology 2010, 11:R60
/>Page 3 of 13
files 9 and 10). Mutants that grow normally in both con-
ditions should have GI values around zero, whereas the
GI values for auxotrophic mutants are expected to be
around 1.
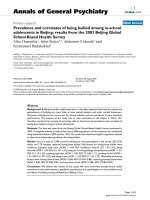
In Figure 3a we display in a scatter plot the calculated
GI values of the mutants grown in rich versus minimal
medium (YES versus EMM). The GI values for the major-
ity of the strains fall within -0.5 to 0.5, and the outliers
beyond this range are mostly mutants with GI values
higher than 0.5. Among these outliers are amino acid
auxotrophic mutants, such as the previously known Lys-,
Arg-, and His- mutants, which are highlighted in the fig-
ure. We applied Gene Ontology (GO) term enrichment
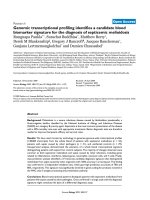
Figure 3 Auxotrophic mutants were revealed by barcode se-
quencing. (a) The growth inhibition scores (GI) of the deletion mu-
tants grown in rich medium (YES) versus minimal medium (EMM). The
strains are ordered on the x-axis according to their positions in the 96-
well plates. There are a total of 19 fission yeast genes in the genome
database with three-letter names including lys, arg, or his. A calculated
GI value is available for 13 of them. These 13 genes whose mutants are
known to be auxotrophic for lysine, arginine, or histidine are highlight-
ed in red, blue, and green, respectively. (b) Genes annotated as amino
acid biosynthesis genes [GO:0008652] were enriched among the mu-
tants with the highest growth inhibition scores (GI) for YES versus EMM
growth conditions. The three pie charts display the percentages of
amino acid biosynthesis genes among the genes with the top 50 GI
values, among the genes with GI values higher than 0.5, and among all
the genes with a GI value. (c) The growth inhibition scores (GI) of the
deletion mutants grown in lysine supplemented minimal medium
(EMM+K) versus minimal medium (EMM). The seven genes annotated
as lysine biosynthesis genes [GO:0009085] are highlighted in red.
5.0−0.05.00.15.1
his5
lys2
lys3
lys7
lys4
his7
arg12
arg6
arg3
arg11
arg4
lys1
his1
other
amino acid synthesis
top 50 ranked genes genes with
GI > 0.5
all genes
5.0−0.05.00.15.1
EMM+K vs. EMM
YES vs. EMM
lys2
lys3
lys7
lys4
SPBC3B8.03
lys1
SPAC31G5.04
(a)
(b)
(c)
Deletion strain
Deletion strain
GIGI
48%
19%
2%
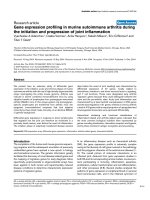
Figure 2 Reproducibility and linearity of barcode sequencing. (a)
Comparison of the barcode sequence read numbers in two technical
replicates. Aliquots of the frozen pool of library strains were processed
for genomic DNA extraction and barcode PCR in two independent ex-
periments conducted 6 months apart. The barcodes were sequenced
in two separate sequencing runs. The sequence read numbers were
normalized by total numbers of reads matching either uptags or dn-
tags (listed in Additional file 3). The total matched reads were adjusted
to 1 million for uptags or dntags of each sample. Only barcodes with
read numbers > 0 in both samples are shown. (b) Comparison of bar-
code sequence read numbers in two biological replicates. Pooled li-
brary strains were grown for five generations in rich medium in two
independent experiments conducted 6 months apart and the bar-
codes were sequenced in two separate sequencing runs. The total
matched reads were adjusted to 1 million for uptags or dntags of each
sample. Only barcodes with read numbers > 0 in both samples are
shown. (c) Comparison of log ratios of barcode read numbers calculat-
ed using uptags and dntags. Pooled mutants grown in rich medium
(YES) and minimal medium (EMM) for five generations were used for
barcode sequencing analysis. We plot the log ratios of 1,881 strains,
which satisfy the condition that read numbers of both uptag and dn-
tag in YES ≥12, and read numbers of both uptag and dntag in EMM >
0. (d) The linearity and dynamic range of barcode sequencing assessed
using spike-in controls. A rad32 deletion strain and a rad26 deletion
strain from the Bioneer version 1.0 upgrade package (M-1030H-U)
were spiked into 24 version 1.0 pooled samples that had been grown
in minimal or rich medium for different generations. The ratios be-
tween the cell number of each spike-in strain and the total cell number
of the version 1.0 pooled strains were 1/200, 1/1,000, 1/2,500, 1/5,000,
1/10,000, and 1/20,000. The read numbers were normalized by total
matched reads of the version 1.0 strains. Only uptag reads of the rad32
strain are plotted here. See Additional file 8 for the dntag reads of the
rad32 strain and the barcode reads of the rad26 deletion strain.
1/12800 1/3200 1/800 1/200
567891011
spike-in ratio
0 5 10 15
log2(normalized reads)
0 5 10 15
log2(normalized reads)
uptag (R = 0.958)
dntag (R = 0.967)
-4-2 02468
log2(YES/EMM) (uptag)
-4-2 02468
log2(YES/EMM) (dntag)
R = 0.8
0 5 10 15
uptag (R = 0.919)
dntag (R = 0.951)
log2(normalized reads)
0 5 10 15
log2(normalized reads)
log2(normalized reads)
(a)
(c) (d)
(b)
R = 0.97
Technical replicates Biological replicates
Han et al. Genome Biology 2010, 11:R60
/>Page 4 of 13
analysis to see what types of genes are overrepresented
among the genes whose mutants have the highest GI val-
ues. Among the top 50 ranked genes, 24 have a GO anno-
tation of amino acid biosynthesis [GO:0008652], which is
the ontology term with the highest level of enrichment
(24 out of 50, P-value = 1.40e-26; Figure 3b). It was previ-
ously reported that many fission yeast mutants defective
for mitochondrial function can grow in rich medium but
cannot grow in EMM medium unless an antioxidant sup-
plement is provided [23,24]. In agreement with previous
observations, we found that genes encoding mitochon-
drial proteins [GO:0005739] were also significantly
enriched among the mutants with GI values higher than
0.5 (51 out of 160, P-value = 1.90e-08).
Classical fission yeast genetics has isolated lysine aux-
otrophic mutants corresponding to seven genes, which
encode enzymes involved in lysine biosynthesis [25]. Five
of them, lys1, lys2, lys3, lys4, and lys7, have been cloned.
In addition, two other genes, SPAC31G5.04 and
SPBC3B8.03, have also been classified by GO annotation
as lysine biosynthesis genes based on sequence homology
[GO:0009085] [26]. All seven of these genes have corre-
sponding deletion mutants in the Bioneer version 1.0
library. When we calculated the GI values for the
EMM+K versus EMM growth conditions, these seven
annotated lysine biosynthesis genes were among the top
ten with the highest GI values (Figure 3c). The enrich-
ment of expected auxotrophic mutants in the analyses of
YES versus EMM and EMM+K versus EMM conditions
led us to conclude that barcode sequencing is a sensitive
and reliable method for identifying mutants with a signif-
icant fitness difference between two growth conditions.
To explore the potential of barcode sequencing in pro-
filing mutants hypersensitive to stress conditions, we
decided to examine the fitness changes of the deletion
mutants in response to a microtubule depolymerizing
drug, thiabendazole (TBZ), and three types of genotox-
ins: the topoisomerase I inhibitor camptothecin (CPT),
the ribonucleotide reductase inhibitor hydroxyurea (HU),
and UV irradiation. The modes of action of these four
agents are well known and many genes conferring resis-
tance to these agents have been previously characterized,
thus allowing us to assess the performance of barcode
sequencing-based fitness profiling. To test the reproduc-
ibility of barcode sequencing and the use of replicates to
reduce the influence of experimental noise, we performed
three independent experiments. For two experiments
(called A and B) the treatment doses were the same,
whereas in the third experiment (called C) the doses were
doubled. In each experiment, a pooled mutant culture
grown in YES medium was split into five subcultures at
the starting time point. Four of them were treated with
TBZ, HU, CPT, or UV, and the last one was left untreated
as the control. Cell growth was monitored by OD600 and
samples for barcode sequencing were collected after the
population had doubled five times. Again, a GI value was
calculated for each mutant as an indicator of the fitness
difference between each pair of control and treatment
conditions (Additional file 11).
In Figure 4a, GI values of control versus treatment with
50 J/m
2
UV in experiment A (UV_A) are displayed in a
scatter plot. Most of the mutants with GI values > 0.5 cor-
respond to known DNA damage response (DDR) genes
(Figure 4b), reflecting the fact that DDR is one of the
most intensively studied areas in fission yeast biology.
The percentages of known DDR genes become lower
among the genes with GI values between 0.15 and 0.5,
even though such GI values still significantly deviate from
the average of all GI values (Median + 3 × Normalized
interquartile range = 0.14 for the distribution of GI values
in UV_A). To reduce false positives due to experimental
noise, in addition to a GI value cutoff based on the GI
value distribution, we introduced a G-test P-value cutoff
to remove mutants with less reliable GI values (see Mate-
rials and methods for details). Furthermore, we required
that in order for a gene to be identified as a hit, its dele-
tion mutant must pass both the GI value filtering and the
P-value filtering in at least two out of three independent
experiments. After applying these filtering steps, only 33
out of the 83 mutants with GI values ≥0.15 in UV_A were
eventually identified as UV hypersensitive hits. The per-
centages of hits in relation to GI values show a similar
trend as the percentages of known DDR genes (compare
Figure 4c to Figure 4b); namely, mutants with higher GI
values are more likely to be selected as hits. Compared to
using a cutoff of GI ≥0.15 alone, the percentage of known
DDR genes increases from 34% (28 out of 83) to 67% (22
out of 33), a two-fold enrichment. Thus, we conclude that
our multi-step filtering scheme based on data from multi-
ple experiments allowed us to distinguish genuinely sen-
sitive mutants, especially the ones with mild sensitivity,
from mutants with spuriously high GI values in one
experiment due to experimental noise.
Using data from these three experiments and the hit
identification criteria described above, we identified 68
TBZ-sensitive mutants, 113 CPT-sensitive mutants, 23
HU-sensitive mutants, and 38 UV-sensitive mutants
(Additional files 12, 13, 14, and 15). When GO term
enrichment analysis was applied to the hit genes, we
found that, as expected, genes involved in nuclear divi-
sion, a microtubule-mediated process, are heavily
enriched among the TBZ-sensitive hits, whereas genes
involved in DDR or certain DDR signaling pathways are
enriched with the highest statistical significance among
the CPT, HU, and UV hits (Figure 4d). We noticed that a
number of hit genes not associated with the enriched GO
terms do have literature support for their identification as
sensitive hits. For example, two genes encoding telom-
Han et al. Genome Biology 2010, 11:R60
/>Page 5 of 13
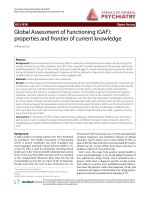
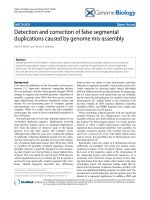
Figure 4 Profiling of mutants hypersensitive to a microtubule-depolymerizing drug and three genotoxic agents. The mutant pools grown in
YES medium were treated with thiabendazole (TBZ), camptothecin (CPT), hydroxyurea (HU), and UV radiation. Three independent experiments, called
A, B, and C, were conducted with an untreated control sample included in each experiment. The treatment doses were the same for experiments A
and B, while in experiment C the doses were doubled. (a) The growth inhibition scores (GI) of control versus 50 J/m
2
UV treatment (experiment UV_A).
Strains with GI values > 0.5 are highlighted in red. (b) Genes with high GI values in experiment UV_A are more strongly associated with the GO anno-
tation of DNA damage response (DDR) genes. The 83 genes whose GI ≥0.15 in experiment UV_A are classified according to whether they are associ-
ated with the GO term 'response to DNA damage stimulus' [GO:0006974]. (c) Genes with high GI values in experiment UV_A are more likely to be
identified as hypersensitive hits by surpassing the GI and P-value cutoffs more than once in three independent experiments. The 83 genes whose GI
≥0.15 in experiment UV_A are classified according to whether they are selected as hypersensitive hits. (d) The GO terms most highly enriched among
the hypersensitive mutants identified by barcode sequencing. (e) Hierarchical clustering analysis of the hypersensitive mutants identified by barcode
sequencing. For a detailed view of the heat map, see Additional file 18.
rad17
rad9
hus1
rad1
rhp18
rad8
ubc13
rhp14
rhp23
rad2
rad13
top1
-0.5 0.5
GI
Sensitive Resistant
PRR, NER, and UVER genes
9-1-1 complex and its loader
TBZ_A
10 mg/l
TBZ_C
20 mg/l
TBZ_B
10 mg/l
CPT_B
6 μM
CPT_C
12 μM
CPT_A
6 μM
HU_A
3 mM
HU_C
6 mM
HU_B
3 mM
UV_A
50 J/m
2
UV_C
100 J/m
2
UV_B
50 J/m
2
Deletion strain
(a) (b)
(c)
(d)
(e)
GI
0 0.5 1.0
0
5
10
15
20
25
30
non-hit
hit
0
5
10
15
20
25
30
non-DDR
DDR
>0.9
0.5-0.9
0.3-0.5
0.2-0.3
0.15-0.2
Number of genesNumber of genes
GI
>0.9
0.5-0.9
0.3-0.5
0.2-0.3
0.15-0.2
GI
Han et al. Genome Biology 2010, 11:R60
/>Page 6 of 13
erase subunits, trt1 and est1, are among the UV-sensitive
hit genes. It is known that telomerase mutants become
hypersensitive to DNA damage when their chromosomes
are circularized [27], an event that probably happened to
the telomerase mutants in the deletion library during
propagations. A gene encoding the plasma membrane
transporter for the vitamin pantothenate, liz1, was identi-
fied as a HU-sensitive hit in our fitness profiling experi-
ments, consistent with previous reports that liz1 mutant
cells undergo catastrophic mitosis in the presence of HU
[28,29].
A genome-wide screen for fission yeast mutants hyper-
sensitive to DNA damaging agents has recently been
reported by Deshpande et al. [30]. Different from our
barcode-based profiling, Deshpande et al. used an earlier
version of the Bioneer haploid deletion library (beta ver-
sion) and performed the screen using a plate-based assay.
The mutants of about 2,400 genes exist in both versions
of the library and thus the screening results for these
mutants should, in theory, be comparable. However,
mutants of the same genes in the two libraries may not be
identical strains. With this caveat in mind, we compared
our screen hits with the Deshpande screen hits for the
two treatments both Deshpande et al. and we used, CPT
and HU (Additional files 16 and 17). Deshpande et al.
reported 119 CPT-sensitive mutants, 113 of which are
present in the version 1.0 library we used. Among these
mutants, 102 have at least one barcode decoded by us and
98 have enough sequence reads in the control samples to
have GI values calculated in more than one experiment.
Thus, 98 out of 119 Deshpande CPT hits are scorable by
our barcode sequencing assay. We report here 113 CPT-
sensitive hits, 100 of which are present in the beta version
library Deshpande et al. used. The two CPT hit lists over-
lap by 47 mutants, which represent 47% of our hits
detectable by Deshpande et al., and 48% of the Desh-
pande hits detectable by us. For HU, the two screen hit
lists overlap by 11 mutants, which represent 52% of our
hits detectable by Deshpande et al., and 17% of the Desh-
pande hits detectable by us. The possible reasons for the
discrepancy between the two screening results include
the growth condition difference (solid versus liquid
medium), different duration of treatment (48 hours ver-
sus 5 generations), different treatment doses, and the
absence of competition between strains in the plate for-
mat versus the presence of competing strains in the
pooled screening format. The levels of overlap we see
here are similar to the reported overlap (30 to 60%)
between solid-medium-based screens and barcode-based
pooled mutant screens performed using budding yeast
deletion libraries [31].
To reveal patterns of fitness changes in response to
TBZ and genotoxin treatments, we applied clustering
analysis to the GI values of the 203 hit genes in 12 treat-
ment conditions (Figure 4e; Additional file 18). The den-
drogram for the 12 treatment conditions plotted on the
horizontal axis indicates that the three types of genotoxic
perturbations have a closer relationship to each other
than to the microtubule toxin TBZ, consistent with the
mechanisms of action of these agents. The three indepen-
dent experiments for each type of treatment always clus-
ter together, indicating that the barcode sequencing data
are reproducible and the two different doses for each type
of treatment induced similar fitness changes, at least for
most of the sensitive mutants. Within each treatment
cluster, experiments A and B did not always cluster
together even though the same treatment doses were
applied. This is probably due to the fact that experiment
A was conducted 5 months earlier than the other two
experiments, whereas experiments B and C were carried
out in the same week. On the vertical axis, genes whose
mutants showed similar patterns of fitness alterations
cluster together. As expected, genes grouped together by
their fitness profiles often are the ones acting in the same
or related biological pathways. For example, as high-
lighted in Figure 4e, four genes whose mutants showed
increased sensitivity to all three types of genotoxins but
not to TBZ cluster together and correspond to the genes
encoding the proliferating cell nuclear antigen (PCNA)-
like checkpoint clamp complex Rad9-Rad1-Hus1 (9-1-1
complex) and the clamp loader protein Rad17 [32].
Another group of genes whose mutants were uniquely
sensitive to UV cluster together, and these genes are
involved in three UV repair pathways in the fission yeast,
namely, postreplication repair, nucleotide excision repair,
and the UVDE endonuclease-dependent repair pathway
[33,34]. These examples demonstrate that barcode
sequencing-based fitness profiling is a promising
approach to establishing functional relationships between
fission yeast genes.
Screening for mutants resistant to a drug may provide
unique clues to unveil the mechanism through which the
drug acts [35]. However, an extensive budding yeast data-
set of barcode-based surveying of bioactive compounds
has not been exploited to define truly drug-resistant
mutants, presumably due to difficulties in distinguishing
true positives from experimental artifacts [11,36]. Thus,
it is a welcome surprise that our profiling of CPT- and
TBZ-induced fitness changes has allowed bona fide drug-
resistant mutants to stand out from all the other mutants
(Figure 5).
Top1 is the in vivo target of CPT and the sensitivity of
fission yeast cells to CPT can be completely abolished by
a top1 mutation [37]. The top1 deletion mutant displayed
mild sensitivity to HU and was among the 203 hypersen-
sitive hits. Upon inspection of the clustering heat map,
we noticed that the top1 mutant had GI values below zero
in the three CPT treatment experiments (Figure 4e; GI =
Han et al. Genome Biology 2010, 11:R60
/>Page 7 of 13
-0.465 in CPT_A, -0.295 in CPT_B, -0.78 in CPT_C), sug-
gesting that it gained a growth advantage compared to
the mutant pool as a whole in the presence of CPT. When
the GI values of all mutants were compared, we found
that the GI values of the top1 mutant were the lowest in
experiments CPT_A and CPT_C, and ranked the third
lowest in experiment CPT_B (Figure 5a; Additional file
11). Among the three CPT treatment experiments, the
higher dose treatment in CPT_C allowed the top1 mutant
to distinguish itself more from all the other strains with a
GI value of -0.78, which corresponds to a roughly 15-fold
increase in abundance in the pooled culture after five
population doublings. The mutants of two other genes,
cpd1 and gcd10, also displayed conspicuously low GI val-
ues in CPT treatments (Figure 5a). These two genes
encode the orthologs of the two subunits of a tRNA(1-
methyladenosine) methyltransferase in S. cerevisiae and
human [38,39], suggesting that a defect in tRNA modifi-
cation may allow cells to become CPT resistant.
Two fission yeast kinesin-8 family proteins, Klp5 and
Klp6, are required for normal microtubule dynamics, and
disruption of either of their genes leads to hyper-stable
microtubules and resistance to TBZ [40,41]. Loss-of-
function mutants of klp5 and klp6 are the most TBZ-
resistant fission yeast mutants we could obtain through a
transposon-mediated insertional mutagenesis screen for
TBZ-resistant mutants (J Li and L-L Du, manuscript in
preparation). The mutant of klp6 but not klp5 is present
in the Bioneer deletion library. The GI values of the klp6
mutant in the three TBZ treatment experiments were -
0.08 for TBZ_A, -0.03 for TBZ_B, and -0.8 for TBZ_C
(Figure 5b; Additional file 11). When we ranked the GI
values of all mutants from the lowest to the highest, the
klp6 mutant was ranked number one in TBZ_C, whereas
in TBZ_A and TBZ_B it was not among the top 200, sug-
gesting that the klp6 mutant grew at rates similar to the
mutant pool as a whole in 10 mg/l TBZ, but significantly
outpaced other mutants in 20 mg/l TBZ. The second-
ranked mutant in TBZ_C is the deletion mutant of
kap113, which encodes an importin β family protein. An
independently made kap113 deletion mutant was previ-
ously reported to grow better than wild type on YES
plates containing 20 mg/l TBZ [42]. Similar to the klp6
mutant, in our fitness profiling assays, the kap113 mutant
only manifested its growth advantage in a higher dose
TBZ treatment (Figure 5b).
To our knowledge, no genome-wide screen for TBZ-
sensitive fission yeast mutants has been reported until
this study; thus, our dataset may offer a unique chance to
infer functions of previously unknown genes involved in
Figure 5 Camptothecin- and thiabendazole-resistant mutants were revealed by barcode sequencing. (a) The growth inhibition scores (GI) of
control versus CPT treatment (experiments CPT_B and CPT_C). Strains with GI values lower than -0.5 in CPT_C are highlighted in red. (b) The growth
inhibition scores (GI) of control versus TBZ treatment (experiments TBZ_B and TBZ_C). The two strains with lowest GI values in TBZ_C are highlighted
in red.
Deletion strain Deletion strain
Deletion strainDeletion strain
GI
0 0.5-0.5
GI
0 0.5-0.5
GI
0 0.5-0.5
GI
0 0.5-0.5
(a)
(b)
CPT_B (6 μM)
TBZ_B (10 mg/l) TBZ_C (20 mg/l)
CPT_C (12 μM)
Han et al. Genome Biology 2010, 11:R60
/>Page 8 of 13
microtubule organization and chromosome segregation.
Fission yeast mutants defective in centromere silencing
are known to be hypersensitive to TBZ [43-45], and such
mutants were indeed enriched by our screen. Among the
68 genes whose mutants were found to be hypersensitive
to TBZ, 9 (cid12, ers1, arb1, arb2, clr4, raf1, rik1, swi6,
and chp1) are associated with the GO term 'chromatin
silencing at centromere' ([GO:0030702], P-value = 2.88e-
06) and are involved in the RNA interference (RNAi)-
mediated heterochromatin assembly pathway [46]. These
genes do not have orthologs in the budding yeast S. cere-
visiae, which has lost the RNAi machinery during evolu-
tion [47,48]. There are ten other genes without apparent
S. cerevisiae orthologs in our TBZ hypersensitive gene list
[17]. We predicted that some, especially those of
unknown function, might be involved in centromere
silencing. We focused on two genes that are currently
annotated as uncharacterized sequence orphans,
SPBP8B7.28c and SPBC2G2.14, whose protein products
were shown to be nuclear localized by a genome-wide
localization study [49]. The individual Bioneer deletion
strains of these two genes were verified by PCR analysis
and their TBZ sensitivity confirmed by a plate assay (data
not shown). We introduced a centromere silencing
marker, otr1R(SphI)::ade6+, into these mutants [50]. The
mutant of SPBP8B7.28c but not SPBC2G2.14 failed to
silence the expression of the ade6+ gene inserted at the
centromere otr repeat region, indicating that
SPBP8B7.28c plays an essential role in maintaining nor-
mal chromatin state at centromeres (Figure 6a and data
not shown). Interestingly, a PSI-BLAST analysis revealed
that even though the protein encoded by SPBP8B7.28c
has no detectable homolog in S. cerevisiae, it shares
homology with proteins from other fungi species that are
known to have RNAi pathways [51] (Figure 6b). A recent
paper by Bayne et al. [52] (published after this paper was
submitted) reported the same phenotypes of the mutant
of SPBP8B7.28c (named stc1 by Bayne et al.) and estab-
lished it as a crucial link between RNAi and heterochro-
matin formation.
Discussion
Deep sequencing offers several appealing advantages over
microarrays - for example, no need to design and build
microarrays, avoidance of the problems associated with
cross-hybridization, and potentially more accurate quan-
tification with the 'digital' counts of sequence reads [53].
Thus, it has found wide use in applications previously
dominated by microarrays, including fitness profiling of
barcoded budding yeast deletion libraries [10]. To fully
take advantage of the power of barcode sequencing, it is
necessary to accurately sequence the barcodes in the
deletion strains, as 20 to 30% of the barcodes in the bud-
ding yeast deletion library have been shown to deviate
from the original design [10,19]. The barcode sequences
we report here are supported by two independent sets of
deep sequencing data and have been validated by the fit-
ness profiling assays we conducted. These sequences and
the procedures described here should allow any lab with
access to a second-generation sequencer to conduct high-
throughput barcode-based analysis of fission yeast dele-
tion mutants. The multiplexed sequencing approach
reduced the reagent cost of profiling each sample to less
than US$100. Different from a recent report on the use of
barcode sequencing to analyze budding yeast deletion
libraries [10], our multiplexing approach does not require
two-step sequencing, and thus the samples can be
sequenced exactly the same way as any routine single-end
sequencing sample on an Illumina Genome Analyzer.
Recently, deep sequencing of transposon-induced
mutants has been applied to phenotyping bacteria
mutant pools [54-57]. Similar approaches, when devel-
oped for fission yeast, may provide an alternative choice
to the deletion libraries for functional genomics studies.
We believe that the genome-wide fitness data reported
here are useful resources for understanding the functions
of many fission yeast genes. In particular, our identifica-
tion of 203 mutants hypersensitive to TBZ, CPT, HU, or
UV based on multiple independent profiling assays has
provided phenotypic evidence potentially linking a large
number of genes to mitosis and DDR, including many
genes without a GO term annotation associating them
with these processes. For previously characterized genes,
the mutant phenotypes reported here may suggest new
aspects of their physiological functions. For previously
uncharacterized genes, the barcode-based phenotyping
data can be combined with clues provided by other high-
throughput methods and comparative genomics to gen-
erate hypotheses for follow-up studies, as demonstrated
here by the identification of the heterochromatin silenc-
ing function of SPBP8B7.28c.
Genome-wide budding yeast deletion libraries have
been useful for understanding the modes of actions of
bioactive chemicals [58]. Even though barcode-based
assays in yeast chemical genomics have often focused on
detecting drug-sensitive mutants, our data suggest that
such assays are equally effective in screening for drug-
resistant mutants. The three known CPT-resistant and
TBZ-resistant fission yeast mutants displayed dose-
dependent growth advantage, suggesting that higher drug
doses are better and sometimes required for revealing
resistant mutants. Such a requirement may explain why
the top1 mutant did not behave like a resistant strain
when budding yeast deletion mutants treated with CPT
at a single dose were analyzed by barcode-based assays
[59]. In addition to top1, klp6, and kap113, a number of
other mutants also appeared to be resistant to CPT or
TBZ based on the GI values we observed in CPT_C and
Han et al. Genome Biology 2010, 11:R60
/>Page 9 of 13
TBZ_C experiments. For example, the low GI values of
the tRNA(1-methyladenosine) methyltransferase
mutants in the presence of CPT suggested a previously
unknown mechanism to achieve cellular resistance to
CPT, thus potentially offering new clues to the clinical
resistance to Top1-directed anticancer drugs [60,61].
Conclusions
We have obtained accurate barcode sequences in a hap-
loid fission yeast deletion library and validated them by
conducting fitness analysis of barcoded fission yeast dele-
tion strains in pooled cultures. The barcode sequencing
data showed good reproducibility and linearity, and we
validated the use of barcode sequencing for fitness analy-
sis by detecting auxotrophic mutants that failed to grow
in a minimal medium. We applied barcode sequencing to
profile the fitness changes of mutants upon treatment
with three types of genotoxins and the anti-microtubule
compound TBZ. More than 200 mutants hypersensitive
to at least one treatment were identified. Genes with
known functions in DDR and mitosis were highly
enriched among the hypersensitive hits. Unexpectedly,
besides sensitive mutants, fitness profiling also revealed
mutants resistant to drug treatments, including several
mutants resistant to the anticancer drug CPT. Finally, as a
demonstration of the use of barcode sequencing in
revealing new gene functions, we report the identification
of a previously uncharacterized gene required for cen-
tromere silencing.
The fission yeast S. pombe and the budding yeast S. cer-
evisiae are the two most prominent unicellular eukaryotic
model organisms, each contributing greatly to our under-
standings of many fundamental biological processes [62].
Since their first publication in 1999, the barcoded bud-
ding yeast deletion collections have markedly accelerated
the pace of discovery in diverse fields that can take advan-
tage of a yeast model [3,63]. We expect that the method
we report in this paper will help the barcoded fission
yeast deletion collections fulfill their potential and make
far-reaching contributions in the coming years.
Materials and methods
Media and chemicals
The compositions of YES and EMM media were as
described [64]. The genetic background of haploid Bion-
eer deletion strains is ura4-D18 leu1-32 ade6-M210 (or
ade6-M216); thus, we added uracil, leucine, and adenine
Figure 6 Barcode sequencing of thiabendazole-treated deletion library led to the identification of a previously uncharacterized gene re-
quired for centromere silencing. (a) The deletion mutant of SPBP8B7.28c displayed TBZ sensitivity and a centromere silencing defect. Five-fold serial
dilution of wild type (WT; DY2776), raf1Δ (DY2781), swi6Δ (DY2784), and SPBP8B7.28cΔ (DY2792) cells were spotted on agar plates of YES medium, YES
supplemented with 10 mg/l TBZ, YE medium (ade6 mutant colonies turn pink on YE plates due to a low level of adenine), and EMM supplemented
with uracil, leucine, and arginine (no adenine). These strains all harbor the otr1R(SphI)::ade6+ marker which, when expressed, allows the strains to grow
in the absence of adenine and form white colonies on YE plates [50]. (b) The protein encoded by SPBP8B7.28c shares a conserved domain with proteins
from other fungi species. The multiple sequence alignment was created with T-COFFEE [72] and visualized with BOXSHADE 3.21. Six cysteine residues
are invariant in the alignment and two FSKxQ motifs are also highly conserved. Accession numbers are [NP_596535.1] (Schizosaccharomyces pombe),
[XP_002173616.1] (Schizosaccharomyces japonicus), [EEQ92506.1] (Ajellomyces dermatitidis), [XP_002583495.1] (Uncinocarpus reesii), [XP_002379665.1]
(Aspergillus flavus), [XP_384593.1] (Gibberella zeae), [EEU42643.1] (Nectria haematococca), [XP_955929.2] (Neurospora crassa), [XP_001588826.1] (Sclero-
tinia sclerotiorum).
S. japonicus
S. pombe
A. dermatitidis
U. reesii
A. flavus
G. zeae
N. haematococca
N. crassa
S. sclerotiorum
WT
raf1
swi6
SPBP8B7.28c
YES YES + TBZ YE (low Ade) EMM (no Ade)
(a)
(b)
Δ
Δ
Δ
Han et al. Genome Biology 2010, 11:R60
/>Page 10 of 13
to the EMM medium. HU, CPT, and TBZ were from
Sigma (St. Louis, MO, USA).
Construction of a deletion strain pool
Frozen Bioneer version 1.0 haploid library in 96-well
plate format (catalog number M-1030H; received on 24
April 2008) was thawed at room temperature and 5-μl
portions of the glycerol stock were aspirated from the
bottom of the 96-well plates and transferred to deep well
plates containing YES agar medium supplemented with
150 mg/l G418 and 100 mg/l carbenicillin. After 2 days of
incubation at 30°C, liquid YES medium supplemented
with G418 was added and the strains were grown for two
more days in a shaker. The liquid cultures were pooled
together and briefly centrifuged. The cell pellets were
resuspended to a concentration of 15.0 OD600 units per
milliliter with fresh liquid YES medium containing Hog-
ness Freezing Medium. The cell suspension was aliquoted
into 1.5 ml microtubes at 0.5 ml per tube (7.5 OD600
units) and frozen at -80°C. The recipe for 10× Hogness
Freezing Medium stock was: 360 mM K
2
HPO
4
, 132 mM
KH
2
PO
4
, 17 mM sodium citrate, 4 mM MgSO
4
, 68 mM
(NH
4
)
2
SO
4
, 44% glycerol [65]. The 10× freezing medium
was mixed with YES medium at a 1:9 ratio before use.
Deletion strain pool recovery and growth
Frozen aliquots of the deletion strain pool were thawed at
room temperature and washed with YES once, then
resuspended in fresh YES liquid medium. The cells were
allowed to recover for 5 hours, during which the OD600
increased about 20%. After the recovery period, a sample
was harvested and designated as the 0 time point sample.
For experiments using EMM medium, cells were col-
lected by centrifugation at the 0 time point and washed
with EMM before being transferred into EMM medium.
For drug treatment experiments, drugs were added at the
0 time point. For UV treatment, the cells were filtered
gently onto the surface of a membrane filter with a pore
size of 0.22 μm and then irradiated with UV in a CL-1000
Ultraviolet Crosslinker (UVP, Upland, CA, USA). We
monitored the growth of pooled mutant cells by measur-
ing the OD600 of the culture. The cultures were main-
tained in log phase by diluting with fresh medium when
OD600 reached 1.0. For drug treatment experiments,
drugs were added to the same concentration into the
diluting medium. We harvested 7.5 OD600 units of cells
from the cultures after growth for specific numbers of
generations.
Multiplex deep sequencing library preparation
Cells were lysed in TE buffer (10 mM Tris-HCl, 1 mM
EDTA, pH 8.0) by beating with glass beads in a FastPrep-
24 Instrument (MP Biomedicals, Solon, OH, USA).
Genomic DNA was extracted using the MasterPure Yeast
DNA Purification Kit (EPICENTRE Biotechnologies,
Madison, WI, USA). The barcodes were amplified with
Ex Taq HS DNA polymerase (TaKaRa, Otsu, Shiga,
Japan) through 30 cycles of 20 s at 94°C, 20 s at 53°C, and
20 s at 72°C. For uptags, the forward primer (upf-X) was
5'-CACGACGCTCTTCCGATCTXXXXGAG-
GCAAGCTAAGATATC-3', and the reverse primer (upr)
was 5'-AGCAGAAGACGGCATACGAGCCTTACT-
TCGCATTTA-3'. For dntags, the forward primer (dnf-X)
was 5'-CACGACGCTCTTCCGATCTXXXXCCAGT-
GTCGAAAAGTATC-3', and the reverse primer (dnr)
was 5'-AGCAGAAGACGGCATACGATTGCGTTGCG-
TAGG-3'. 'XXXX' in the forward primer sequences
denotes the 4-nucleotide multiplex indexes. The PCR
products were diluted 200-fold and used as templates for
another round of PCR to add sequences needed for Illu-
mina sequencing. The forward primer (seqf) was 5'-
AATGATACGGCGACCACCGAGATCTACACTCTTT
CCCTACACGACGCTCTTCCGATCT-3', and the
reverse primer (seqr) was 5'-CAAGCAGAAGACG-
GCATACGA-3'. The cycling parameters were: 20 cycles
of 20 s at 94°C, 20 s at 56°C, and 20 s at 72°C. The second
round PCR products were mixed together in equal molar
ratios and gel purified to use as the Illumina sequencing
template. Standard single-end sequencing primer was
used and 42 cycles of sequencing were carried out with
an Illumina Genome Analyzer II. All sequence reads
associated with this study have been deposited at the
Short Read Archive [SRA012749].
Barcode sequencing data analysis
The Illumina sequencing reads were assigned to different
samples using the 4-nucleotide multiplex index
sequences from cycle 1 to cycle 4. The sequences from
cycle 5 to cycle 22 were compared to the 18-nucleotide
universal primer sequences and only reads with no more
than two mismatches were kept. The 20-mer sequences
from cycle 23 to cycle 42 were matched with the barcode
sequences listed in Additional file 3.
The growth inhibition score (GI) was calculated by:
which is a weighted sum of the quotient of dividing the
log fold change by the number of generations. FC
g
is the
normalized fold change of read numbers (control versus
treatment ratio) at generation g. To avoid dividing by
zero, we added a pseudocount of 1 to all reads before cal-
culating the normalized fold change. We required
. Mutants whose growth is not inhibited by the
treatment will have a growth inhibition score close to 0.
The most sensitive mutants, whose cell numbers do not
GI a *log FC /g
g2g
g
=
∑
a=1
g
g
∑
Han et al. Genome Biology 2010, 11:R60
/>Page 11 of 13
increase at all during the time course, will have a growth
inhibition score around 1. To reduce noise caused by low
read numbers in the control samples, we did not calculate
the growth inhibition scores for barcodes whose read
numbers in the control samples were smaller than 12. For
a strain with both uptag and dntag sequence reads, if
growth inhibition scores were calculated for both bar-
codes, their averaged value was used for the strain. For a
strain with only one barcode having a growth inhibition
score, that score was used for the strain.
For calculating the GI values for the samples grown in
rich and minimal media for one, two, three, four, and five
generations, a
1
= a
2
= 0, and a
3
= a
4
= a
5
= 1/3. For the sam-
ples treated with TBZ and DNA damaging agents, we col-
lected cells only after five population doublings, thus GI =
log
2
FC
5
/5.
To obtain a cutoff GI value for identifying mutants
whose growth is inhibited by the treatment conditions,
we calculated the median and normalized interquartile
range (NIQR) of the distribution of GI values. NIQR =
IQR × 0.7413. Median and NIQR are robust statistical
estimates of the mean and standard deviation.
To identify mutants hypersensitive to TBZ and DNA
damaging agents, for genes with GI values available for
only one barcode, we used Median + 3 × NIQR as the GI
value cutoff; for genes with GI values available for both
uptag and dntag, we used Median + 2.5 × NIQR as the
cutoff for the averaged GI values and requested the GI
values of both uptag and dntag to be higher than Median
+ 2 × NIQR. The barcodes with low read numbers in both
the control and treatment samples tend to generate unre-
liable growth inhibition scores. To introduce another cut-
off that biases against such barcodes, we calculated the
significance values (P-values) using the G-test [66], which
is a statistical test that does not require replicates and has
been successfully used for a number of counting based
assays, including quantitative mass spectrometry and
serial analysis of gene expression (SAGE) [67-69]. For hit
identification of samples treated with TBZ and DNA
damaging agents, we requested at least one of the two
barcodes associated with a gene to have a P-value < 0.005.
Finally, we combined the results of the three independent
profiling experiments (A, B, and C) by requesting a hit
gene to surpass both the GI cutoff and the P-value cutoff
in at least two of the three experiments.
GO term analyses were conducted with AmiGO ver-
sion 1.7 using GO database release 2010-01-03 [70].
Hierarchical clustering was carried out with Cluster
3.0, using the correlation (uncentered) similarity metric
and the average linkage clustering method. The clustering
results were visualized with Java TreeView.
The gene name and gene product functional annotation
were obtained from The Sanger Centre S. pombe genome
database [71]. The ortholog relationship between fission
yeast proteins and budding yeast proteins was according
to pombe_cerevisiae ortholog table version 2.14 manually
curated by V Wood and released on 2 October 2009 [17].
Additional material
Additional file 1 Information on barcode decoding by deep sequenc-
ing.
Additional file 2 Diagrams of the two methods used to decode bar-
codes. (a) Paired-end deep sequencing. (b) Smart pooling and multiplexed
deep sequencing.
Additional file 3 The barcode sequences uniquely associated with the
mutants in Bioneer version 1.0 haploid deletion library. Column A,
gene name. Column B, well position according to information provided by
Bioneer. Column C, well position annotation: W denotes wrongly placed
strains that have been located to a different well by the smart pooling data
and PCR analysis (also separately listed in Additional file 5); M denotes the
strains that are indicated by deep sequencing to be present in more than
one well (also separately listed in Additional file 6); C denotes the wells that
are indicated by deep sequencing to be contaminated by a different strain.
Column D, uptag sequences. Column E, dntag sequences.
Additional file 4 Barcodes used by more than one deletion strain.
These barcodes cannot be assigned to unique strains and are not included
in Additional file 3. Some of the barcodes listed here have been verified by
Sanger sequencing (two examples are shown in Additional file 7a).
Additional file 5 Strains whose well positions differ from information
provided by Bioneer (annotated with the letter 'W' in Additional file
3A). These strains have all been individually verified by PCR analysis (exam-
ples shown in Additional file 7b).
Additional file 6 Strains present in more than one well (annotated
with the letter 'M' in Additional file 3). The well positions are predicted by
the smart pooling data. The two wells harboring the same strains are often
not immediately adjacent wells, and many of them are not even in the
same 96-well plates, suggesting that most of the cross-contaminations
probably had happened before we received the library from the supplier.
Some of the contaminated wells have been verified by PCR analysis (exam-
ples shown in Additional file 7b).
Additional file 7 Experimental verification of barcode sequences and
strain locations revealed by deep sequencing. (a) Sanger sequencing of
deletion cassettes sharing the same barcodes. (b) PCR analysis of misplaced
strains and those present in more than one well.
Additional file 8 The linearity and dynamic range of barcode
sequencing assessed using spike-in controls. A rad32 deletion strain and
a rad26 deletion strain from the Bioneer version 1.0 upgrade package (M-
1030H-U) were spiked into 24 version 1.0 pooled samples that had been
grown in minimal or rich medium for different generations. The ratios
between the cell number of each spike-in strain and the total cell number
of the version 1.0 pooled strains were 1/200, 1/1,000, 1/2,500, 1/5,000, 1/
10,000, and 1/20,000. The read numbers were normalized by total matched
reads of the version 1.0 strains. (a) The normalized read numbers were plot-
ted against the spike-in ratios. (b) The observed log fold changes between
different spike-in samples were plotted against expected log fold changes.
Additional file 9 The GI values of mutants grown in rich versus mini-
mum medium (YES versus EMM).
Additional file 10 The GI values of mutants grown in lysine supple-
mented minimal medium versus minimum medium (EMM+K versus
EMM).
Additional file 11 The GI values of mutants treated with TBZ, CPT, HU,
and UV.
Additional file 12 A list of 68 TBZ-sensitive mutants and their GI val-
ues.
Additional file 13 A list of 113 CPT-sensitive mutants and their GI val-
ues.
Additional file 14 A list of 23 HU-sensitive mutants and their GI val-
ues.
Additional file 15 A list of 38 UV-sensitive mutants and their GI val-
ues.
Han et al. Genome Biology 2010, 11:R60
/>Page 12 of 13
Abbreviations
CPT: camptothecin; DDR: DNA damage response; EMM: Edinburgh minimal
medium; GI: growth inhibition score; GO: Gene Ontology; HU: hydroxyurea;
NIQR: normalized interquartile range; RNAi: RNA interference; TBZ: thiabenda-
zole; YES: yeast extract medium with supplements.
Authors' contributions
TXH performed the smart pooling, constructed the library pools, and carried
out barcode-sequencing-based screens. XYX performed the data analysis of
barcode sequencing data. MJZ analyzed the paired-end sequencing data. XP
generated the paired-end sequencing libraries. L-LD conceived the study, par-
ticipated in its design and coordination, and drafted the manuscript. All
authors read and approved the final manuscript.
Acknowledgements
We thank Robin Allshire for a strain carrying the otr1R(SphI)::ade6+ marker. We
thank Kwang-Lae Hoe for sharing results prior to publication. We thank Jian-
guang Zhang at the NIBS sequencing facility for technical support. We are
grateful to Meng-Qiu Dong and Valerie Wood for critically reading the manu-
script. This work was supported by a Chinese Ministry of Science and Technol-
ogy 863 grant to L-LD (2007AA02Z1A5).
Author Details
National Institute of Biological Sciences, 7 Science Park Road, Zhongguancun
Life Science Park, Beijing, 102206, PR China
References
1. Giaever G, Chu AM, Ni L, Connelly C, Riles L, Veronneau S, Dow S, Lucau-
Danila A, Anderson K, Andre B, Arkin AP, Astromoff A, El-Bakkoury M,
Bangham R, Benito R, Brachat S, Campanaro S, Curtiss M, Davis K,
Deutschbauer A, Entian KD, Flaherty P, Foury F, Garfinkel DJ, Gerstein M,
Gotte D, Guldener U, Hegemann JH, Hempel S, Herman Z, et al.:
Functional profiling of the Saccharomyces cerevisiae genome. Nature
2002, 418:387-391.
2. Winzeler EA, Shoemaker DD, Astromoff A, Liang H, Anderson K, Andre B,
Bangham R, Benito R, Boeke JD, Bussey H, Chu AM, Connelly C, Davis K,
Dietrich F, Dow SW, El Bakkoury M, Foury F, Friend SH, Gentalen E, Giaever
G, Hegemann JH, Jones T, Laub M, Liao H, Liebundguth N, Lockhart DJ,
Lucau-Danila A, Lussier M, M'Rabet N, Menard P, et al.: Functional
characterization of the S. cerevisiae genome by gene deletion and
parallel analysis. Science 1999, 285:901-906.
3. Scherens B, Goffeau A: The uses of genome-wide yeast mutant
collections. Genome Biol 2004, 5:229.
4. Tong AH, Evangelista M, Parsons AB, Xu H, Bader GD, Page N, Robinson M,
Raghibizadeh S, Hogue CW, Bussey H, Andrews B, Tyers M, Boone C:
Systematic genetic analysis with ordered arrays of yeast deletion
mutants. Science 2001, 294:2364-2368.
5. Giaever G, Flaherty P, Kumm J, Proctor M, Nislow C, Jaramillo DF, Chu AM,
Jordan MI, Arkin AP, Davis RW: Chemogenomic profiling: identifying the
functional interactions of small molecules in yeast. Proc Natl Acad Sci
USA 2004, 101:793-798.
6. Giaever G, Shoemaker DD, Jones TW, Liang H, Winzeler EA, Astromoff A,
Davis RW: Genomic profiling of drug sensitivities via induced
haploinsufficiency. Nat Genet 1999, 21:278-283.
7. Lum PY, Armour CD, Stepaniants SB, Cavet G, Wolf MK, Butler JS, Hinshaw
JC, Garnier P, Prestwich GD, Leonardson A, Garrett-Engele P, Rush CM,
Bard M, Schimmack G, Phillips JW, Roberts CJ, Shoemaker DD:
Discovering modes of action for therapeutic compounds using a
genome-wide screen of yeast heterozygotes. Cell 2004, 116:121-137.
8. Parsons AB, Brost RL, Ding H, Li Z, Zhang C, Sheikh B, Brown GW, Kane PM,
Hughes TR, Boone C: Integration of chemical-genetic and genetic
interaction data links bioactive compounds to cellular target
pathways. Nat Biotechnol 2004, 22:62-69.
9. Shoemaker DD, Lashkari DA, Morris D, Mittmann M, Davis RW:
Quantitative phenotypic analysis of yeast deletion mutants using a
highly parallel molecular bar-coding strategy. Nat Genet 1996,
14:450-456.
10. Smith AM, Heisler LE, Mellor J, Kaper F, Thompson MJ, Chee M, Roth FP,
Giaever G, Nislow C: Quantitative phenotyping via deep barcode
sequencing. Genome Res 2009, 19:1836-1842.
11. Hillenmeyer ME, Fung E, Wildenhain J, Pierce SE, Hoon S, Lee W, Proctor M,
St Onge RP, Tyers M, Koller D, Altman RB, Davis RW, Nislow C, Giaever G:
The chemical genomic portrait of yeast: uncovering a phenotype for all
genes. Science 2008, 320:362-365.
12. Ooi SL, Shoemaker DD, Boeke JD: DNA helicase gene interaction
network defined using synthetic lethality analyzed by microarray. Nat
Genet 2003, 35:277-286.
13. Pan X, Yuan DS, Xiang D, Wang X, Sookhai-Mahadeo S, Bader JS, Hieter P,
Spencer F, Boeke JD: A robust toolkit for functional profiling of the yeast
genome. Mol Cell 2004, 16:487-496.
14. Nurse P: A long twentieth century of the cell cycle and beyond. Cell
2000, 100:71-78.
15. Yanagida M: Basic mechanism of eukaryotic chromosome segregation.
Philos Trans R Soc Lond B Biol Sci 2005, 360:609-621.
16. Wood V, Gwilliam R, Rajandream MA, Lyne M, Lyne R, Stewart A, Sgouros J,
Peat N, Hayles J, Baker S, Basham D, Bowman S, Brooks K, Brown D, Brown
S, Chillingworth T, Churcher C, Collins M, Connor R, Cronin A, Davis P,
Feltwell T, Fraser A, Gentles S, Goble A, Hamlin N, Harris D, Hidalgo J,
Hodgson G, Holroyd S, et al.: The genome sequence of
Schizosaccharomyces pombe. Nature 2002, 415:871-880.
17. Wood V: Schizosaccharomyces pombe comparative genomics: from
sequence to systems. In Comparative Genomics: Using Fungi as Models
Edited by: Sunnerhagen P, Piskur J. Springer; 2006:233-285. [Topics in
Current Genetics]
18. Kim DU, Hayles J, Kim D, Wood V, Park HO, Won M, Yoo HS, Duhig T, Nam
M, Palmer G, Han S, Jeffery L, Baek ST, Lee H, Shim YS, Lee M, Kim L, Heo KS,
Noh EJ, Lee AR, Jang YJ, Chung KS, Choi SJ, Park JY, Park Y, Kim HM, Park SK,
Park HJ, Kang EJ, Kim HB, et al.: Analysis of a genome-wide set of gene
deletions in the fission yeast Schizosaccharomyces pombe. Nat
Biotechnol 2010, 28:617-623.
19. Eason RG, Pourmand N, Tongprasit W, Herman ZS, Anthony K, Jejelowo O,
Davis RW, Stolc V: Characterization of synthetic DNA bar codes in
Saccharomyces cerevisiae gene-deletion strains. Proc Natl Acad Sci USA
2004, 101:11046-11051.
20. Craig DW, Pearson JV, Szelinger S, Sekar A, Redman M, Corneveaux JJ,
Pawlowski TL, Laub T, Nunn G, Stephan DA, Homer N, Huentelman MJ:
Identification of genetic variants using bar-coded multiplexed
sequencing. Nat Methods 2008, 5:887-893.
21. Cronn R, Liston A, Parks M, Gernandt DS, Shen R, Mockler T: Multiplex
sequencing of plant chloroplast genomes using Solexa sequencing-
by-synthesis technology. Nucleic Acids Res 2008, 36:e122.
22. Meyer M, Stenzel U, Myles S, Prufer K, Hofreiter M: Targeted high-
throughput sequencing of tagged nucleic acid samples. Nucleic Acids
Res 2007, 35:e97.
23. Miki R, Saiki R, Ozoe Y, Kawamukai M: Comparison of a coq7 deletion
mutant with other respiration-defective mutants in fission yeast. Febs J
2008, 275:5309-5324.
24. Zuin A, Gabrielli N, Calvo IA, Garcia-Santamarina S, Hoe KL, Kim DU, Park
HO, Hayles J, Ayte J, Hidalgo E: Mitochondrial dysfunction increases
oxidative stress and decreases chronological life span in fission yeast.
PLoS One 2008, 3:e2842.
25. Ye ZH, Bhattacharjee JK: Lysine biosynthesis pathway and biochemical
blocks of lysine auxotrophs of Schizosaccharomyces pombe. J Bacteriol
1988, 170:5968-5970.
26. Aslett M, Wood V: Gene Ontology annotation status of the fission yeast
genome: preliminary coverage approaches 100%. Yeast 2006,
23:913-919.
27. Tomita K, Cooper JP: Fission yeast Ccq1 is telomerase recruiter and local
checkpoint controller. Genes Dev 2008, 22:3461-3474.
Additional file 16 Comparison of the Deshpande et al. CPT screen hits
with our profiling results.
Additional file 17 Comparison of the Deshpande et al. HU screen hits
with our profiling results.
Additional file 1818 The full heat map of the hierarchical clustering
analysis shown in Figure 4e.
Received: 3 March 2010 Revised: 14 May 2010
Accepted: 10 June 2010 Published: 10 June 2010
This article is available from: 2010 Han et al.; licensee BioMed Central Ltd. This is an open access article distributed under the terms of the Creative Commons Attribution License ( which permits unrestricted use, distribution, and reproduction in any medium, provided the original work is properly cited.Genome Biolog y 2010, 11:R60
Han et al. Genome Biology 2010, 11:R60
/>Page 13 of 13
28. Moynihan EB, Enoch T: Liz1p, a novel fission yeast membrane protein, is
required for normal cell division when ribonucleotide reductase is
inhibited. Mol Biol Cell 1999, 10:245-257.
29. Stolz J, Caspari T, Carr AM, Sauer N: Cell division defects of
Schizosaccharomyces pombe liz1- mutants are caused by defects in
pantothenate uptake. Eukaryot Cell 2004, 3:406-412.
30. Deshpande GP, Hayles J, Hoe KL, Kim DU, Park HO, Hartsuiker E: Screening
a genome-wide S. pombe deletion library identifies novel genes and
pathways involved in genome stability maintenance. DNA Repair 2009,
8:672-679.
31. Chang M, Parsons AB, Sheikh BH, Boone C, Brown GW: Genomic
approaches for identifying DNA damage response pathways in S.
cerevisiae. Methods Enzymol 2006, 409:213-235.
32. Parrilla-Castellar ER, Arlander SJ, Karnitz L: Dial 9-1-1 for DNA damage: the
Rad9-Hus1-Rad1 (9-1-1) clamp complex. DNA Repair 2004, 3:1009-1014.
33. Frampton J, Irmisch A, Green CM, Neiss A, Trickey M, Ulrich HD, Furuya K,
Watts FZ, Carr AM, Lehmann AR: Postreplication repair and PCNA
modification in Schizosaccharomyces pombe. Mol Biol Cell 2006,
17:2976-2985.
34. McCready SJ, Osman F, Yasui A: Repair of UV damage in the fission yeast
Schizosaccharomyces pombe. Mutat Res 2000, 451:197-210.
35. Ho CH, Magtanong L, Barker SL, Gresham D, Nishimura S, Natarajan P, Koh
JL, Porter J, Gray CA, Andersen RJ, Giaever G, Nislow C, Andrews B, Botstein
D, Graham TR, Yoshida M, Boone C: A molecular barcoded yeast ORF
library enables mode-of-action analysis of bioactive compounds. Nat
Biotechnol 2009, 27:369-377.
36. Pierce SE, Davis RW, Nislow C, Giaever G: Genome-wide analysis of
barcoded Saccharomyces cerevisiae gene-deletion mutants in pooled
cultures. Nat Protoc 2007, 2:2958-2974.
37. Eng WK, Faucette L, Johnson RK, Sternglanz R: Evidence that DNA
topoisomerase I is necessary for the cytotoxic effects of camptothecin.
Mol Pharmacol 1988, 34:755-760.
38. Anderson J, Phan L, Hinnebusch AG: The Gcd10p/Gcd14p complex is
the essential two-subunit tRNA(1-methyladenosine) methyltransferase
of Saccharomyces cerevisiae. Proc Natl Acad Sci USA 2000, 97:5173-5178.
39. Ozanick S, Krecic A, Andersland J, Anderson JT: The bipartite structure of
the tRNA m1A58 methyltransferase from S. cerevisiae is conserved in
humans. RNA 2005, 11:1281-1290.
40. Unsworth A, Masuda H, Dhut S, Toda T: Fission yeast kinesin-8 Klp5 and
Klp6 are interdependent for mitotic nuclear retention and required for
proper microtubule dynamics. Mol Biol Cell 2008, 19:5104-5115.
41. West RR, Malmstrom T, Troxell CL, McIntosh JR: Two related kinesins,
klp5+ and klp6+, foster microtubule disassembly and are required for
meiosis in fission yeast. Mol Biol Cell 2001, 12:3919-3932.
42. Chen XQ, Du X, Liu J, Balasubramanian MK, Balasundaram D:
Identification of genes encoding putative nucleoporins and transport
factors in the fission yeast Schizosaccharomyces pombe: a deletion
analysis. Yeast 2004, 21:495-509.
43. Ekwall K, Nimmo ER, Javerzat JP, Borgstrom B, Egel R, Cranston G, Allshire
R: Mutations in the fission yeast silencing factors clr4+ and rik1+
disrupt the localisation of the chromo domain protein Swi6p and
impair centromere function. J Cell Sci 1996, 109:2637-2648.
44. Hall IM, Noma K, Grewal SI: RNA interference machinery regulates
chromosome dynamics during mitosis and meiosis in fission yeast.
Proc Natl Acad Sci USA 2003, 100:193-198.
45. Volpe T, Schramke V, Hamilton GL, White SA, Teng G, Martienssen RA,
Allshire RC: RNA interference is required for normal centromere
function in fission yeast. Chromosome Res 2003, 11:137-146.
46. Moazed D: Small RNAs in transcriptional gene silencing and genome
defence. Nature 2009, 457:413-420.
47. Aravind L, Watanabe H, Lipman DJ, Koonin EV: Lineage-specific loss and
divergence of functionally linked genes in eukaryotes. Proc Natl Acad
Sci USA 2000, 97:11319-11324.
48. Buhler M, Gasser SM: Silent chromatin at the middle and ends: lessons
from yeasts. EMBO J 2009, 28:2149-2161.
49. Matsuyama A, Arai R, Yashiroda Y, Shirai A, Kamata A, Sekido S, Kobayashi
Y, Hashimoto A, Hamamoto M, Hiraoka Y, Horinouchi S, Yoshida M:
ORFeome cloning and global analysis of protein localization in the
fission yeast Schizosaccharomyces pombe. Nat Biotechnol 2006,
24:841-847.
50. Ekwall K, Cranston G, Allshire RC: Fission yeast mutants that alleviate
transcriptional silencing in centromeric flanking repeats and disrupt
chromosome segregation. Genetics 1999, 153:1153-1169.
51. Nakayashiki H, Nguyen QB: RNA interference: roles in fungal biology.
Curr Opin Microbiol 2008, 11:494-502.
52. Bayne EH, White SA, Kagansky A, Bijos DA, Sanchez-Pulido L, Hoe KL, Kim
DU, Park HO, Ponting CP, Rappsilber J, Allshire RC: Stc1: a critical link
between RNAi and chromatin modification required for
heterochromatin integrity. Cell 2010, 140:666-677.
53. Wold B, Myers RM: Sequence census methods for functional genomics.
Nat Methods 2008, 5:19-21.
54. Gawronski JD, Wong SM, Giannoukos G, Ward DV, Akerley BJ: Tracking
insertion mutants within libraries by deep sequencing and a genome-
wide screen for Haemophilus genes required in the lung. Proc Natl Acad
Sci USA 2009, 106:16422-16427.
55. Goodman AL, McNulty NP, Zhao Y, Leip D, Mitra RD, Lozupone CA, Knight
R, Gordon JI: Identifying genetic determinants needed to establish a
human gut symbiont in its habitat. Cell Host Microbe 2009, 6:279-289.
56. Langridge GC, Phan MD, Turner DJ, Perkins TT, Parts L, Haase J, Charles I,
Maskell DJ, Peters SE, Dougan G, Wain J, Parkhill J, Turner AK:
Simultaneous assay of every Salmonella Typhi gene using one million
transposon mutants. Genome Res 2009, 19:2308-2316.
57. van Opijnen T, Bodi KL, Camilli A: Tn-seq: high-throughput parallel
sequencing for fitness and genetic interaction studies in
microorganisms. Nat Methods 2009, 6:767-772.
58. Hoon S, St Onge RP, Giaever G, Nislow C: Yeast chemical genomics and
drug discovery: an update. Trends Pharmacol Sci 2008, 29:499-504.
59. Lee W, St Onge RP, Proctor M, Flaherty P, Jordan MI, Arkin AP, Davis RW,
Nislow C, Giaever G: Genome-wide requirements for resistance to
functionally distinct DNA-damaging agents. PLoS Genet 2005, 1:e24.
60. Pommier Y: DNA topoisomerase I inhibitors: chemistry, biology, and
interfacial inhibition. Chem Rev 2009, 109:2894-2902.
61. Rasheed ZA, Rubin EH: Mechanisms of resistance to topoisomerase I-
targeting drugs. Oncogene 2003, 22:7296-7304.
62. Forsburg SL: The best yeast? Trends Genet 1999, 15:340-344.
63. Pierce SE, Davis RW, Nislow C, Giaever G: Chemogenomic approaches to
elucidation of gene function and genetic pathways. Methods Mol Biol
2009, 548:115-143.
64. Forsburg SL, Rhind N: Basic methods for fission yeast. Yeast 2006,
23:173-183.
65. Werner E, Holder AA, Hoheisel JD: Growth and storage of YAC clones in
Hogness Freezing Medium. Nucleic Acids Res 1997, 25:1467-1468.
66. Sokal RR, Rohlf FJ: Biometry: the Principles and Practice of Statistics in
Biological Research. 3rd edition. New York: WH Freeman; 1995.
67. Old WM, Meyer-Arendt K, Aveline-Wolf L, Pierce KG, Mendoza A, Sevinsky
JR, Resing KA, Ahn NG: Comparison of label-free methods for
quantifying human proteins by shotgun proteomics. Mol Cell
Proteomics 2005, 4:1487-1502.
68. Schaaf GJ, Ruijter JM, van Ruissen F, Zwijnenburg DA, Waaijer R, Valentijn
LJ, Benit-Deekman J, van Kampen AH, Baas F, Kool M: Full transcriptome
analysis of rhabdomyosarcoma, normal, and fetal skeletal muscle:
statistical comparison of multiple SAGE libraries. FASEB J 2005,
19:404-406.
69. Zhang B, VerBerkmoes NC, Langston MA, Uberbacher E, Hettich RL,
Samatova NF: Detecting differential and correlated protein expression
in label-free shotgun proteomics. J Proteome Res 2006, 5:2909-2918.
70. Carbon S, Ireland A, Mungall CJ, Shu S, Marshall B, Lewis S: AmiGO: online
access to ontology and annotation data. Bioinformatics 2009,
25:288-289.
71. Sanger Centre S. pombe Genome Database [ />yeast/pombe/Mappings/sysID2product.txt]
72. Poirot O, O'Toole E, Notredame C: Tcoffee@igs: A web server for
computing, evaluating and combining multiple sequence alignments.
Nucleic Acids Res 2003, 31:3503-3506.
doi: 10.1186/gb-2010-11-6-r60
Cite this article as: Han et al., Global fitness profiling of fission yeast deletion
strains by barcode sequencing Genome Biology 2010, 11:R60