Báo cáo y học: "Deficiency in mouse Y chromosome long arm gene complement is associated with sperm DNA damag" pptx
Bạn đang xem bản rút gọn của tài liệu. Xem và tải ngay bản đầy đủ của tài liệu tại đây (2.16 MB, 18 trang )
Ferrezuelo et al. Genome Biology 2010, 11:R67
/>
Open Access
RESEARCH
The transcriptional network activated by Cln3
cyclin at the G1-to-S transition of the yeast cell
cycle
Research
Francisco Ferrezuelo*1, Neus Colomina1, Bruce Futcher2 and Martí Aldea1
Abstract
Background: The G1-to-S transition of the cell cycle in the yeast Saccharomyces cerevisiae involves an extensive
transcriptional program driven by transcription factors SBF (Swi4-Swi6) and MBF (Mbp1-Swi6). Activation of these
factors ultimately depends on the G1 cyclin Cln3.
Results: To determine the transcriptional targets of Cln3 and their dependence on SBF or MBF, we first have used DNA
microarrays to interrogate gene expression upon Cln3 overexpression in synchronized cultures of strains lacking
components of SBF and/or MBF. Secondly, we have integrated this expression dataset together with other
heterogeneous data sources into a single probabilistic model based on Bayesian statistics. Our analysis has produced
more than 200 transcription factor-target assignments, validated by ChIP assays and by functional enrichment. Our
predictions show higher internal coherence and predictive power than previous classifications. Our results support a
model whereby SBF and MBF may be differentially activated by Cln3.
Conclusions: Integration of heterogeneous genome-wide datasets is key to building accurate transcriptional
networks. By such integration, we provide here a reliable transcriptional network at the G1-to-S transition in the
budding yeast cell cycle. Our results suggest that to improve the reliability of predictions we need to feed our models
with more informative experimental data.
Background
In the model yeast Saccharomyces cerevisiae, the commitment to a new round of cell division takes place towards
the end of the G1 phase of the cell cycle, a process called
START [1]. This entails the unfolding of a transcriptional
program involving over 200 genes, including some
important cell cycle regulators such as the G1 cyclins
Cln1 and Cln2, S phase cyclins, a number of cell cycle
transcription factors (TFs) as well as many other genes
with functions related to DNA metabolism (replication,
repair, and so on), budding, spindle pole body duplication, and cell wall synthesis [2,3]. Many of these genes are
known or putative targets of two heterodimeric TFs
called SBF and MBF. SBF contains the DNA-binding protein Swi4, while MBF contains the Swi4-related DNAbinding protein Mbp1, and both factors contain the regu* Correspondence:
1
Departament de Ciències Mèdiques Bàsiques, Institut de Recerca Biomèdica
de Lleida, Universitat de Lleida, Montserrat Roig 2, 25008 Lleida, Spain
Full list of author information is available at the end of the article
latory protein Swi6, which binds directly to Swi4 or
Mbp1, respectively (reviewed in [4]). There is considerable functional redundancy between these factors. For
example, it has been reported that SBF may recognize,
albeit with reduced affinity, MBF binding sites and vice
versa [5-7]. Moreover, while mbp1Δ and swi4Δ strains are
viable, the double mutant mbp1Δ swi4Δ is not [8].
Although MBF and SBF are poised at their target promoters during much of G1 phase [9-11], they cannot activate transcription; rather, they repress it. Their activation
at START depends primarily on the cyclin/cyclin-dependent kinase (CDK) complex Cln3-Cdc28. This is achieved
in part by phosphorylation, and consequent shuttling out
of the nucleus, of a repressor called Whi5 [12,13], releasing SBF/MBF from its inhibition. Recently, a positive
feedback mechanism involving Cln1 and Cln2 has been
proposed to operate under physiological conditions in
SBF/MBF activation [14].
There has been considerable interest and effort at elucidating TF-target interactions at a genome scale. Reliable
© 2010 Ferrezuelo et al.; licensee BioMed Central Ltd. This is an open access article distributed under the terms of the Creative Commons Attribution License ( which permits unrestricted use, distribution, and reproduction in any medium, provided the original work is properly cited.
Ferrezuelo et al. Genome Biology 2010, 11:R67
/>
TF-target assignments are essential to build accurate
transcriptional networks and to uncover TF modules
responsible for combinatorial transcriptional regulation.
One important piece of information concerning TF-target assignments is provided by genome-wide location
analyses of TFs [15-18]. However, TF binding does not
necessarily imply regulation, neither is it informative as
to whether the regulation is positive or negative. Furthermore, these studies are typically noisy, and given the
modest overlap among some of these analyses, and the
poor agreement with data from other sources, doubts
about their reliability have also been raised [19,20]. Nonetheless, location analyses have been the starting point for
numerous computational studies aimed at defining transcriptional networks by heterogeneous data integration
(see, for instance, Lee et al. [21] and references therein).
Following these lines, two recent works, one based on a
Bayesian approach [22] and another using support vector
machines [23], have provided predictions for TF-target
interactions in the yeast global transcriptional network.
Unfortunately, the agreement between these studies is at
most quite modest.
We are particularly interested in the transcriptional
program at START. In order to produce informative
experimental data concerning this cell cycle stage, we
have used DNA microarrays to generate new expression
profiles under relevant conditions (synchronized cultures, deletion mutants) to study the transcriptional targets of the START regulator Cln3, and their dependence
on the TFs Mbp1 and Swi4. We have integrated our new
data with previously published datasets to provide reliable TF-target assignments. We propose a list of more
than 150 targets. Importantly, we have experimentally
validated our new predictions by performing chromatin
immunoprecipitation (ChIP) to demonstrate TF binding
to the promoters of some of our targets. Furthermore,
our classification performs better than recent analyses
[22,23] in a number of tests, and shows high internal consistency.
Results
New genome-wide expression dataset
In order to identify the targets of the cell cycle regulator
Cln3, and their dependence on the TFs SBF and MBF, we
have used DNA microarrays to interrogate genome-wide
changes in gene expression upon induction of Cln3 in
strains that lacked components of SBF, MBF or both, that
is, swi6Δ, swi4Δ, mbp1Δ, and swi4Δ mbp1Δ mutants.
Cln3 becomes essential in the absence of Bck2 [24-26].
Recently, we have also shown that overexpressed Bck2 is
able to induce an extensive transcriptional program of
mostly cell cycle-regulated (CCR) genes, many of which
peak at the G1/S transition of the cell cycle [27]. Hence,
Page 2 of 18
to avoid confounding effects derived from Bck2 function,
we placed the endogenous CLN3 gene under the control
of the regulatable GAL1 promoter in strains deleted for
BCK2. When grown under non-inducing conditions for
the GAL1 promoter, PGAL1·CLN3 bck2Δ strains were kept
alive
by
constitutive
expression
of
CLN2
(pRS313{PMET3·CLN2} [26]). Also, to control for non-specific expression changes, we used a double deletion cln3Δ
bck2Δ strain, again kept alive by PMET3·CLN2. To improve
sensitivity and facilitate interpretation, before galactose
induction we synchronized our cultures by repressing the
expression of CLN2 with methionine. Cln2 depletion in a
raffinose (non-inducing) medium produced a G1 arrest
similar to that described for a cln3Δ bck2Δ double mutant
[24-26], that is, accumulation of unbudded cells with 1N
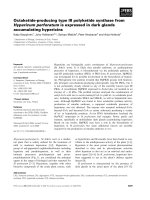
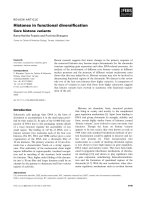
DNA content (Figure 1).
Overexpressed CLN3 induced cell cycle entry in an
mbp1Δ background and in an otherwise wild-type strain
(that is, in a bck2Δ context), as assessed by DNA content
and budding count. By contrast, Cln3 was unable to
increase the budding index in swi6Δ, swi4Δ or swi4Δ
mbp1Δ strains (Figure 1a). Interestingly, Cln3 was capable of promoting DNA replication in these backgrounds,
even though it was unable to induce any noticeable
changes in gene expression in the swi6Δ or swi4Δ mbp1Δ
mutants (Figures 1b and 2). Most likely, this is due to
overexpressed Cln3 being able to target the Clb/Cdc28
inhibitor Sic1 for degradation [28]. As expected, galactose addition per se was unable to induce cell cycle entry
in the cln3Δ bck2Δ control strain (Figure 1).
Cultures were sampled every 20 minutes for the next 80
minutes after galactose addition, and changes in gene
expression were measured using microarrays. In order to
select genes specifically induced by Cln3 (or by cell cycle
entry) as opposed to those induced by stress or by galactose, we used five slightly different selection criteria
based on gene clustering (see Materials and methods).
The number of genes selected by each criterion ranges
from 225 to 327, totaling 445 genes, of which 144 (32%)
were selected by all five approaches used, whereas 118
genes were selected by only one method. The expression
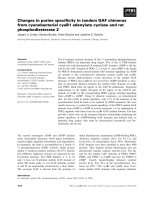
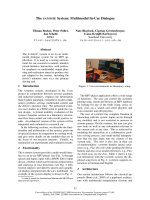
patterns of all 445 candidate genes are shown in Figure 2
(see Additional file 1 for numerical values). We anticipated that because we used synchronized cultures, and
because Cln3 is a key cell cycle regulator, most of these
genes would be CCR. Indeed, more than 70% of the 445
genes selected are CCR. Importantly, this is true even
when we did not use CCR gene enrichment as a selection
criterion. Furthermore, most (68%) of these CCR genes
peak at G1 or S phases of the cell cycle, as expected for
Cln3 targets. Hence, it is likely that our microarray analysis has produced a meaningful set of putative Cln3 targets.
Ferrezuelo et al. Genome Biology 2010, 11:R67
/>
Page 3 of 18
(b)
(a)
80
WT
mbp1
GAL 120
60
% budded
GAL 90
GAL 60
40
swi4
GAL 45
mbp1
GAL 30
swi4
20
Arrest
swi6
cln3
0
Asyn
Arrest
GAL 30
GAL 60
GAL 90
Asyn
WT
swi6
swi4
mbp1
swi4
mbp1
cln3
Figure 1 Budding index and DNA content. Relevant genotypes of strains are shown. Strains were also deleted for BCK2, and contained plasmid
pRS313{PMET3·CLN2}. Except for control strain cln3Δ, all strains also had the endogenous CLN3 gene expressed under the GAL1 promoter. Asynchronous
(Asyn) cultures of the indicated strains were grown in raffinose medium lacking methionine; they were thus kept alive by constitutive expression of
CLN2. Cells were arrested in G1 (Arrest) by addition of methionine. After most cells were blocked in G1, galactose was added to induce CLN3. Samples
were taken every 15 minutes for (a) budding and (b) DNA content evaluation (not all time points are shown). Only one experiment is shown. Somewhat less synchronous but otherwise similar profiles were obtained in a duplicate experiment (data not shown). WT, wild type.
As we have reported before [27], virtually all genes are
irresponsive to Cln3 in the absence of Swi6. Here, we also
show that Cln3 requires either Mbp1 or Swi4 in order to
promote transcription of its targets, as deduced from the
lack of induction in the swi4Δ mbp1Δ strain. Hence, we
demonstrate that Cln3 functions as a transcriptional regulator exclusively through MBF and SBF. The only genes
that were somewhat induced in both the swi6Δ and swi4Δ
mbp1Δ backgrounds were histones (Figure 2). Rather
than indicating an MBF/SBF-independent Cln3-mediated induction, this is very likely due to ongoing DNA
replication because histones are regulated at multiple levels and show a robust expression peak in S phase
(reviewed in [29]). Another cluster of genes that also
showed some induction in the absence of Swi6 contains
helicases encoded by middle-repetitive Y' subtelomeric
regions. Because there is extensive sequence similarity
among these loci, it is unclear whether all reported features or just one or few were actually induced in our
experiments. In any case, we also observed some induction of these genes in the control strain, albeit with different timing than in the other strains (Figure 2).
Transcription factor-target assignments
To distinguish the targets of Cln3 from those genes that
were just responding to cell cycle progression, and
because we found that Cln3 functions exclusively through
MBF or SBF, we determined the subset of genes within
the 445 candidates that could be assigned to either MBF,
SBF or both. To do this, we used a Bayesian approach that
integrates different lines of evidence into a single probabilistic model [22,30]. In our analysis, we have evaluated
nine different classifiers from three different lines of evidence - TF binding information, TF motifs, and expression data. For each classifier considered, each TF-target
interaction was assigned a log-likelihood score based on
control sets of positive and negative interactors. Final
scores were computed by simply adding all the individual
scores for the nine classifiers employed. These scores are
provided in Additional file 2. To choose thresholds in our
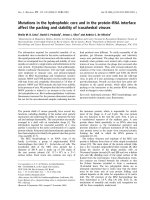
ranked list of putative targets, we evaluated our predictions with several statistical measures (Figure 3a). We
selected cutoffs that at the same time produced high values of the Matthews correlation coefficient (MCC) [31] regarded as a balanced measure of the quality (predictive
power) of binary classifications, even when classes are of
very different sizes - and also produced high values for
accuracy (›80%), precision (›80%), and specificity (›90%);
somewhat at the expense of sensitivity (approximately
60%). In other words, we preferred to leave out some true
positives to avoid the inclusion of too many false positives. In any case, these quality values are likely underestimated (see Materials and methods).
By these criteria, we obtained 111 and 94 targets of
MBF and SBF, respectively. Thirty-six of these were
shared by both factors (Tables 1 and 2; Additional file 3).
We first examined our predictions for targets for which
strong evidence of regulation by MBF or SBF exists in the
literature (reviewed in [32]) [19,33,34]. For this purpose,
we avoided noisy datasets generated by genome-wide
approaches. We found a total of 14 genes. Of the seven
genes showing MBF regulation (CDC21, POL1, CLB5,
CLB6, RNR1, NRM1, DUN1), our list of targets includes
six. The only exception, NRM1, was ranked number 161.
Ferrezuelo et al. Genome Biology 2010, 11:R67
/>
WT
swi6
swi4
mbp1
swi4
mbp1
Page 4 of 18
cln3
H
Y’
-3 -2 -1 0 1 2 3
Figure 2 Expression profiles of the 445 genes selected in this
study. Heat map depicting relative expression levels after galactose
addition. Induction is yellow; repression is blue. Averaged log2 values
from duplicate experiments are used (for individual values see Additional file 1). Scale is at the bottom. Only relevant genotypes of strains
are indicated. For complete genotypes see Figure 1 or the text. Four
time points (20 through 80) per strain are indicated by widening black
bars at the top. Genes are hierarchically clustered (uncentered Pearson
correlation, average linkage). On the left, H indicates the histone cluster; Y' indicates the cluster of Y' subtelomeric elements. WT, wild type.
We classified NRM1 as an SBF target instead. Only one
gene, DUN1, was in the positive control set. Similarly, of
the seven reported targets of SBF (HO, CLN1, CLN2,
PCL1, SVS1, TOS4, YOX1), we were able to detect all
except PCL1 (position 165) as SBF-regulated genes. HO
and TOS4 were in the positive control set. Hence, we
conclude that our strategy correctly assigned most
known targets of MBF or SBF. Among our predictions,
58% and 67% of the MBF and SBF targets, respectively,
have also been reported in a number of previous analyses
[35-38] other than Beyer's and Holloway's studies. This
suggests that our approach has produced many true targets, as substantiated by independent classifications. On
the other hand, we have predicted 27 MBF- and 21 SBFregulated genes not found before [22,23,35-38]. Although
this constitutes added value to our work, it raises questions about the number of false positives in our analysis,
and it calls for further experimental validation of our
results (see below).
We (and others) find most targets of MBF or SBF to be
CCR, with peak expression at the G1 or S phases of the
cell cycle (more on this below). However, there are 172
CCR genes with maximal expression in this same cell
cycle window that we have not classified as MBF or SBF
targets. These are good candidates as false negatives in
our analysis. However, only 28 out of these 172 CCR
genes are predicted as MBF or SBF targets in at least two
previous classifications [22,23,35-38]. Hence, most
(approximately 80%) of these targets are likely true negatives. Among those predicted by others, some were in our
list below the defined cutoff but close to it (for example,
in the MBF list, KCC4 was ranked 132, POL2 126, and
PLM2 113; in the SBF list, HHT1 was 106). Still, some
other genes may have escaped detection because their
expression may depend on BCK2, which was absent in
our experiments. Some candidates within this group are
HLR1, FKS1, and ELO1 [27].
We further compared our targets with those provided
by Beyer et al. [22] and by Holloway et al. [23] (Figure 3b).
About 70% of our predicted targets were also in the lists
of Beyer et al. or Holloway et al. This was not unexpected
since our control sets were based on these studies. By
contrast, we only detected 23% of the targets predicted by
Beyer et al. and approximately 34% of those by Holloway
et al. Because our study has focused only on those targets
that respond in a timely way to Cln3 overexpression in
the absence of Bck2, genes that require this protein for
their expression would not have been selected. Moreover,
some targets controlled by MBF or SBF may also respond
to stress, and they would have been likely removed during
our gene selection procedure. We examined our expression data for targets solely detected by Beyer et al. or Holloway et al., and found some 70 genes responding to
stress, induced by Bck2 [27], or otherwise selected within
Ferrezuelo et al. Genome Biology 2010, 11:R67
/>
Page 5 of 18
(a)
(b)
MCC
Accuracy
Specificity
Sensitivity
Precision
Beyer
1
Ferrezuelo
0.8
12
32
0.6
105
36
31
52
0.4
0.2
88
0
0
100
200
300
400
MBF
Holloway
MBF targets ranking
1
Beyer
Ferrezuelo
0.8
32
12
87
0.6
28
22
0.4
43
0.2
Holloway
0
0
100
200
300
48
SBF
400
SBF targets Ranking
Figure 3 Target classifications. (a) Values of quality measures throughout our ranked list of candidates. Average values obtained with two benchmarks are represented. See text for details. (b) Venn diagrams comparing our classifications with those of Beyer et al. [22] and Holloway et al. [23].
our 445 candidates but unsupported as targets by our
integrative analysis. However, most targets predicted only
by Beyer et al. or by Holloway et al. would remain unaccounted for under these considerations. It is clear that
our study is rather restrictive and that a few true targets
of MBF and SBF may be missing from our lists. Also,
under different growth conditions MBF and SBF may
show distinct binding specificity, which may have been
accounted for by these other studies. By contrast, we have
predicted 32 targets (29%) of MBF (Table 1) and 32 (34%)
of SBF (Table 2) that Beyer et al. and Holloway et al. failed
to detect. Because we have used expression data collected
in swi4Δ and mbp1Δ backgrounds, which surely are more
informative about SBF and MBF regulation than expression datasets used in previous studies, our work may provide higher sensitivity (for our experimental conditions)
in detecting targets that may have escaped other studies
broader in scope.
Cell cycle behavior
MBF and SBF are TFs that play a central role during the
cell cycle. Hence, we first wanted to visualize the distribution of the expression peaks of their targets throughout
the cell cycle (Figure 4). Most targets (92%) were CCR. In
comparison, some previous predictions [22,23,35,37]
produced a much greater proportion of non-CCR targets.
Because we worked with synchronized cultures, explicitly
enriched for CCR genes during selection, and used cell
cycle regulatory data in our model, this was hardly surprising. MBF targets distributed narrowly, and centered
at a time point corresponding to 20% of the whole duration of the cell cycle. Almost identical distributions were
Ferrezuelo et al. Genome Biology 2010, 11:R67
/>
Page 6 of 18
Table 1: Summary of targets controlled by MBF
Cell cycle
peaka
TF bindingb
Motifs ACGCGc
Previous classificationsd
SPT21
14
[15-18]
2 (1)
[23,35-38]
YKL113C
RAD27
20
[15-18]
1 (1)
[23, 35-38]
DNA RRR
YLR103C
CDC45
18
[15-18]
2
[22, 23, 35-38]
DNA RRR
4
YNL102W
POL1
20
[15,18]
3 (1)
[22,23,36]
DNA RRR
5
YJL074C
SMC3
19
[17,18]
2
[22,23,35-38]
Cell cycle
6
YOR074C
CDC21
22
[15-18]
2
[22,23,35-38]
DNA RRR
7
YNL312W
RFA2
22
[15,17,1
8]
2
[22,23,36,37]
DNA RRR
8
YAR007C
RFA1
19
[17,18]
2 (1)
[22,23,36-38]
DNA RRR
9
YAR008W
SEN34
17
[17,18]
2 (2)
[22,23,36-38]
Others
10
YDL003W
MCD1
20
[15-18]
2 (2)
[23,35-38]
41
YNL082W
PMS1
13
2
DNA RRR
56
YOR144C
ELG1
16
1
DNA RRR
66
YKL092C
BUD2
ND
1
BP
67
YDL157C
32
1
Unknown
Ranking
Systematic
name
Standard
name
1
YMR179W
2
3
Functional classe
Others
Cell cycle
68
YNL206C
RTT106
19
1
DNA RRR
69
YKL108W
SLD2
13
1
DNA RRR
70
YOR284W
HUA2
17
1
71
YDL164C
CDC9
18
2
72
YLR032W
RAD5
15
2
DNA RRR
77
YDL102W
POL3
17
1 (1)
DNA RRR
78
YNL263C
YIF1
24
1 (1)
Others
79
YPL208W
RKM1
23
1
Others
83
YKL042W
SPC42
21
1
SPB
84
YML133C
(1)
DNA RRR
8
RFA3
[15]
31
2 (1)
13
BP
[36]
3
[36]
DNA RRR
85
YJL173C
86
YJL181W
DNA RRR
88
YKL089W
MIF2
ND
89
YML060W
OGG1
22
90
YBR275C
RIF1
22
91
YOR368W
RAD17
ND
95
YNL339C
YRF1-6
10
96
YOL090W
MSH2
20
99
YOR114W
101
YHL013C
OTU2
ND
103
YOR195W
SLK19
27
1
104
YGR140W
CBF2
34
1 (1)
106
YNL309W
STB1
15
1 (1)
Cell cycle
107
YOL034W
SMC5
ND
1
DNA RRR
108
YER016W
BIM1
29
2
Cytoskeleton
109
YDR356W
SPC110
33
1
Cytoskeleton
Unknown
[36]
SPB
1
DNA RRR
1
DNA RRR
[18]
[15]
DNA CM
(1)
1
24
DNA RRR
[36]
DNA RRR
[35,37]
Unknown
1
[17]
Unknown
SPB
Cell cycle
Ferrezuelo et al. Genome Biology 2010, 11:R67
/>
Page 7 of 18
Table 1: Summary of targets controlled by MBF (Continued)
110
YDL105W
NSE4
16
111
YNL088W
TOP2
34
DNA RRR
2
DNA CM
aPercent
value of the whole duration of the cell cycle taken from [20,45]. bReferences for publications where Mbp1 binding was detected.
cNumber of motifs in the first 200 bp upstream of the TSS (motifs beyond the first 200 bp upstream). dReferences for publications where the
gene was predicted as target of MBF. eDNA RRR, DNA replication, recombination and repair; BP, budding/polarity; SPB, spindle pole body;
DNA CM, DNA conformation modification. The top ten predicted targets and all those specific (not detected in [22] or [23]) to our classification
are shown. The full list is available in Additional file 3. ND, not determined.
observed in previous approaches (Figure 4; Additional file
4). By contrast, the distribution of SBF targets was more
variable across studies. In our case, we observed a
bimodal distribution (also apparent with Beyer et al.'s
data) with some SBF targets peaking slightly later than
MBF-regulated genes, but most peaking much later (40%
point), and few extending beyond 45% of the cycle duration. Significant numbers of SBF targets in other studies
[22,23,35,36,38] showed cell cycle peaks beyond this
point (Figure 4; Additional file 4). These might be targets
for which SBF acts as repressor rather than as activator or
which are not controlled by Cln3. Although many SBF
targets peak much later than genes regulated by MBF,
they are actually activated concurrently or just slightly
later [39] (Additional file 5). SBF targets are, however,
deactivated much later than MBF targets [39] (Additional
file 6). This differential timing of expression of MBF and
SBF targets throughout the cell cycle was also apparent in
our microarrays, with SBF targets being induced somewhat later and longer than MBF targets. Most likely, this
is the consequence of Nrm1-specific repression of MBF
targets [33], and Clb2-dependent repression of SBF targets [9,40].
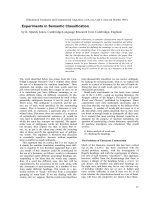
Experimental validation by ChIP
To validate experimentally our predictions, we performed
ChIP assays. For each TF, we chose three targets for
which binding had not been detected previously. ELG1,
SLD2, and STB1 (ranked 56, 69 and 106, respectively)
were chosen as MBF targets, and VRG4, STU2, and ERP2
(ranked 76, 93 and 94, respectively) as SBF targets. Only
STU2 was predicted as a SBF target by just one previous
analysis [36]. As positive controls we chose CDC45 and
SVS1 for MBF and SBF binding, respectively. Both genes
bound these TFs in previous genome-wide location analyses [15-18], and are predicted as targets by all previous
classifications [22,23,35-38]. CDC45 had two ACGCG
motifs (Mbp1 binding site) in the first 200 bp upstream of
the transcription start site (TSS), whereas the three MBF
targets tested contained just one each. SVS1 and STU2
had three CRCGAA motifs (Swi4 binding site) in the first
400 bp upstream of the TSS, VRG4 contained two, and
ERP2 only one. We designed PCR primers targeting these
regions. As control for non-specificity we chose a frag-
ment of the coding sequence of DYN1. This gene is one of
the largest in the S. cerevisiae genome, and thus this
region is more than 6 kb away from the closest promoter.
In addition, we carried out parallel ChIPs with an
untagged strain. As source material for the ChIPs, we
used both asynchronous cultures and G1-enriched cultures by treatment with α factor. Somewhat unexpectedly,
however, G1 enrichment did not improve detection of
MBF or SBF binding. On the contrary, our results are
quite comparable irrespective of the growth conditions
(Figure 5). Importantly, these constitute two independent
ChIP experiments.
We found specific enrichment for all the genes tested
when compared to the non-specific control DYN1 (Figure
5). As expected, the relative enrichments for the untagged
strain were close to one for all the genes and conditions.
The positive controls, CDC45 and SVS1, showed approximately 4-fold and 7-fold enrichments, respectively,
whereas our test targets gave values in the range of 1.5 to
2. STU2 and ERP2 gave the greatest variability, but considering both experiments and all the PCRs performed,
we also conclude that there is some enrichment for these
genes. These are particularly noteworthy because they
are ranked last in our list of SBF targets. Although the
enrichments for test genes may seem modest, particularly
when compared to that for SVS1, this result was anticipated because higher values would have been unlikely to
escape detection in genome-wide location analyses.
Validation by functional enrichment
To further validate our predictions, we analyzed the biological functions of our targets (Figure 6a). Because no
functional annotation was used at any step in our TF-target assignment approach, gene functions provide an independent quality assessment of our predictions. It has
been previously proposed that MBF and SBF control
genes with distinct and dedicated roles. Thus, many MBF
targets would be involved in DNA replication, repair and
DNA processing in general, whereas many SBF-controlled targets seem to be involved in membrane and cell
wall biogenesis [15,41,42]. In agreement with this, we
have found statistically significant enrichment (P ‹ 10-15)
in genes involved in DNA replication, repair and recombination among our MBF targets. We also found signifi-
Ferrezuelo et al. Genome Biology 2010, 11:R67
/>
Page 8 of 18
Table 2: Summary of targets controlled by SBF
Cell cycle TF bindingb
peaka
Motifs CRCGAAc
Systematic
name
Standard
name
1
YER001W
MNN1
29
[16-18]
2
YNL300W
TOS6
30
[15-18]
4
[22,23,35-38]
Unknown
3
YKR013W
PRY2
25
[16-18]
4
[22,23,35,36,38]
Unknown
4
YOL007C
CSI2
24
[15]
4
[22,36]
CW Gly
5
YPL163C
SVS1
28
[15-18]
3 (1)
[22,23,35-38]
Others
6
YPL256C
CLN2
23
[15]
2 (2)
[23,35,36]
7
YDR297W
SUR2
30
[15]
1
[23]
Others
8
YMR307W
GAS1
36
[15-18]
2 (1)
[22,23,36-38]
CW Gly
9
YDR507C
GIN4
21
[15-18]
1
[23,37,38]
10
YLR183C
TOS4
16
YOL019W
17
YGR140W
18
YNL031C
32
YJL173C
RFA3
39
YMR144W
49
YMR179W
51
YPL267W
54
YLR121C
57
YNL278W
61
YHR154W
RTT107
63
YMR304C-A
65
YHR173C
67
YBL009W
ALK2
69
YJL080C
70
YKR090W
71
72
73
76
77
79
1 (1)
Previous
classificationsd
Functional classe
Ranking
[22,23,36-38]
CW Gly
DNA RRR/BP
BP
23
[15]
2 (1)
[22,36]
Others
22
[15,17]
1
[36-38]
Unknown
CBF2
34
[15]
1 (2)
HHT2
37
[15]
2
31
Cell cycle
[36]
1 (1)
DNA RRR
33
[16-18]
SPT21
14
[15-18]
1
[35-38]
Others
ACM1
16
[17,18]
1
[35-38]
Unknown
YPS3
17
[15]
2
[36]
CAF120
nd
[15]
2
[16-18]
0
Unknown
36
1
Unknown
36
2
Others
SCP160
33
2
Cell cycle
PXL1
27
1
BP
YGL093W
SPC105
34
1
YKL113C
RAD27
20
1
[36]
DNA RRR
YBR088C
POL30
20
1
[36]
DNA RRR
YGL225W
VRG4
38
2 (1)
YDR113C
PDS1
33
0
Cell cycle
YLR383W
SMC6
24
1
DNA RRR
81
YGL012W
ERG4
42
1
Others
84
YPL032C
SVL3
40
1
BP
85
YHR050W
SMF2
nd
1 (1)
86
YKL049C
CSE4
40
1
87
YBR252W
DUT1
40
1
Others
88
YOR099W
KTR1
34
1 (1)
CW Gly
89
YLL021W
SPA2
31
0 (1)
91
YNL102W
POL1
20
0 (1)
92
YJR144W
MGM101
nd
3 (1)
24
nd
1
DNA CM
1
[15]
[35-38]
Unknown
Others
Others
[36]
DNA RRR
Cytoskeleton
CW Gly
Others
Cell cycle
BP
[36]
DNA RRR
DNA RRR
Ferrezuelo et al. Genome Biology 2010, 11:R67
/>
Page 9 of 18
Table 2: Summary of targets controlled by SBF (Continued)
93
YLR045C
STU2
42
3 (1)
94
YAL007C
ERP2
37
1
[36]
SPB
Others
aPercent
value of the whole duration of the cell cycle taken from [20,45]. bReferences for publications where Swi4 binding was detected.
cNumber of motifs in the first 400 bp upstream of the TSS (motifs beyond the first 400 bp upstream). dReferences for publications where the
gene was predicted as target of SBF. eCW Gly, cell wall/glycosylation; DNA RRR, DNA replication, recombination and repair; BP, budding/
polarity; SPB, spindle pole body; DNA CM, DNA conformation modification. The top ten predicted targets and all those specific (not detected
in [22] or [23]) to our classification are shown. The full list is available in Additional file 3. ND, not determined.
cant enrichment (P ‹ 2 × 10⁻⁴) for SBF-regulated targets
involved in cell wall biogenesis and integrity, as well as
protein glycosylation. We considered these two functional classes together because many cell wall components are highly glycosylated proteins, and cell wall
integrity thus strongly depends on protein glycosylation
(reviewed in [43]). We next examined the functional consistency of our classification by comparing the distribution in different functional classes of unique versus
shared targets, taking as reference the lists provided by
Beyer et al. [22] and Holloway et al. [23]. We found no
statistically significant differences (two-tailed Fisher
exact test, P ‹ 0.05) between these two sets in any of the
functional categories considered. By comparison, a similar analysis performed with Beyer et al.'s and Holloway et
al.'s classifications showed significantly fewer genes dedicated to DNA replication, recombination and repair
among their unique MBF targets than in those shared
with other classifications (P ‹ 2 × 10⁻⁵ and P ‹ 2 × 10⁻³,
respectively). Beyer et al.'s SBF targets were lacking in cell
cycle genes (P ‹ 0.01) and those involved in cell wall and
glycosylation (P ‹ 6 × 10⁻⁵). By contrast, Holloway et al.'s
specific MBF targets included more genes involved in cell
wall and glycosylation (P ‹ 0.02). In conclusion, our classification shows higher functional internal consistency
than the predictions from these previous studies. This
consistency reinforces the idea that we have been able to
find many real targets that have escaped previous analyses.
Evaluation of predictive power: the case of divergently
transcribed genes
Divergently transcribed genes offer another approach to
evaluate the quality of our predictions. These genes share
their promoter regions, and because in yeast intergenic
regions are usually short, ChIP-chip data alone cannot
distinguish whether both or only one gene (or none) may
be regulated by the bound TF. Several studies [37,44]
have integrated expression data together with ChIP-chip
data to establish which divergent genes are likely or
unlikely to be regulated by bound TFs. These works provide independent predictions that can be used as benchmarks to compare the predictive power of other
classifications. Compared to the experimental data we
have used, Beyer et al.'s and Holloway et al.'s analyses
have arguably used datasets more akin to those used previously [37,44]. Despite this, our classification outperformed both Beyer et al.'s and Holloway et al.'s in
predicting true regulation in divergently transcribed
genes as measured by MCC (Figure 6b). These other classifications displayed much lower specificity and precision, similar accuracy, and higher sensitivity than ours
(data not shown). The greatly diminished specificity
(higher number of false positives) of these classifications
may be explained by the fact that both seem to rely
strongly on genome-wide binding data.
Internal consistency: distribution of motifs in MBF targets
The MBF targets used as positive control in our analysis
were highly enriched for Mbp1 binding motifs (ACGCG)
located proximal (‹200 bp) to the TSS. Whereas 65% of
these targets had at least one binding site in the first 200
bp upstream of the TSS, only 4.5% of genes in our negative control did. Similarly, the SBF control genes were
enriched in Swi4 binding motifs (CRCGAA), but they
were neither so narrowly distributed upstream of the TSS
nor so highly enriched (78% versus 33%). Strikingly, even
when we recalculated the scores without the motif classifier - hence, no information concerning sequence motifs
was used - the vast majority of the MBF targets still presented the ACGCG motif in their promoters with a
clearly biased distribution towards the proximity of the
TSS (Figure 7). This was true irrespective of whether the
predicted targets were common to other studies or
unique to our work. By contrast, a random set of nonMBF targets did not show this pattern (Figure 7c). We
next examined the distribution of motifs in the promoters
of the MBF targets predicted by Beyer et al. and Holloway
et al. We considered four groups of targets: those
detected in all three studies and those unique to only one
study. Because the classifications by Beyer et al. and Holloway et al. included motif information, we expected to
find enrichment of MBF binding motifs. Indeed this was
the case, but these motifs were much more scattered
along the full length of promoters in Beyer et al.'s or Holloway et al.'s targets than in the common set or in our
specific targets (Figure 7a). Consequently, the proportion
of genes containing sites in the first 200 bp upstream of
Ferrezuelo et al. Genome Biology 2010, 11:R67
/>
Page 10 of 18
Evaluation of genome-wide location datasets
MBF
MBF_SBF
SBF
No_MBF_SBF
40
Ferrezuelo
30
20
10
0
90
10
80
70
60
50
40
30
20
10
0
Beyer
30
20
10
0
10
90
80
70
60
50
40
30
20
0
10
Number of genes
40
40
30
Holloway
20
10
0
10
90
80
70
60
50
40
30
20
10
0
Cell cycle peak time
Figure 4 Cell cycle distribution of targets. Predicted targets were
binned according to their expression peak in the mitotic cell cycle
[20,45]. Values on the x-axis are percentages of the whole duration of
the cycle, as defined in [20]. Beyer et al.'s [22] and Holloway et al.'s [23]
predicted targets are also shown for comparison. MBF_SBF denotes
targets controlled by both TFs; No_MBF_SBF refers to genes from our
445 candidates not classified as MBF or SBF targets.
the TSS in the common set and in our specific group was
greater than in the specific sets of the other two studies
considered (Figure 7b). Hence, this analysis strongly suggests that our MBF targets constitute a more homogeneous group than those previously described [22,23].
Previous analyses may have detected condition-specific
targets of Mbp1 that we may have missed under our more
restrictive experimental investigation. Should this be the
case, however, the distinct distribution of motifs would
suggest that positional information at promoters may
play a role in the response to one or another cellular cue.
Finally, we used our classification as a benchmark to compare the predictive value of the different genome-wide
location analyses involving Mbp1 and Swi4. To this purpose, we produced classifications leaving the binding
information classifier out. Note that the datasets generated by Young and co-workers [16-18] were used by
Beyer et al. and Holloway et al. in their analyses, and
because our control sets were derived from those studies,
our predictions cannot be considered fully independent
from those datasets. We used MCC to assess the predictive power of these datasets. For Mbp1, regardless of the
cutoff chosen in our classification, Harbison et al.'s [18]
data greatly outperformed the others (Figure 8), especially those by Simon et al. [16] and Iyer et al. [15]. This
may stem from the fact that Harbison et al. performed
their Mbp1 ChIPs under several growth conditions, providing a considerably larger number of targets. In fact,
whereas the accuracy and specificity of all four studies
analyzed were similar, Harbison et al.'s dataset was significantly more sensitive than the others (data not shown).
For Swi4, Iyer et al.'s dataset slightly outperformed the
other three studies, at least for a cutoff of 100 or lower,
which is a reasonable threshold for SBF-regulated genes
in our classification (Figure 8). This difference was underscored by the fact that, contrary to the others, Iyer et al.'s
study provided a dataset that was fully independent of
our classification.
Discussion
The transcriptional program at START is driven by the
related TFs MBF and SBF. Cln3 is the most upstream activator of START. It functions by activating the CDK
Cdc28, which then inhibits repressors of SBF and MBF,
leading to the activation of their target genes [12,13].
Cln3 is not, however, the only activator operating at
START. For instance, it shares an essential function with
Bck2 of promoting the G1 to S transition of the cell cycle
[24-26], and we have recently shown that Bck2, at least
when overexpressed, induces many genes at this point
[27]. Here we provide an extensive list of genes that are
activated by Cln3 in the absence of Bck2 in an MBF- or
SBF-dependent manner. In fact, it is likely that Cln3 functions solely, at least as a transcriptional activator, through
MBF and SBF because all known functions of Cln3
depend on Swi6 [27,28], overexpression of Cln3 at cell
cycle stages other than G1 has little effect on gene activation [27], and here we have shown that Cln3 is unable to
induce any of its targets in a swi4Δ mbp1Δ background.
We produced our list of Cln3 targets in two steps. First,
we generated new genome-wide experimental data that
are arguably more informative for this purpose than other
datasets available in the literature. This is so because we
studied the effects on gene expression of overexpressing
Ferrezuelo et al. Genome Biology 2010, 11:R67
/>
(a)
Page 11 of 18
α factor
Asynchronous
Untagged
Mbp1TAP
WCE
WCE
IP
IP
WCE
IP
ELG1
WCE
Untagged
WCE
IP
WCE
IP
Untagged
WCE
IP
Swi4TAP
WCE
IP
VRG4
STU2
DYN1
(b)
IP
STB1
DYN1
DYN1
Swi4TAP
Untagged
Mbp1TAP
DYN1
PCR1
PCR2
UNTAGGED
9
8
Relative enrichment
7
6
5
4
3
2
1
0
Asynchronous
α factor
Figure 5 Experimental validation of predicted targets. ChIP assays with Mbp1TAP and Swi4TAP were carried out for a number of targets for which
TF binding had not been detected before. (a) PCR products for predicted targets ELG1, STB1, VRG4 and STU2 are shown. Cells were grown either asynchronously or enriched in G1 with α factor. Three dilutions (1:1,500, 1:4,500, 1:13,500 for tagged strains; 1:2,500, 1:7,500, 1:22,500 for untagged strains)
of the whole cell extract (WCE) and two (1:5, 1:15) of the immunoprecipitates (IP) were used. PCR was carried out for 28 or 30 cycles for tagged and
untagged strains, respectively. As an internal control for non-specificity the gene DYN1 was used. The PCR product amplified from this gene was several kilobases away from the closest promoter. (b) Quantification of ChIP assays. Optical density of bands was measured with ImageJ. The relative enrichments shown are calculated as ratios of specific to non-specific (DYN1) products in the IP compared to the input (WCE). Two independent PCRs
were carried out per gene tested (just one PCR in the untagged strains). The average and standard deviations (error bars) of two or three different
exposures are shown. Genes ELG1, SLD2, STB1 and CDC45 (positive control) were tested in the Mbp1TAP ChIP; genes STU2, ERP2, VRG4 and SVS1 (positive control) were tested in the Swi4TAP ChIP.
Ferrezuelo et al. Genome Biology 2010, 11:R67
/>
Page 12 of 18
(a)
(b)
MBF targets (111)
SBF targets (94)
Figure 6 Quality assessment of our predictions. (a) Functional classification of predicted targets. Functional classes are based on the MIPS functional catalog, but sometimes we merged several classes, and they were adapted to make them virtually non-overlapping. DNA RRR, DNA replication,
recombination and repair; SPB, spindle pole body. Thirteen MBF and 14 SBF targets were of unknown function; they are not considered in the percent
calculation. (b) Comparison of the predictive power of our classification with those of Beyer et al. [22] and Holloway et al. [23]. MCC was used to assess
the ability of each classification to detect true regulatory TF-target associations in the case of divergently transcribed genes for which binding had
been reported (Gao et al. [37]; Chen et al. [44]).
Cln3 in synchronized cultures, and most importantly
because we used a battery of deletion strains lacking
components of MBF and/or SBF. Second, because Cln3
needs MBF or SBF to promote gene expression, we integrated our data together with other published datasets to
determine the targets of Mbp1 and Swi4. This has
allowed us to distinguish direct targets of Cln3 from
genes induced indirectly as a result of cell cycle progression in our experiments. It is possible, however, that some
of the genes regulated by Mbp1 or Swi4 are not direct targets of Cln3. Cln1 and Cln2 are involved in a positive
feedback mechanism promoting transcriptional activation at START [14]. Hence, it is unclear whether the
induction we see is solely due to overexpressed Cln3, or
most likely to Cln1, Cln2 and Cln3 acting in concert.
Interestingly, most MBF targets seem to be insensitive to
overexpressed Cln1 (our unpublished results).
Following previous approaches [22,30], we have developed a single probabilistic model based on Bayesian statistics that allows the integration of data from
heterogeneous sources. Integration is important because
with expression data alone it is difficult to distinguish
direct from indirect regulation as well as compensating
mechanisms of redundant factors, whereas TF binding or
motifs at promoters lack functional information. From
our experiments, we have made available to our model
expression data concerning the time and extent of induction, and how these are affected in deletion mutants.
From others, we have taken information on TF binding,
Cln3 induction (under non-progressive conditions), Clb2
repression, and cell cycle behavior [3,15-18,20,45]. We
have also integrated information about binding motifs at
promoters. Doubtless, the dominant feature in our classification is gene expression. This is, however, rather spe-
cific and more informative than expression datasets
typically used in genome-wide studies on transcriptional
networks. In general, it seems these studies give more
weight to ChIP-chip data (see, for example, Beyer et al.
[22] and Holloway et al. [23]).
We have validated our predictions in two ways. First,
and most important, we have demonstrated by ChIP
assays that Mbp1 and Swi4 bind the promoters of predicted targets for which binding had not been detected
before [15-18]. Second, our predictions show high
enrichment in biological functions previously attributed
to MBF or SBF [15,41,42]. Importantly, and contrary to
other analyses [22,23], this was true also for the set of targets that was specific to this study, indicating that our
classification maintains internal functional consistency.
On the other hand, our classification shows greater predictive power than previous ones [22,23] as tested by
their ability to discriminate regulatory targets between
divergently transcribed genes.
We have used our TF-target assignments as a benchmark to assess the quality of several genome-wide TF
binding datasets [15-18]. Our analysis suggests that
whereas for Mbp1 the study by Harbison et al. [18] is
superior to the others, for Swi4 Iyer et al. [15] is the best
performer. Interestingly, Harbison et al. provided a more
thorough study of Mbp1 (several conditions assayed)
than of Swi4, and conversely Iyer et al. performed many
more ChIP-chip experiments for Swi4 than for Mbp1. It
is likely, then, that more experimental ChIP-chip data
may considerably improve the quality of available datasets.
Our predicted MBF targets are highly enriched in
ACGCG sequences. Strikingly, the position of this motif
is strongly biased towards the first 200 bp from the TSS.
Ferrezuelo et al. Genome Biology 2010, 11:R67
/>
Page 13 of 18
(c)
(a)
80
% sites
60
40
20
0
FBH
F
< 200
B
< 500
H
> 500
(b)
% genes
80
60
40
20
0
FBH
F
<200
B
>200
H
No sites
Figure 7 Mbp1 binding motif distributions at gene promoters. (a) Proportion of ACGCG sites located within the first 200 bp, from 200 to 500 bp,
and beyond 500 bp at the promoters of MBF targets that are specific to this work (F), to Beyer et al. [22] (B), to Holloway et al. [23] (H), or that are common to all three studies (FBH). (b) Proportion of MBF targets with ACGCG sites within the first 200 bp upstream of the TSS, beyond 200 bp, or without
such sites; FBH, F, B, and H as before. (c) Promoter representations with the location of ACGCG sites (blue). Left panel, MBF targets in our work shared
with the aforementioned studies. Right top panel: our specific MBF targets. Right bottom panel: random set of genes with ranking values from 200 to
445 in our MBF classification. Every line represents a gene promoter from the TSS (right end) up to -1,000 bp upstream of the START codon. For all
analyses in this figure, scores were recalculated without the motif classifier.
Importantly, these features remain unchanged even when
the motif information classifier is not incorporated into
our model. Hence, this constitutes another independent
confirmation that our classification must have captured
biologically meaningful predictions. By contrast, this promoter architecture is not maintained in most Mbp1 targets specific to other models [22,23]. It is possible that
association of Mbp1 with partners other than Swi6 may
change its binding specificity. SBF targets show enrichment of CRCGAA sequences, but their more scattered
distribution suggests that SBF-controlled promoters are
more complex than MBF-regulated promoters. In agreement with this, combinatorial regulation involving Swi4
and other factors seems commonplace [22,23,46].
The apparently simpler architecture of MBF target promoters correlates with a narrow distribution in their
expression peak during the mitotic cell cycle. By contrast,
SBF targets show a more spread bimodal distribution.
This may likely be due to combinatorial regulation with
Ste12 and forkhead TFs [22,23,46]. The bulk of SBF targets peaks much later than genes regulated by MBF. This
is so mainly owing to their different inactivation timing,
and not so much because SBF targets are activated much
later. In fact, most SBF targets are activated just slightly
later. MBF-regulated genes are subject to specific repression by Nrm1 [33], a G1/S cell cycle-regulated gene, as
cells proceed from G1 to S phase, and before Clb/CDK
activity raises. By contrast, SBF is repressed only later,
when Clb2 is expressed and its activity is high [9,40].
Hence, the set of targets we have predicted here recapitulate known cell cycle regulatory mechanisms.
It has been controversial whether Whi5 represses only
SBF [13] or both SBF and MBF [12]. Recently, the role of
Stb1 as an activator and repressor of both SBF and MBF
has also been proposed [47-50]. Here, we have predicted
STB1 as a target of MBF, and we have demonstrated
Mbp1 binding to the STB1 promoter by ChIP assays. This
raises the possibility of Stb1 being involved in feedback
mechanisms as well as linking MBF and SBF regulation at
START. Nonetheless, the small but appreciable delay in
the activation of most SBF targets as compared to MBFregulated genes, whether related to Stb1 function or not,
supports the existence of different activating mechanisms
for these TFs.
Ferrezuelo et al. Genome Biology 2010, 11:R67
/>
Iyer
Page 14 of 18
Harbison
Simon
Lee
0.4
other previous integrative models. We believe our work
exemplifies the need to generate more informative experimental data to build detailed and reliable networks. This
work and similar approaches may be keystones to the
development of accurate computational models of the
cell cycle.
0.3
0.2
MCC
0.1
0
0
100
200
300
400
Materials and methods
Strains used in the expression profiling experiments were
MATa haploid W303 derivatives. Their relevant genotypes are shown in Figure 1. General procedures for the
construction of strains, growth conditions, budding
count, DNA content analysis, RNA isolation as well as
microarray hybridizations and data analysis have been
described previously [27]. Microarray data have been
deposited in ArrayExpress under accession number
[ArrayExpress:E-TABM-764].
MBF Ranking
Gene selection
200
300
SBF Ranking
To select for genes specifically induced by Cln3 or by cell
cycle progression, we used five slightly different criteria
based on gene clustering [51]. Two selection methods
used visual inspection only. One has been described previously [27]. The other was similar except that only the
strains used in this work, but not the PGAL1·BCK2 strains
used in our previous study, were used. Another method
used first a visual selection and then a second selection
based on cell cycle enrichment. Two other methods were
based solely on cell cycle enrichment, but for one we first
filtered out inconsistent expression between duplicate
experiments evaluated in the PGAL1·CLN3 bck2Δ strain.
Throughout this study we consider CCR genes as those
belonging to a consensus list of 648 cell cycle genes
(Additional file 7) that appear among the top 800 ranked
in at least three of five cell cycle studies [3,20,45,52,53].
0.4
0.3
0.2
0.1
0
0
100
400
Figure 8 Quality assessment of location analyses. The predictive
power (MCC) of different location analyses was evaluated with our
classifications as benchmarks. MCC values are represented throughout
our ranked list of candidates. Work by Iyer et al. [15], Simon et al. [16],
Lee et al. [17], and Harbison et al. [18] were considered. For these analyses, we did not include explicit binding information in our classifications.
Conclusions
Here we have provided the transcriptional network activated by the cell cycle regulator Cln3 through the TFs
SBF and MBF. We have validated our TF-target predictions both experimentally by means of ChIP assays, and
computationally by studying the functional enrichment of
target genes. Although likely still incomplete, our network appears to be more accurate (higher predictive
power and internal consistency) than others previously
proposed. Likely, this stems from the integration of new
experimental data with other available genome-wide
datasets, and from relying less on TF binding studies than
Probabilistic model
We have followed others' ideas [22,30] to develop a
Bayesian probabilistic model. We have used a unified
scoring scheme that received input from nine different
classifiers (see below). Most classifiers were binned into
four mutually exclusive groups. To delimit each group, we
chose three random sets of 40 elements from our list of
445 genes (see Results). The 40 elements in each set were
sorted by their values within each classifier, and the 10th,
20th, and 30th ranked values in each random set were
averaged, respectively. These average values were used as
thresholds to delimit the bins. Each bin was then assigned
a weight calculated as a log likelihood score (LLS):
LLS = ln(P(bini/positive)/P(bini/negative))
where P(bini/positive) and P(bini/negative) are the frequencies of positives and negatives from control sets (see
below), respectively, that belong in bin i. The total LLS for
each gene in our list was the result of adding all individual
Ferrezuelo et al. Genome Biology 2010, 11:R67
/>
LLSs from the corresponding bins for the nine classifiers
considered. All scores can be found in Additional file 2.
Page 15 of 18
information was obtained from two recent genome-wide
studies [54,55].
Expression data
Control sets
To train our model, we created positive and negative control sets for both factors, Mbp1 and Swi4. Positive and
negative interactors were chosen from our list of 445 candidates. Positives were genes defined as targets of Mbp1
or Swi4 in both Beyer et al. [22] and Holloway et al. [23].
We avoided picking up genes regulated by both Mbp1
and Swi4, as well as other cell cycle TFs (Ste12, Fkh2,
Ndd1 or Mcm1). Because this gave rise to too few positives, especially for Swi4, we added some targets that
were top ranked in either classification (although not in
both). For these, we also avoided those regulated by both
factors. We ended up with 40 positives for Mbp1 (90%
shared by Beyer et al. and Holloway et al.), and 32 positives for Swi4 (50% shared by Beyer et al. and Holloway et
al.). The negative set for Mbp1 (or Swi4) consisted of randomly selected genes from our list of 445 candidates that
were not reported to be regulated by Mbp1 (or Swi4) in
Beyer et al.'s or Holloway et al.'s studies. We selected five
groups of 40 genes for Mbp1, and five groups of 32 genes
for Swi4. The five groups were merged into a single negative set.
Classifiers
We used nine classifiers integrating different lines of evidence: one from TF binding data, one from TF motifs,
four from the expression data we generated in this study,
one from expression profiling during the cell cycle, and
two from the expression profiling upon Cln3 or Clb2
overexpression, as reported in a previous study [3].
Transcription factor binding information
We used TF binding data from four genome-wide studies
that used ChIP-chip technology [15-18]. We considered
the assignments proposed by Iyer et al. [15], and those
TF-target interactions with a P-value ‹0.001 from the
other three studies. For MBF, we evaluated three conditions: none of the studies, only one study, and more than
one study detected an interaction. For SBF, we did the
same, but SBF interactions detected by Iyer et al. were
considered more reliable and consequently given more
weight. The rationale behind this is that Iyer et al. performed multiple ChIP-chip experiments with Swi4, and
they arguably produced better quality data for this factor.
Also, preliminary comparisons of our expression dataset
with that of Iyer et al. and from the other three ChIP-chip
studies suggested better agreement with the former
study.
Transcription factor motifs
For MBF, we evaluated whether the promoters of genes
had at least one MCB consensus site (ACGCGT) within
the first 200 bp upstream of the TSS or not. For SBF, we
examined the presence of at least one SCB consensus site
(CRCGAA) located within 400 bp of the TSS. The TSS
We evaluated six classifiers from the expression profiles
generated in this study, and three more from data generated by others. (1) The time of peak expression in the
wild-type strain. This parameter was divided into four
groups according to the sampling performed, that is, 20,
40, 60 and 80 min. (2) The value at 20 minutes in the
wild-type strain. (3) The ratio between the maximum
value in the wild-type strain series and the maximum in
the mbp1Δ mutant as well as (4) the correlation between
the profiles in the wild-type and in the mbp1Δ backgrounds. These two classifiers were used only for Mbp1.
For Swi4, we evaluated (5) the average value at 40 and 60
minutes in the wild type as well as (6) the ratio between
the maximum value at 20 or 40 minutes in the wild type
and the maximum value in the swi4Δ background. From
the work of Spellman and co-workers [3], we analyzed (7)
the value of induction upon Cln3 or (8) upon Clb2 overexpression. Finally, we also considered (9) the time of
peak expression during the mitotic cell cycle [20,45].
Evaluation of predictions and thresholding
We first created several benchmarks of positives and negatives. Positive benchmarks for both Mbp1 and Swi4 were
created with 40 genes each. All benchmarks contained
ten genes that had been reported as regulated by both
factors in previous classifications [22,23]. The remaining
30 genes for each particular benchmark were randomly
selected among those targets regulated by Mbp1 (or
Swi4) in any of those studies. None of the genes in the
benchmark sets had been used before in the training sets.
We generated two positive benchmarks for each factor.
Negatives for Mbp1 or Swi4 were randomly selected
among those genes that were not regulated by Mbp1 or
Swi4, respectively, in Beyer et al.'s and Holloway et al.'s
studies. For each factor, we randomly selected 40 genes
twice, and merged the two groups. Hence, the negative
benchmarks contained somewhat fewer than 80 genes
each.
Throughout this study we have used several statistical
measures commonly employed to assess the quality of
binary classifications. They are defined as follows:
MCC =
(TP ×TN ) −( FP × FN )
(TP + FP )(TP + FN )(TN + FP )(TN + FN )
TP + TN
TP + FN + FP + TN
TN
Specificity =
FP + TN
TP
Sensitivity =
TP + FN
TP
Precision =
s
TP + FP
Accuracy =
Ferrezuelo et al. Genome Biology 2010, 11:R67
/>
where TP is true positives, TN true negatives, FP false
positives, and FN false negatives.
To select thresholds, we calculated these measures at
any given position in our classifications. We averaged
(geometric mean) the values obtained with each positive
benchmark. We chose as cutoff a ranking value that produced high specificity and precision (›80%) as well as a
high value for the MCC. Likely, these quality measures
produced underestimated values because at least some of
the targets in the positive benchmarks may not be true
positives (many were reported as targets by Beyer et al. or
Holloway et al., but not by both studies) and some of the
genes in the negative benchmarks may actually be positive. In fact, we have predicted some targets that escaped
previous detection.
ChIP assays
Strains used in ChIP assays were derived from BY4741
(MATa his3Δ1, leu2Δ0, met15Δ0, ura3Δ0). We tagged
Mbp1 or Swi4 with tandem affinity purification (TAP) tag
[56]. Correct tagging was checked by PCR and western
blotting. Tagged strains and untagged control were grown
in YPD at 30°C to an OD600 of ‹0.25, split in two, α factor
(5 mg/l) was added to one culture, and all cultures were
incubated at 30°C for an extra 90 minutes. At this point,
in the cultures with α factor most cells were arrested at
G1 as determined by microscope inspection. We used 40
ml of culture per ChIP. These were carried out as previously described [49] with modifications. Briefly, after
formaldehyde cross-linking, cells were broken in a BioSpec (Bartlesville, OK, USA) mini-beadbeater-16 (6
pulses of 1 minute with 1 minute on ice between pulses),
chromatin was sheared in an MSE (London, UK) soniprep-150 sonicator (power 10, 6 pulses of 15 s, ice 1 minute between pulses), and clarified extracts were incubated
with 50 μl magnetic beads (Dynabeads Pan mouse IgG,
Invitrogen Dynal, Oslo, Norway) for 90 minutes at 4°C.
Washes were carried out at room temperature, and after
elution and reversal of the cross-link, we treated with
proteinase K (0.25 mg/ml, 2 h, 37°C). DNA was purified
with a Qiagen (Valencia, CA, USA) column (PCR
QIAquick PCR purification kit) and eluted with 100 μl
elution buffer (10 mM Tris-Cl pH 8.5). Finally, RNase A
was added to 0.5 mg/ml and incubated for 2 h at 37°C.
PCR was carried out for 28 (tagged strains) or 30 cycles
(untagged controls). PCR products were separated in
2.4% agarose gels, stained with SYBR gold (Invitrogen,
Carlsbad, CA, USA), and imaged with an AlphaDigiDoc
RT2 gel documentation system (Alpha Innotech, Santa
Clara, CA, USA). Quantification of bands was performed
using ImageJ.
Miscellaneous
For our functional analysis, we focused on several functional classes that were more over-represented among
Page 16 of 18
our predicted targets according to the Munich Information Center for Protein Sequences (MIPS) functional
catalog [57]. Sometimes we removed genes to make
them non-overlapping. The final classes considered
were as follows: cell wall and glycosylation; budding
and polarity; spindle pole body (SPB); cytoskeleton
(excluding SPB, budding and polarity members); DNA
conformation modification; DNA replication, recombination and repair (excluding members involved in
DNA conformation modification); and cell cycle
(excluding genes involved in DNA processing, SPB,
budding or polarity). The heat map in Figure 2 was
generated with the Java TreeView software [58]. Venn
diagrams in Figure 3 were created with an Applet from
[59]. To match and visualize motifs at promoters we
used the tools implemented in the Regulatory
Sequence Analysis Tools web site [60].
Additional material
Additional file 1 Log2 expression values for the 445 candidate genes
selected from our microarray analysis. This file contains log2 expression
values (relative to time 0) for the 445 candidate genes selected from our
microarray analysis. There are two sheets labeled 'Average_values' and
'Duplicate_experiments'. The 'Duplicate_experiments' sheet contains the
values of two independent experiments (denoted _1 and _2 following the
name of strain and time). The 'Average_values' sheet contains the data represented in Figure 2, corresponding to the average values of the two independent experiments mentioned above. Arrays are labeled with the
relevant genotype of the strain and the time of sampling. Same color is
used for all the arrays obtained with the same strain. The background context for all strains was bck2Δ PMET3·CLN2. Except for strain cln3Δ, cells also
had PGAL1·CLN3 at the endogeneous CLN3 locus (wt stands for wild type).
Additional file 2 Log likelihood scores for the 445 candidates analyzed in our study. Matrix containing the individual values assigned to
each gene in all nine classifiers used in our model and the final score
obtained (column SUM). Each sheet corresponds to one TF. 'PEAK TIME'
evaluates the time of peak expression in the wild-type strain in our experiments. 'Value 20' wt' evaluates the value at 20 minutes in the wild-type
strain whereas 'Av. value 40-60 wt' (only Swi4) corresponds to the average
value at 40 and 60 minutes in the wild type. In 'Corr. wt/mbp1Δ' we assess
the value for the correlation coefficient between the expression patterns in
the wild type versus the mbp1Δ strain. 'max wt/max mbp1Δ' (only Mbp1)
refers to the ratio between the maximum value in the wild-type series (20
to 80 minutes) and the maximum in the mbp1Δ mutant. Similarly, 'max
wt_20-40/max swi4Δ' makes reference to the ratio between the maximum
value at 20 or 40 minutes in the wild type and the maximum value in the
swi4Δ background. For 'Mbp1 motifs' we evaluated whether the promoters
of genes had at least one MCB consensus site (ACGCGT) within the first 200
bp upstream of the TSS or not. For SBF ('Swi4 motifs'), we examined the
presence of at least one SCB consensus site (CRCGAA) located within 400
bp of the TSS. In 'Mbp1 binding' we evaluate TF binding data from four
genome-wide studies that used ChIP-chip technology [15-18]. We considered the assignments proposed by Iyer et al. [15], and those TF-target interactions with a P-value ‹0.001 from the other three studies. Three conditions
were assessed: none of the studies, only one study, and more than one
study detected an interaction. The same applies to 'Swi4 binding' but interactions detected by Iyer et al. were considered more reliable and consequently given more weight (see Materials and methods for details). In 'cln3'
and 'clb2', we analyzed the value of induction upon Cln3 or upon Clb2 overexpression in [3]. Finally, 'CC peak' assesses the time of peak expression during the mitotic cell cycle.
Ferrezuelo et al. Genome Biology 2010, 11:R67
/>
Additional file 3 Full lists of predicted targets. This file contains the full
lists of predicted targets for both factors, MBF and SBF (two sheets labeled
correspondingly). Cell cycle peak was taken from [20,45]. References for
publications where binding of TF or predictions of the gene as target have
been reported are given in the 'TF binding' and 'Previous classifications' columns, respectively. For MBF, the number of ACGCG motifs in the first 200 bp
upstream of the TSS and motifs beyond the first 200 bp (between parentheses) are given. For SBF, the number of CRCGAA motifs in the first 400 bp
upstream of the TSS and motifs beyond the first 400 bp (between parentheses) are given. 'SGD description' refers to gene product description in
the Saccharomyces Genome Database. 'Functional class' includes some
modified functional classes according to the MIPS functional catalog (see
Materials and methods for details).
Additional file 4 Cell cycle distributions of predicted targets according to the timing of peak expression. This figure constitutes an expansion of Figure 4 of the paper. It shows the cell cycle distributions of
predicted targets according to the timing of peak expression for a number
of classifications: F, this study; B, [22]; H, [23]; BJ, [35]; T, [36]; W, [38]; G, [37].
Values on the x-axis are percentages of the whole duration of the cycle, as
defined in [20]. Red, MBF targets; blue, SBF targets; green, both MBF and
SBF targets; gray, our 445 candidates not classified eventually as MBF or SBF
targets. Note that y-axis scales vary across classifications.
Additional file 5 Cell cycle distributions of predicted targets according to the timing of activation of expression from [39]. Letter and color
keys as in Additional file 4.
Additional file 6 Cell cycle distributions of predicted targets according to the timing of deactivation of expression from [39]. Letter and
color keys as in Additional file 4.
Additional file 7 The 648 genes considered as cell cycle regulated in
this study. These genes appear among the top 800 ranked in at least three
of five cell cycle studies [3,20,45,52,53]. The time of their peak expression is
also shown [20,45].
Page 17 of 18
4.
5.
6.
7.
8.
9.
10.
11.
12.
13.
14.
Abbreviations
bp: base pair; CCR: cell-cycle regulated; CDK: cyclin-dependent kinase; ChIP:
chromatin immunoprecipitation; LLS: log likelihood score; MCC: Matthews correlation coefficient; SPB: spindle pole body; TF: transcription factor; TSS: transcription start site.
15.
Authors' contributions
FF and BF designed the experiments; FF performed the experiments; NC and
MA contributed reagents and experimental assistance; FF and MA analyzed the
data; FF wrote the paper.
17.
Acknowledgements
Thanks to Sylvia Gutiérrez Erlandsson for technical assistance with flow cytometry, Herman Wijnen for providing plasmid pML1 (pRS313-PMET3 CLN2), and two
anonymous reviewers for their helpful suggestions. This work was funded by
the Ministerio de Ciencia e Innovación of Spain (Consolider-Ingenio 2010), and
the European Union (FEDER). FF and NC are researchers of the Ramón y Cajal
program.
18.
Author Details
1Departament de Ciències Mèdiques Bàsiques, Institut de Recerca Biomèdica
de Lleida, Universitat de Lleida, Montserrat Roig 2, 25008 Lleida, Spain and
2Department of Molecular Genetics and Microbiology, Stony Brook University,
Stony Brook, NY 11794, USA
20.
Received: 8 May 2010 Accepted: 23 June 2010
Published: 23 June 2010
Genome Biologyaccess 11:R67distributed under the terms of the Creative Commons Attribution License ( which permits unrestricted use, distribution, and reproduction in any medium, provided the original work is properly cited.
© 2010 Ferrezuelo et al.; licensee BioMed Central Ltd.
This article is available article />is an open 2010, from:
References
1. Hartwell LH: Saccharomyces cerevisiae cell cycle. Bacteriol Rev 1974,
38:164-198.
2. Cho RJ, Campbell MJ, Winzeler EA, Steinmetz L, Conway A, Wodicka L,
Wolfsberg TG, Gabrielian AE, Landsman D, Lockhart DJ, Davis RW: A
genome-wide transcriptional analysis of the mitotic cell cycle. Mol Cell
1998, 2:65-73.
3. Spellman PT, Sherlock G, Zhang MQ, Iyer VR, Anders K, Eisen MB, Brown
PO, Botstein D, Futcher B: Comprehensive identification of cell cycle-
16.
19.
21.
22.
23.
24.
25.
regulated genes of the yeast Saccharomyces cerevisiae by microarray
hybridization. Mol Biol Cell 1998, 9:3273-3297.
Breeden L: Start-specific transcription in yeast. Curr Top Microbiol
Immunol 1996, 208:95-127.
Dirick L, Moll T, Auer H, Nasmyth K: A central role for SWI6 in modulating
cell cycle Start-specific transcription in yeast. Nature 1992, 357:508-513.
Partridge JF, Mikesell GE, Breeden LL: Cell cycle-dependent transcription
of CLN1 involves Swi4 binding to MCB-like elements. J Biol Chem 1997,
272:9071-9077.
Taylor IA, McIntosh PB, Pala P, Treiber MK, Howell S, Lane AN, Smerdon SJ:
Characterization of the DNA-binding domains from the yeast cell-cycle
transcription factors Mbp1 and Swi4. Biochemistry 2000, 39:3943-3954.
Koch C, Moll T, Neuberg M, Ahorn H, Nasmyth K: A role for the
transcription factors Mbp1 and Swi4 in progression from G1 to S
phase. Science 1993, 261:1551-1557.
Koch C, Schleiffer A, Ammerer G, Nasmyth K: Switching transcription on
and off during the yeast cell cycle: Cln/Cdc28 kinases activate bound
transcription factor SBF (Swi4/Swi6) at start, whereas Clb/Cdc28
kinases displace it from the promoter in G2. Genes Dev 1996,
10:129-141.
Harrington LA, Andrews BJ: Binding to the yeast SwI4,6-dependent cell
cycle box, CACGAAA, is cell cycle regulated in vivo. Nucleic Acids Res
1996, 24:558-565.
Cosma MP, Panizza S, Nasmyth K: Cdk1 triggers association of RNA
polymerase to cell cycle promoters only after recruitment of the
mediator by SBF. Mol Cell 2001, 7:1213-1220.
Costanzo M, Nishikawa JL, Tang X, Millman JS, Schub O, Breitkreuz K,
Dewar D, Rupes I, Andrews B, Tyers M: CDK activity antagonizes Whi5, an
inhibitor of G1/S transcription in yeast. Cell 2004, 117:899-913.
de Bruin RA, McDonald WH, Kalashnikova TI, Yates J, Wittenberg C: Cln3
activates G1-specific transcription via phosphorylation of the SBF
bound repressor Whi5. Cell 2004, 117:887-898.
Skotheim J, Di Talia S, Siggia E, Cross F: Positive feedback of G1 cyclins
ensures coherent cell cycle entry. Nature 2008, 454:291-296.
Iyer VR, Horak CE, Scafe CS, Botstein D, Snyder M, Brown PO: Genomic
binding sites of the yeast cell-cycle transcription factors SBF and MBF.
Nature 2001, 409:533-538.
Simon I, Barnett J, Hannett N, Harbison CT, Rinaldi NJ, Volkert TL, Wyrick JJ,
Zeitlinger J, Gifford DK, Jaakkola TS, Young RA: Serial regulation of
transcriptional regulators in the yeast cell cycle. Cell 2001, 106:697-708.
Lee TI, Rinaldi NJ, Robert F, Odom DT, Bar-Josep Z, Gerber GK, Hannett
NM, Harbison CT, Thompson CM, Simon I, Zeitlinger J, Jennings EG,
Murray HL, Gordon DB, Ren B, Wyrick JJ, Tagne JB, Volkert TL, Fraenkel E,
Gifford DK, Young RA: Transcriptional regulatory networks in
Saccharomyces cerevisiae. Science 2002, 298:799-804.
Harbison CT, Gordon DB, Lee TI, Rinaldi NJ, Macisaac KD, Danford TW,
Hannett NM, Tagne JB, Reynolds DB, Yoo J, Jennings EG, Zeitlinger J,
Pokholok DK, Kellis M, Rolfe PA, Takusagawa KT, Lander ES, Gifford DK,
Fraenkel E, Young RA: Transcriptional regulatory code of a eukaryotic
genome. Nature 2004, 431:99-104.
Bean JM, Siggia ED, Cross FR: High functional overlap between MluI cellcycle box binding factor and Swi4/6 cell-cycle box binding factor in the
G1/S transcriptional program in Saccharomyces cerevisiae. Genetics
2005, 171:49-61.
Pramila T, Wu W, Miles S, Noble WS, Breeden LL: The Forkhead
transcription factor Hcm1 regulates chromosome segregation genes
and fills the S-phase gap in the transcriptional circuitry of the cell cycle.
Genes Dev 2006, 20:2266-2278.
Lee HJ, Manke T, Bringas R, Vingron M: Prioritization of gene regulatory
interactions from large-scale modules in yeast. BMC Bioinformatics
2008, 9:32.
Beyer A, Workman C, Hollunder J, Radke D, Möller U, Wilhelm T, Ideker T:
Integrated assessment and prediction of transcription factor binding.
PLoS Comput Biol 2006, 2:e70.
Holloway DT, Kon M, DeLisi C: Classifying transcription factor targets
and discovering relevant biological features. Biol Direct 2008, 3:22.
Epstein CB, Cross FR: Genes that can bypass the CLN requirement for
Saccharomyces cerevisiae cell cycle START. Mol Cell Biol 1994,
14:2041-2047.
Di Como CJ, Chang H, Arndt KT: Activation of CLN1 and CLN2 G1 cyclin
gene expression by BCK2. Mol Cell Biol 1995, 15:1835-1846.
Ferrezuelo et al. Genome Biology 2010, 11:R67
/>
26. Wijnen H, Futcher B: Genetic analysis of the shared role of CLN3 and
BCK2 at the G(1)-S transition in Saccharomyces cerevisiae. Genetics
1999, 153:1131-1143.
27. Ferrezuelo F, Aldea M, Futcher B: Bck2 is a phase-independent activator
of cell cycle-regulated genes in yeast. Cell Cycle 2009, 8:239-252.
28. Wijnen H, Landman A, Futcher B: The G(1) cyclin Cln3 promotes cell
cycle entry via the transcription factor Swi6. Mol Cell Biol 2002,
22:4402-4418.
29. Gunjan A, Paik J, Verreault A: Regulation of histone synthesis and
nucleosome assembly. Biochimie 2005, 87:625-635.
30. Lee I, Date SV, Adai AT, Marcotte EM: A probabilistic functional network
of yeast genes. Science 2004, 306:1555-1558.
31. Matthews BW: Comparison of the predicted and observed secondary
structure of T4 phage lysozyme. Biochim Biophys Acta 1975,
405:442-451.
32. Mendenhall MD, Hodge AE: Regulation of Cdc28 cyclin-dependent
protein kinase activity during the cell cycle of the yeast Saccharomyces
cerevisiae. Microbiol Mol Biol Rev 1998, 62:1191-1243.
33. de Bruin RAM, Kalashnikova TI, Chahwan C, McDonald WH, Wohlschlegel
J, Yates J, Russell P, Wittenberg C: Constraining G1-specific transcription
to late G1 phase: the MBF-associated corepressor Nrm1 acts via
negative feedback. Mol Cell 2006, 23:483-496.
34. Ashe M, de Bruin RA, Kalashnikova T, McDonald WH, Yates JR, Wittenberg
C: The SBF- and MBF-associated protein Msa1 is required for proper
timing of G1-specific transcription in Saccharomyces cerevisiae. J Biol
Chem 2008, 283:6040-6049.
35. Bar-Joseph Z, Gerber GK, Lee TI, Rinaldi NJ, Yoo JY, Robert F, Gordon DB,
Fraenkel E, Jaakkola TS, Young RA, Gifford DK: Computational discovery
of gene modules and regulatory networks. Nat Biotechnol 2003,
21:1337-1342.
36. Tanay A, Sharan R, Kupiec M, Shamir R: Revealing modularity and
organization in the yeast molecular network by integrated analysis of
highly heterogeneous genomewide data. Proc Natl Acad Sci USA 2004,
101:2981-2986.
37. Gao F, Foat BC, Bussemaker HJ: Defining transcriptional networks
through integrative modeling of mRNA expression and transcription
factor binding data. BMC Bioinformatics 2004, 5:31.
38. Wu WS, Li WH, Chen BS: Computational reconstruction of
transcriptional regulatory modules of the yeast cell cycle. BMC
Bioinformatics 2006, 7:421.
39. Zhao LP, Prentice R, Breeden L: Statistical modeling of large microarray
data sets to identify stimulus-response profiles. Proc Natl Acad Sci USA
2001, 98:5631-5636.
40. Amon A, Tyers M, Futcher B, Nasmyth K: Mechanisms that help the yeast
cell cycle clock tick: G2 cyclins transcriptionally activate G2 cyclins and
repress G1 cyclins. Cell 1993, 74:993-1007.
41. Lowndes NF, Johnson AL, Johnston LH: Coordination of expression of
DNA synthesis genes in budding yeast by a cell-cycle regulated trans
factor. Nature 1991, 350:247-250.
42. Igual JC, Johnson AL, Johnston LH: Coordinated regulation of gene
expression by the cell cycle transcription factor Swi4 and the protein
kinase C MAP kinase pathway for yeast cell integrity. EMBO J 1996,
15:5001-5013.
43. Lesage G, Bussey H: Cell wall assembly in Saccharomyces cerevisiae.
Microbiol Mol Biol Rev 2006, 70:317-343.
44. Chen L, Cai L, Skogerbø G, Zhao Y, Chen R: Assessing TF regulatory
relationships of divergently transcribed genes. Genomics 2008,
92:316-321.
45. de Lichtenberg U, Jensen LJ, Fausbøll A, Jensen TS, Bork P, Brunak S:
Comparison of computational methods for the identification of cell
cycle-regulated genes. Bioinformatics 2005, 21:1164-1171.
46. Kato M, Hata N, Banerjee N, Futcher B, Zhang MQ: Identifying
combinatorial regulation of transcription factors and binding motifs.
Genome Biol 2004, 5:R56.
47. Costanzo M, Schub O, Andrews B: G1 transcription factors are
differentially regulated in Saccharomyces cerevisiae by the Swi6binding protein Stb1. Mol Cell Biol 2003, 23:5064-5077.
48. de Bruin RA, Kalashnikova TI, Wittenberg C: Stb1 collaborates with other
regulators to modulate the G1-specific transcriptional circuit. Mol Cell
Biol 2008, 28:6919-6928.
Page 18 of 18
49. Wang H, Carey LB, Cai Y, Wijnen H, Futcher B: Recruitment of Cln3 cyclin
to promoters controls cell cycle entry via histone deacetylase and
other targets. PLoS Biol 2009, 7:e1000189.
50. Takahata S, Yu Y, Stillman DJ: The E2F functional analogue SBF recruits
the Rpd3(L) HDAC, via Whi5 and Stb1, and the FACT chromatin
reorganizer, to yeast G1 cyclin promoters. EMBO J 2009, 28:3378-3389.
51. Eisen MB, Spellman PT, Brown PO, Botstein D: Cluster analysis and
display of genome-wide expression patterns. Proc Natl Acad Sci USA
1998, 95:14863-14868.
52. Rowicka M, Kudlicki A, Tu BP, Otwinowski Z: High-resolution timing of
cell cycle-regulated gene expression. Proc Natl Acad Sci USA 2007,
104:16892-16897.
53. Orlando DA, Lin CY, Bernard A, Wang JY, Socolar JE, Iversen ES, Hartemink
AJ, Haase SB: Global control of cell-cycle transcription by coupled CDK
and network oscillators. Nature 2008, 453:944-947.
54. David L, Huber W, Granovskaia M, Toedling J, Palm CJ, Bofkin L, Jones T,
Davis RW, Steinmetz LM: A high-resolution map of transcription in the
yeast genome. Proc Natl Acad Sci USA 2006, 103:5320-5325.
55. Nagalakshmi U, Wang Z, Waern K, Shou C, Raha D, Gerstein M, Snyder M:
The transcriptional landscape of the yeast genome defined by RNA
sequencing. Science 2008, 320:1344-1349.
56. Rigaut G, Shevchenko A, Rutz B, Wilm M, Mann M, Séraphin B: A generic
protein purification method for protein complex characterization and
proteome exploration. Nat Biotechnol 1999, 17:1030-1032.
57. Ruepp A, Zollner A, Maier D, Albermann K, Hani J, Mokrejs M, Tetko I,
Güldener U, Mannhaupt G, Münsterkötter M, Mewes HW: The FunCat, a
functional annotation scheme for systematic classification of proteins
from whole genomes. Nucleic Acids Res 2004, 32:5539-5545.
58. Saldanha AJ: Java Treeview - extensible visualization of microarray data.
Bioinformatics 2004, 20:3246-3248.
59. Applet for Drawing 3 Set Area-proportional Venn Diagrams [http://
www.cs.kent.ac.uk/people/staff/pjr/EulerVennCircles/
EulerVennApplet.html]
60. van Helden J, André B, Collado-Vides J: A web site for the computational
analysis of yeast regulatory sequences. Yeast 2000, 16:177-187.
doi: 10.1186/gb-2010-11-6-r67
Cite this article as: Ferrezuelo et al., The transcriptional network activated by
Cln3 cyclin at the G1-to-S transition of the yeast cell cycle Genome Biology
2010, 11:R67