Báo cáo y học: "ar evolution of genes in avian genomes" doc
Bạn đang xem bản rút gọn của tài liệu. Xem và tải ngay bản đầy đủ của tài liệu tại đây (1.35 MB, 17 trang )
Nam et al. Genome Biology 2010, 11:R68
/>Open Access
RESEARCH
© 2010 Nam et al.; licensee BioMed Central Ltd. This is an open access article distributed under the terms of the Creative Commons At-
tribution License ( which permits unrestricted use, distribution, and reproduction in any
medium, provided the original work is properly cited.
Research
Molecular evolution of genes in avian genomes
Kiwoong Nam
1
, Carina Mugal
1
, Benoit Nabholz
1
, Holger Schielzeth
1
, Jochen BW Wolf
1
, Niclas Backström
1
,
Axel Künstner
1
, Christopher N Balakrishnan
2
, Andreas Heger
3
, Chris P Ponting
3
, David F Clayton
2
and Hans Ellegren*
1
Abstract
Background: Obtaining a draft genome sequence of the zebra finch (Taeniopygia guttata), the second bird genome to
be sequenced, provides the necessary resource for whole-genome comparative analysis of gene sequence evolution
in a non-mammalian vertebrate lineage. To analyze basic molecular evolutionary processes during avian evolution, and
to contrast these with the situation in mammals, we aligned the protein-coding sequences of 8,384 1:1 orthologs of
chicken, zebra finch, a lizard and three mammalian species.
Results: We found clear differences in the substitution rate at fourfold degenerate sites, being lowest in the ancestral
bird lineage, intermediate in the chicken lineage and highest in the zebra finch lineage, possibly reflecting differences
in generation time. We identified positively selected and/or rapidly evolving genes in avian lineages and found an over-
representation of several functional classes, including anion transporter activity, calcium ion binding, cell adhesion and
microtubule cytoskeleton.
Conclusions: Focusing specifically on genes of neurological interest and genes differentially expressed in the unique
vocal control nuclei of the songbird brain, we find a number of positively selected genes, including synaptic receptors.
We found no evidence that selection for beneficial alleles is more efficient in regions of high recombination; in fact,
there was a weak yet significant negative correlation between ω and recombination rate, which is in the direction
predicted by the Hill-Robertson effect if slightly deleterious mutations contribute to protein evolution. These findings
set the stage for studies of functional genetics of avian genes.
Background
There are nearly 10,000 known species of birds and many
of these have been instrumental in studies of general
aspects of behavior, ecology and evolution. Such basic
knowledge on life history and natural history will become
an important resource for studies aiming at elucidating
the genetic background to phenotypic evolution in natu-
ral bird populations [1]. There have already been some
attempts in this direction, including the demonstration
that the calmodulin pathway is involved in the evolution
of the spectacular differences in beak morphology among
Darwin's finches [2,3] and the critical role of MC1R gov-
erning variation in plumage color in several bird species
[4].
At the genomic level, birds have attracted the attention
of biologists for several reasons. First, compared to other
vertebrates, avian genomes are compact, with estimated
DNA content typically in the range of 1.0 to 1.5 Gb, about
half to one-third of the amount of DNA found in most
mammals [5]. It seems clear that this is mainly due to a
relatively low activity of transposable elements in birds
[6]. Second, the avian karyotype is largely conserved [7]
and is characterized by a high degree of conserved syn-
teny. In contrast to mammals, avian chromosomes show
significant variation in size, with the karyotype of many
species containing five to ten large chromosomes ('mac-
rochromosomes') that are comparable in size to small to
medium-sized human chromosomes, and a large number
of very small chromosomes (<20 Mb) referred to as
microchromosomes. Third, birds have female heterog-
amety, with the Z and W sex chromosomes present in
females while males are ZZ. Moreover, and quite surpris-
ingly, recent evidence shows that birds do not have dos-
age compensation of Z chromosome genes [8,9].
The draft sequence of the chicken (Gallus gallus)
genome [10] provided a starting point for evolutionary
genomic analyses of birds. For example, it was found that
the rate of synonymous substitution (d
S
) correlates nega-
* Correspondence:
1
Department of Evolutionary Biology, Evolutionary Biology Centre, Uppsala
University, Norbyvägen 18D, Uppsala, S-752 36, Sweden
Full list of author information is available at the end of the article
Nam et al. Genome Biology 2010, 11:R68
/>Page 2 of 17
tively with chromosome size [11], something that may be
related to GC content and recombination rate, which are
both also negatively correlated with chromosome size.
Moreover, the heterogeneous nature of the rate of recom-
bination across avian chromosomes seems to have a sig-
nificant effect on the evolution of base composition,
reinforcing the heterogeneity in GC content (isochores)
[12], which contrasts with the situation in mammals
where isochores are generally decaying [13]. More
recently, there have been initial attempts toward identify-
ing genes subject to positive selection in avian lineages
[14] and quantification of adaptive evolution in avian
genes and genomes [15].
Now the genome of a second avian species, the zebra
finch (Taeniopygia guttata), has been sequenced and
assembled [16]. With this additional reference point,
comparative genomic analysis of evolutionary processes
in birds can begin in earnest. In this study we analyzed
the molecular evolution of all known single-copy protein-
coding genes shared by the chicken, zebra finch and
mammalian genomes. We compared rates of sequence
divergence and protein evolution in chicken and zebra
finch lineages as well as in the ancestral bird branch lead-
ing from the split between birds and lizards some 285
million years ago. We looked for signals of selection to
identify interesting genes for functional studies, similar to
previous scans for positively selected genes in the human
genome [17,18].
Additionally, we paid special attention to zebra finch
orthologs of genes that have known significance in
human learning, neurogenesis and neurodegeneration,
using information in the Online Mendelian Inheritance in
Man (OMIM) database. The zebra finch is an important
model organism for these aspects of neuroscience
[19,20]), and indeed this was a major motivation for the
decision to determine its genome sequence [21]. The
zebra finch is a songbird, one of several thousand oscines
in the order Passeriformes. Songbirds communicate via
learned vocalizations, under the control of a unique cir-
cuit of interconnected brain nuclei that evolved only in
songbirds but have parallels in the human brain [22-24].
Studies of vocal learning in songbirds have revealed roles
for lifelong neuronal turnover (neurodegeneration and
neurogeneration) in the adult brain [19,20]. Hence, it is
worthwhile to assess the evolutionary relationships of
genes potentially involved in these processes in both
humans and songbirds.
Results
Pairwise comparison of the chicken and zebra finch
protein-coding gene sets
We identified 11,225 1:1 orthologs from the pairwise
comparison of all protein-coding genes in the chicken
and zebra finch draft genome sequences. This corre-
sponds to 60 to 65% of the total number of genes in the
avian genome [10]. The overall degree of neutral diver-
gence, as approximated by the rate of synonymous substi-
tution (d
S
) from 1,000 random sets of 150 genes [25],
between these two bird species was 0.418 (95% confi-
dence interval = 0.387 to 0.458). The overall ω (d
N
/d
S
) in
the pairwise comparison was 0.152 (95% confidence
interval = 0.127 to 0.179).
Lineage-specific rates of evolution
For most of the subsequent analyses we used codon-
based multiple species alignments of 8,384 1:1 orthologs
of chicken, zebra finch, Anolis (lizard), and three mam-
mals, including platypus, opossum, human or mouse (see
phylogeny in Figure S1 in Additional file 1), thereby
allowing lineage-specific estimates of rates of evolution.
The rationale for focusing on single-copy genes was that
we sought to avoid problems arising from the establish-
ment of orthology/paralogy within gene families of birds
and/or mammals. The estimates are sensitive to proce-
dures for alignment and the substitution rate models
used; see Additional file 2 for a justification of the meth-
ods applied here. Table 1 summarizes the estimates of
mean d
N
, d
S
and ω using a free-ratio model for: (i), the
ancestral bird lineage from the split between birds and
lizards some 285 million years ago (MYA) [26] until the
Table 1: Summary statistics of the overall rate of non-synonymous (d
N
) and synonymous (d
S
) substitution, and their ratio
(ω) in avian lineages
Pairwise chicken-zebra finch Zebra finch Chicken Ancestral bird lineage
Overall d
N
0.0635 0.0283 0.0239 0.0288
(0.0517-0.0777) (0.0225-0.0350) (0.0185-0.0316) (0.0241-0.0345)
Overall d
S
0.4184 0.2133 0.1973 0.2600
(0.3868-0.4584) (0.1929-0.2384) (0.1810-0.2154) (0.2361-0.2834)
Overall ω 0.1517 0.1326 0.1208 0.1107
(0.1270-0.1788) (0.1080-0.1601) (0.0973-0.1527) (0.0942-0.1295)
95% confidence intervals based on resampling are given in parentheses.
Nam et al. Genome Biology 2010, 11:R68
/>Page 3 of 17
split between the chicken (Galloanserae) and zebra finch
(Neoaves) lineages, for which we use an estimate of 90
MYA [27]; (ii), the chicken lineage; and (iii), the zebra
finch lineage since the split between Galloanserae and
Neoaves (Figure S1 in Additional file 1).
d
S
was significantly (8%) higher in the zebra finch
(0.213) than in the chicken lineage (0.197; P < 2.2 × 10
-16
,
Wilcoxon signed rank test; Table 1), indicating a differ-
ence in the molecular clock of these two parallel lineages.
d
S
of the ancestral bird lineage was higher (0.260) than in
the two terminal branches, which is not unexpected given
the estimated divergence times. The divergence at four-
fold degenerate sites showed the same trend, and was
highest in the ancestral bird lineage (mean of 1 Mb inter-
vals = 0.239), and higher in zebra finch (0.199) than in
chicken (0.172). We estimated lineage-specific mutation
rates by dividing the divergence at fourfold degenerate
sites with the estimated age of lineages according to the
divergence times given above. We found that the muta-
tion rate was lower in the ancestral bird lineage (1.23 ×
10
-9
site
-1
year
-1
)than in both the chicken lineage (1.91 ×
10
-9
site
-1
year
-1
; P < 2 × 10
-16
) and the zebra finch lineage
(2.21 × 10
-9
site
-1
year
-1
; P < 2 × 10
-16
), and that the rate in
the chicken lineage was significantly lower than the rate
in the zebra finch lineage (P < 1 × 10
-5
).
The divergence at fourfold degenerate sites of ortholo-
gous genes was significantly correlated between zebra
finch and chicken on the basis of 1 Mb windows, explain-
ing 13 to 14% of the among-windows variance (Table 2).
The correlations involving the ancestral lineage were
weak and non-significant. Since local GC content is also
conserved between zebra finch and chicken, controlling
for GC content (see Materials and methods) strongly
reduced the correlation between zebra finch and chicken
divergence (from r
2
= 0.134 and 0.141 to r
2
= 0.024 and
0.019 for the zebra finch and chicken, respectively; Table
2).
The zebra finch lineage had a significantly higher over-
all ω than the chicken lineage (0.133 versus 0.121; P < 2.2
× 10
-16
, Wilcoxon signed rank test). Just as for divergence,
there was a strong correlation between individual ω val-
ues of 1:1 chicken and zebra finch orthologs (r
2
= 0.338, P
< 2 × 10
-16
). A corresponding analysis for 7,789 human
and mouse orthologs (included in the 8,384 genes from
multiple-species alignments) revealed a similarly strong
correlation (r
2
= 0.359, P < 2 × 10
-16
). Moreover, we also
found a similar strength of correlation in gene-wise ω val-
ues estimated for orthologs from the bird lineage
(chicken and zebra finch) with the mammalian lineage
(human and mouse lineages; r
2
= 0.325, P < 2 × 10
-16
). The
gene-wise correlations between ω values for the ancestral
bird lineage (which had an overall ω of 0.110) and chicken
(r
2
= 0.178, P < 2 × 10
-16
) and zebra finch (r
2
= 0.170, P < 2
× 10
-16
), respectively, were weaker.
Adaptive evolution of genes in the avian genome
We next sought to identify genes, and the functional cate-
gories these genes are associated with, that are candidates
for being involved with lineage-specific adaptations dur-
ing avian evolution. We considered the ancestral bird lin-
eage as well as the terminal chicken and zebra finch
lineages separately, and posed three specific questions.
First, which genes have evolved most rapidly in avian
lineages (high ω values), indicative of either adaptive evo-
lution or relaxed selective constraint? For this question
we used a likelihood ratio test to determine which genes
had a significantly higher ω value than the mean of all
genes in the genome. These genes are referred to as rap-
idly evolving bird (REB) genes. We used this approach
rather than simply selecting, for example, the top 5% or
Table 2: Correlations of divergence at fourfold degenerate sites between avian lineages in 1-Mb windows
Without controlling for GC Controlling for GC
R d.f. P
r
2
rP
r
2
Windows based on zebra finch genome
Zebra finch/chicken 0.366 441
1.89 × 10
-15
0.134 0.156 0.001 0.024
Zebra finch/ancestral -0.048 441 0.309 0.002 -0.146 0.002 0.021
Chicken/ancestral 0.074 441 0.119 0.005 -0.046 0.331 0.002
Windows based on the chicken genome
Chicken/zebra finch 0.778 438
3.71 × 10
-16
0.141 0.138 0.004 0.019
Chicken/ancestral 0.073 438 0.017 0.013 -0.008 0.868 0.000
Zebra finch/ancestral -0.064 438 0.180 0.004 -0.161 0.001 0.026
d.f., degrees of freedom.
Nam et al. Genome Biology 2010, 11:R68
/>Page 4 of 17
10% of genes sorted by ω value since the confidence in ω
values is dependent of alignment length and the number
of substitutions within a particular gene.
Second, which genes have evolved more rapidly in
avian lineages than in other amniote lineages (mammals
and lizard)? Here we used a branch model in PAML to
determine which genes had a significantly higher ω in
avian lineages than in other branches of the tree corre-
sponding to our data. These genes are referred to as more
rapidly evolving in birds (MREB).
Third, which genes show evidence of containing codons
that have been subject to positive selection (referred to as
PS genes) during avian evolution? For this third question
we used a branch-site model in PAML to identify genes
containing positively selected codons with ω higher than
1.
In total, 1,751 genes were identified as evolving signifi-
cantly more rapidly than the genomic average (REB) in
one or more of the three avian lineages (Table 3). Of these
REB genes, 203 (12%) were common to all three lineages
(Figure S2 in Additional file 1); 1,649 genes showed evi-
dence of more rapid evolution in one or more bird lin-
eages (MREB) than in other amniotes (Table 3). The great
majority (>97%) of these genes were specific to a single
bird lineage, with no gene common to all three lineages
(Figure S2 in Additional file 1). We also identified 1,886
PS genes in avian lineages (Table 3). Most (>85%) of these
genes showed evidence of positive selection in only a sin-
gle lineage (Figure S2 in Additional file 1). As for the REB
category, it may contain genes that evolve rapidly due to
positive selection but also due to relaxed constraint.
Using randomization tests, we compared the number of
overlapping genes between the REB and PS gene lists
with the number of overlapping genes from gene lists
generated randomly. For all three avian branches (zebra
finch, chicken, and ancestral bird lineages), the number of
overlapping genes between the PS and REB gene lists is
significantly higher than in randomized data sets (P <
0.001 for all three branches). This shows that the genes
that we identified as rapidly evolving are unlikely to be
dominated by genes evolving under relaxed constraint.
The lists of REB, MREB and PS genes will constitute a
useful resource for future research aimed at finding the
genetic basis of adaptive evolution in birds, in particular
the list of PS genes. Here we provide an initial character-
ization of genes from these lists by first testing for an
over-representation of specific gene ontologies (Table 4).
The term 'cell adhesion' was over-represented among
REB, MREB as well as PS genes in the ancestral bird lin-
eage. Terms related to ion-channel activity were over-rep-
resented among PS genes in both the ancestral bird and
chicken lineages. The ancestral lineage also showed an
over-representation of the terms blood vessel develop-
ment, synapse organization, integrin-mediated signaling
pathway and proteinaceous extracellular matrix among
MREB genes and of cytokine secretion among REB genes.
In the chicken lineage, telomere organization and sterol
transport were enriched among REB genes while in the
zebra finch lineage microtubule cytoskeleton was over-
represented among MREB genes. Table S1 in Additional
file 1 lists all genes corresponding to significantly over-
represented Gene Ontology (GO) terms.
If positively selected codons are evenly distributed
across genes and the power to detect such codons is more
or less constant, then the likelihood of detecting genes
containing positively selected codons will correlate with
alignment length. Consistent with this, three out of three
unique overrepresented GO terms from the list of posi-
tively selected genes in the ancestral bird branch have
longer mean alignment length than genes with other GO
terms (P < 0.001, Wilcoxon rank sum test). However, the
overrepresented GO terms from the list of positively
selected genes in the chicken lineage have actually shorter
mean alignment length than genes with other GO terms,
with marginal significance (P = 0.093). This warrants fur-
ther investigation, from both methodological and biologi-
cal points of view.
As a comparison, we tested for over-represented GO
terms among positively selected mammalian genes and
genes evolving significantly faster in mammals than in
birds (Table S2 in Additional file 1). However, using the
same criteria as applied to the lists of avian genes, no GO
term was significantly over-represented in the mamma-
lian lists.
Adaptive evolution of neurological genes
The lineage leading to the zebra finch and other passerine
birds is distinguished from the chicken lineage by major
neurobehavioral adaptations that have parallels in
humans, including the evolution of vocal communication
as well as other forms of learning, memory and social
cognition [28]. We filtered the lists of positively selected
Table 3: The number of REB, MREB and PS genes in different avian lineages
Ancestral lineage Chicken lineage Zebra finch lineage
Rapidly evolving bird (REB) genes 419 1,148 1,202
More rapidly evolving genes in birds (MREB) than in other amniotes 103 432 1,154
Positively selected (PS) bird genes 259 883 936
Nam et al. Genome Biology 2010, 11:R68
/>Page 5 of 17
Table 4: Over-represented Gene Ontology terms in REB, MREB and PS genes in avian lineages
Ancestral bird lineage Chicken lineage Zebra finch lineage
Gene Ontology
a
N
1
b
N
2
c
Excess P
N
1
b
N
2
c
Excess P
N
1
b
N
2
c
Excess P
Rapidly evolving in birds (REB)
Biological adhesion (B 2) 17 136 2.67 0.013
Cell adhesion (B 3) 17 135 2.69 0.013
Cytokine secretion (B 7) 4 5 17.06 0.013
Telomere organization (B 5) 5 5 7.81 0.024
Telomere maintenance (B 6) 5 5 7.81 0.024
Sterol transport (B 5) 6 7 6.69 0.024
Cholesterol transport (B 6) 6 7 6.69 0.024
More rapidly evolving in birds (MREB) than in other amniotes
Biological adhesion (B 2) 12 136 5.82 0.0002
Cell adhesion (B 3) 12 135 5.86 0.0002
Blood vessel development/maturation (B5) 2 2 65.94 0.061
Synapse organization and biogenesis (B 5) 3 12 16.49 0.088
Integrin-mediated signaling pathway (B 6) 3 11 17.98 0.088
Proteinaceous extracellular matrix (C 3)
Cytoskeletal part (C 5) 37 124 1.92 0.040
Microtubule cytoskeleton (C 7) 27 83 2.09 0.040
Positively selected (PS) in birds
Biological adhesion (B 2) 16 148 3.27 0.016
Cell adhesion (B 3) 16 147 3.29 0.016
Cell-cell adhesion (B 4) 9 57 4.78 0.035
Homophilic cell adhesion (B 5) 5 16 9.45 0.035
Calcium ion binding (M 5) 14 154 2.74 0.035
Anion transmembrane transport activity (M 6) 16 48 3.00 0.006
Terms with a false discovery rate (FDR) of adjusted P < 0.1 are shown. Excess is the fold enrichment for significant Gene Ontology terms.
a
B is biological process, M is molecular function and C is
cellular component. The numbers indicate hierarchical level.
b
Number of genes in test sample (REB, MREB and PS, respectively).
c
Number of genes in reference sample (1:1 orthologs found in the
respective lineage).
Nam et al. Genome Biology 2010, 11:R68
/>Page 6 of 17
genes in the zebra finch and chicken lineages to identify
candidate genes likely to contribute to evolution of these
traits. We began by considering the orthologs of genes
that have been most strongly implicated in learning and
neuronal plasticity in humans, identifying them by
searching the OMIM database for all genes associated
with 'learning', 'neurogeneration' or 'neurodegeneration'.
We had data from multispecies alignments for 74, 211
and 107 such genes, respectively (Table 5). We found that
15, 34 and 23 of these genes (in total, 58 unique genes)
were present in the list of 1,036 genes identified as posi-
tively selected in the zebra finch lineage (Table 5; Table S3
in Additional file 1). For the term 'neurodegeneration' in
particular, the number of positively selected genes is sig-
nificantly higher than expected by chance (P = 0.0076,
Fisher's exact test) given the overall frequency of posi-
tively selected genes among all genes in our study.
We then compared the number of genes classified as
associated with 'learning', 'neurogeneration' or 'neurode-
generation' that were found to be positively selected in
either the chicken or zebra finch lineage (that is, exclud-
ing genes that were positively selected in both lineages).
Interestingly, for each OMIM term the number of unique
positively selected genes was significantly higher in zebra
finch than in chicken (Table 5; 10 versus 5, 27 versus 15,
and 16 versus 8, respectively). This indicates that the
songbird lineage has experienced more frequent adaptive
evolution of genes relating to cognitive functions than the
galliform lineage.
The 58 neurological genes evolving under positive
selection in the songbird lineage were further assessed in
two ways. First, we asked whether any of them also show
evidence of accelerated sequence evolution in the primate
lineage, using data from the study of Dorus et al. [29].
Four genes are present on both lists: ASPM, GRIN2a,
DRD2, and LHX2 (Table 6). Second, we asked whether
any of them are also expressed differentially within the
songbird-specific song control nuclei of the zebra finch
brain. Lovell et al. [30] used a combination of microarray
and in situ hybridization analyses to identify approxi-
mately 300 genes that are differentially expressed in the
song nucleus high vocal centre (HVC) compared to the
underlying brain tissue. We found that 9 of our 58 neuro-
logical genes evolving under positive selection are also
differentially regulated in the high vocal centre (Table 6),
including glutamate receptor ion channel genes.
The relationship between selection and recombination
We sought to elucidate how the intensity of selection
and/or the influence of genetic drift, manifested in ω,
vary across the avian genome. The potential influence of
recombination on ω was of particular interest since the
rate of recombination is unusually heterogeneous within
both the chicken [31] and zebra finch [32] genomes, and
probably so for birds in general. Such heterogeneity could
set the stage for recombination affecting the efficacy of
selection and thereby ω, as predicted by evolutionary the-
ory [33] but for which there is limited empirical support
[34-38].
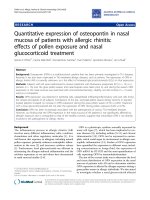
As a starting point for these analyses we first noted that
there was a weak positive correlation between ω esti-
mated for 1 Mb intervals and chromosome size in zebra
finch (Figure 1; r
2
= 0.055, P = 6 × 10
-11
) and chicken (r
2
=
0.029, P = 3 × 10
-6
). This confirms similar observations
made for a small set of chicken-turkey orthologs [11] as
well as for chicken-human orthologs [10], although the
effect we detected here with much larger data sets was
considerably weaker than indicated by those previous
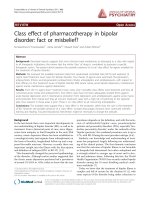
studies. There was a strong negative correlation between
the mean divergence of fourfold degenerate sites of 1 Mb
intervals and chromosome size (Figure 2; r
2
= 0.153 in
zebra finch and r
2
= 0.140 in chicken, P < 2 × 10
-16
in both
cases). These correlations were not limited to the dichot-
omy of macrochromosomes versus microchromosomes
(data not shown); indeed, for many birds chromosome
size shows a relatively continuous distribution without a
clear distinction between macrochromosomes and
microchromosomes [7].
We found a weak yet statistically significant negative
relationship between recombination rate and ω in both
Table 5: OMIM search for genes implicated in neurological processes and the number of these identified as evolving under
positive selection in the chicken and zebra finch lineages
Search term*
N
OMIM
N
align
PS
chicken
PS
zebra
P
Learning 159 74 5 10 0.050
Neurogenesis 472 211 15 27 0.017
Neurodeg‘eneration 246 107 8 16 0.025
*See Materials and methods. 'N
OMIM
' is the number of human genes identified in OMIM, 'N
align
' is the number N
OMIM
genes for which we had
data from multispecies alignments. 'PS
chicken
' and 'PS
zebra
' are the number of unique positively selected genes found in the chicken and zebra
finch lineages, respectively. P is the significance level in Fisher's exact test comparing the incidence of positively selected genes in chicken
and zebra finch.
Nam et al. Genome Biology 2010, 11:R68
/>Page 7 of 17
zebra finch (Table 7; r
2
= 0.030, P = 4 × 10
-5
) and chicken
(r
2
= 0.011, P = 0.005). This could possibly be related to
other factors co-varying with these parameters. For
example, GC is strongly correlated with recombination
rate in both chicken [31] and zebra finch [32], and in our
data GC content correlates negatively and weakly with ω
(zebra finch, r
2
= 0.017, P = 0.002; chicken, r
2
= 0.005, P =
0.068). GC content might be correlated with ω because
biased gene conversion tends to increase ω due to an
increased rate of fixation of slightly deleterious alleles,
mimicking adaptive evolution [39], and higher GC con-
tent tends to decrease the number of synonymous sites
[40,41]. Moreover, gene density is higher in avian micro-
chromosomes than in macrochromosomes [10] and there
are strong correlations between chromosome size and
both GC and recombination rate [31]. Gene density
might be critical to the effects of recombination on the
efficacy of selection because more coding sequence
should, in principle, imply more targets for selection.
When we tested for a correlation between recombination
rate and ω at the same time as controlling for GC and
gene density (proportion of coding sequence within 1 Mb
windows), we still found weak yet significant negative
relationships (chicken, r
2
= 0.006, P = 0.032; zebra finch,
r
2
= 0.008, P = 0.031). The effect is not limited to regions
with very low recombination rate as similar results were
obtained when comparing windows with zero and non-
zero recombination rates (data not shown).
Discussion
Modern birds form two monophyletic clades, the
Palaeognathae (ratites, like ostrich and its allies) and the
Neognathae (the great majority of contemporary bird
species), which diverged during the cretaceous between
80 and 130 MYA [42-45]. Within the Neognathae, the
first split was between Galloanserae (fowl-like birds
(including chicken), ducks and geese) and Neoaves (>20
different orders) [46,47]. Diversification within Neoaves
seems to have occurred rapidly, with very short internal
nodes in the basal part of the Neoaves tree [45,48]. One of
these early offshoots within Neoaves was the order Pas-
seriformes, to which zebra finch belongs. These birds
typically have small body size and are relatively short-
lived compared to chicken and their allies within Gal-
loanserae.
When judged from the divergence at fourfold degener-
ate sites across more than 8,000 genes, the mean muta-
tion rate in birds was 1.23 to 2.21 × 10
-9
site
-1
year
-1
. The
Table 6: Genes implicated in neurobehavioral evolution by converging lines of evidence
Ensembl ID Locus Gene
Evolving rapidly in the primate lineage [29]
ENSTGUG00000000255 DRD2 D(2) dopamine receptor
ENSTGUG00000004249 ASPM Abnormal spindle-like microcephaly-associated
protein
ENSTGUG00000004747 GRIN2A Glutamate [NMDA] receptor subunit epsilon-1
precursor
ENSTGUG00000007079 LHX2 LIM/homeobox protein Lhx2
Differentially expressed in zebra finch song control system [30]
ENSTGUG00000000694 GPR98 G protein-coupled receptor 98 precursor
ENSTGUG00000002176 MCF2 Mcf2 transforming sequence-like
ENSTGUG00000004464 NEFL Neurofilament triplet L protein
ENSTGUG00000005484 GRIA2 Glutamate receptor, ionotropic AMPA 2
ENSTGUG00000006839 CACNA1D Voltage-dependent L-type calcium channel subunit
alpha-1D
ENSTGUG00000007224 PTPRF Protein tyrosine phosphatase receptor type F
ENSTGUG00000007343 RAI1 Retinoic acid-induced protein 1
ENSTGUG00000010757 GRM1 Glutamate receptor, metabotropic 1
ENSTGUG00000015209 SYCP1 Synaptonemal complex protein 1
Neurological genes under positive selection in the zebra finch (see also Table S3 in Additional file 1) were assessed for representation in the
results of two other studies: orthologs under positive selection in the primate lineage (Dorus et al. [29]) and zebra finch genes that are
differentially expressed in song nucleus the high vocal centre compared to the underlying 'shelf' region (Lovell et al. [30]).
Nam et al. Genome Biology 2010, 11:R68
/>Page 8 of 17
rate was lowest in the ancestral bird lineage from the split
between birds and lizards until the split between Gal-
loanserae and Neoaves (1.23 × 10
-9
site
-1
year
-1
), was
intermediate in the chicken lineage (1.91 × 10
-9
site
-1
year
-
1
) and was highest in the zebra finch lineage (2.21 × 10
-9
site
-1
year
-1
). This indicates a rate acceleration among
modern birds and particularly so in Neoaves, or more
specifically, in the lineage leading to zebra finch. The dif-
ference in mutation rate between the chicken and zebra
finch lineages is in a direction predicted by a generation
time effect [49]: shorter generation times among small
songbirds may have led to higher per-year mutation rates.
We note that this inference relies on the underlying
assumption of neutrality of fourfold degenerate sites. To
the best of our knowledge there is no evidence for codon
usage bias in avian genes; if it exists, it seems unlikely that
selection for codon usage on a genome-wide scale would
differ among the investigated lineages to an extent that
can explain the almost twofold higher mutation rate in
the zebra finch compared to the ancestral lineage.
The lower mutation rate estimated for the ancestral
bird branch is sensitive to the accuracy of the estimated
divergence times of birds and lizards (285 MYA), and of
Galloanserae and Neoaves (90 MYA). Previous molecular
datings of the Galloanserae-Neoaves split have provided
estimates in the range of 90 to 126 MYA, with a mean of
105 MYA [50]. Using this mean value, instead of 90 MYA,
to estimate the substitution rate still leads to a faster rate
in modern birds than in the ancestral bird branch (zebra
finch, 1.90 × 10
-9
site
-1
year
-1
; chicken, 1.63 × 10
-9
site
-1
year
-1
; ancestral birds, 1.33 × 10
-9
site
-1
year
-1
). The earli-
est divergence estimate of 126 MYA leads to similar sub-
stitution rates in the ancestral and zebra finch lineages.
However, such an old divergence is not supported by the
fossil record, which indicates a split younger than 100
MYA [42,44]. Importantly, not a single modern bird is
known in the lower cretaceous (145 to 100 MY) despite a
reasonably good fossil record [43,51,52]. Another poten-
tial concern is that, because of saturation (that is, when
multiple substitutions impair the model to reliably esti-
mate substitution rates), the ancestral branch length may
have been underestimated. It is difficult to directly assess
the possible effect of saturation on the length of the
ancestral bird branch. However, we note that a similar
trend (lower rate of divergence in the ancestral branch) is
not evident among eutherian mammals from the same set
of genes (Table S4 in Additional file 1).
The ancestral lineage from the split between birds and
lizards until the split between Galloanserae and Neoaves
represents, for the most part, dinosaurs that existed
before the appearance of modern birds (Archaeopteryx
fossils date back around 145 MYA). If the estimated
Figure 1 The relationship between ω estimated for 1-Mb intervals and chromosome size. (a) Zebra finch; (b) chicken.
14 15 16 17 18 19
0.0
0.1
0.2
0.3
0.4
log (chromosome size)
(a)
W
14 15 16 17 18 19
0.0
0.1
0.2
0.3
0.4
log (chromosome size)
(b)
W
Nam et al. Genome Biology 2010, 11:R68
/>Page 9 of 17
mutation rates are correct and if one assumes a genera-
tion time effect, our data would suggest that generation
times in the saurischian dinosaur lineage were typically
longer than in modern birds.
Previous studies of divergence in mammalian genomes
have indicated a low degree of substitution rate conserva-
tion over evolutionary time scales comparable to that
between chicken and zebra finch, for example, in the
Figure 2 The relationship between the mean mutation rate (divergence at fourfold degenerate sites) for 1-Mb intervals and chromosome
size. (a) Zebra finch; (b) chicken.
14 15 16 17 18 19
0.0
0.2
0.4
0.6
0.8
log (chromosome size)
Divergence
(a)
14 15 16 17 18 19
0.0
0.2
0.4
0.6
0.8
log (chromosome size)
Divergence
(b)
Table 7: Bivariate and partial correlations (with GC content and amount of coding sequence controlled for) between ω and
recombination rate in 1 Mb windows
t d.f. P
r
2
Zebra finch
Bivariate -4.13 557 0.00004 0.030
Controlled for GC -2.8 556 0.0053 0.014
Controlled for CDS -4.51 556 0.00001 0.035
Controlled for GC and CDS -2.16 555 0.0313 0.008
Chicken
Bivariate -2.82 713 0.0049 0.011
Controlled for GC -2.15 712 0.0320 0.006
Controlled for CDS -2.44 712 0.0149 0.008
Controlled for GC and CDS -2.14 711 0.0329 0.006
CDS, coding sequence; d.f., degrees of freedom; t, t-statistic (t-score) of the slope.
Nam et al. Genome Biology 2010, 11:R68
/>Page 10 of 17
comparison between primate and rodent lineages [53,54].
These estimate have been based on interspersed repeat
elements under the (reasonable) assumption that these
sequences are selectively neutral. Our analysis of diver-
gence at fourfold degenerate sites between orthologous
regions of chicken and zebra finch revealed a stronger
correlation, with 13 to 14% of the variation in divergence
in one lineage explained by variation in divergence in the
other. This could reflect that the selective constraints on
fourfold degenerate sites and interspersed elements differ
(being higher in fourfold degenerate sites) so that the two
approaches are not directly comparable. Alternatively,
there might be biological explanations for high mutation
rate conservation in birds. When controlling for the local
GC content, the amount of variation in divergence
explained by the orthologous rate is reduced to 2%. This
shows that avian mutation rate conservation is largely
dependent of conservation in base composition. Com-
pared to mammalian genomes, avian GC content is
highly heterogeneous and this heterogeneity has been
maintained during avian evolution [12]. It was suggested
that the heterogeneous recombinational landscape of
birds [12] reinforces GC heterogeneity via biased gene
conversion. Local recombination rates are significantly
correlated between chicken and zebra finch [32] and it
may very well be that there is a causal connection
between conservation in recombination, base composi-
tion and mutation rate [55-57].
Over-represented gene ontologies among positively
selected or rapidly evolving genes
With draft sequences now available for two avian
genomes it is possible to study the role of natural selec-
tion in shaping individual gene sequences during avian
evolution. An impetus for our study was thus to identify
genes and gene categories that have been important for
adaptive character evolution in a vertebrate lineage.
Clearly, there are many morphological, physiological and
behavioral phenotypes that distinguish birds and mam-
mals. A comparative genomic approach has the potential
to contribute towards the identification of the genetic
basis of these differences [58].
Basic characteristics of birds such as feathers, flight and
hollow bones evolved prior to the split of the chicken and
zebra finch lineages. The genetic novelties underlying
these phenotypes should thus have started to appear in an
ancestral lineage. As discussed above, the ancestral bird
branch in the phylogenetic tree formed by our data corre-
sponds mostly to non-avian dinosaurs of the order Sau-
rischia, suborder Theropoda. Genes or gene categories
identified as positively selected or rapidly evolving in this
branch may thus be related to phenotypic evolution in
non-avian dinosaurs rather than in modern birds. On the
other hand, many bird-like features may have started to
emerge already for non-avian dinosaurs.
The two GO terms found to be over-represented
among genes evolving under positive selection in the
ancestral bird lineage, calcium ion binding and cell adhe-
sion, largely represent an overlapping set of genes. Most
of these genes (Table S1 in Additional file 1) encode
transmembrane cadherins that play a critical role in cell-
cell adhesion in tissue structures. One of these cadherins,
protocadherin-15, is expressed in retina and we note that
another positively selected calcium ion binding gene,
Crumbs homolog 1, is involved with photoreceptor mor-
phogenesis in retina; mutations in the human ortholog
cause retinitis pigmentosa type 12 [59]. The visual ability
of birds is superior to other vertebrates and the molecular
adaptations underlying this phenotype are likely to have
been driven by positive selection.
In the chicken lineage the term anion transmembrane
transporter activity was over-represented among posi-
tively selected genes. The genes annotated with this term
include solute carriers and ion channels involved with
basic cell signaling processes, for example, in neurotrans-
mission. In the zebra finch lineage the term microtubule
cytoskeleton was over-represented among genes evolving
faster in this lineage than in other branches of the
amniote tree. The majority of these are kinesins and other
genes involved with mitosis/meiosis, sperm motility, cen-
trosome formation and synapse function.
It should be stressed that we inferred positive selection
in lineages corresponding to nearly 100 million years or
more of evolution and that large numbers of genes were
uncovered by these analyses. This is likely to reduce the
power of detecting enriched GO terms due to dilution
and failure to capture temporal episodes of adaptive evo-
lution. Moreover, given that our data were defined by a
common set of 1:1 orthologous genes found in birds, a
lizard and mammals, the analysis did not include lineage-
specific genes that may be particularly responsive to posi-
tive selection. These aspects are probably of relevance to
the somewhat surprising observation that no significantly
over-represented GO terms were found among positively
selected or rapidly evolving mammalian genes. This is
seemingly at odds with previous work in primates that
frequently have revealed categories such as sensory per-
ception, immune defence, apoptosis and spermatogenesis
to be enriched among positively selected genes [17,18,60-
62]. In birds, there have recently been large-scale efforts
toward transcriptome sequencing of several species,
including songbirds [63]. These data will allow study of
the molecular evolution of genes in much shorter
branches of the avian phylogenetic tree than is currently
possible with complete genome sequences, which is only
available for chicken and zebra finch.
Nam et al. Genome Biology 2010, 11:R68
/>Page 11 of 17
Zebra finch and positive selection in neurological genes
The zebra finch communicates through learned vocaliza-
tions ('songs'). Only the male zebra finch produces
learned song, and he learns this song by copying an adult
tutor during a critical period in juvenile development.
Experimental work in zebra finch has demonstrated the
localization and character of neural circuits involved in
developmental song learning and adult singing [64-67],
with dynamic regulation of brain gene expression in
response to singing and song experience [68-76]. Fifty-
eight genes with known roles in learning, neurogenesis or
neurodegeneration in humans show evidence of positive
selection in the zebra finch lineage. Of these, nine (15%;
Table 6) are also expressed differentially in the song con-
trol system, either at higher or lower levels than in the
surrounding brain tissue, according to the study of Lovell
et al. [30]. In comparison, only 2% (390 out of 17,214)
unique brain-derived cDNA probes on that microarray
gave differential hybridization signals in the song control
system. We note that five of the nine genes encode pro-
teins involved in cell surface and synaptic signaling: volt-
age-dependent L-type calcium channel subunit alpha-1D
(CACNA1D), G protein-coupled receptor 98 precursor
(GPR98), glutamate receptor, ionotropic AMPA 2
(GRIA2), glutamate receptor, metabotropic 1 (GRM1),
and protein tyrosine phosphatase receptor type F
(PTPRF). GRIA12 is also one of the ion channel genes
that are suppressed in response to song playbacks as
reported in Warren et al. [16].
Four of the 58 genes show evidence of accelerated evo-
lution in the primate lineage: ASPM, GRIN2a, DRD2, and
LHX2. Two of these have apparent roles in neurogenesis
and neuronal development (ASPM and LHX2). In partic-
ular, ASPM (abnormal spindle-like microcephaly-associ-
ated) has been a focus of speculation with respect to the
dramatic evolution of brain size in humans. Homozygous
mutations in ASPM are a cause of primary microcephaly
[77] and the gene shows evidence of positive selection in
both the human lineage [78-80] and the ancestral lineage
of the apes [81]. Songbirds have also experienced a rela-
tive increase in brain size compared to other avian lin-
eages [82], with the notable emergence of the large and
highly plastic nuclei of the song control system. However,
enthusiasm for ASPM as a key factor in primate brain
evolution has been tempered by findings that mutations
in ASPM are not correlated with cognitive ability [83,84]
and by alternative roles for ASPM that might place it
under selection more broadly, such as a role in ciliary
function [85].
The other two neurological genes that are also acceler-
ated in primates may be considered to have neuromodu-
latory functions that can directly affect learning, memory
and behavior. DRD2 encodes the D2 subtype of the dop-
amine receptor. GRIN2a encodes a subunit of the N-
methyl-D-aspartate (NMDA) receptor, a subtype of iono-
tropic glutamate-gated ion channel that has well-estab-
lished roles in learning and brain plasticity (reviewed in
[86]). A survey of GRIN2a sequences across primate spe-
cies revealed a specific correlation between ω and home
range size, which is taken to be a proxy for spatial mem-
ory [87]. Spatial memory is well developed in the song-
bird (passerine) lineage and is especially evident in food-
caching species [88], a behavior that depends on NMDA
receptor function [89]. Zebra finches are not studied as a
food caching species, but their nomadic lifestyle implies a
highly sophisticated spatial sense [90]. NMDA receptors
have also been implicated in song learning and song con-
trol system neurophysiology [91,92]. The rich diversity of
songbird species and their adaptations should provide
unusual opportunities for correlating NMDA receptor
sequence evolution with specific behavioral and neuro-
physiological variations.
The strength of selection during avian evolution
The overall strength of selection as manifested in the
genome-wide ratio of non-synonymous to synonymous
substitution rates (ω) was similar in the chicken and zebra
finch lineages (0.12 to 0.13), as well as in the ancestral
bird lineage (0.11). These ratios are about half that
reported among hominids and more similar to what is
seen in the murid and dog lineages [62]. This may be
taken to suggest that the rate of adaptive evolution and/or
the rate of accumulation of slightly deleterious mutations
have been lower in birds than in primates. However, it is
increasingly appreciated that point estimates of mean ω
can be misleading. Mean ω decreases with branch length
and needs to be seen in a time trajectory framework
rather than as a fixed quantity [93-95]. The apparent lin-
eage-specific differences between hominids on the one
side and murids, dogs and birds on the other may thus
simply be accounted for by branch length. Future
research will be needed to explore how branch length is
best accounted for when comparing mean ω for different
lineages. This will be important when addressing whether
life history variables, such as the effective population size
(N
e
), correlate with mean ω. For example, such a correla-
tion might be expected if slightly deleterious mutations
contribute significantly to protein evolution as postulated
by a nearly neutral model [96], giving rise to a negative
relationship between mean ω and N
e
[97].
The relationship between natural selection and
recombination in avian genomes
Selection acts in each generation on alleles embedded
within a particular genomic background. Due to recom-
bination, selection will, over time, be able to favor or dis-
favor alleles at individual loci without affecting the rest of
the genome. This comes with a caveat that when two loci
Nam et al. Genome Biology 2010, 11:R68
/>Page 12 of 17
are genetically linked, selection at one locus will affect the
efficiency of selection at the other: the loci are said to
interfere with each other. Theory predicts that the
strength of interference should be related to the amount
of recombination between the loci; this is the so-called
Hill-Robertson effect [33]. Theoretical predictions on the
consequence of Hill-Robertson interference on coding
sequence evolution depend on the fitness distribution of
segregating variants at non-synonymous sites [98,99]. If
slightly deleterious mutations segregate frequently in the
population, directional selection at one locus will
increase the probability of fixation of such mutations at
linked loci. If beneficial alleles are common in the popula-
tion, the probability of fixation of those mutations will be
reduced at linked loci. These two scenarios are associated
with opposing predictions for the correlation between
recombination rate and ω; in the former case a negative
relationship is expected whereas in the latter case a posi-
tive relationship is expected.
The strongest support for Hill-Robertson interference
comes from regions devoid of recombination. For exam-
ple, ω is generally high in the non-recombining sex chro-
mosome, that is, the Y chromosome in systems with male
heterogamety and the W chromosome in systems with
female heterogamety [100-102]. However, it has been sur-
prisingly difficult to find genome-wide empirical support
for Hill-Robertson interference, and data are currently
limited to studies in Drosophila [34,35,103,104] and a
recent study of humans failed to demonstrate a correla-
tion between recombination rate and ω [37].
It is possible that the power for detecting a relationship
between recombination and ω could be higher in bird
systems because the rate of recombination is highly het-
erogeneous, at least within the two avian genomes for
which detailed information is currently available on
regional recombination rate variation. Specifically, there
is a clear negative relationship between chromosome size
and recombination rate [10,31] following from an obli-
gate recombination event per chromosomal arm. In
chicken, the average per-chromosome recombination
rate ranges from 2 centiMorgans (cM)/Mb up to 10 cM/
Mb [10]. Moreover, there is significant within-chromo-
some variation in the rate of recombination with a strong
'telomere effect'. This is most readily seen in zebra finch,
with rates close to 10 cM/Mb in terminal regions of the
larger (>100 Mb) chromosomes while the central parts
have rates as low as 0.1 cM/Mb; the latter is not just a
'centromere effect' because these recombination deserts
cover up to 75% of the larger chromosomes [32].
We do not find support for an increased efficiency of
directional selection in regions of high recombination. If
anything, the data go in the opposite direction since there
was a weak negative, yet significant relationship between
ω and recombination rate in both chicken and zebra finch
(r
2
< 0.01, after controlling for GC content and the
amount of coding sequence); this is the direction pre-
dicted from the hypothesis of an accumulation of slightly
deleterious mutations in regions with low recombination
rate. One obvious explanation for this weak relationship
is that both slightly deleterious and beneficial variants are
common and that their opposing effects in Hill-Robert-
son interference largely cancel each other out. However,
in the absence of simulations under different distribu-
tions of the fitness consequences of segregation muta-
tions this remains an argument that is difficult to
examine.
Another explanation relates to the fact that recombina-
tion rate and ω are measured on very different time
scales. Recombination is recorded from pedigree data
and thus reflects the rate in contemporary populations.
Lineage-specific ω represents substitutions that have
accumulated during, in this case, 90 million years of avian
evolution. If the recombination landscape has changed
frequently during the course of this time period, this may
have weakened the signal of potential recombination
effects on the pattern of efficacy of selection across the
genome. There is limited knowledge on the evolutionary
consistency of regional recombination rate variation
[105]. At a local scale, recombination hot-spots are
ephemeral in the human genome with little or no evi-
dence for hot-spots at orthologous positions in the chim-
panzee genome [106-108]. As indicated above,
recombination rates in birds are strongly associated with
chromosome features, with highly elevated rates in
microchromosomes and in telomeric regions of larger
chromosomes. Given the high degree of karyotype stabil-
ity in birds [7], this may suggest that the recombination
landscape has also remained relatively stable. Indeed, we
have found that recombination rates in 1-Mb windows of
the chicken and zebra finch genomes to be significantly
correlated [32]. Moreover, the strong correlation
observed between base composition (GC content) and
current recombination rates in both chicken [31] and
zebra finch [32] is consistent with a conserved pattern of
recombination rate variation, at least under the scenario
that recombination drives the long-term evolution of
base composition (maintenance of regions elevated in GC
content) by biased gene conversion [57]. An alternative
possibility is that base composition drives recombination
rate variation and it is conservation of GC content, or
GC-rich motifs [109], that results in the appearance of
recombination rate conservation.
Further, the influence of Hill-Robertson interference on
the accumulation of mildly deleterious substitutions is
not expected to decrease linearly with an increase of the
recombination rate [37,110]. In this context, it is possible
that the recombination rate is too high in most regions of
the chicken and the zebra finch genome to lead to mea-
Nam et al. Genome Biology 2010, 11:R68
/>Page 13 of 17
surable variation in the efficiency of selection. This would
somewhat contradict the observation of very low recom-
bination rates in the sub-centromeric region of the larger
zebra finch chromosomes [32]. However, these recombi-
nation deserts can have a high effective number of
recombination events given a very large population size,
as is observed for natural zebra finch populations [111].
In general, it may very well be that the effective popula-
tion sizes of ancestral passerines have been higher than
that of other (larger) birds.
Conclusions
We conducted a comparative analysis between two avian
genomes using one lizard and three mammalian species
as outgroups. Substitution rates were estimated from
8,384 1:1 orthologs of genes at fourfold degenerated sites
and calibrated with the fossil record. We found clear sub-
stitution rate differences between the ancestral bird lin-
eage and the lineage leading to chicken and to zebra
finch, and argue that the differences possibly reflect an
effect of generation time. We further report a list of posi-
tively selected and/or rapidly evolving genes in the above-
mentioned avian lineages. GO terms for several
biological processes were over-represented among the
positively selected genes, including anion transporter
activity, calcium ion binding, cell adhesion and microtu-
bule cytoskeleton. We highlight a set of 58 genes evolving
under positive selection in the songbird lineage that are
of particular interest in neurobiology. Nine of these genes
are also differentially expressed in the unique vocal con-
trol nuclei of the songbird brain and may warrant special
attention in the future. Finally, a significant but low nega-
tive relationship between recombination rate and ω sup-
ports the theoretical prediction that the efficiency of
purifying selection may be reduced in regions of low
recombination rate.
Materials and methods
Alignments
We downloaded protein-coding sequences from the
chicken (G. gallus, WASHUC2), zebra finch (T. guttata,
TaeGut3.2.4), green lizard (Anolis carolinensis,
ANOCAR1), short-tailed opossum (Monodelphis domes-
tica, MonDom5), platypus (Ornithorhynchus anatinus,
OANA5), mouse (Mus musculus, NCBIM37) and human
(Homo sapiens, NCBI36) genome assemblies through
biomart [112] in Ensembl version 55. In order to identify
1:1 orthologs between zebra finch and each of the other
species, we used a reciprocal Blast best hit approach as
implemented in Inparanoid3.0 [113]. Codon-based pair-
wise alignments from the corresponding protein
sequences were made using MUSCLE3.7 [114]. We used
Gblocks 0.91b [115] to eliminate poorly aligned positions.
In total, our analysis was based on 8,384 genes.
Estimates of substitution rates
Pairwise rates
We used the codeml program in the PAML4.1 package
[116] to estimate mean pairwise d
S
and ω (d
N
/d
S
) for all
11,225 1:1 orthologs of chicken and zebra finch from
1,000 concatenated alignments each constructed from
150 randomly chosen genes. Concatenation of align-
ments reduces the sampling variance by producing longer
sequences for which parameters can be estimated more
precisely [25]. The repeated sampling allows estimation
of the within-genome variance (95% confidence inter-
vals).
Fourfold degenerate rate
The neutral lineage-specific substitution rate in 1-Mb
windows of the chicken and zebra finch genomes was
approximated by estimating the divergence of fourfold
degenerate sites (third codon positions of fourfold degen-
erated codons) using a GTR+ Gamma4 model of substi-
tution with the baseml program in the PAML4.1 package.
We based our analysis on windows with at least 1 kb of
degenerate sites.
Lineage-specific substitution rates
We estimated lineage-specific mean d
N
, d
S
, and ω using
the free-ratio model [117] in the same way as for the pair-
wise comparison, that is, applying the Heger and Ponting
[25] method. Lineage-specific ω of individual genes was
estimated using the branch model of PAML4.1, making
the branch of interest foreground and collecting ω from
this branch. This method has the advantage that it tends
to show less sampling variance than a free-ratio model.
Mean ω values for 1-Mb windows were estimated by
concatenating all alignments within each window and
using the three-ratio model in codeml. This model was
chosen to reduce the number of parameters and thus to
avoid the problem of over-parameterization when small
numbers of substitutions are analyzed. Windows were
excluded if the alignment length was less than 1 kb or if
the number of substitutions per window was fewer than
200. This approach avoids problems with decreased pre-
cision of estimates (higher sampling variances) when the
number of substitutions is low.
The ω values for individual alignments were calculated
using the three-ratio model in codeml. Alignments were
excluded if d
S
> 2 or ω > 3 [14]. This analysis was based on
7,415 genes in birds and on 6,252 in eutherian mammals.
Statistical models
We used bivariate and partial correlations to analyze the
relationship between ω and recombination rate separately
in chicken and zebra finch. The sex-average recombina-
tion rate for 1-Mb windows was obtained for chicken
from Groenen et al. [31] and for zebra finch from Back-
ström et al. [32]. Partial correlations controlled for GC
content and the amount of coding sequence within each
Nam et al. Genome Biology 2010, 11:R68
/>Page 14 of 17
window individually and in combination. Similarly, we
used bivariate and partial correlation (controlling for GC
content) to study the association between divergence at
fourfold degenerate sites from 1-Mb windows in different
bird species. Since the windows were not identical
between zebra finch and chicken, we estimated the corre-
lations separately for zebra finch-chicken, and for
chicken-zebra finch. The similarity in the results shows
that the analysis is not susceptible to the exact location of
windows. When controlling for GC content in correla-
tions between zebra finch/chicken and the ancestral bird
linage, we used the average GC content of both chicken
and zebra finch as an estimate of GC content in the
ancestral lineage.
Identification of candidate genes for adaptive evolution
Rapidly evolving bird (REB) genes
We used a likelihood ratio test to identify genes evolving
significantly faster than the average of all genes in a par-
ticular lineage. To do so, we compared the likelihood of a
model where ω was estimated for a particular gene under
consideration, to a null model where ω was fixed to the
genome-wide estimate of ω (degrees of freedom (d.f.) =
1), followed by multiple testing correction by false discov-
ery rate (q < 0.05) using the program Qvalue [117]. This
gives a list of genes that show significantly different ω val-
ues, both higher and lower, than the genomic average, of
which we considered the genes with higher ω values to
represent faster evolving genes.
Genes more rapidly evolving in birds (MREB) than in other
amniotes
We used the branch model in codeml to identify genes
that have evolved significantly faster in a particular lin-
eage compared to the rest of the tree. The null hypothesis
assumed that all branches of the tree have the same ω
while the alternative hypothesis allows the tested branch
to have a different ω. We used a likelihood ratio test with
d.f. = 1 to compare the two hypotheses, followed by mul-
tiple testing correction by false discovery rate (q < 0.05)
using Qvalue [117]. This gives a list of genes where ω in
the lineage of interest (zebra finch, chicken or ancestral
bird lineage) is significantly different, either higher or
lower, from ω in the other lineages. We only report the
genes that have significantly higher ω values.
Genes evolving under positive selection
To detect genes containing codons (at least one) evolving
under positive selection in a specific branch (the fore-
ground branch) we used a branch-site test for positive
selection [118,119] implemented in the codeml program
of the PAML4.1 package. We used the likelihood ratio
test 2, with d.f. = 1, with the null hypothesis that ω
2
was
fixed to 1 compared to an alternative model where ω > 1
[120], followed by multiple testing correction by false dis-
covery rate (q < 0.05) using Qvalue [117]. For the analysis
of positively selected genes, alignments with fewer than
45 codons were excluded. This analysis was based on
8,260 genes in birds and 7,690 genes in eutherian mam-
mals.
Gene Ontology analysis
To test for overrepresentation of biological processes,
molecular functions and cellular components among
positively selected or rapidly evolving genes, we per-
formed GO analysis using GoStat [121]. We downloaded
GO annotations for chicken, human and mouse from
Biomart. The analysis was based on Fisher's exact test
between two lists of genes, that is, PS genes and a refer-
ence list of all analyzed genes. Multiple testing corrected
significance values were based on Benjamini and Hoch-
berg [122] correction (adjusted P < 0.1), included with the
GoStat software.
Analysis of neurological genes
The OMIM database [123] was searched on 29 March
2009, using three different search phrases and a search
limit set for 'prefix star' (that is, to find only OMIM terms
associated with a known gene sequence). One search was
on the term 'learning'. To search for genes related to neu-
rogenesis, we used this phrase: [(stem cell AND neur*)
OR neurogen*]. To search for genes related to neurode-
generation, we used 'neurogen*'. Human gene IDs in
OMIM were cross-referenced and corrected or com-
pleted as needed against the HGNC database, and used to
retrieve Ensembl gene IDs for human and zebra finch
orthologs (Ensembl 53) via Biomart.
Additional material
Abbreviations
cM: centiMorgan; d.f.: degrees of freedom; GO: Gene Ontology; MREB: more
rapidly evolving in birds; MYA: million years ago; NMDA: N-methyl-D-aspartate;
ω: ratio of non-synonymous divergence over synonymous divergence; OMIM:
Online Mendelian Inheritance in Man; PS: positive selection; REB: rapidly evolv-
ing bird genes.
Authors' contributions
KN carried out the bioinformatic analyses. KN, AH, CPP and BN participated in
the substitution rate analyses. KN, BN and JBWW participated in the bioinfor-
matic analyses of positively selected genes. KN, CM, HS and JBWW participated
in the GO analyses. KN, CNB and DFC participated in the analyses of the neuro-
Additional file 1 Supplementary results. List of genes corresponding to
over-represented GO terms in REB, MREB and PS genes in the different
avian lineages. Number of genes identified as positively selected in mam-
mals or as evolving faster in mammals than in other lineages of the
amniotes. List of positively selected genes in zebra finch lineage whose
human orthologs have been implicated in neurological function (learning,
neurogeneration, neurodegeneration). Rate of divergence at fourfold
degenerate sites (×10
-9
site
-1
year
-1
) in Eutherinan lineages. Phylogenetic
tree showing the relationship among the species used in the study. Venn
diagrams showing for zebra finch, chicken and the ancestral bird lineage
the number of REB, MREB, and PS genes.
Additional file 2 Supplementary methods. Method used to estimate
genome-scale ω values.
Nam et al. Genome Biology 2010, 11:R68
/>Page 15 of 17
logical genes. KN, BN, JBWW and AK participated in the analyses linking recom-
bination rate and efficiency of selection. DFC and HE conceived and designed
the study. KN and HE drafted the manuscript. All authors read and approved
the final manuscript.
Acknowledgements
This work was supported by grants from the Swedish Research Council, the
Knut and Alice Wallenberg Foundation and NIH grant RO1 NS045264. We
thank two reviewers for helpful comments.
Author Details
1
Department of Evolutionary Biology, Evolutionary Biology Centre, Uppsala
University, Norbyvägen 18D, Uppsala, S-752 36, Sweden,
2
Institute for
Genomic Biology, University of Illinois, 601 S. Goodwin Avenue, Urbana, IL
61801, USA and
3
MRC Functional Genomics Unit, Department of Physiology,
Anatomy and Genetics, University of Oxford, South Parks Road, Oxford, OX1
3QX, UK
References
1. Ellegren H, Sheldon BC: Genetic basis of fitness differences in natural
populations. Nature 2008, 452:169-175.
2. Abzhanov A, Kuo WP, Hartmann C, Grant RB, Peter R, Grant PR, Tabin CJ:
The calmodulin pathway and evolution of elongated beak
morphology in Darwin's finches. Nature 2006, 442:563-567.
3. Abzhanov A, Protas M, Grant BR, Grant PR, Tabin CJ: Bmp4 and
morphological variation of beaks in Darwin's finches. Science 2004,
305:1462-1465.
4. Mundy NI, Badcock NS, Hart T, Schribner K, Janssen K, Nadeau NJ:
Conserved genetic basis of a quantitative plumage trait involved in
mate choice. Science 2004, 303:1870-1873.
5. Animal Genome Size Database [ />6. Wicker T, Robertson JS, Schulze SR, Feltus FA, Magrini V, Morrison JA,
Mardis ER, Peterson DG, Paterson AH, Ivarie R: The repetitive landscape of
the chicken genome. Genome Res 2005, 15:126-136.
7. Griffin DK, Robertson LBW, Tempest HG, Skinner BM: The evolution of the
avian genome as revealed by comparative molecular cytogenetics.
Cytogenet Genome Res 2007, 117:64-77.
8. Ellegren H, Hultin-Rosenberg L, Brunstrom B, Dencker K, Kultima K, Scholz
B: Faced with inequality: chicken do not have a general dosage
compensation of sex-linked genes. BMC Biol 2007, 5:40.
9. Itoh Y, Melamed E, Yang X, Kampf K, Wang S, Yehya N, van Nas A, Replogle
K, Band MR, Clayton DF, Schadt EE, Lusis AJ, Arnold AP: Dosage
compensation is less effective in birds than in mammals. J Biol 2007,
6:2.
10. ICGSC: Sequence and comparative analysis of the chicken genome
provide unique perspectives on vertebrate evolution. Nature 2004,
432:695-716.
11. Axelsson E, Webster MT, Smith NGC, Burt DW, Ellegren H: Comparison of
the chicken and turkey genomes reveals a higher rate of nucleotide
divergence on microchromosomes than macrochromosomes. Genome
Res 2005, 15:120-125.
12. Webster MT, Axelsson E, Ellegren H: Strong regional biases in nucleotide
substitution in the chicken genome. Mol Biol Evol 2006, 23:1203-1216.
13. Karro JE, Peifer M, Hardison RC, Kollmann M, von Grunberg HH:
Exponential decay of GC content detected by strand-symmetric
substitution rates influences the evolution of isochore structure. Mol
Biol Evol 2008, 25:362-374.
14. Axelsson E, Hultin-Rosenberg L, Brandstrom M, Zwahlén M, Clayton DF,
Ellegren H: Natural selection in avian protein-coding genes expressed
in brain. Mol Ecol 2008, 17:3008-3017.
15. Axelsson E, Ellegren H: Quantification of adaptive evolution of genes
epressed in avian brain and the population size effect on the efficacy
of selection. Mol Biol Evol 2009, 26:1073-1079.
16. Warren WC, Clayton DF, Ellegren H, Arnold AP, Hillier LW, Künstner A,
Searle S, White S, Vilella AJ, Fairley S, Heger A, Kong L, Ponting CP, Jarvis
ED, Mello CV, Minx P, Lovell P, Velho TA, Ferris M, Balakrishnan CN, Sinha S,
Blatti C, London SE, Li Y, Lin YC, George J, Sweedler J, Southey B,
Gunaratne P, Watson M, et al.
: The genome of the zebra finch: special
insights into vocal learning and communication. Nature 2010,
464:757-762.
17. Bustamante CD, Fledel-Alon A, Williamson S, Nielsen R, Hubisz MT,
Glanowski S, Tanenbaum DM, White TJ, Sninsky JJ, Hernandez RD, Civello
D, Adams MD, Cargill M, Clark AG: Natural selection on protein-coding
genes in the human genome. Nature 2005, 437:1153-1157.
18. Nielsen R, Bustamante C, Clark AG, Glanowski S, Sackton TB, Hubisz MJ,
Fledel-Alon A, Tanenbaum DM, Civello D, White TJ, J Sninsky J, Adams MD,
Cargill M: A scan for positively selected genes in the genomes of
humans and chimpanzees. PLoS Biol 2005, 3:e170.
19. Goldman SA, Nottebohm F: Neuronal productIon, migration and
differentiatlon in a vocal control nucleus of the adult female canarv
brain. Proc Natl Acad Sci USA 1983, 80:2390-2394.
20. Paton JA, Nottebohm F: Neurons generated in the adult brain are
recruited into functional circuits. Science 1984, 225:1046-l048.
21. Proposal to Sequence the Genome of the Zebra Finch (Taeniopygia
guttata) [ />SeqProposals/ZebraFinchSeq2.pdf]
22. Doupe AJ, Kuhl PK: Birdsong and human speech: common themes and
mechanisms. Annu Rev Neurosci 1999, 22:567-631.
23. Gahr M: Neural song control system of hummingbirds: Comparison to
swifts, vocal learning (songbirds) and nonlearning (Suboscines)
passerines, and vocal learning (budgerigars) and nonlearning (dove,
owl, gull, quail, chicken) nonpasserines. J Comp Neurol 2000,
426:182-96.
24. Jarvis ED: Learned birdsong and the neurobiology of human language.
Ann N Y Acad Sci 2004, 1016:749-777.
25. Heger A, Ponting CP: Evolutionary rate analyses of orthologs and
paralogs from 12 Drosophila genomes. Genome Res 2007, 17:1837-1849.
26. Hugall AF, Foster R, Lee MSY: Calibration choice, rate smoothing, and the
pattern of tetrapod diversification according to the long nuclear gene
RAG-1. Syst Biol 2007, 56:543-563.
27. van Tuinen M, Hedges SB: Calibration of avian molecular clocks. Mol Biol
Evol 2001, 18:206-213.
28. Clayton DF, Balakrishnan CN, London SE: Integrating genomes, brain and
behavior in the study of songbirds. Curr Biol 2009, 19:R865-873.
29. Dorus S, Vallender EJ, Evans PD, Anderson JR, Gilbert SL, Mahowald M,
Wyckoff GJ, Malcom CM, Lahn BT: Accelerated evolution of nervous
system genes in the origin of Homo sapiens. Cell 2004, 119:1027-1040.
30. Lovell PV, Clayton DF, Replogle KL, Mello CV: Birdsong "transcriptomics":
neurochemical specializations of the oscine song system. PLoS ONE
2008, 3:e3440.
31. Groenen MA, Wahlberg P, Foglio M, Cheng HH, Megens HJ, Crooijmans
RP, Besnier F, Lathrop M, Muir WM, Wong GK, Gut I, Andersson L: A high-
density SNP-based linkage map of the chicken genome reveals
sequence features correlated with recombination rate. Genome Res
2009, 19:510-519.
32. Backström N, Forstmeier W, Schielzeth H, Mellenius H, Nam K, Bolund E,
Webster MT, Öst T, Schneider M, Kempenaers B, Ellegren H: The
recombination landscape of the zebra finch genome Taeniopygia
guttata genome. Genome Res 2010, 20:485-495.
33. Hill WG, Robertson A: Effect of linkage on limits to artificial selection.
Genet Res 1966, 8:269-294.
34. Betancourt AJ, Presgraves DC: Linkage limits the power of natural
selection in Drosophila. Proc Natl Acad Sci USA 2002, 99:13616-13620.
35. Presgraves DC: Recombination enhances protein adaptation in
Drosophila melanogaster. Curr Biol 2005, 15:1651-1656.
36. Goodstadt L, Heger A, Webber C, Ponting CP: An analysis of the gene
complement of a marsupial, Monodelphis domestica: evolution of
lineage-specific genes and giant chromosomes. Genome Res 2007,
17:969-981.
37. Bullaughey K, Przeworski M, Coop G: No effect of recombination on the
efficacy of natural selection in primates. Genome Res 2008, 18:544-554.
38. Nguyen DQ, Webber C, Hehir-Kwa J, Pfundt R, Veltman J, Ponting CP:
Reduced purifying selection prevails over positive selection in human
copy number variant evolution. Genome Res 2008, 18:1711-1723.
39. Galtier N, Duret L: Adaptation or biased gene conversion? Extending
the null hypothesis of molecular evolution. Trends Genet 2007,
23:273-277.
40. Williams EJB, Hurst LD: Is the synonymous substitution rate in mammals
gene-specific? Mol Biol Evol 2002, 19:1395-1398.
Received: 30 April 2010 Revised: 18 June 2010
Accepted: 23 June 2010 Published: 23 June 2010
This article is available from: 2010 Nam et al.; licensee BioMed Central Ltd. This is an open access article distributed under the terms of the Creative Commons Attribution License ( which permits unrestricted use, distribution, and reproduction in any medium, provided the original work is properly cited.Genome Biolog y 2010, 11:R68
Nam et al. Genome Biology 2010, 11:R68
/>Page 16 of 17
41. Bierne N, Eyre-Walker A: The problem of counting sites in the estimation
of the synonymous and nonsynonymous substitution rates:
Implications for the correlation between the synonymous substitution
rate and codon usage bias. Genetics 2003, 165:1587-1597.
42. Ericson PGP, Anderson CL, Britton T, Elzanowski A, Johansson US, Källersjö
M, Ohlson JI, Parsons TJ, Zuccon D, Mayr G: Diversification of Neoaves:
integration of molecular sequence data and fossils. Biol Lett 2006,
2:543-U541.
43. Benton MJ, Donoghue PCJ: Paleontological evidence to date the tree of
life. Mol Biol Evol 2007, 24:26-53.
44. Brown JW, Payne RB, Mindell DP: Nuclear DNA does not reconcile 'rocks'
and 'clocks' in Neoaves: a comment on Ericson et al. Biol Lett 2007,
3:257-259.
45. Hackett SJ, Kimball RT, Reddy S, Bowie RC, Braun EL, Braun MJ, Chojnowski
JL, Cox WA, Han KL, Harshman J, Huddleston CJ, Marks BD, Miglia KJ,
Moore WS, Sheldon FH, Steadman DW, Witt CC, Yuri T: A phylogenomic
study of birds reveals their evolutionary history. Science 2008,
320:1763-1768.
46. Sibley CG, Ahlquist J: Phylogeny and Classification of Birds New Haven, CN:
Yale University Press; 1990.
47. Cracraft J: Avian evolution, Gondwana biogeography and the
Cretaceous-Tertiary mass extinction event. Proc Biol Sci 2001,
268:459-469.
48. Pratt RC, Gibb GC, Morgan-Richards M, Philips MJ, Hendy MD, Penny D:
Toward resolving deep Neoaves phylogeny: data, signal enhancement,
and priors. Mol Biol Evol 2009, 26:313-326.
49. Li WH, Tanimura M, Sharp PM: An evaluation of the molecular clocl
hypothesis using mammlian DNA-sequences. J Mol Evol 1987,
25:330-342.
50. van Tuinen M, Hedges SB: Calibration of avian molecular clocks. Mol Biol
Evol 2001, 18:206-213.
51. Slack KE, Jones CM, Ando T, Harrison GL, Fordyce RE, Arnason U, Penny D:
Early penguin fossils, plus mitochondrial genomes, calibrate avian
evolution. Mol Biol Evol 2006, 23:1144-1155.
52. Fountaine TM, Benton MJ, Dyke GJ, Nudds RL: The quality of the fossil
record of Mesozoic birds. Proc Biol Sci 2005, 272:289-294.
53. Imamura H, Karro JE, Chuang JH: Weak preservation of local neutral
substitution rates across mammalian genomes. BMC Evol Biol 2009,
9:11.
54. Mugal CF, Wolf JB, von Grunberg HH, Ellegren H: Conservation of neutral
substitution rate and substitutional asymmetries in mammalian genes.
Genome Biol Evol 2010, 2010:19-28.
55. Eyre-Walker A: Recombination and mammalian genome evolution.
Proc Biol Sci 1993, 252:237-243.
56. Hardison RC, Roskin KM, Yang S, Diekhans M, Kent WJ, Weber R, Elnitski L,
Li J, O'connor M, Kolbe D, Schwartz S, Furey TS, Whelan S, Goldman N,
Smit A, Miller W, Chiaromonte F, Haussler D: Covariation in frequencies
of substitution, deletion, transposition, and recombination during
eutherian evolution. Genome Res 2003, 13:13-26.
57. Meunier J, Duret L: Recombination drives the evolution of GC-content
in the human genome. Mol Biol Evol 2004, 21:984-990.
58. Ellegren H: Comparative genomics and the study of evolution by
natural selection. Mol Ecol 2008, 17:4586-4596.
59. den Hollander AI, Ten Brink JB, de Kok YJ, van Soest S, van Den Born LI, van
Driel MA, van De Pol DJ, Payne AM, Bhattacharya SS, Kellner U, Hoyng CB,
Westerveld A, Brunner HG, Bleeker-Wagemakers EM, Deutman AF,
Heckenlively JR, Cremers FP, Bergen AA: Mutations in a human
homologue of Drosophila crumbs cause retinitis pigmentosa (RP12).
Nat Genet 1999, 23:217-221.
60. Clark AG, Glanowski S, Nielsen R, Thomas PD, Kejariwal A, Todd MA,
Tanenbaum DM, Civello D, Lu F, Murphy B, Ferriera S, Wang G, Zheng X,
White TJ, Sninsky JJ, Adams MD, Cargill M: Inferring nonneutral evolution
from human-chimp-mouse orthologous gene trios. Science 2003,
302:1960-1963.
61. Arbiza L, Dopazo J, Dopazo H: Positive selection, relaxation, and
acceleration in the evolution of the human and chimp genome. PLoS
Comput Biol 2006, 2:e38.
62. Kosiol C, Vinar T, da Fonseca RR, Hubisz MJ, Bustamante CD, Nielsen R,
Siepel A: Patterns of positive selection in six mammalian genomes.
PLoS Genet 2008, 4:e1000144.
63. Künstner A, Wolf JB, Backström N, Whitney O, Balakrishnan CN, Day L,
Edwards SV, Janes DE, Schlinger BA, Wilson RK, Jarvis ED, Warren WC,
Ellegren H: Comparative genomics based on massive parallel
transcriptome sequencing reveals patterns of substitution and
selection across 10 birds species. Mol Ecol 2010, 19(Suppl 1):266-276.
64. Tchernichovski O, Mitra PP, Lints T, Nottebohm F: Dynamics of the vocal
imitation process: How a zebra finch learns its song. Science 2001,
291:2564-2569.
65. Deregnaucourt S, Mitra PP, Feher O, Pytte C, Tchernichovski O: How sleep
affects the developmental learning of bird song. Nature 2005,
433:710-716.
66. Kao MH, Doupe AJ, Brainard MS: Contributions of an avian basal
ganglia-forebrain circuit to real-time modulation of song. Nature 2005,
433:638-643.
67. Aronov D, Andalman AS, Fee MS: A specialized forebrain circuit for vocal
babbling in the juvenile songbird. Science 2008, 320:630-634.
68. Mello CV, Vicario DS, Clayton DF: Song presentation induces gene
expression in the songbird forebrain. Proc Natl Acad Sci 1992,
89:6818-6822.
69. Mello C, Nottebohm F, Clayton D: Repeated exposure to one song leads
to a rapid and persistent decline in an immediate early gene's
response to that song in zebra finch telencephalon. J Neurosci 1995,
15:6919-6925.
70. Jarvis ED, Nottebohm F: Motor-driven gene expression. Proc Natl Acad
Sci USA 1997, 94:4097-4102.
71. Jin H, Clayton DF: Synelfin regulation during the critical period for song
learning in normal and isolated juvenile zebra finches. Neurobiol Learn
Mem 1997, 68:271-284.
72. Kimpo RR, Doupe AJ: FOS is induced by singing in distinct neuronal
populations in a motor network. Neuron 1997, 18:315-325.
73. Jarvis ED, Scharff C, Grossman MR, Ramos JA, Nottebohm F: For whom
the bird sings: context-dependent gene expression. Neuron 1998,
21:775-788.
74. Wada K, Howard JT, McConnell P, Whitney O, Lints T, Rivas MV, Horita H,
Patterson MA, White SA, Scharff C, Haesler S, Zhao S, Sakaguchi H,
Hagiwara M, Shiraki T, Hirozane-Kishikawa T, Skene P, Hayashizaki Y,
Carninci P, Jarvis ED: A molecular neuroethological approach for
identifying and characterizing a cascade of behaviorally regulated
genes. Proc Natl Acad Sci USA 2006, 103:15212-15217.
75. Woolley SC, Doupe AJ: Social context-induced song variation affects
female behavior and gene expression. PLoS Biol 2008, 6:e62.
76. Dong S, Replogle KL, Hasadsri L, Imai BS, Yau PM, Rodriguez-Zas S,
Southey BR, Sweedler JV, Clayton DF: Discrete molecular states in the
brain accompany changing responses to a vocal signal. Proc Natl Acad
Sci USA 2009, 106:11364-11369.
77. Bond J, Roberts E, Mochida GH, Hampshire DJ, Scott S, Askham JM,
Springell K, Mahadevan M, Crow YJ, Markham AF, Walsh CA, Woods CG:
ASPM is a major determinant of cerebral cortical size. Nat Genet 2002,
32:316-320.
78. Zhang JZ: Evolution of the human ASPM gene, a major determinant of
brain size. Genetics 2003, 165:2063-2070.
79. Evans PD, Gilbert SL, Mekel-Bobrov N, Vallender EJ, Anderson JR, Vaez-
Azizi LM, Tishkoff SA, Hudson RR, Lahn BT: Microcephalin, a gene
regulating brain size, continues to evolve adaptively in humans.
Science 2005, 309:1717-1720.
80. Mekel-Bobrov N, Gilbert SL, Evans PD, Vallender EJ, Anderson JR, Hudson
RR, Tishkoff SA, Lahn BT: Ongoing adaptive evolution of ASPM, a brain
size determinant in Homo sapiens. Science 2005, 309:1720-1722.
81. Evans PD, Anderson JR, Vallender EJ, Choi SS, Lahn BT: Reconstructing the
evolutionary history of microcephalin, a gene controlling human brain
size. Hum Mol Genet 2004, 13:1139-1145.
82. Burish MJ, Kueh HY, Wang SS: Brain architecture and social complexity in
modern and ancient birds. Brain Behav Evol 2004, 63:107-124.
83. Mekel-Bobrov N, Posthuma D, Gilbert SL, Lind P, Gosso MF, Luciano M,
Harris SE, Bates TC, Polderman TJ, Whalley LJ, Fox H, Starr JM, Evans PD,
Montgomery GW, Fernandes C, Heutink P, Martin NG, Boomsma DI, Deary
IJ, Wright MJ, de Geus EJ, Lahn BT: The ongoing adaptive, evolution of
ASPM and Microcephalin is not explained by increased intelligence.
Hum Mol Genet 2007, 16:600-608.
84. Timpson N, Heron J, Smith GD, Enard W: Comment on papers by Evans et
al. and Mekel-Bobrov et al. on evidence for positive selection of MCPH1
and ASPM. Science 2007, 317:1036.
85. Ponting CP: A novel domain suggests a ciliary function for ASPM, a
brain size determining gene. Bioinformatics 2006, 22:1031-1035.
Nam et al. Genome Biology 2010, 11:R68
/>Page 17 of 17
86. Lau CG, Zukin RS: NMDA receptor trafficking in synaptic plasticity and
neuropsychiatric disorders. Nat Rev Neurosci 2007, 8:413-426.
87. Ali F, Meier R: Primate home range and GRIN2A, a receptor gene
involved in neuronal plasticity: Implications for the evolution of spatial
memory. Genes Brain Behav 2009, 8:435-441.
88. Krebs JR, Sherry DF, Healy SD, Perry VH, Vaccarino AL: Hippocampal
specialization of food-storing birds. Proc Natl Acad Sci USA 1989,
86:1388-1392.
89. Shiflett MW, Tomaszycki ML, Rankin AZ, DeVoogd TJ: Long-term memory
for spatial locations in a food-storing bird (Poecile atricapilla) requires
activation of NMDA receptors in the hippocampal formation during
learning. Behav Neurosci 2004, 118:121-130.
90. Zann RA: The Zebra Finch: a Synthesis of Field and Laboratory Studies Oxford:
Oxford University Press; 1996.
91. Aamodt SM, Nordeen EJ, Nordeen KW: Blockade of NMDA receptors
during song model exposure impairs song development in juvenile
zebra finches. Neurobiol Learn Mem 1996, 65:91-98.
92. White SA, Livingston FS, Mooney R: Androgens modulate NMDA
receptor-mediated EPSCs in the zebra finch song system. J
Neurophysiol 1999, 82:2221-2234.
93. Rocha EP, Smith JM, Hurst LD, Holden MT, Cooper JE, Smith NH, Fell EJ:
Comparisons of dN/dS are time dependent for closely related bacterial
genomes. J Theor Biol 2006, 239:226-235.
94. Peterson GI, Masel J: Quantitative prediction of molecular clock and K-a/
K-s at short timescales. Mol Biol Evol 2009, 26:2595-2603.
95. Wolf JB, Künstner A, Nam K, Jakobsson M, Ellegren H: Nonlinear dynamics
of nonsynonymous (dN) and synonymous (dS) substitution rates
affects inference of selection. Genome Biol Evol 2009, 2009:308-319.
96. Ohta T: Slightly deleterious mutant substitutions in evolution. Nature
1973, 246:96-98.
97. Ellegren H: A selection model of molecular evolution incorporating the
effective population size. Evolution 2009, 63:301-305.
98. Felsenstein J: Evolutionary advantage of recombination. Genetics 1974,
78:737-756.
99. Peck JR: A ruby in the rubbish - beneficial mutations, deleterious
mutations and the evolution of sex. Genetics 1994, 137:597-606.
100. Bachtrog D: Evidence that positive selection drives Y-chromosome
degeneration in Drosophila miranda. Nat Genet 2004, 36:518-522.
101. Bachtrog D: Sex chromosome evolution: Molecular aspects of Y-
chromosome degeneration in Drosophila. Genome Res 2005,
15:1393-1401.
102. Berlin S, Ellegren H: Fast accumulation of nonsynonymous mutations on
the female-specific W chromosome in birds. J Mol Evol 2006, 62:66-72.
103. Haddrill PR, Halligan DL, Tomaras D, Charlesworth B: Reduced efficacy of,
selection in regions of the Drosophila genome that lack crossing over.
Genome Biol 2007, 8:R18.
104. Larracuente AM, Sackton TB, Greenberg AJ, Wong A, Singh ND, Sturgill D,
Zhang Y, Oliver B, Clark AG: Evolution of protein-coding genes in
Drosophila. Trends Genet 2008, 24:114-123.
105. Jensen-Seaman MI, Furey TS, Payseur BA, Lu Y, Roskin KM, Chen CF,
Thomas MA, Haussler D, Jacob HJ: Comparative recombination rates in
the rat, mouse, and human genomes. Genome Res 2004, 14:528-538.
106. Ptak SE, Roeder AD, Stephens M, Gilad Y, Pääbo S, Przeworski M: Absence
of the TAP2 human recombination hotspot in chimpanzees. PLoS Biol
2004, 2:e155.
107. Winckler W, Myers SR, Richter DJ, Onofrio RC, Mcdonald GJ, Bontrop RE,
Mcvean GA, Gabriel SB, Reich D, Donnelly P, Altshuler D: Comparison of
fine-scale recombination rates in humans and chimpanzees. Science
2005, 308:107-111.
108. Jeffreys AJ, Neumann R: The rise and fall of a human recombination hot
spot. Nat Genet 2009, 41:625-629.
109. Myers S, Freeman C, Auton A, Donnelly P, McVean G: A common
sequence motif associated with recombination hotspot and genome
instability in humans. Nat Genet 2008, 40:1124-1129.
110. McVean GAT, Charlesworth B: The effects of Hill-Robertson interference
between weakly selected mutations on patterns of molecular
evolution and variation. Genetics 2000, 155:929-944.
111. Balakrishnan CN, Edwards SV: Nucleotide variation, linkage
disequilibrium and founder-facilitated speciation in wild populations
of the zebra finch (Taeniopygia guttata). Genetics 2009, 181:645-660.
112. Biomart []
113. Berglund AC, Sjölund E, Ostlund G, Sonnhammer EL: InParanoid 6:
eukaryotic ortholog clusters with inparalogs. Nucleic Acids Res 2008,
36:D263-266.
114. Edgar RC: MUSCLE: multiple sequence alignment with high accuracy
and high throughput. Nucleic Acids Res 2004, 32:1792-1797.
115. Castresana J: Selection of conserved blocks from multiple alignments
for their use in phylogenetic analysis. Mol Biol Evol 2000, 17:540-552.
116. Yang ZH: PAML 4: Phylogenetic analysis by maximum likelihood. Mol
Biol Evol 2007, 24:1586-1591.
117. Storey JD: A direct approach to false discovery rates. J R Stat Soc Series B
2002, 64:479-498.
118. Yang ZH: Likelihood ratio tests for detecting positive selection and
application to primate lysozyme evolution. Mol Biol Evol 1998,
15:568-573.
119. Yang ZH, Nielsen R: Codon-substitution models for detecting molecular
adaptation at individual sites along specific lineages. Mol Biol Evol 2002,
19:908-917.
120. Zhang JZ, Nielsen R, Yang ZH: Evaluation of an improved branch-site
likelihood method for detecting positive selection at the molecular
level. Mol Biol Evol 2005, 22:2472-2479.
121. Beissbarth T, Speed TP: GOstat: Find statistically overrepresented gene
ontologies within a group of genes. Bioinformatics 2004, 20:1464-1465.
122. Benjamini Y, Hochberg Y: Controlling the false discovery rate: a practical
and powerful approach to multiple testing. J Roy Stat Soc Series B Meth
1995, 57:289-300.
123. OMIM Database [ />doi: 10.1186/gb-2010-11-6-r68
Cite this article as: Nam et al., Molecular evolution of genes in avian
genomes Genome Biology 2010, 11:R68