Báo cáo y học: "RNA polymerase mapping during stress responses reveals widespread nonproductive transcription in yeast" docx
Bạn đang xem bản rút gọn của tài liệu. Xem và tải ngay bản đầy đủ của tài liệu tại đây (2.55 MB, 13 trang )
RESEA R C H Open Access
RNA polymerase mapping during stress
responses reveals widespread nonproductive
transcription in yeast
Tae Soo Kim
1
, Chih Long Liu
2,6
, Moran Yassour
3,4
, John Holik
2
, Nir Friedman
3,5
, Stephen Buratowski
1
,
Oliver J Rando
2*
Abstract
Background: The use of genome-wide RNA abundance profiling by microarrays and deep sequencing has spurred
a revolution in our understanding of transcriptional control. However, changes in mRNA abundance reflect the
combined effect of changes in RNA production, processing, and degradation, and thus, mRNA levels provide an
occluded view of transcriptional regulation.
Results: To partially disentangle these issues, we carry out genome-wide RNA polymerase II (PolII) localization
profiling in budding yeast in two different stress response time courses. While mRNA changes largely reflect
changes in transcription, there remains a great deal of variation in mRNA levels that is not accounted for by
changes in PolII abundance. We find that genes exhibiting ‘excess’ mRNA produced per PolII are enriched for those
with overlapping cryptic transcripts, indicating a pervasive role for nonproductive or regulatory transcription in
control of gene expression. Finally, we characterize changes in PolII localization when PolII is genetically inactivated
using the rpb1-1 temperature-sensitive mutation. We find that PolII is lost from chromatin after roughly an hour at
the restrictive temperature, and that there is a great deal of variability in the rate of PolII loss at different loci.
Conclusions: Together, these results provide a global perspective on the relationship between PolII and mRNA
production in budding yeast.
Background
Gene transcription is one of the major mechanisms by
which a ce ll responds to its environment, and the regu-
lation of transcription has been one of the most inten-
sively studied processes in biology over the past half
century. In the past decade, the technical revolutions in
whole-genome analysis have enabled unprecedented
insights into the global changes in mRNA production in
response to environmental cues, and into the roles for
countless regulatory factors in the production of these
mRNAs.
The abundance of mRNA in a cell is d etermined by
the relative rates of production (transcription and pro-
cessing) and destruction, integrated over time. Thus,
while mRNA levels are easily measured using
microarrays or deep sequencing, the correspondence
between mRNA changes and transcriptional changes in
response to a given perturbation is imperfect. This is
widely understood, but the ease of mRNA measure-
ments has led most genomic analyses of transcriptional
regulation to use this readout rather than actual tran-
scription rates.
A number of genome-wide studies have identifie d dis-
crepancies betwe en transcription rate per se and mRNA
abundance. Ther e is wide variation in mRNA half-life in
budding yeast [1,2], from roughly 10 minutes to 50 min-
utes, and mRNA degradation is regulated in a condi-
tion-specific manner. In mammals, genome-wide
analysis of ongoing transcription using nuclear run-ons
or deep sequencing of small RNAs identified evidence
for widespread nonproductive transcription by RNA
polymerase II (PolII) [3-5]. Furthermore, global mapping
of PolI I localization in budding yeast revealed a large set
of RNAs that were produced very ‘ efficiently ’,thatis,
* Correspondence:
2
Department of Biochemistry and Molecular Pharmacology, University of
Massachusetts Medical School, 364 Plantation St, Worcester, MA 01605, USA
Kim et al. Genome Biology 2010, 11:R75
/>© 2010 Kim et al.; licensee BioMed Central Ltd. This is an open access article distributed under the terms of the Creative Commons
Attribution Lice nse ( which permits unrestricted use, distribution, and reproduction in
any medium, provided the original work is properly cite d.
where the mRNA level per polymerase was higher than
the genomic average [6]. Finally, a great deal of recent
literature has identified widespread instances of PolII
‘ pausing’ at genes poised for rapid induction upon
change in growth condition [7-14].
We theref ore set out to explore the rel ationship
between PolII levels and mRNA levels during response
to environmental stimuli. We mapped PolII levels across
the genome in budding yeast over a heat shock time
course, and over a time course of exposure to the sulf-
hydryl-oxidizing agent diamide. In both cases, changes
in mRNA levels were well-correlated with changes in
PolII occupancy, and in general PolII changes typically
explain approximately 50% of the variance in mRNA
changes. We find evide nce for widespread roles for sev-
eral additional factors that cause deviations from
expected mRNA abundance changes, including mRNA
stability and nonproductive transcription. Specific types
of genes are especially prone to nonproductive or regu-
latory transcription, such as genes involved in carbohy-
drate metabolism. Finally, we characterize the loss of
PolII from chroma tin over a time course of inactivation
of the t emperature-sensitive rpb1-1 allele of the Rpo21
subunit of RNA polymerase [15]. PolII stays associated
with most genes for roughly an hour after shifting to
the restrictive temperature, indicating that assays for
ruling out transcriptional dependence of various nuclear
processes should wait an hour after shifting this strain
to the restrictive temperature.
Results
We carried out genome-wide localization of PolII using an
anti-Rpb3 monoclonal antibody as previously described
[16,17]. Yeast were subjected to two distinct stress condi-
tions that induce overlapping but distinct gene expression
programs [18] - h eat shock (to 37°C) and d iamide treat-
ment. PolII localization was measured by hybridization to
gen omic tiling arrays (60-bp probes every approximately
250 bp) at five time points (up to 2 hours) over each stress
response time course (Additional file 1).
Broadly, our results capture expected aspects of the
transcriptional response to stress in the budding yeast
(examples shown in Figure 1). Data from both time
courses were quite similar (R = 0.76 at t = 30, for exam-
ple), consistent with the discovery that most of the
expression changes in response to a given stressor cor-
respond to a shared environmental stress res ponse [18].
Dramatic gains or losses of PolII occurred at canonical
stress-responsive genes: PolII levels increased dramati-
cally (> 4-fold) over stress response genes such as
HSP104 (Figure 1a-c, top panels) whereas PolII levels
dropped precipitously (> 4-fold) over genes such as
NOP7, involved in ribosome biogenesis (Figure 1a-c,
bottom panels).
Location of PolII along gene body
We next grouped data according to the location of the
microarray probe within a given coding region, as pre-
viously described [16,19] - probes within the first 500
bp of a g ene were annotated as 5′ coding sequence
(CDS), probes in the last 500 bp were annotated as 3′
CDS, and any probes between these ends were anno-
tated as mid-CDS (Figure 1c; Additional file 2). We
noted a wide range in behaviors with respect to poly-
merase occupancy profiles over individual genes, with a
spectrum ranging from high 5′/3′ ratios to the converse
(Figure 2a). As previously described [6,20], we found
that several genes involved in transcriptional termina-
tion, such as NRD1 (Figure 2a) and HRP1 (not shown)
exhibited high 5′ /3′ ratios of PolII. This is consistent
with the described role for N rd1 in feedback control of
its own expression - when Nrd1 levels are adequate,
transcription of the NRD1 gene undergoes premature
termination, but when Nrd1 levels are low, termination
becomes inefficient, leading to more transcription of
full-length Nrd1 and restoration of high levels of the
protein. Interesti ngly, other genes involved in transcrip-
tional control also show exceptionally high 5′/3′ ratios,
including EPL1 (a NuA4 subunit) and SMC2 (a conden-
sin subunit), suggesting that these genes may also be
subject to regulation by transcriptional termination fac-
tors (Additional file 3).
Given the wide range of e vidence for ‘ paused’ RNA
polymerase at the 5′ ends of genes in flies, worms,
mammals, and stationary phase yeast (see [7] for a
review), we asked whether there was any evidence for
paused PolII under our conditions. We therefore investi-
gated what proper ties distinguish genes with high 5′/3′
PolII ratios from those with the converse pattern. After
selecting only those genes long enough to have a mid-
CDS probe (that is, > 1 kb long), we sorted genes by the
measured 5′/3′ ratio of PolII in pre-stress midlog condi-
tions (Figure 2b). Genes with relatively high 5′ PolII
tended to be expressed at higher levels [21] than genes
with high 3′ PolII (Figure 2c; Additional file 4). The
high 5′/3′ PolII ratios found at highly transcribed genes
could indicate a rate-limiting transition from transcrip-
tion initiation to elongation even at high transcription
rates, which could result from PolII pausing or, a lterna-
tively, premature termination.
Conversely, we noted that many genes with high 3′/5′
PolII ratios were associated with noncoding transcripts
in mid-log growth conditions, either cryptic unstable
transcripts (CUTs) or stable unannotated transcripts
(SUTs) [22] (Figure 2a, bottom panels). This finding was
general - a much higher fraction of genes with high 3′/
5′ levels of PolII exhibited overlap at their 3′ ends with
alternative transcripts than genes with high 5 ′/3′ PolII
ratios (F igure 2d). The high level of PolII at the 3′ ends
Kim et al. Genome Biology 2010, 11:R75
/>Page 2 of 13
of these genes likely reflects transcription of the 3′ CUT
or SUT (our assay cannot distinguish the orientation o f
PolII movement); consistent with this idea, we found
that genes with high levels of PolII at the 3′ end of the
gene exhibited high levels of the ‘ initiation’ mark
H3K4me3 at these 3′ ends [19,23] (not shown). This
transcription is nonproductive in the sense that the pro-
tein-coding RNA is not being produced by a significant
fraction of polymerases occupying part of the gene
body. Furthermore, the correlation between high 3′/5′
PolII and low mRNA abundance suggests that overlap-
ping transcription of 3′ noncoding transcripts may play
a more general role in control of productive transcrip-
tion (see below).
To explore how the localization of PolII along the
gene body dynamically shifts during gene activation and
repression, we calculated 5′, mid, and 3′ PolII abundance
at all time points in the stress time courses. Genes were
grouped by the extent to which their mRNA levels
change at a given time point during the stress response,
and 5′ ,mid,and3′ CDS PolII enrichments were calcu-
lated for activated and repressed genes before and after
30 minutes of stress (Figure 3; Additional file 5). We see
that changes in PolII levels generally correlate with
changes in mRNA abundance, as expected. Furthermore,
repressed genes shift from a pre-stress 5′-biased PolII
distribution (characteristic of very highly expressed
genes (Figure 2), which tend to be repressed during
stress responses) to a flatter distribution after repression.
Conversely, genes that are activated during stress initi-
ally exhibit slightly higher levels of PolII at the 3′ end of
the gene (Figure 3b), again suggesting that PolII is not
paused at stress response genes in anticipation of
stressors.
Interestingly, after activation of these genes, there is
little 5′ bias for PolII, on average, indicating that there is
asubtledifferencebetweenhighlyexpressed‘ gr owth′
genes and highly expressed ‘stress’ genes in terms of the
kinetics or processivity of PolII transit over the gene.
Many aspects of stress ge ne expression could cause this,
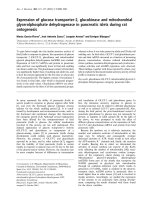
Figure 1 PolII mapping durin g the stress response. (a) Heat map view of HSP104 (top panel), an induced gene, or NOP7 (bottom pane l), a
repressed gene, during a time course of heat shock. (b) Data from (a), but plotted as a graph rather than a heatmap. Data on the y-axis are
shown as log(2). Probes annotated as 5’, mid, and 3’ CDS are indicated below the gene annotation described (5’ CDS = first 500 bp of coding
sequence, 3’ CDS = last 500 bp of coding sequence, mid-CDS = remaining coding sequence [16,19]). (c) Data from (a, b) were grouped by
location as shown in (b). Averaged data for each group is plotted versus time at 37°C. HS, heat shock; Pol2, RNA polymerase II.
Kim et al. Genome Biology 2010, 11:R75
/>Page 3 of 13
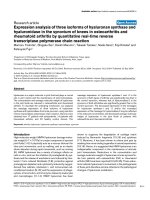
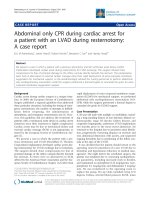
Figure 2 Analysis of PolII location relative to ORFs. (a) Example of genes with high (top three examples) or low (bottom two) ratios of PolII at
the ORF 5’ end relative to the 3’ end. For each gene, PolII abundance is shown on the y-axis, and gene annotation and any cryptic transcripts from
Xu et al. [22] are shown underneath. (b) All genes ordered by 5’/3’ PolII ratio. For each gene long enough to have a mid-CDS annotation (that is, at
least one microarray probe located > 500 bp from either end of the gene), the PolII enrichment at the 5’ (first 500 bp), mid-CDS, and 3’ (last 500 bp)
are shown in the three indicated columns. (c) Genes with high 5’/3’ PolII abundance are highly expressed. Log(2) of mRNA abundance data from
Yassour et al. [21] is shown as an 80-gene running-window average, with genes ordered as in (b). (d) Genes with high 3’/5’ PolII abundance are
associated with overlapping transcripts. Genes were scored for 3’ overlap with cryptic unstable transcripts (CUTs), stable unannotated transcripts
(SUTs), or ORFs as annotated in [22], and a running window average is plotted ordered as in (b). Pol2, RNA polymerase II.
Kim et al. Genome Biology 2010, 11:R75
/>Page 4 of 13
such as distinct elongation factors traveling with PolII
loaded onto TATA or non-TATA promoters. Alterna-
tively, we favor a model based on trailing polymerases;
stress genes in yeast exhibit ‘ bursts’ of polymerases
rather than the more evenly spaced polymerases seen at
growth/housekeeping genes [24], and it has recently
been shown that a trailing polymerase can aid the lead-
ing polymerase in overcoming the nucleosomal barrier
to transcription [25,26], thus potentially allowing closely
spaced polymerases to more easily overcome nucleo-
some-mediated delays.
Transcriptional changes only partially account for mRNA
abundance changes
To further investigate the relationship between mRNA
abundance changes and transcriptional changes during
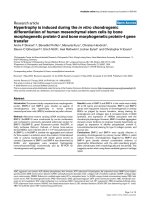
Figure 3 Genes with 3’-biased PolII occupancy are preferentially activate d during stress response. (a, b) PolII occupancy at the 5’ CDS,
mid-CDS, and 3’ CDS was calculated before (t = 0) and after (t = 30) heat shock for genes repressed (a), or activated (b) at least two-fold [18]
during heat shock. (c) Genes are ordered by the level of induction after 30 minutes of heat shock. On the y-axis are plotted 80-gene running
windows for change in PolII occupancy over mid-CDS, and for the 5’/3’ PolII occupancy ratio at t = 0. DPol2 indicates change in PolII; Pol2, RNA
polymerase II.
Kim et al. Genome Biology 2010, 11:R75
/>Page 5 of 13
stress, we grouped genes by k-means clustering of
mRNA expression profiles over time in diamide (Addi-
tional file 6). These clusters correspond to various tem-
poral profiles of gene activation/repression, including
transient induction/repression, continuous induction/
repression, and so forth. Broadly, the changes in PolII
abundance at genes in each cluster mirrored the
changes in mRNA abundance (Additional file 6b,c).
Averaging mRNA changes and mid-CDS PolII changes
shows nearly identical average profiles (Additional file
6d,e), indicating that, for example, genes exhibiting tran-
sient mRNA induction during diamide treatment were
transiently transcribed, rather than continuously t ran-
scriptionally upregulated with subsequent regulati on of
mRNA stability contributing to the later decrease in
mRNA abundance.
However, close e xamination of PolII changes within
any given cluster reveal numerous examples where
mRNA changes are not matched by PolII abundance
changes. To investigate this phenomenon further, we
compa red the change in PolII abundance over mid-CDS
probes and the corresponding change in mRNA abun-
dance at v arying times after induct ion of the stress
response (Figure 4a,c; Additional file 7). We observed
the expected positive correlation between PolII changes
and changes in mRNA abundance, but there was signifi-
cant variation as well - changes in PolII abundance typi-
cally accounted for approximately 50% of variance in
mRNA abundance in this analysis. Examples of genes
exhibiting high or low mRNA product ion per change in
PolII occupancy are shown in Figure 4b.
To quantify the variability in mRNA produced per PolII
molecule, we first calculated the average mRNA change
per change in PolII as a LOWESS fit (red line in Figure
4a,c). Deviation from the typic al mRNA change per PolII
change was then defined as mRNA ‘excess’ or ‘dearth’ -
genesthatfallwellabovetheredlineinFigure4a,ccor-
respond to genes wher e the change in m RNA abundance
measured in heat shock or diamide is significantly greater
than the change in mRNA for most genes with the same
change in Po lII abundance. Examples of genes exhibiting
high levels of mRNA excess or dearth are shown in Fig-
ure 4b. Genes exhibiting a relative excess of mRNA pro-
duced per PolII change were enriched in a variety of
related Gene Ontology categories, such as ‘hexose meta-
bolic process’ (P < 1.50e-13), and ‘carbohydrate metabolic
process’ (P < 6.02e-11) (Additional file 8), as well as sev-
eral relatively nonspe cific Gene Ontology terms (see Dis-
cussion). Genes producing a relative dearth of mRNA per
PolII change were enriched for Gene Ontology categories
such as ‘ cell cycle’ (P < 5.42e-9), and ‘ncRNA metabolic
process’ (P < 3.38e-6).
Interestingly, genes for which excess mRNA was pro-
duced per PolII change often were associated with
overlapping noncoding mid-log-expressed transcripts as
defined by Xu et al . [22]. We found that this phenom-
enon was general, wi th a much greater extent of ORF
overlap (P = 1.33e- 5) with other transcripts at genes
producing excess mRNA/PolII (Figure 4d; A dditional
file 9). This result suggests tha t in mid-log growth,
much of the PolII occupying these genes is engaged in
nonproductive transcription. Upon stress, we speculate
that this nonproductive or regulatory transcription is
repressed, allowing a greater fraction of productive PolII
molecules to transcribe the coding region (Additional
file 10). Consistent with this idea, we found that genes
exhibiting excess mRN A production after treatment also
tended to be associated with high 3′/5′ PolII levels dur-
ing mid-log growth (Additional file 11). Conversely, we
speculate that genes exhibiting a dearth of RNA pro-
duced per change in PolII might be subject to an
increased level of nonproductive transcription under
stress, but since prior transcript mapping studies have
not touch ed on heat shock or di amide conditions, these
putative CUTs and SUTs have yet to be identified.
Because we used data from another lab’sstudyfor
mRNA levels, we carried out our own measurements of
mRNA changes at 30 minutes of heat shock (from the
same culture used for PolII chromatin immunoprecipita-
tion (ChIP)) using an oligonucleotide microarray, and
repeated the a nalyses of Figure 4c,d. Our mRNA data
were well-correlated with that of Gasch et al. [18 ] albeit
with reduced dynamic range (Additional file 12a).
Importantly, we reproduced the discovery that genes
exhibi ting ‘excess’ mRNA pro duced per PolII were asso-
ciated with greater overlaps with CUTs and SUTs
(Additional file 12b,c), validatin g the conclusions drawn
using another lab’s mRNA dataset.
Characterization of the rpb1-1 allele
The rpb1-1 [15] temperature-sensitive allele of the gene
encoding the major PolII subunit Rpo21 (or Rpb1) is
widely used to establish whether a given change in some
cellular behavior (such as chromatin structure) is tran-
scription-dependent. We therefore sought to fully char-
acterize the behavior of PolII along the genome upon
shift to the restrictive temperature. We carried out PolII
ChIP as above, in this case shifting rpb1-1 yeast from
24°C to 37°C for the same time points used for the
stress time courses (Figure 5a).
At early time points (up to 30 minutes), PolII occupancy
patterns were similar in wild-type and rpb1-1 yeast - PolII
was recruited to HSP104 at earl y heat shock time points,
for example (not shown). However, at 1 and 2 hours post-
shift, we observed a dramatic decrease in the dynamic
range of PolII abundance over the genome (Figure 5).
Since microarrays are normalized to an average log2
enrichment of zero, this loss of dynamic range is the
Kim et al. Genome Biology 2010, 11:R75
/>Page 6 of 13
expected behavior if PolII association with the genome
was globally diminished at these time points. This finding
indicates that PolII is still associated with the genome 30
minutes after shifting rpb1-1 yeast to the restrictive tem-
perature - extensive PolII dissociation from the genome
does not occur until between 30 minutes and 1 hour after
temperature shift, and is by no means complete even after
1 hour. Consistent with this, a prior study also found
continued PolII association wit h the genome 45 minutes
after inactivating the rpb1-1 mutant [27].
Is PolII loss uniform across the genome? There is
some correlation evident between PolII abundance
before and after PolII inactivation - loci that are highly
enriched with PolII at the permissive temperature gener-
ally are associated with more PolII at 2 hours than are
probes that are initially depleted of PolII (Additional file
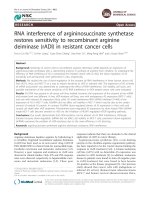
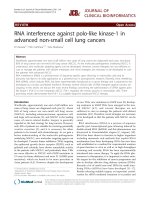
Figure 4 Mismatches between mRNA production and changes in PolII occupancy. (a) Scatterplot of mRNA change versus PolII occupancy
change. PolII data are taken from mid-CDS probes, and change from 0 to 30 minutes of diamide treatment is shown on the x-axis. mRNA data
from Gasch et al. [18] is shown on the y-axis. The red line shows the LOWESS fit of mRNA/PolII change. (b) Example genes with excess, typical,
and a dearth of mRNA produced per change in PolII occupancy. Data for mRNA change and PolII change at mid-CDS are plotted at the same
scale. (c) Definition of mRNA excess per PolII change. As in (b), but for 30 minutes of heat shock. Genes that fall more than 0.5 above (red) or
below (green) the LOWESS fit (red line) of mRNA/PolII change are indicated. (d) Genes with excess mRNA production are subject to extensive
overlapping noncoding transcription. Average extent of overlap with other transcripts defined in Xu et al. [22] are shown for the three gene
classes defined in (c).
Kim et al. Genome Biology 2010, 11:R75
/>Page 7 of 13
13). Do some types of genomic loci maintain PolII more
than others? For each of several types of genomic loci
[16,19], we aligned loci by initial PolII abundance and
plotted a running window average of PolII abundance
aft er 2 hours at 37°C (Additional file 13a). This analysis
reveals that PolII is maintained at the middle and 3′
ends of genes to a greater extent than at the 5′ end, sug-
gesting that some pol ymerases may be capable of finish-
ing a round of transcription prior to dissociation from
the genome. Alternatively, it is possible that PolII
located at the 3′ ends of genes is somehow protected
from dissociation.
Finally, we asked whether PolII could be recruited to
the genome in rpb1-1 yeast at the restrictive temperature.
rpb1-1 yeast were shifted to 37°C for 10 minutes, then
subjected to diamide stre ss for 15, 30, or 60 min utes
while maintaining the restrictive temperature. While heat
shock a nd diamide b oth induce a common stress
response, diamide also induces tran scription of a specific
set of genes that do not respond to heat shock [18], pro-
viding test loci to determine whether diamide-specific
transcriptional changes are possible after 10 minutes of
PolII inactivation.
Surprisingly, PolII was recruited to a subset of diamide-
specific genes under these conditions (Fig ure 6), indicat-
ing that not only can PolII maintain contact with the
genome under these conditions, but it can still be
recruited. PolII occupancy over some of these genes was
Figure 5 Analysis of PolII occupancy in the rpb1-1 mutant. (a) Examples of time course data from wild type (wt; left panels) or rpb1-1 yeast
(right panels) during heat shock time courses. Chromosome coordinates are indicated between the two sets of panels. Note the decrease in
dynamic range in the right panels in the last two columns, manifest as decreased color saturation in the rightmost two columns. (b, c)
Histograms of microarray probe values for wild-type (b) or rpb1-1 (c) cells at varying times. Narrowing of the histogram in (c) indicates loss of
PolII enrichment after approximately 1 hour of treatment with the restrictive temperature.
Kim et al. Genome Biology 2010, 11:R75
/>Page 8 of 13
not restricted to the promoter, suggesting that it might
even transit the ORF under these conditions. Interest-
ingly, only a subset of diamide-specific genes were cap-
able of recruiting PolII aft er 10 minutes at the restrictive
temperature. The difference between these t wo sets of
diamide-specific genes is not apparent to us at present.
Discussion
Here, we report dynamic whole-genome mapping of
PolII occupancy during several different stress time
courses. Our major findings are: 1, transcriptional
changes in response to stress are on ly partly reflected in
mRNA abundance; 2, widespread cryptic transcription
likely contributes to gene regulation during stress
response; and 3, some PolII maintains contact with the
genome, and is even recruited, well after mRNA synth-
esis is thought to have stopped in the rpb1-1 mutant.
Most interestingly, we find widespread mismatches
between changes in PolII and changes in mRNA abun-
dance during two stress response time courses. While
PolII recruitment to a given gene is correlated with an
increase in expression of that gene, the quantitative level
of mRNA change for a given relative change in PolII
recruitment is hi ghly variable. A numb er of factors
could explain variability in mRNA production per PolII,
such as regulated mRNA stability [2]. Indeed, we find
that genes with excess mRNA production tended to
exhibit longer half-lives (Additional file 14). However,
genome-wide mRN A half-lives have typically been mea-
sured in the rpb1-1 strain, which appears to upregulate
stress genes for at least some time during the shift to
the restrictive temperature [1], indicating that the long
mRNA half-lives for stress-related transcripts likely
include effects of increased mRNA production during
these time courses.
Here, we additionally find that genes exhibiting unu-
sually high levels of mRNA produced per change in
PolII generally exhibit greater overlap with cryptic and
stable noncoding/unannotated transcripts (Figure 4d;
Additional file 12c). Furthermore, we note t hat many
Figure 6 PolII can still be recruited even after shifting rpb1-1 to 37°C. (a-c) Examples of time course data from cells shifted to 37°C (left
panel), treated with diamide (middle panel), or shifted to 37°C for 10 minutes before diamide addition (right panel). Panels (a, b) show regions
where PolII is recruited to diamide-specific genes despite being at the rpb1-1 restrictive temperature, whereas (c) shows diamide-specific genes
that fail to recruit PolII.
Kim et al. Genome Biology 2010, 11:R75
/>Page 9 of 13
poorly expressed mRNAs are associated with overlap-
ping transcripts before stress (Figure 2d). Together,
these observations supportamodelwheresomeofthe
PolII associated with such a gene in mid-log growth is
engaged in nonproductive (in some cases regulatory)
transcription [22,28-35] (Additional file 10). Upon stress,
upregulation of the ORF promoter, downregulation of
the CUT/SUT promoter, or both, would result in a
higher proportion of PolII molecules associated with a
gene being engaged in productive trans cription. We sus-
pect that each of these three possibilities occurs at
different genes.
We further speculate, then, that mismatches in which
less mRNA is produced per PolII change represent
genes where nonproductive transcription is induced in
stress (see, for example, altered SUT expression in stress
in [36]). As genome-wide datasets that identified CUTs
and SUTs in budding yeast were not derived under
stress conditions, these putative stress-specific tran-
scripts would not have been identified in prior studies.
Interestingly, we found that genes involved in carbo-
hydrate metabolism as a class are more subject to excess
mRNA production than other gene sets (Additional file
8). Previous studies of cryptic unstable transcripts found
that genes involved in glucose metabolism were signifi-
cantly enriched for sense CUTs [37], consistent with our
finding that genes exhibiting excess mRNA production
were associated with overlapping CUTs or SUTs (Figure
4d). What is the biological rationale for regulation of
carbohydrate-related genes by overlapping transcription?
In the cases of nucleotide metabolism a nd termination
factors [6,37], regulation by CUTs appears to provide a
mechanism for feedback regulation of the relevant
gen es. In the case of c arbohydrate metabolism the basis
for direct feedback is less clear, although given the wide-
spread mechanisms by which a cell’s metabolic state can
influence chromatin regulators’ activities [38], we specu-
late that control of CUT transcription or termination
could globally respond to NAD/NADH ratios or some
other aspects of global cellular metabolism.
Finally, we extensively characterize the widely used
temperature-sensitive rpb1-1 mutant in PolII. Many or
most published studies use 15 minutes of inactivation of
this allel e to address the role of transcription in a given
process (nuclear pore association, nucleosome position-
ing, and so on). However, here we find that PolII
remains associated with the genome for approximately
an hour before dissociating. Furthermore, we find that
after 10 minutes in restrictive temperature PolII can still
be recruited to newly activated genes. Prior studies with
this mutant have shown a decrease in mRNA produc-
tion [15] and in permanganate sensitiv ity [39] aft er
15 minutes of heat inactivation of this mutant, while
our results show continued genomic association of PolII
with the genome for at least another 15 minutes after
this time. These different assays suggest that inactivating
this mutant results first in loss of productive transcrip-
tion without concomitant dissociation from the genome,
followed after some time by dissociation from DNA.
Thus, these experiments indicate that care must be used
when interpreting the results of expe riments with this
mutant, and that longer incubation at restrictive tem-
perature is required before PolII disengages from the
genome.
Together, our results provide a broad perspective on
the relationship between PolII and gene expression.
These results have particular importance for studies
attempting to use genomic sequence to understand tran-
scriptional regulation - while the role of promoter
sequence in the regulation of transcription is of course a
major factor in the transcriptome, a great deal of varia-
bility in mRNA abundance may result from upstream or
downstream regulatory promoters. Future computational
studies w ill no doubt need to take local genomic struc-
ture-mediated effects such as these into account [40] in
orde r to achieve a quantitative predictive understanding
of how gene regulation derives from genomic sequence.
Conclusions
Our results emphasize the ubiquity and plasticity of
nonproductive transcription in budding yeast. Quantita-
tive models of transcriptional regulation will be better
served by focusing on PolII than on RNA abundance
measures, as RNA abundance reflects a multitude of
regulated processes from production to degradation.
Finally, results from experiments utilizing the rpb1-1
mutant strain must be treated with caution, as PolII
remains associated with the genome for much longer
than previously appreciated at the restrictive
temperature.
Materials and methods
Yeast culture
Two strains were used - the rpb1-1 mutant (gift from
Fred Winston), and parental strain BY4741. For th e
diamide time course, five flasks ea ch of 250 ml rpb1-1
cells were grown in YPD to an A
600
OD of 0.5 in 1-l
flasks shaking at 200 rpm at r oom temperature (25°C).
Diamide was adde d to a final concentration of 1.5 mM
to flasks at time zero. At t = 0, 15, 30, 60, and 120
minutes, formaldehyde was added to a final concentra-
tion of 1%. For the heat shock time courses (both wild
type and rpb1-1), an equal volume of YPD prewa rmed
to 49°C was added to flasks, which were immediately
Kim et al. Genome Biology 2010, 11:R75
/>Page 10 of 13
transferred to a 37°C incubator and incubated for vary-
ing lengths of time prior to fixation. Finally, for heat
shock plus diamide treatment, three flasks of rpb1-1
cells were shifted t o 37°C as above for 10 minutes,
then diamide was added for 15, 30, or 60 minutes
prior to fixation.
Chromatin immunoprecipitation and DNA amplification
We carried out PolII ChIP as previously described with
minor modifications [16,17]. protein G beads (20 μl)
and anti-Rpb3 monoclonal antibody (5 μl) were mixed
with 1 ml of chromatin solution containing 1 mg of
proteins and incubated overnight at 4°C. Beads were
washed sequentially with 1 ml each of FA lysis buffer
containing 275 mM NaCl, FA lysis buffer containing
500 mM NaCl, wash buffer (10 mM Tris, pH 8.0, 0.25
M LiCl, 1 mM EDTA, 0.5% NP-40, 0.5% Na deoxycho-
late), and TE (10 mM Tris pH 8.0, 0.1 mM EDTA).
Immunoprecipitated chromatin was eluted from the
beads by heating for 20 minutes at 65°C in 2 00 μlof50
mM Tris, pH 7.5, 10 mM EDTA, and 1% SDS. After
recovery of the supernatant, beads were washed with
200 ml TE that was then added to the first supernatant.
For Input DNA, 150 μl of FA lysis buffer and 200 μlof
TE were added into 50 μl of chromatin solution. Rever-
sal of crosslinking was done as described [41], and then
the precipitated DNA and Input DNA were resolved in
45 μland50μl of distilled water, respectively. Precipi-
tated DNA (40 μl) and 1/50 diluted Input DNA were
used for amplification. DNA amplification was done as
described previously [17].
Microarray hybridization
DNA produced from the amplification ( 3 μg) was used
to label probe via Klenow labeling. Labeled probes were
hybridized onto a yeast tiled oligonucleotide microarray
at 65°C for 16 hours and washed as described [23]. The
arrays were scanned at 5 micron resolution with an
Axon Laboratories GenePix 4000B scann er running
GenePix 5.1 (Molecular Devices, Sunnyvale, CA, USA).
Data availability
Data have been deposited to the Gene Expression
Omnibus, accession number [GEO:GSE22675].
Additional material
Additional file 1: Table S1. Complete dataset. PolII localization dataset
for 18 experiments, as indicated in the column headings. Microarray
probes are identified both by Agilent probe ID as well as by
chromosome coordinate.
Additional file 2: Table S2. Granularized data. Probes were grouped as
described in [16], and data were averaged for varying annotations (that
is, YAL001W-5CDS indicates probes falling within 500 bp of YAL001W’s
ATG) as indicated.
Additional file 3: Table S3. PolII localization sorted by 5’/3’ bias. For
genes with a mid-CDS annotation (that is, genes over 1 kb in length),
data are shown for 5’ CDS, mid-CDS, and 3’ CDS. Genes are ordered by
the ratio of 5’ to 3’ PolII abundance.
Additional file 4: Figure S1. Genes with 3’-biased PolII are poorly-
expressed. (a) Genes are sorted by 5’ bias in PolII abundance as in Figure
2b, but all genes with overlapping CUTs and SUTs have been removed.
(b) Genes with high 5’/3’ PolII abundance are highly expressed. Log(2) of
mRNA abundance data from Yassour et al. [21] is shown as an 80-gene
running-window average, with genes ordered as in (a).
Additional file 5: Figure S2. Comparison of PolII location on gene body
to mRNA induction level. (a, b) PolII enrichment was calculated for 5’,
mid-, and 3’ CDS at t = 0 (pre-stress) and t = 30 minutes (stress) for heat
shock (a), and diamide (b) stresses. Genes are ordered by mRNA change
from highly repressed (left) to highly activated (right), and PolII
abundances are plotted as an 80-gene running-window average. Genes
that are highly repressed (left) tend to exhibit 5’-biased PolII pre-stress.
Additional file 6: Figure S3. Comparison of PolII changes to mRNA
changes during the diamide stress response. (a) mRNA data from Gasch
et al. [18] were subjected to k-means clustering with k = 8. (b, c) PolII data
for 5’ (b) or 3’ (c) CDS were normalized by subtracting t = 0 data from
each time point, and genes long enough to have a mid-CDS annotation
are ordered as in (a). (d) Average mRNA changes for the eight clusters
from (a), with cluster number indicated by the color to the right of the
data in (a). (e) As in (d), but for mid-CDS PolII occupancy changes.
Additional file 7: Figure S4. Comparison of PolII changes to mRNA
changes during two stress responses. (a-f) mRNA data from Gasch et al.
[18] are plotted on the y-axis, with the change in PolII at mid-CDS for
the same gene plotted on the x-axis. The red line shows an 80-gene
running-window average. HS refers to heat shock, D refers to diamide,
and 15, 30, and 60 refer to minutes of stress. Note for diamide the mRNA
data come from 20 rather than 15 minutes.
Additional file 8: Figure S5. Genes involved in carbohydrate
metabolism exhibit significant excess mRNA produced per PolII change.
(a) Scatterplot as in Figure 4a,c and Additional file 7. Red triangles
indicate genes annotated with ‘carbohydrate metabolic process’. (b)
Cumulative distribution plots for carbohydrate metabolism genes (red)
and all others (blue) showing that a significantly higher fraction of
carbohydrate metabolism genes exhibit excess mRNA production relative
to the background distribution.
Additional file 9: Figure S6. Genes producing ‘
excess’ mRNA exhibit
significant overlap with CUTs and SUTs. Cumulative distribution (y-axis) of
genes overlapping a given length of alternative transcript [22], summed
over both 5’ and 3’ overlaps, for genes exhibiting excess (red), predicted
(blue), or a dearth of (green) mRNA production per PolII change (Figure 4c).
Additional file 10: Figure S7. Model for excess mRNA production per
PolII. Before stress, a gene with an overlapping CUT will be associated
with PolII molecules producing mRNA (right arrow) as well as PolII
molecules producing rapidly degraded ‘cryptic ’ transcripts (left arrows).
After stress, repression of the CUT promoter and activation of the ORF
promoter will result in a greater proportion of mRNA-producing PolII
molecules associated with the ORF. Note that either ORF promoter
activation or CUT promoter repression alone would be sufficient to
increase the relative proportion of productive PolII relative to overall PolII,
but both are shown here to illustrate the point.
Additional file 11: Figure S8. Genes with high 3’/5’ PolII ratios pre-stress
tend to produce excess mRNA during stress. (a) Scatterplot of PolII 5’/3’
ratio at t = 0 (as in Figure 2b), x axis, versus mRNA excess produced after
30 minutes of heat shock. (b) Eighty-gene running-window average of the
data from (a). Note the y-axis scale changes between these two panels.
Additional file 12: Figure S9. mRNA data collected in this study
correlate with Gasch et al. [18]. (a) Comparison of mRNA changes from
Gasch et al. [18] with those measured in this study after 30 minutes of
heat shock. Axes are log(2) of the fold-change relative to t = 0. (b)
mRNA changes compared to PolII changes over mid-CDS. As in Figure
4c, but for mRNA data collected in this study. (c) Genes exhibiting
‘excess’ mRNA production per PolII more extensively overlap CUTs and
SUTs than do other genes. As in Figure 4d.
Kim et al. Genome Biology 2010, 11:R75
/>Page 11 of 13
Additional file 13: Figure S10. PolII abundance before and after
inactivation of rpb1-1. (a-c) Scatterplots of PolII abundance before stress
(a), after 120 minutes of heat shock in wild type (b), or after 30 minutes
of inactivation of rpb1-1 (c), on the x-axis, versus PolII abundance after
120 minutes of heat shock in rpb1-1 (y-axis). Running window averages
are indicated for 5’, mid-, and 3’ CDS probes.
Additional file 14: Figure S11. Excess mRNA production correlates with
mRNA half-life. Genes are ordered according to deviation from expected
mRNA produced per change in PolII (Figure 4c) for 30 minutes of heat
shock, and an 80-gene running-window average of mRNA half-life [2] is
plotted on the y-axis.
Abbreviations
bp: base pair; CDS: coding sequence; ChIP: chromatin immunoprecipitation;
CUT: cryptic unstable transcript; ORF: open reading frame; PolII: RNA
polymerase II; SUT: stable unannotated transcript.
Acknowledgements
We thank Audrey Gasch, Paul Kaufman, and members of the Rando lab for
comments on this manuscript. Work was supported by NIGMS grant
GM079205, HFSP, and the Burroughs Wellcome Fund (OJR), and the US-Israel
Bi-National Foundation and a European Union FP7 ‘Model-In’ collaborative
grant (NF).
Author details
1
Department of Biological Chemistry and Molecular Pharmacology, Harvard
University, 240 Longwood Avenue, Boston, MA 02115, USA.
2
Department of
Biochemistry and Molecular Pharmacology, University of Massachusetts
Medical School, 364 Plantation St, Worcester, MA 01605, USA.
3
School of
Computer Science and Engineering, The Hebrew University, Givat Ram
Campus, Jerusalem 91904, Israel.
4
The Broad Institute of Harvard and MIT, 7
Cambridge Center, Cambridge, MA 02142, USA.
5
The Alexander Silberman
Institute of Life Science, The Hebrew University, Givat Ram Campus,
Jerusalem 91904, Israel.
6
Current address: Division of Immunology and
Rheumatology, Department of Medicine, Stanford School of Medicine ,
Stanford, CA 94305, USA.
Authors’ contributions
TSK d esigned experiments and carried out Pol2 ChIPs and amplifications, CLL
designed experiments, JH performed microarray hybridizations, MY assisted with
data analysis, N F participated i n experiment planning and manuscript preparation,
SB participated in experiment plann ing and manuscript preparation, an d OJR
conceived of the study, performed data analysis, and d rafted the m anuscript. All
authors read and appr oved the final manuscript.
Received: 17 May 2010 Revised: 30 June 2010 Accepted: 16 July 2010
Published: 16 July 2010
References
1. Holstege FC, Jennings EG, Wyrick JJ, Lee TI, Hengartner CJ, Green MR,
Golub TR, Lander ES, Young RA: Dissecting the regulatory circuitry of a
eukaryotic genome. Cell 1998, 95:717-728.
2. Wang Y, Liu CL, Storey JD, Tibshirani RJ, Herschlag D, Brown PO: Precision
and functional specificity in mRNA decay. Proc Natl Acad Sci USA 2002,
99:5860-5865.
3. Core LJ, Waterfall JJ, Lis JT: Nascent RNA sequencing reveals widespread
pausing and divergent initiation at human promoters. Science 2008,
322:1845-1848.
4. Preker P, Nielsen J, Kammler S, Lykke-Andersen S, Christensen MS,
Mapendano CK, Schierup MH, Jensen TH: RNA exosome depletion reveals
transcription upstream of active human promoters. Science 2008,
322:1851-1854.
5. Seila AC, Calabrese JM, Levine SS, Yeo GW, Rahl PB, Flynn RA, Young RA,
Sharp PA: Divergent transcription from active promoters. Science 2008,
322:1849-1851.
6. Steinmetz EJ, Warren CL, Kuehner JN, Panbehi B, Ansari AZ, Brow DA:
Genome-wide distribution of yeast RNA polymerase II and its control by
Sen1 helicase. Mol Cell 2006, 24:735-746.
7. Gilmour DS: Promoter proximal pausing on genes in metazoans.
Chromosoma 2009, 118:1-10.
8. Gilmour DS, Lis JT: RNA polymerase II interacts with the promoter region
of the noninduced hsp70 gene in Drosophila melanogaster cells. Mol Cell
Biol 1986, 6:3984-3989.
9. Rougvie AE, Lis JT: The RNA polymerase II molecule at the 5′ end of the
uninduced hsp70 gene of D. melanogaster is transcriptionally engaged.
Cell 1988, 54:795-804.
10. Spencer CA, Groudine M: Transcription elongation and eukaryotic gene
regulation. Oncogene 1990, 5:777-785.
11. Radonjic M, Andrau JC, Lijnzaad P, Kemmeren P, Kockelkorn TT, van
Leenen D, van Berkum NL, Holstege FC: Genome-wide analyses reveal
RNA polymerase II located upstream of genes poised for rapid response
upon S. cerevisiae stationary phase exit. Mol Cell 2005, 18:171-183.
12. Baugh LR, Demodena J, Sternberg PW: RNA Pol II accumulates at
promoters of growth genes during developmental arrest. Science 2009,
324:92-94.
13. Muse GW, Gilchrist DA, Nechaev S, Shah R, Parker JS, Grissom SF,
Zeitlinger J, Adelman K: RNA polymerase is poised for activation across
the genome. Nat Genet 2007,
39:1507-1511.
14. Zeitlinger J, Stark A, Kellis M, Hong JW, Nechaev S, Adelman K, Levine M,
Young RA: RNA polymerase stalling at developmental control genes in
the Drosophila melanogaster embryo. Nat Genet 2007, 39:1512-1516.
15. Nonet M, Scafe C, Sexton J, Young R: Eucaryotic RNA polymerase
conditional mutant that rapidly ceases mRNA synthesis. Mol Cell Biol
1987, 7:1602-1611.
16. Dion MF, Kaplan T, Kim M, Buratowski S, Friedman N, Rando OJ: Dynamics
of replication-independent histone turnover in budding yeast. Science
2007, 315:1405-1408.
17. Kim M, Krogan NJ, Vasiljeva L, Rando OJ, Nedea E, Greenblatt JF,
Buratowski S: The yeast Rat1 exonuclease promotes transcription
termination by RNA polymerase II. Nature 2004, 432:517-522.
18. Gasch AP, Spellman PT, Kao CM, Carmel-Harel O, Eisen MB, Storz G,
Botstein D, Brown PO: Genomic expression programs in the response of
yeast cells to environmental changes. Mol Biol Cell 2000, 11:4241-4257.
19. Liu CL, Kaplan T, Kim M, Buratowski S, Schreiber SL, Friedman N, Rando OJ:
Single-nucleosome mapping of histone modifications in S. cerevisiae.
PLoS Biol 2005, 3:e328.
20. Arigo JT, Carroll KL, Ames JM, Corden JL: Regulation of yeast NRD1
expression by premature transcription termination. Mol Cell 2006,
21:641-651.
21. Yassour M, Kaplan T, Fraser HB, Levin JZ, Pfiffner J, Adiconis X, Schroth G,
Luo S, Khrebtukova I, Gnirke A, Nusbaum C, Thompson DA, Friedman N,
Regev A: Ab initio construction of a eukaryotic transcriptome by
massively parallel mRNA sequencing. Proc Natl Acad Sci USA 2009,
106:3264-3269.
22. Xu Z, Wei W, Gagneur J, Perocchi F, Clauder-Munster S, Camblong J,
Guffanti E, Stutz F, Huber W, Steinmetz LM: Bidirectional promoters
generate pervasive transcription in yeast. Nature 2009, 457:1033-1037.
23. Pokholok DK, Harbison CT, Levine S, Cole M, Hannett NM, Lee TI, Bell GW,
Walker K, Rolfe PA, Herbolsheimer E, Zeitlinger J, Lewitter F, Gifford DK,
Young RA: Genome-wide map of nucleosome acetylation and
methylation in yeast. Cell 2005, 122:517-527.
24. Newman JR, Ghaemmaghami S, Ihmels J, Breslow DK, Noble M, DeRisi JL,
Weissman JS: Single-cell proteomic analysis of S. cerevisiae reveals the
architecture of biological noise. Nature 2006, 441:840-846.
25. Jin J, Bai L, Johnson DS, Fulbright RM, Kireeva ML, Kashlev M, Wang MD:
Synergistic action of RNA polymerases in overcoming the nucleosomal
barrier. Nat Struct Mol Biol 2010, 17:745-752.
26. Kulaeva OI, Hsieh FK, Studitsky VM:
RNA polymerase complexes cooperate
to relieve the nucleosomal barrier and evict histones. Proc Natl Acad Sci
USA 2010, 107:11325-11330.
27. Zanton SJ, Pugh BF: Full and partial genome-wide assembly and
disassembly of the yeast transcription machinery in response to heat
shock. Genes Dev 2006, 20:2250-2265.
28. Jacquier A: The complex eukaryotic transcriptome: unexpected pervasive
transcription and novel small RNAs. Nat Rev Genet 2009, 10:833-844.
29. Berretta J, Morillon A: Pervasive transcription constitutes a new level of
eukaryotic genome regulation. EMBO Rep 2009, 10:973-982.
Kim et al. Genome Biology 2010, 11:R75
/>Page 12 of 13
30. Camblong J, Iglesias N, Fickentscher C, Dieppois G, Stutz F: Antisense RNA
stabilization induces transcriptional gene silencing via histone
deacetylation in S. cerevisiae. Cell 2007, 131:706-717.
31. Hongay CF, Grisafi PL, Galitski T, Fink GR: Antisense transcription controls
cell fate in Saccharomyces cerevisiae. Cell 2006, 127:735-745.
32. Houseley J, Rubbi L, Grunstein M, Tollervey D, Vogelauer M: A ncRNA
modulates histone modification and mRNA induction in the yeast GAL
gene cluster. Mol Cell 2008, 32:685-695.
33. Kapranov P, Cawley SE, Drenkow J, Bekiranov S, Strausberg RL, Fodor SP,
Gingeras TR: Large-scale transcriptional activity in chromosomes 21 and
22. Science 2002, 296:916-919.
34. Martens JA, Wu PY, Winston F: Regulation of an intergenic transcript
controls adjacent gene transcription in Saccharomyces cerevisiae. Genes
Dev 2005, 19:2695-2704.
35. Struhl K: Transcriptional noise and the fidelity of initiation by RNA
polymerase II. Nat Struct Mol Biol 2007, 14:103-105.
36. Dutrow N, Nix DA, Holt D, Milash B, Dalley B, Westbroek E, Parnell TJ,
Cairns BR: Dynamic transcriptome of Schizosaccharomyces pombe shown
by RNA-DNA hybrid mapping. Nat Genet 2008, 40:977-986.
37. Neil H, Malabat C, d’Aubenton-Carafa Y, Xu Z, Steinmetz LM, Jacquier A:
Widespread bidirectional promoters are the major source of cryptic
transcripts in yeast. Nature 2009, 457:1038-1042.
38. Ladurner AG: Rheostat control of gene expression by metabolites. Mol
Cell 2006, 24:1-11.
39. Giardina C, Lis JT: DNA melting on yeast RNA polymerase II promoters.
Science 1993, 261:759-762.
40. Buetti-Dinh A, Ungricht R, Kelemen JZ, Shetty C, Ratna P, Becskei A: Control
and signal processing by transcriptional interference. Mol Syst Biol 2009,
5:300.
41. Komarnitsky P, Cho EJ, Buratowski S: Different phosphorylated forms of
RNA polymerase II and associated mRNA processing factors during
transcription. Genes Dev 2000, 14:2452-2460.
doi:10.1186/gb-2010-11-7-r75
Cite this article as: Kim et al.: RNA polymerase mapping during stress
responses reveals widespread nonproductive transcription in yeast.
Genome Biology 2010 11:R75.
Submit your next manuscript to BioMed Central
and take full advantage of:
• Convenient online submission
• Thorough peer review
• No space constraints or color figure charges
• Immediate publication on acceptance
• Inclusion in PubMed, CAS, Scopus and Google Scholar
• Research which is freely available for redistribution
Submit your manuscript at
www.biomedcentral.com/submit
Kim et al. Genome Biology 2010, 11:R75
/>Page 13 of 13