Handbook of EEG interpretation - part 7 potx
Bạn đang xem bản rút gọn của tài liệu. Xem và tải ngay bản đầy đủ của tài liệu tại đây (1.71 MB, 29 trang )
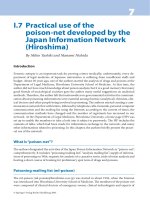
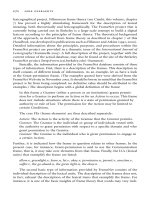
FIGURE 6.12. This is a 30-sec epoch demonstrating stage III sleep with
slow waves present (thin arrows) that do not encompass more than 50% of the
epoch. Additionally, sleep spindles are noted (thick arrow) as are vertex waves
(dashed arrow).
S
tage III sleep is scored when the EEG has high-amplitude slow
waves occupying at least 20% but no more than 50% of the
epoch. Slow waves are 2 Hz or slower and must have a peak to peak
amplitude of at least 75 µV. Sleep spindles, K complexes, and vertex
waves may or may not be present in this stage of sleep.
CHAPTER 6
162
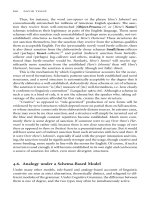
FIGURE 6.13. This is a 30-sec epoch demonstrating stage IV sleep and high-
amplitude delta waves (thin arrows) that are often seen in the eye leads as well
(thick arrows).
I
n stage IV sleep, slow waves encompass at least 50% of the epoch.
Slow waves are defined the same way as in stage III sleep. Sleep
spindles, K complexes, and vertex waves may or may not be present
in stage IV sleep. Many PSG laboratories score stages III and IV
together, as differentiation between the two stages is difficult, and is
referred to as stage delta, delta sleep, or slow- wave sleep. Most of the
delta waves above are greater than 100 µV. Delta waves can be differ-
entiated from eye movements because these waves are in phase, and
eye movements are out of phase in the eye leads. EMG activity is low
in delta sleep; however not as low as in REM sleep.
Polysomnography
163
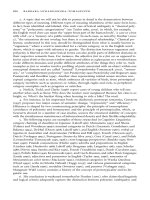
FIGURE 6.14. This is a 30-sec epoch demonstrating stage REM with fre-
quent rapid eye movements (thin arrows), atonia (thick arrow), and mixed-fre-
quency EEG (dashed arrow).
S
tage REM is characterized by the appearance of low-amplitude,
mixed-frequency EEG activity, EMG atonia, and rapid eye move-
ments. EEG activity is similar to that seen in stage I sleep; however,
vertex waves are much less common. Although EMG atonia is char-
acteristic in stage REM, occasional phasic EMG bursts may be seen.
If EMG atonia is not noted, the EMG must be at the lowest level com-
pared to other stages of sleep (relative atonia). The most characteris-
tic feature of this stage of sleep is the rapid eye movements, and can
be distinguished from slow rolling eye movements by the rapid up
slope of the eye movement. It is less than 300 msec in rapid eye move-
ments. Note that the eye movements are seen as out of phase deflec-
tions in the eye leads, clearly differentiating them from brain activity.
It is not unusual to see irregularity of respiration and cardiac rhythm
in stage REM.
CHAPTER 6
164
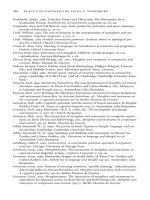
FIGURE 6.15. This is a 30-sec epoch showing the start of stage REM and
saw tooth waves.
S
aw tooth waves (arrows) are 2- to 5-Hz vertex negative sharp
waves that often occur in a series. They can be precursors of stage
REM or can occur with phasic bursts of EMG activity or rapid eye
movements during stage REM. Rules for scoring the start and end of
stage REM are complex, and the reader is referred to other compre-
hensive reviews.
Polysomnography
165
FIGURE 6.16. This is a 30-sec epoch that is scored as movement time. The
movement starts at about second 5 (thin arrow) and ends at about the 25th
second (thick arrow).
W
hen at least 50% of an epoch contains movement artifact
obscuring underlying EEG, EOG, and EMG, and it is preceded
and followed by sleep, it is scored as movement time. This differenti-
ates movement time from movements occurring during wakefulness.
Also, shorter duration movements (obscuring less than 50% of the
epoch) are not scored as movement time but rather are scored accord-
ing to the prevailing sleep stage. During this period, the underlying
EEG cannot be accurately staged, and so this epoch is scored as move-
ment time.
CHAPTER 6
166
Respiratory abnormalities are often seen in patients with clinical complaints of
excessive daytime sleepiness. Abnormalities of respiration are commonly encoun-
tered in sleep disorders.Apnea and hypopneas are abnormal periods of respiratory
interruption that are frequently encountered in the diagnosis of sleep disorders.
FIGURE 6.17. This is a 30-sec epoch demonstrating an obstructive apnea
marked by thin arrows (about 16 sec). Note the desaturation at the end of the
page that is occurring in response to the apnea (thick arrow) with an arousal
(dashed arrow) and body movement (dotted arrow). Excursions of the thoracic
and abdominal respiratory effort monitors demonstrate paradoxical respira-
tion (line and dash arrows).
A
lthough scoring rules for apneas differ, they must have a dura-
tion of at least 10 sec and airflow must be diminished by at least
90% compared to the airflow before and after the apnea. During this
period of airflow cessation due to airway collapse, respiratory effort
Polysomnography
167
RESPIRATORY ABNORMALITIES
is manifested by ongoing excursions of the thoracic and abdominal
belts. Instead of thoracic and abdominal movements being in phase as
they normally are, in an apnea, they are out of phase. This is referred
to as paradoxical respiration. After an apnea oxygen desaturation
may result, and typically follows the apneas by 10 to 20 sec necessary
to manifest the hypoxemia. At the termination of the apnea, there is
usually a large breath, a body movement, and often an arousal.
CHAPTER 6
168
FIGURE 6.18. This is a 5-min epoch demonstrating frequent obstructive
sleep apneas.
W
hen evaluating respiration, it is helpful to use a long time base
since the deflections of interest are very slow waves. The above
sample is from the same patient as the prior sample. The long time
base makes identification of respiratory dysrhythmias easy (thin
arrows
). Note also that following each apnea, there is a significant
oxygen desaturation (
thick arrow). A leg movement is also noted after
every apnea as well (
dashed arrows). Interpreting the EEG with such
a long time base is difficult.
Polysomnography
169
FIGURE 6.19. This is a 5-min epoch demonstrating of a patient with severe
obstructive sleep apnea (OSA) that is being treated with CPAP.
C
ontinuous positive airway pressure (CPAP) is an effective treat-
ment for OSA. This epoch is from the same patient as the preced-
ing two epochs. There is resolution of the apneas and desaturations
with treatment with CPAP at a pressure of 10 cm H
2
O (arrow).
CHAPTER 6
170
FIGURE 6.20. This is a 30-sec epoch demonstrating a 15-sec obstructive
hypopnea. There is a 60% amplitude reduction in the nasal/oral airflow chan-
nel (thin arrow) with continued respiratory effort (thick arrow), and oxygen
desaturation >4% that follows the event (overlaps to the next page [not
shown]) (dashed arrow). The reduced airflow and oxygen desaturation allow
this event to be scored as hypopnea.
H
ypopnea scoring also may differ. Many laboratories use a greater
than 50% but less than a 90% decrease in amplitude of the
nasal/oral airflow channel that lasts for at least 10 sec, accompanied
by an oxygen desaturation of at least 3% to 4% or an arousal. Apneas
do not have the same requirement of being associated with either a
desaturation or arousal. The physiological consequences of both
obstructive apneas and hypopneas are the same; therefore, it has been
recommended that these events not be scored separately. The term
obstructive apnea/hypopnea event is used when there is a greater than
50% decrease of the amplitude of the nasal/oral airflow channel, or if
Polysomnography
171
the decrease is less than 50%, but is associated with at least a 3%
desaturation or arousal. Like most definitions, the event must last at
least 10 sec.
CHAPTER 6
172
FIGURE 6.21. This is a 5-min epoch demonstrating obstructive hypopneas
(thin arrow) associated with oxygen desaturations (thick arrow).
T
he American Academy of Sleep Medicine (AASM) recommends
that obstructive apneas and hypopneas be counted as a single
obstructive apnea/hypopnea event as their physiological consequences
are similar. The epoch above illustrates the severity of hypopneas
(approximately 50% reduction of the nasal/oral airflow channel),
with a considerable desaturation (to about 80%) during each event.
Polysomnography
173
FIGURE 6.22. This is a 30-sec epoch demonstrating an obstructive hypop-
nea lasting 15 sec (thin arrow) and a subsequent arousal (thick arrow). Note
the paradoxical respiration manifest in the respiratory effort monitors (dashed
arrows).
O
bstructive apneas and hypopneas are frequently associated with
arousals. The degree of daytime sleepiness in obstructive sleep
apnea correlates more with the number of arousal than with severity
of apneas or desaturations. The arousal is manifest by an abrupt EEG
frequency shift that lasts more than 3 sec.
CHAPTER 6
174
FIGURE 6.23. This is a 30-sec epoch demonstrating a respiratory
event–related arousal. In this example, there is recurrent snoring (thin arrows)
with one of the snores associated with an arousal (thick arrow). Notice how
the snores diminish after the arousal (dashed arrow).
P
eriodically, patients have abnormal respiratory events that do not
meet the scoring criteria for apneas and hypopneas but appear to
be caused by airway compromise. These patients have loud snoring
which is frequently associated with arousals. The AASM recommends
that these events be called respiratory event related arousals (RERAs).
Studies using esophageal pressure manometry show that these events
are associated with an increase in negative intrapleural pressure simi-
lar to that seen in apneas and hypopneas. The AASM suggests that
these events be counted with obstructive apnea/hypopnea events.
RERAs often resolve with CPAP.
Polysomnography
175
FIGURE 6.24. This is a 30-sec epoch demonstrating a central apnea with
absence of both nasal/oral airflow (thin arrow) and respiratory effort (thick
arrows).
I
n central apnea, there is not only cessation of airflow but also of
respiratory effort, as noted by the thoracic and abdominal chan-
nels. In some patients, weak respiratory efforts may go undetected by
the thoracic and abdominal channels, or an obstructive apnea may
mimic a central one. Central apneas can occur in neuromuscular dis-
orders, neurological disorders involving primarily the brain stem,
heart failure, high altitudes, or they may be idiopathic.
CHAPTER 6
176
FIGURE 6.25. This is a 30-sec epoch demonstrating a central apnea in a
patient undergoing CPAP titration for obstructive sleep apnea syndrome.
C
entral apneas can occur when patients with obstructive sleep
apnea are undergoing CPAP titration. This pattern has recently
been termed complex sleep apnea. If the CPAP pressure is increased
beyond what is optimal for the patient, central apneas can occur. The
patient in the sample above was previously diagnosed with obstruc-
tive sleep apnea and was undergoing this study for CPAP titration.
The patient’s obstructive events were eliminated at a CPAP pressure of
14 cm H
2
O. The technologist continued to increase the CPAP pressure
for occasional arousals, and at a pressure of 17 cm H
2
O (thin arrow),
the patient started to have central apneas (
thick arrow). The optimal
CPAP setting was for 14 cm H
2
O. New BiPAP machines that may
specifically treat this type of pattern have become available.
Polysomnography
177
FIGURE 6.26. This is a 5-min epoch demonstrating Cheyne-Stokes respira-
tion with periods of central apnea manifest by absence of nasal/oral airflow
and respiratory effort (thin arrows), alternating with periods of hyperpnea
(thick arrows).
C
heyne-Stokes respiration is a cyclical pattern in which there is
waxing and waning of breathing between central apneas and
periods of hyperpnea. This is usually seen in patients with congestive
heart failure and cerebrovascular disease. The apneas may be associ-
ated with arousals or desaturations. Following an obstructive event,
the apnea often result in a deep, high-amplitude breath. In Cheyne-
Stokes respiration, there is gradual waxing of respiration after the
apnea (
dashed arrow). After the hyperpnea reaches its peak, the
breathing starts waning again (
dotted arrow).
CHAPTER 6
178
FIGURE 6.27. This is a 60-sec epoch that demonstrates a mixed apnea with
the entire event and the compensatory breaths that terminate the event (thin
arrow). Notice the initial part of the event in which there is a cessation of both
nasal/oral airflow and respiratory effort (thick arrow).
M
ixed apneas are considered a variant of obstructive apneas.
During the first half of the event, respiratory effort appears to
be absent, but is present in the latter half. Physiologically, mixed
apneas are thought to have the same consequences as obstructive
ones, and they are often counted together. The AASM also encourages
counting them with obstructive apnea/hypopnea events. In the latter
part of the event, there continues to be cessation of nasal/oral airflow
but respiratory effort returns (
dashed arrows).
Polysomnography
179
FIGURE 6.28. This is a 2-min epoch demonstrating both a mixed (thin
arrow) and obstructive apnea (thick arrow).
A
s noted before, mixed apneas have the same physiological con-
sequences as obstructive apneas. They often occur in the same
patient, and both resolve with CPAP. Mixed and obstructive apneas
can occur back to back in the same patient, suggesting that indeed
they have a similar pathophysiology. Notice the absence of respiratory
effort in the first half of the mixed apnea with return in the second
half (
dashed arrows). The obstructive apnea has persistence of respi-
ratory effort from the beginning (
dotted arrow).
CHAPTER 6
180
FIGURE 6.29. This is a 30-sec epoch demonstrating snoring associated with
an obstructive apnea. Note that snoring occurs with every breath (arrows) typ-
ically at the peak of inspiration (line). In this patient, snoring is not associated
with apneas, hypopneas, desaturations, or arousals.
I
n addition to monitoring nasal/oral airflow, respiratory effort, and
oxygen saturation, many laboratories also record snoring with a
small microphone attached to the side of the trachea. Snoring is often
present with obstructive sleep apnea and represents subtle narrowing
of the airway. In this sample, snoring is noted in the first third of the
sample (
thin arrows), but disappears during the obstructive apnea
(
thick arrows). At the termination of the apnea, there is an arousal
(
dashed arrow) and return of snoring (dotted arrow). During CPAP
titration for this patient, an attempt should be made to eliminate not
only the apneas but also the snoring as it represents airway narrow-
ing as well.
Polysomnography
181
FIGURE 6.30. This is a 30-sec epoch demonstrating snoring.
S
noring can occur without associated apneas. When snoring is not
associated with apneas, arousals, or sleep complaints, it is referred
to as primary snoring. In the sample above, notice that snoring occurs
with every breath (
arrows), but there is no associated apnea, hypop-
nea, desaturation, or arousal. Typically, snoring occurs at the peak of
inspiration (
line).
CHAPTER 6
182
Arousal from sleep may occur for many different reasons. Polygraphic recordings
demonstrate the arousal through EEG and EMG, while the underlying etiology can
usually be demonstrated by monitoring oxygenation and airflow for the presence of
apneas/hypopneas, snoring, or by monitors that detect leg movements or nocturnal
behaviors.
FIGURE 6.31. This is a 30-sec epoch demonstrating an unexplained arousal.
A
rousals are scored based on changes in the EEG. The AASM has
published rules on scoring arousals. An arousal is scored when
there is an abrupt change in EEG frequency including theta, alpha,
and frequencies greater than 16 Hz (but not spindles). This is subject
to the following 12 rules:
Polysomnography
183
ABNORMALITIES OF AROUSAL
1. The patient must be asleep for at least 10 sec before an arousal
can be scored.
2. There must be at least 10 sec of sleep between two arousals.
3. There must be at least 3 sec of EEG frequency shift (known as the
3-sec rule).
4. An arousal from NREM sleep can occur without an increase in
EMG activity.
5. An arousal from REM sleep must be accompanied by increase in
EMG activity.
6. An increase in EMG by itself is not sufficient to score an arousal.
7. Delta waves, K complexes, or artifacts cannot be included in the
3 sec needed to score an arousal.
8. Pen blocking can be included in the arousal if it is contiguous to
one (this applies to paper recordings).
9. Contiguous EEG and EMG changes cannot be combined in
reaching the 3-sec duration criteria.
10. Alpha activity intrusion into sleep must be at least 3 sec to be
scored as an arousal.
11. Sleep stage transitions cannot be scored as arousals.
12. When arousals occur in association with apneas/hypopneas,
snoring, or leg movements, they are scored as associated with the
same. If there is no apparent cause, they are scored as unex-
plained arousals. In the example shown in Figure 6.31, there is a
clear change of frequency to the alpha range that lasts about 10
sec (
arrow). Preceding the arousal are at least 10 sec of stage II
sleep (
thick arrow). Since it is not associated with either a respi-
ratory or leg movement event, it is scored as an unexplained
arousal.
CHAPTER 6
184
FIGURE 6.32. This is a 60-sec epoch demonstrating REM sleep, as indicated
by the rapid eye movements (thin arrows). There is a subsequent arousal man-
ifest as increase in the EEG frequencies (thick arrow) and increase of chin
EMG (dashed arrow).
A
s noted previously, arousals from REM sleep must be accompa-
nied by an increase in EMG, whereas arousals from NREM
sleep do not need a concomitant increase in EMG. It must be remem-
bered that an increase in EMG without an EEG change cannot be
scored as an arousal, regardless the stage of sleep.
Polysomnography
185
FIGURE 6.33. This is a 30-sec epoch of REM sleep demonstrating a shift in
EEG frequencies that is not an arousal.
T
he AASM criteria specify that arousals from REM sleep must not
only have a shift in EEG frequencies, but also an increase in
EMG. In the figure above, there is a clear shift of EEG frequencies
(thin arrow), but no increase in concurrent EMG (thick arrow).
Consequently, this cannot be scored as an arousal.
CHAPTER 6
186