báo cáo khoa học: "Relationships feed between growth rate, carcass composition, intake, feed conversion ratio and income in four biological types of cattle " potx
Bạn đang xem bản rút gọn của tài liệu. Xem và tải ngay bản đầy đủ của tài liệu tại đây (1.19 MB, 23 trang )
Relationships
between
growth
rate,
carcass
composition,
feed
intake,
feed
conversion
ratio
and
income
in
four
biological
types
of
cattle
(1)
R.
HANSET*
C.
MICHAUX*
A.
STASSE*
*
Chaire
de
Génétique,
Faculté
de
Médecine
Vétérinaire
(U.
Lg),
45,
rue
des
Vétérinaires,
B-1070
Bruxelles
(Belgique)
**
Ministère
de
l’Agric1!lt1!re,
Station
de
Selection
Bovine,
12,
rue
des
Champs-Elysées,
B-5300
Ciney
(Belgique)
Summary
The
relations
between
growth
rate,
carcass
composition,
feed
intake,
feed
conversion
ratio
and
income
are
investigated
on
bulls
entered
in
Station
at
the
age
of
one
month
and
tested
from
7
to
12
months
of
age,
belonging
to
four
biological
types :
1)
Belgian
Blue
bulls
of
the
double-muscled
type
(DM),
(n
=
622) ;
2)
crossbred
sons
of
DM
sires
out
of
Friesian
dams
(DM
x
FR),
(n
=
94) ;
3)
similar
sons
but
out
of
MRY
dams
(DM
x
MRY),
(n
=
20) ;
4)
Belgian
Blue
bulls
of
conventional
type
(CONV),
(n
=
236).
For
the
biological
as
for
the
economical
traits
considered,
the
double-muscled
type
was
quite
distinct
from
the
other
types.
In
comparison
with
the
conventional
animals,
the
double-muscled
ones
had
their
feed
intake
reduced
by
6.5
p.
100,
their
feed
conversion
ratio
reduced
by
8.7
p.
100,
their
dressing-out
percentage
increased
by
8
p.
100,
their
percent
lean
in
the
7‘"
ribcut
increased
by
20
p.
100,
their
percent
fat
in
the
same
ribcut
lowered
by
42
p.
100.
For
the
year
1980,
the
selling
price
of
the
double-muscled
exceeded
that
of
the
conventional
by
57
p.
100
and
their
net
income
was
3.25
times
higher.
The
coefficients
of
determination
(R
Z)
of
feed
intake
and
of
feed
conversion
ratio
by
initial
weight,
daily
gain
and
carcass
composition
criteria
were
computed
within
each
biological
type.
These
traits
were
considered
singly
and
in
combination.
It
was
found
that,
within
biological
types,
the
carcass
traits
were
of
minor
importance
in
the
determination
of
feed
intake
or
of
feed
conversion.
A
covariance
analysis
showed
that
mean
feed
intake
adjusted
for
initial
weight
and
daily
gain,
was
significantly
different,
among
biological
types,
suggesting
different
maintenance
requirements
and
especially
lower
maintenance
requirement
in
the
double-muscled
bull.
Determi-
nation
of
selling
price
and
of
net
income
by
growth
and
carcass
traits
were
also
investigated.
Genetic
parameters,
heritabilities
and
genetic
correlations,
were
estimated
«
within
the
double-
muscled
type
».
These
parameters
were
used
to
calculate
the
genetic
responses
to
selection
on
daily
gain,
ratio
of
gain
to
initial
weight,
final
weight,
feed
conversion
ratio,
net
income,
selection
indices
combining,
as
measured
variables,
either
daily
gain
and
feed
intake
(index
I)
or
daily
gain
and
initial
weight
(index
II).
All
these
selection
criteria
with
the
exception
of
final
weight
gave
as
direct
or
correlated
responses,
higher
net
income,
reduced
initial
weight,
moderately
increased
final
weight.
As
an
improvement
of
gain
relative
to
weight
brings
the
best
financial
return
after
fattening,
the
problems
of
the
genetic
bending
of
the
growth
curve
and
of
the
choice
of
the
best
selection
criteria
are
discussed.
Key
words :
Growth,
feed
conversion
ratio,
carcass
composition,
genetic
parameters,
selection,
double-muscled
cattle.
(1)
This
work
is
supported
by
the
« Institut
pour
1’encouragement
de
la
Recherche
scientifique
dans
l’Industrie
et
l’Agricu1ture
(I.R.S.I.A.).
Résumé
Relations
entre
la
vitesse
de
croissance,
la
composition
de
carcasse,
la
consommation
alimentaire,
l’indice
de
consommation
et
le
revenu
dans
quatre
types
biologiques
bovins
Les
relations
entre
la
vitesse
de
croissance,
la
composition
de
carcasse,
la
consommation
alimentaire,
l’indice
de
consommation
et
le
revenu
ont
été
analysées
chez
des
taureaux
entrés
en
station
à
l’âge
d’un
mois
et
contrôlés
entre
7
et
12
mois.
Ces
taureaux
appartiennent
à
4
types
biologiques :
1)
Blanc-Bleu
Belge
du
type
culard
(DM)
(n
=
622) ;
2)
croisés
de
pères
DM
et
de
mères
Frisonnes
(DM
x
FR)
(n
=
94) ;
3)
croisés
de
pères
DM
et
de
mères
MRY
(DM
x
MRY)
(n
=
20) ;
4)
Blanc-Bleu
Belge
du
type
mixte
(CONV)
(n
=
236).
Pour
les
caractères
biologiques
et
économiques
envisagés,
le
type
culard
se
distingue
nette-
ment
des
3
autres
types.
Comparés
aux
animaux
du
type
mixte,
les
animaux
du
type
culard
ont
une
consommation
alimentaire
moindre
(-
6,5
p.
100),
un
indice
de
consommation
plus
faible
(-
8,7
p.
100),
un
rendement
à
l’abattage
supérieur
(+
8
p.
100),
un
pourcentage
plus
élevé
de
muscle
dans
le
7&dquo;
morceau
monocostal
(+
20
p.
100),
un
pourcentage
plus
faible
de
graisse
(-
42
p.
100).
Pour
l’année
1980,
le
prix
de
vente
(au
kilo
de
poids
vif)
de
l’animal
culard
dépassait
de
57
p.
100
celui
de
l’animal
mixte
et
le
revenu
net
correspondant
à
la
période
de
contrôle
(7
à
12
mois)
était
multiplié
par
le
facteur
3,25.
Les
coefficients
de
détermination
(R
Z)
de
la
consommation
alimentaire
et
de
l’indice
de
consommation
par
le
poids
initial,
le
gain
de
poids
quotidien
et
les
critères
de
composition
de
carcasse
ont
été
calculés,
séparément
pour
chaque
type
biologique.
Intra
type,
les
caractères
de
carcasse
se
sont
révélés
d’importance
mineure
dans
la
détermination
de
la
consommation
alimen-
taire
et
de
l’indice
de
consommation.
Une
analyse
de
covariance
a
montré
que
les
consommations
alimentaires
moyennes,
ajustées
pour
le
poids
initial
et
le
gain
de
poids
quotidien,
étaient
significativement
différentes,
entre
types
biologiques,
ce
qui
suggère
des
besoins
d’entretien
différents
entre
types
biologiques
et
en
particulier
des
besoins
d’entretien
plus
faibles
chez
le
taureau
culard.
La
détermination
du
prix
de
vente
et
du
revenu
net
par
les
caractères
de
croissance
et
carcasse
a
été
étudiée.
Les
paramètres
génétiques,
héritabilités
et
corrélations
génétiques,
ont
été
estimés
à
l’intérieur
du
type
culard.
Ces
paramètres
furent
utilisés
pour
calculer
les
réponses
génétiques
attendues
en
cas
de
sélection
sur :
le
gain
de
poids
journalier,
le
rapport
gain/poids
initial,
le
poids
final,
l’indice
de
consommation,
le
revenu
net,
des
indices
de
sélection
utilisant
comme
caractères
mesurés
soit
le
gain
journalier
et
la
consommation
alimentaire
(index
I)
soit
le
gain
journalier
et
le
poids
initial
(index
II).
Tous
ces
critères
de
sélection,
à
l’exception
du
poids
final,
ont
donné
comme
réponses
directes
ou
indirectes,
un
revenu
net
plus
élevé,
un
poids
initial
plus
faible,
un
poids
final
pas
ou
peu
modifié.
Comme
une
amélioration
du
gain
par
rapport
au
poids
procurait
le
meilleur
revenu,
la
possibilité
d’une
modification
génétique
de
la
courbe
de
croissance
est
discutée
ainsi
d’ailleurs
que
la
question
du
choix
des
meilleurs
critères
de
sélection.
Mots
clés :
Croissance,
indice
de
consommation,
composition
de
carcasse,
paramètres
généti-
ques,
sélection,
bovins
culards.
I.
Introduction
In
addition
to
viability
and
morbidity,
growth
rate,
carcass
composition
and
food
consumption
are
factors
determining
profitability
in
beef
production.
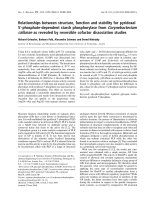
The
way
these
factors
contribute
to
the
Net
Added
Value
after
fattening
is
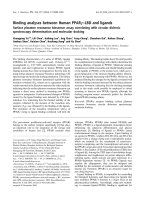
illustrated
in
figure
1.
The
Added
Value
is
obtained
by
multiplying
the
weight
gain
by
the
selling
price
per
kilo
liveweight,
the
latter
being
determined
to
some
extent
by
the
body
composi-
tion.
The
selling
price
is
also
influenced
by
the
final
weight.
In
our
conditions,
the
market
penalizes
underweight
animals.
Feed
intake
reflects
the
maintenance
require-
ments
(metabolic
weight)
and
the
needs
for
liveweight
gain
including
variations
of
composition.
The
Net
Added
Value
is
given
by
the
Added
Value
from
which
the
food
costs
have
been
subtracted.
In
so
doing,
it
is
assumed
that
the
price
is
the
same
at
the
beginning
as
at
the
end
of
the
fattening
period.
Feed
conversion
ratio
expressed
by
the
ratio
of
food
consumption
to
gain
measures
«
gross
efficiency
» since
it
includes
both
a
maintenance
and
a
growth
component.
The
purpose
of
this
paper
is
to
study
the
interrelationships
between
growth
rate,
carcass
composition,
feed
intake
and
feed
efficiency
«
among
» and
«
within
» four
biological
types
characterized
by
different
carcass
compositions
and
different
ingestion
capacities
and
to
discuss
the
problem
of
the
choice
of
the
best
selection
criterion.
.
n.
Material
and
methods
The
material
(progeny-test
data)
consists
of
972
bulls
belonging
to
four
biological
types :
1)
Belgian
Blue
bulls
of
the
double-muscled
type
(DM)
(n
=
622) ; 2)
crossbred
sons
of
DM
sires
out
of
Friesian
dams
(DM
x
FR)
(n
=
94) ;
3)
similar
sons
but
out
of
MRY
(Meuse-Rhin-Yssel)
dams
(DM
x
MRY)
(n
=
20) ;
4)
Belgian
Blue
bulls
of
the
conventional
type
(CONV)
(n
=
236).
Their
distribution
across
years
is
shown
in
table
1.
Animals
enter
the
Test
Station
at
the
age
of
one
month
(during
the
months
March,
April,
May).’
After
a
stay
of
2
months
in
nursery,
the
animals
were
fed
ad
libitum
with
a
first
concentrate
and
straw.
From
the
age
of
5
months
to
the
end
of
the
testing
period,
they
received
a
second
concentrate
ad
libitum
and had
free
access
to
straw
from
a
rack.
The
composition
of
this
second
concentrate
was
as
follows :
cotton
seed
cake :
5
p.
100 ;
linseed
cake :
5
p.
100 ;
coconut
cake :
5
p.
100 ;
soya
been
meal
(extr.) :
6
p.
100 ;
sugar
beet
pulp,
dried :
40
p.
100 ;
molasses :
4.5
p.
100 ;
barley
flake :
15
p.
100 ;
wheat
(fine
middlings-bran) :
10
p.
100 ;
rice
meal :
5
p.
100 ;
minerals
and
vitamins :
4.5
p.
100 ;
digestible
crude
proteins :
14
p.
100.
The
dry
matter
content
was
88
p.
100
and
the
energy
content
of
1
kg
dry
matter
was
2.8
M.Cal.
ME,
as
estimated
from
the
ARC
tables.
The
bulls,
allotted
in
groups
of
five
according
to
age,
were
kept
in
loose-housing
on
straw
bedding.
The
individual
feeding
of
the
concentrate
was
achieved
by
an
electronically
activated
locking
mechanism
of
the
access
door.
The
ingestion
of
straw
was
not
recorded.
The
testing
period
started
at
7
months
and
ended
at
12
months,
the
age
of
slaughter.
The
standard
deviation
of
initial
and
final
ages
was
about
5
days.
The
data
were
adjusted
to
the
ages
of
210
and
365
days.
There
was
no
fasting
period
prior
to
slaughter.
All the
animals
were
slaughtered
in
the
same
slaughter-house ;
they
left
the
Station
on
Tuesday
(last
weighing),
were
slaughtered
on
Wednesday
morning,
the
carcasses
weighted
on
Thursday.
The
dressing-out
percentage
was
computed
as
the
ratio
of
carcass
weight
(cold)
to
final
weight
at
the
Station
(average
of 2
weighings).
The
7&dquo;’
ribcut
was
taken
and
divided
into
lean,
fat
and
bone.
Feed
conversion
ratio
was
expressed
as
the
ratio
of
feed
intake
on
gain.
The
selling
price
per
kilo
liveweight
was
determined
by
the
same
person
throughout
the
entire
period
taking
into
account
the
weight,
the
conformation,
the
degree
of
finishing
and
the
market
trends.
Net
Added
Value
or
more
simply
Net
Income
for
the
period
7
to
12
months
was
computed
as
follows
separately
for
each
year :
gain
x
selling
price —
food
consumption
x
food
price.
The
means
corresponding
to
the
4
biological
types
were
computed
across
years
and
sires,
and
compared
by
the
Duncan’s
multiple
range
test
(D
UNCAN
,
1955).
The
amounts
of
variation
in
feed
intake,
feed
conversion
ratio,
selling
price
and
net
income
accounted
for
by
growth
carcass
criteria
were
measured
by
the
coefficients
of
determination
(R
2)
computed
from
the
adjustments
of
simple
and
multiple
regression
equations.
A
comparison
of
the
4
biological
types
for
feed
intake
was
made
by
covariance
analysis,
initial
weight
and
daily
gain
being
the
covariates.
In
this
kind
of
analysis,
3
tests
are
carried
out :
a
test
of
equality
of
slopes,
a
test
of
zero
slope
and
a
test
of
equality
of
adjusted
means
(S
NEDECOR
&
C
OCHRAN
,
1980).
Genetic
parameters
were
estimated
within
the
double-muscled
type
on
505
animals
born
from 52
sires
of
the
double-muscled
type.
In
this
analysis,
sires
were
nested
within
years
(years
1981
to
1984)
and
the
components
of
variance
and
covariance,
«
between
sires
within
years
» were
estimated.
The
Least-Squares
and
Maximum
Likelihood
Computer
Program
(LSML76)
was
used
for
this
analysis
(H
ARVEY
,
1977).
III.
Results
A.
Biological
traits
The
means
across
years
of
the
different
characteristics
are
given
in
table
2
for
each
biological
type.
Significant
differences
between
biological
types
are
found
for :
weight
at
7
months
(initial
weight),
daily
feed
consumption,
feed
conversion
ratio,
dressing-out
percentage,
composition
of
the
T&dquo;
ribcut.
In
comparison
with
the
conventional
animals,
the
double-
muscled
ones
have
their
feed
intake
reduced
by
6.5
p.
100
their
feed
conversion
ratio
decreased
by
8.7
p.
100
their
dressing-out
percentage
increased
by
8
p.
100,
their
percent
lean
in
the
7,h
ribcut
increased
by
20
p.
100,
their
percent
fat
decreased
by
40
p.
100.
Feed
consumption
is
highest
in
the
crossbreds
but
these
were
not
tested
at
the
same
time
as
the
other
types.
The
biological
types,
other
than
the
double-muscled
type,
are
similar
for
initial
weight
and
feed
conversion
ratio.
Between
the
crossbreds,
those
from
MRY
cows
had
better
dressing-out
percentage,
lean
and
fat
contents.
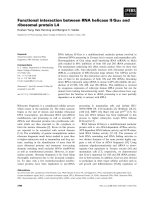
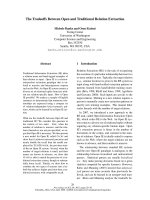
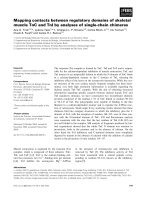
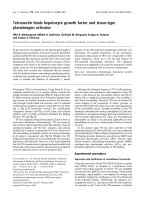
The
relative
locations
of
the
4 biological
types
regarding
feed
intake
or
feed
conversion
ratio
and
body
composition
are
illustrated
in
figure
2
(dressing-out
percen-
tage)
and
in
figure
3
(percent
lean
in
the
7°&dquo;
ribcut).
Unweighted
regression
lines
have
been
drawn
across
the
points.
Their
slopes
are :
1)
regression
on
dressing-out
percentage
(DO) :
feed
intake
= -
0.1937
kg/p.
100
DO ;
feed
conversion
= —
0.1459 kg/p.
100 DO ;
2)
regression
on
percent
lean :
feed
inta-
ke
= -
0.0758
kg/p.
100
lean ;
feed
conversion
= -
0.0598
kg/p.
100
lean).
The
coefficients
of
determination
(R
I)
of
feed
intake
and
of feed conversion
ratio
by
initial
weight,
daily gain,
dressing-out
percentage
and
percent
lean
in
the
T&dquo;
ribcut,
considered
alone
or
in
different
combinations,
are
given
in
table
3
(feed
intake)
and
table
4
(feed
conversion).
Within each
of
the
4
biological
types,
feed
intake
during
the
test
period
is
strongly
influenced
by
initial
weight.
The
same
is
true
for
daily
gain
although
it
is
not
significant
within the
DM
x
MRY
type.
On
the
contrary,
the
criteria
of
body
composition,
as
dressing-out
percentage
and
percent
lean,
have
a
small
influence,
if
any,
on
feed
intake.
The
coefficient
of
determination
is
substantially
increased
if
initial
weight
and
daily
gain
are
included
together
in
the
regression
equation.
On
the
other
hand,
the
addition
of
a
criterion
of
body
composition
brought
no
further
increase
of
the
coefficient
of
determination.
If
one
considers
table
4,
the
same
picture
emerges.
The
feed
conversion
ratio
was
also
significantly
influenced
by
initial
weight
(positively)
and
by
daily
gain
(negatively).
Nevertheless,
daily
gain
was
more
closely
related
to
feed
conversion
ratio
than
initial
weight
and
this
is
true
for
each
biological
type.
Once
again,
within
biological
type,
the
criteria
of
body
composition
were
of
minor
importance.
comparison,
among
biological
types,
of
mean
feed
intake
adjusted
for
initial
weight
and
daily
gain
was
carried
out
(table
5).
The
test
of
equality
of
slopes
was
not
significant ;
the
test
of
zero
slope
and
the
test
of
equality
of
adjusted
means
were
highly
significant.
The
regression
coefficients
and
their
standard
errors
are
also
given
in
table
5.
Mean
feed
intake
at
zero
gain
could
be
computed
for
each
biological
type.
These
values
were
arrived
at
through
the
subtraction,
from
the
adjusted
means,
of
the
product
of
the
partial
regression
coefficient
of
feed
intake
on
daily
gain
by
the
mean
gain.
These
means
are
given
table
5,
(2°°
column)
and
the
corresponding
maintenance
needs
(3
d
column)
in
kcal
ME
per
kg
metabolic
weight
(midweighf
l.
75
=
376°!’S,
the
concentrate
having
a
dry
matter
content
of
88
%
and
the
energy
content
of
1
kg
dry
matter
being
2 800
kcal
ME).
These
estimates
of
maintenance
requirements
are
very
rough
and
larger
than
those
reported
from
nutrition
experiments
(see
F
ERRELL
&
J
ENKINS
,
1985
for
a
review
of
these
estimates).
Nevertheless,
this
analysis
strongly
suggests
that
differences
exist
among
biological
types
regarding
their
maintenance
needs
and
in
particular
between
double-muscled
and
conventional
bulls,
both
types
having
been
tested
in
the
same
years.
On
the
other
hand,
there
were no
difference
among
biological
types
regarding
the
growth
require-
ment.
B.
Economic
traits
The
yearly
variations
of
the
selling
price
per
kilo
liveweight
and
of
the
net
income
are
given,
separately
for
each
biological
type,
in
table
6.
Once
more,
the
differences
between
the
double-muscled
type,
on
the
one
hand,
and
the
other
types
on
the
other
hand,
are
quite
striking.
For
the
year
1980,
the
selling
price
of
the
double-muscled
exceeded
that
of
the
conventional
by
57
p.
100
while,
at
the
same
time,
the
net
income
was
3.25
times
higher.
The
relations
between
the
selling
price
and
objective
measurements
were
investi-
gated
within
years.
The
results
of
this
analysis
are
presented
in
table
7.
The
traits
considered
were :
final
weight,
dressing-out
percentage,
percent
lean
in
the
T&dquo;
ribcut.
Final
weight
and
dressing-out
percentage
explained
a
significant
part
of
the
variation
of
the
selling
price.
When
all
3
traits
were
considered,
25
p.
100
of
the
variation
of
the
selling
price
is
accounted
for
in
the
double-muscled
animals,
40
p.
100
in
the
conven-
tional
(CONV)
and
the
DM
x
FR
crossbred
animals.
The
contribution
made
to
the
variation
of
net
income
by
the
following
traits :
initial
weight,
daily
gain,
feed
intake,
feed
conversion
and
selling
price
have
been
estimated,
within
years
for
the
4
biological
types
(table
8).
As
single
traits,
daily
gain
and
feed
conversion
ratio
are
most
closely
related
to
net
income.
They
are
followed
by
selling
price.
High
coefficients
of
determination
are
obtained
when
2
or
3
traits
are
included
in
the
multiple
regression
equations,
even
if
feed
intake
and
feed
conversion
are
not
known
(DG
+
SP
and
IW
+
DG
+
SP).
Due
to
the
way
net
income
was
computed,
complete
determination
was
as
expected
achieved
when
feed
intake,
daily
gain
and
selling
price
were
considered
together.
C.
Genetic
parameters
In
this
experiment,
feed
intake
per
unit
gain
is
evaluated
over
a
time-constant
interval
and
it
seemed
reasonable
to
adjust
the
data
for
differences
in
maintenance
requirements.
Three
variables
were
therefore
derived :
1)
the
ratio
of
weight
gain
(final
weight
minus
initial
weight) :
lighter-than-average
bulls
are
adjusted
upwards
and
heavier-than-average
bulls
downwards,
this
ratio
could
be
used
as
an
indirect
measure
of
feed
conversion
when
feed
intake
is
not
recorded ;
2)
the
adjusted
feed
consumption :
feed
intake
is
adjusted
for
daily
gain
and
midweight
on
the
basis
of
the
following
regression
equation
drawn
from
our
data
(double-muscled
animals) :
food
consumption
=
0.82
+
1.46
(daily
gain)
+
0.013
(mid-
weight).
It
has
been
suggested
that
this
criterion
could
be
a
measure
of
«
intrinsic
»
feed
efficiency
(KocH
et
al.,
1963)
but
this
correction
does
not
take
into
account
the
effect
of
the
composition
of
gain
on
the
efficiency
(D
ICKERSON
,
1982) ;
3)
the
adjusted
feed
conversion
ratio :
the
feed
conversion
ratio
is
multiplied
by
the
ratio
of
test
group
average
metabolic
midweight
to
the
individual’s
own
metabolic
midweight
(W
0
7S)
(B.I.F.,
1981 ;
Dnms
et
al.,
1985) ;
heavier-than-average
bulls
are
adjusted
downwards
and
lighter-than-average
bulls
upwards.
Genetic
parameters
(heritabilities
and
genetic
correlations)
were
estimated
«
within
the
double-muscled
type
».
The
estimates
and
their
standard
errors
and
the
« within
years
»
standard
deviation
of
each
trait
are
given
in
table
9.
Daily
gain,
ratio
of
gain
to
initial
weight,
feed
conversion,
net
income,
dressing-out
percentage
and
percent
lean
had
a
coefficient
of
heritability
of
about
0.4
or
greater.
The
estimate
of
heritability
of
final
weight
was
0.2 :
this
is
lower
than
most
estimates
(but
not
all)
that
have
been
reported
for
this
trait
(P
RESTON
&
W
ILLIS
,
1974,
p.
105-119).
Vntis-Oxnz
et
al.
(1972)
found
distinctly
lower
heritabilities
for
double-muscled
sires
as
compared
to
normal
sires,
the
traits
considered
being
60
day
weight
and
beef
type
score.
This
observation
should
not
be
generalized
since,
in
our
data,
daily
gain,
for
instance,
had
an
heritability
of
0.44,
quite
similar
to
0.41,
the
average
of
354
literature
estimates,
computed
by
S
IMM
et
al.
(1986).
The
adjusted
variables
had
a
reduced
heritability
compared
with
their
unadjusted
forms.
By
the
adjustment
of
food
consumption,
the
genetic
standard
deviation
drops
from
0.44
kg
to
0.25
kg
thus
leaving
little
scope
for
selection.
The
genetic
correlations
had
in
general
a
high
standard
error.
In
the
interpretation
of
the
coefficients
of
correlation,
one
has
to
bear
in
mind
that
often
a
portion
of
the
relationship
is
automatic
(a
part
and
its
whole ;
a
variable
and
a
ratio
with
the
same
variable
as
numerator
or
denominator).
Initial
weight
was
highly
correlated
with
final
weight,
ratio
of
gain
to
initial
weight
(automatic),
food
intake
in
the
subsequent
period,
feed
conversion.
The
effect
of
initial
weight
was
much
greater
on
feed
intake
and
feed
conversion
than
on
gain.
All
other
things
being
equal,
a
higher
initial
weight
means
higher
maintenance
costs
through
the
whole
fattening
period.
The
correlation
between
initial
weight
and
gain
was
slight
(phenotypic)
and
even
negative
(genetic)
but
the
environmental
correlation
was
positive
(+
0.380).
This
observation
was
confirmed
on
independent
and
unpublished
data
col-
lected
in
the
same
Testing
Station,
the
phenotypic,
genetic
and
environmental
correla-
tions
being respectively :
+
0.139, -
0.091
(s.e.
=
0.349) and
+
0.188 (number
of offspring :
822 ;
number
of
sires :
56).
Final
weight
was
correlated
with
gain,
adjusted
feed
intake,
net
income,
and
there
was
a
slight
tendency
for
the
heavier
individuals
to
have
a
higher
dressing-out
percen-
tage
and
to
be
fatter.
Final
weight
was
not
correlated
with
adjusted
food
consumption
and
feed
conver-
sion.
Final
weight
consist
of
2
components :
initial
weight
and
gain
which
had
opposite
effects
on
feed
conversion.
Daily
gain
was
highly
correlated
with
net income
and,
as
expected,
more
closely
related
to
adjusted
feed
conversion
than
to
unadjusted
feed
conversion.
The
ratio
of
gain
to
initial
weight
was
highly
correlated
with
feed
conversion
(phenotypic
and
genetic),
and
with
net
income
(genetic).
Adjusted
feed
consumption
was
more
highly
correlated
with
feed
conversion
than
unadjusted
feed
consumption.
Feed
conversion
was
highly
correlated
with
adjusted
feed
conversion
and
net
income
and
there
was
a
tendency
for
the leaner
individual
to
be
more
efficient.
Adjusted
feed
conversion
was
closely
related
to
net
income.
Net
income
was
phenotypically
correlated
with
(in
decreasing
order
of
import-
ance) :
daily
gain
(0.85),
adjusted
feed
conversion
(-
0.83),
feed
conversion
(-
0.73),
ratio
of
gain
to
initial
weight
(0.63),
final
weight
(.45),
percent
lean
(0.165)
and
dressing-out
percentage
(0.16).
Discussion
Regarding
feed
conversion
ratio
and
carcass
composition,
the
double-muscled
type
is
quite
distinct
from
the
other
types.
It
was
already
the
case
when
the
same
biological
types
were
characterized
by
the
blood
levels
of
creatine
and
creatinine
(H
ANSET
&
MIC
HAUX
,
1986).
Feed
efficiency
is
favourably
influenced
by :
1)
a
higher
energy
digestibility/metabolisability ;
2)
a
high
daily
gain
relative
to
mean
weight ;
3)
a
leaner
gain ;
4)
a
lower
maintenance
requirement
per
kg
metabolic
weight ;
5)
a
lower
requirement
in
metabolizable
energy
per
g
of
lipids
or
proteins
laid
down.
The
higher
feed
efficiency
of
the
double-muscled
animal,
which
is
a
well-estab-
lished
fact,
could
be
due
either
to
its
body
gain
composition
or
to
lower
maintenance
requirements
or
to
both
(H
ANSET
et
al.,
1979).
G
EAY
et
al.
(1982)
have
also
considered
the
possibility
of
lower
maintenance
requirements
in
double-muscled
animals.
The
reasons
put
forward
by
these
authors
are :
1)
lower
activity ;
2)
slower
protein
tur-
nover
due
to
a
less
developed
digestive
tract
and
to
a
higher
proportion
of
white
fibers.
The
present
data
indicate
that
the
double-muscled
bull
has
a
lower
maintenance
requirement.
Nevertheless,
the
general
concept
is
that
ME
requirement
for
maintenance
tends
to
be
lower
per
unit
metabolic
weight
in
fat
animals
than
in
lean
animals
(D
ICKERSON
,
198$ ;
W
EBSTER
,
1985).
However,
data
reviewed
by
F
ERRELL
&
J
ENKINS
(1985)
shed
doubt
on
the
relationships :
1)
between
body
composition
per
se
and
maintenance
energy
expenditures ;
2)
between
composition
of
gain
and
energetic
effi-
ciency.
On
the
contrary,
metabolism
of
visceral
organs
constitutes
a
major
proportion
of
total
animal
energy
expenditures.
Variation
in
energy
expenditures
among
breeds,
among
individuals
within
breeds,
could
be
attributable
to
variation
in
metabolism
of
visceral
organs.
V
ERMOREL
et
al.
(1976)
found
that
minimum
heat
production
(fasting
metabolism)
was
12
p.
100
lower
in
Charolais
than
in
Friesian
bulls.
For
W
EBSTER
(1985),
this
result
«
suggests
that
the
Charolais
does
share
to
a
degree
with
the
Hereford
the
useful
beefy
trait
of
a
low
metabolic
heat
production
».
Increased
muscle
relative
to
visceral
development
would
reduce
metabolic
heat
loss
from
non
fat
tissue
activity
(D
ICKERSON
,
1985).
Lower
maintenance
requirement
not
associated
with
reduced
growth
potential,
or
adult
size
or
milking
potential
is
also
expected
in
the
adult
double-muscled
animal
but
until
now,
no
data
were
available.
Now,
maintenance
requirement
is
a
major
propor-
tion
of
total
feed
cost
in
animal
production
(D
ICKERSON
,
1982,
1985)
and
a
decrease
in
the
maintenance
cost
of
the
mature
animal
is
considered
by
T
HOMPSON
&
B
ARLOW
(1986)
as
a
promising
avenue
for
increasing
biological
efficiency
of
the
total
production
system.
An
increase
in
lean
content
is
associated
not
only
with
higher
feed
conversion
but
also
with
a
higher
market
value of
the
young
and
of
the
cull
cow
(D
ICKERSON
,
1982).
This
is
particularly
true
in
the
Belgian
Blue
breed
where
an
improvement
of
the
lean
content
of
the
whole
carcass
from
65
p.
100
to
78
p.
100
(M
ICHAUX
et
al. ,
1983)
has
been
achieved
not
gradually
as
in
the
case
of
polygenic
inheritance
but
rather
quickly
thanks
to
the
fixation
of
the
partially
recessive
gene
for
muscle
hypertrophy
(H
ANSET
,
1982 ;
H
ANSET
&
M
ICHAUX
,
1985a,
1985b).
The
better
selling
price
per
kg
liveweight
due
to
muscle
hypertrophy
(+ 40
BF)
was
the
main
incentive
for
this
selection
and
the
better
feed
conversion
(—
0.52
kg)
should
be
considered
as
a
bonus.
Of
the
difference
in
net
income
between
double-muscled
and
conventional
or
crossbreed
which
amounts
to
57.876
BF
(daily
gain :
1.3
kg ;
feed
cost :
11.3
BF/kg),
only
5.876
BF
or
10
p.
100
is
due
to
the
better
feed
conversion.
Within
the
double-muscled
type,
the
prospects
of
genetic
improvement
in
feed
efficiency
through
higher
daily
gain
relative
to
weight
look
better
than
through
other
means
such
as
composition
or
above-maintenance
feed
energy
cost
of
protein
and
fat
deposition.
On
the
basis
of
the
estimates
of
the
genetic
parameters
presented
in
table
9,
it
was
possible
to
evaluate
the
consequences
of
selections
on :
1)
daily
gain ;
2)
ratio
of
gain
to
initial
weight ;
3)
feed
conversion ;
4)
adjusted
feed
conversion ;
5)
net
income
as
defined
above ;
6)
final
weight ;
7)
index
I
where
the
traits
included
in
the
aggregate
genotype
and
in
the
index
were :
daily
gain
and
food
intake
and
the
economic
weights
used
were :
130
(value
of
one
kg
liveweight)
and -
11.3
(cost
of
one
kg
concentrate)
respectively ;
the
coefficients
of
the
index
were :
60.23
and —
4.8,
R
=
0.68 ;
8)
index
II
where
the
aggregate
genotype
was
the
same
as
in
7)
above
but
the
traits
included
in
the
index
(the
measured
traits)
were :
daily
gain
and
initial
weight ;
the
coefficients
of
the
index
were :
50.46
and -
0.138
with
R
H[
=
0.74.
The
expected
genetic
superiority
in
the
selected
trait
and
the
expected
correlated
response
in
the
other
traits
are
given
in
table
10
for
a
selection
differential
equal
to
i
=
+
1
for
all
traits
considered
except
for
feed
efficiency
(i
= —
1).
These
results
should
be
interpreted
cautiously
because
of
large
standard
errors
of
estimates.
Daily
gain
was
improved
in
all
instances,
but
least
in
the
case
of
selection
on
final
weight.
Feed
conversion
was
bettered
in
all
cases
except
when
final
weight
was
the
selection
criterion.
With
the
exception
of
final
weight
as
selection
criterion,
all
the
other
criteria
gave
a
similar
picture :
daily
gain,
feed
conversion
ratio
and
net
income
were
improved,
initial
weight
was
lowered.
Final
weight
was
increased
the
most
when
selecting
on
daily
gain
or
on
final
weight ;
it
was
even
slightly
reduced
when
selecting
on
feed
conversion.
Feed
intake
increased
the
most
when
selecting
on
daily
gain
or
on
final
weight.
A
higher
efficiency
and
a
greater
income
were
associated
with
lower
maintenance
require-
ments.
It
would
seem
that
net
income
can
be
substantially
improved
in
the
absence
of
food
intake
recording.
In
most
cases
reported
in
the
literature,
genetic
improvement
in
feed
conversion
has
been
obtained
as
a
correlated
response
to
selection
for
increased
liveweight
gain
rather
than
by
direct
selection.
Nevertheless,
considering
that
« for
all
practical
pur-
poses,
feed
conversion
can
be
considered
the
most
important
parameter
in
any
feedlot
operation
»,
P
RESTON
&
W
ILLIS
(1974,
pp.
441-444)
advocate
a
selection
of
sires
on
feed
conversion
ratio
after
a
performance
test
starting
at
some
90
days
of
age
and
ending
at
a
fixed
weight.
Selection
on
feed
conversion
is
not
as
closely
associated
with
large
size
as
is
selection
on
daily
gain
or
on
final
weight.
Although
feed
conversion
is
a
combination
of
the
2
traits :
gain
and
food
consumption,
selection
for
feed
conversion
does
not
give
the
highest
return
because
its
2
component
characters
are
not
properly
weighted
as
they
appear
to
be
in
the
case
of
«
net
income
».
In
the
case
of
index
I,
the
weight
are
correct
provided
we
have
prior
knowledge
of
the
genetic
parameters.
The
ratio
of
weight
gain
to
initial
weight
appeared
to
be
a
good
selection
criterion
to
increase
net
income
thanks
to
its
high
genetic
correlation
with
the
latter.
The
same
was
the
case
for
index
II
which
is
made
up
of
the
2
traits
gain
and
initial
weight
but
for
its
construction
genetic
parameters
need
to
be
known.
Nevertheless,
food
intake
recording
offers
the
possibility
of
exploiting
any
genetic
difference
regarding
«
intrin-
sic
»
food
conversion
independent
of
body
composition.
Another
way
of
considering
the
consequences
of
selection
is
to
compare
the
performance
characteristics
of
the
four
best
and
the
four
worst
bulls
for
each
selection
criterion.
These
comparisons
have
been
made
on
the
same
material
as
above
and
the
results
are
presented
in
table 11.
These
figures
have
the
meaning
of
phenotypic
superiorities.
Next
to
direct
selection
on
net
income,
selection
for
daily
gain
and
adjusted
feed
conversion
gave
the
best
return.
The
ratio
of
gain
to
initial
weight
gave
the
lowest
return
because
very
light
bulls
were
selected,
with,
and
as
a
consequence,
a
low
selling
price.
The
best
bulls
had
a
lower
initial
weight
if
identified
by
net
income,
ratio
of
gain
to
initial
weight
or
feed
conversion.
D
AVI
s
et
al.
(1985)
also
found
that
the
bulls
with
the
lowest
ratio
of
feed
to
gain
were
lighter
at
the
start
of
the
postweaning
-
perform-
ance
test.
The
difference
for
final
weight
was
larger
if
the
bulls
were
identified
by
their
adjusted
feed
conversion
rather
than
by
their
unadjusted
feed
conversion
as
also
shown
by
Dnms
et
al.
(1985).
final
weight
of
the
best
bulls
was
lowest
if
selection
was
based
on
the
ratio
of
gain
to
initial
weight
or
on
unadjusted
feed
conversion
ratio.
The
bulls
selected
for
the
best
net
income
were
lighter
in
final
weight
than
those
selected
on
daily
gain
or
on
adjusted
feed
conversion.
The
results
of
table
11
are
similar
to
those
of
table
10
except
for
the
ratio
of
gain
to
initial
weight
which
became
a
poor
selection
criterion.
In
the
variation
of
net
income
this
ratio
accounts
for
37.65
p.
100
while
daily
gain
accounts
for
71.37
p.
100
as
shown
in
table
8.
Feed
conversion
is
known
to
differ
depending
on
whether
measurement
is
over
a
«
constant
age
»
interval,
a
«
weight
constant
»
interval
or a
«
fixed
age -
fixed
weight
»
interval
as
discussed
by
SMITH
et
al.
(1976),
C
UNDIFF
et
al.
(1981),
KocH
et
al.
(1982b),
P
YM
(1982),
R
OBERTSON
(1982).
In
pig
breeding,
feed
conversion
is
generally
evaluated
over
«
weight
constant
»
intervals.
In
cattle,
the
3
systems
are
used.
Over
time-constant
intervals,
faster
growing
animals
are
either
penalized
or
the
opposite
depending
on
the
weight
they
maintain.
For
this
reason
it
has
been
recommended
that
the
feed
conver-
sion
ratio
is
adjusted
for
differences
in
maintenance
requirements
if
bulls
are
to
be
evaluated
for
efficiency
of
gain
(BIF
,
1981).
A
high
growth
rate
during
the
testing
period
will
usually
mean
a
high
growth
rate
also
at
later
stages
in
animals
retained
for
breeding.
The
result
will
be
in
some
increase
of
adult
size
with
the
following
consequences :
a
higher
value of
the
cull
cow
but
higher
maintenance
requirements
unless
a
«
bending
» of
the
growth
curve
can
be
achieved
as
discussed
by
F
ITZHUGH
(1976),
R
OBERTSON
(1982),
G
ROSSMAN
&
B
OHREN
(1985),
T
HOM
p-
SON
&
BA
RLOW
(1986).
Until
now,
environmental
manipulations
have
been
more
successful
than
genetic
selection
in
altering
the
shape
of
the
growth
curve
either
by
restricted
feeding
during
early
stages
of
growth
followed
by
compensatory
growth
on
a
high
energy
diet
or
through
the
administration
of
growth
promoting
agents
near
the
end
of
the
finishing
period
providing,
in
each
case,
a
high
daily
gain
relative
to
mean
weight.
A
genetic
bending
of
the
growth
curve
will
be
possible
if
genetic
correlations
for
growth
at
different
ages
permit.
Repeatability
of
gain
in
successive
periods
may
be
low
or
even
negative
as
periodic
gains
tend
to
be
cyclic
and
compensatorial
(C
ARTWRIGHT
&
DAYHOFF,
1959 ;
PRESTON
&
WILLIS,
1974).
Both
linear
and
quadratic
partial
regression
coefficients
for
on-test
ADG
on
initial
weight
were
found
to
be
significant
by
TONG
(1982)
and
by
BROWN
et
al.
(1986).
The
positive
regression
of
on-test
ADG
on
initial
weight
for
a
given
age
is
considered
by
TONG
(1982)
as
«
a consequence
of
high
genetic
correlations
for
growth
at
different
ages
».
Nevertheless,
the
phenotypic
correlations
between
pretest
daily
gain
and
on-test
daily
gain
were
low,
ranging
from
0.02
to -
0.15
(TONG,
1982).
S
WIGER
(1961)
estimated
the
genetic
parameters
of
gain
in
each
five
28-day
periods
after
weaning.
Heritability
was
highest
for
the
second
period
(0.28)
and
decreased
for
successive
periods,
being
equal
to
0.04
for
the
fifth
period
gain.
The
phenotypic
correlations
between
periodic
gains
were
low
(from —
0.01
to
0.19)
but
the
genetic
correlations
were
large
(from
0.19
to
0.88)
and
tended
to
be
higher
between
gains
made
in
adjacent
time
periods.
This
suggests
that
most
of
the
genes
influencing
growth
in
different
periods
are
the
same.
The
environmental
correlations
between
adjacent
periods
were
negative
as
were
the
environmental
correlations
between
weaning
weight
and
early
post-weaning
gains.
Errors
in
weighing,
differences
in
fill
at
the
end
of
different
periods
and
compensatory
growth
are
the
reasons
put
forward
by
the
author
to
explain
the
negative
sign
of
these
correlations.
In
the
Simmental
breed,
a
genetic
correlation
of —
0.54
was
found
by
AvExnurrx
(1968)
between
weight
at
1
year
and
gain
from
1 year
until
500 days.
This
result
suggests
that
selection
on
365-days-weight
would
favour
early
maturing
bulls
with
lower
subsequent
growth
while
selection
on
500-day-weight
would
favour
slow
maturing
bulls
with
a
higher
growth
capacity.
KocH et
al.
(1982a)
estimated
phenotypic,
environmental
and
genetic
correlations
for
non
overlapping
56
days
intervals.
They
found
an
average
phenotypic
correlation
of
+
0.16,
an
average
environmental
correlation
of —
0.03
and
an
average
genetic
correlation
of
+
0.77.
The
genetic
correlations
were
highest
between
adjacent
intervals
and
tended
to
decline
for
more
distant
gain
intervals
(e.g.
from
0.81
to
0.51
when
the
distance
increases
from
0
to
112
days).
As
selection
criterion,
growth
rate
is
sometimes
opposed
to
weight
for
a
given
age.
Arguments
in
favour
of
growth
rate
are :
1)
the
record
is
made
during
the
test
period,
while
final
weight
is
a
function of
birth
weight,
pretest
gain
and
test
gain ;
2)
selection
on
weight
for
age
might
lead
to
increased
rate
of
maturity
and
higher
weight
at
different
ages
such
as
birth
and
maturity.
In
fact,
this
will
be
true
if
the
genetic
correlation
between
mature
weight
and
growth
rate
is
smaller
than
the
correlations
between
mature
weight
and
final
weight
(F
IMLAND
,
1973).
When
pretest
environment
is
not
known
and
owing
to
the
high
negative
environmental
correlation
between
pretest
gain
and
on-test
gain,
TONG
(1982)
suggests
that
both
weight
for
a
given
age
and
on-
test
daily
gain
should
be
combined
in
an
index,
each
trait
receiving
equal
emphasis.
More
recently,
Sihtht
et
al.
(1986)
recommended,
for
use
in
a
practical
UK
improvement
programme,
an
index
with
the
following
measurements :
growth
rate,
food
conversion
efficiency
and
ultrasonic
fat
area,
the
aggregate
breeding
value
compri-
sing
growth
rate,
food
conversion
efficiency,
killing-out
proportion
and
carcass
lean
proportion.
Given
the
genetic
parameters
and
the
economic
weights
used
to
construct
this
index,
it
is
expected
that
selection
based
on
it
would
lead
to
a
slight
decrease
in
carcass
lean
proportion
but
less
than
the
decrease
expected
from
selection
solely
on
growth
rate.
These
authors
consider
that
measuring
food
consumption
is
expensive
but
worthwhile
since
dropping
this
measurement
from
the
index
would
proportionally
reduce
the
correlation
with
overall
breeding
value
by
0.14.
On
the
other
hand,
but
for
a
dairy
population,
F
IMLAND
(1973)
did
not
include
feed
conversion
in
his
index
considering
the
high
correlation
between
growth
rate
and
feed
conversion
and
the
inaccuracy
of
its
recording.
We
have
seen
that
a
substantial
improvement
in
net
added
value
(and
in
feed
conversion)
could
be
expected
without
feed
intake
recording.
By
dam
and
son
comparisons,
LicxLEY et
al.
(1960)
found
a
genetic
correlation
of
+
0.64
between
daily
gain
and
mature
weight.
They
calculated
that
selection for
daily
gain
would
be
1/3
as
effective
in
increasing
mature
size
as
selection
for
mature
size
itself.
From
paternal
half-sib
analyses,
B
ROWN
et
al.
(1972b)
estimated
genetic
correla-
tions
between
cow
mature
weight
and
gains
(in
females
of
the
Hereford
and
Angus
breed
respectively)
between
4-8
months
(-
0.38 ; -
0.02),
between
8-12
months
(-
0.12 ;
0.09),
between
12-16
months
(0.22 ;
0.46)
between
16-20 months
(0.57 ;
0.72).
The
authors
concluded
from
their
investigation
that
gains
and
weights
were
not
regulated
by
identical
groups
of
genes
and
that,
as
a
consequence,
selection
for
large
gain
or
large
weights
would
not
effect
identical
changes
in
the
growth
pattern
of
all
individuals.
However,
mature
weight
should
be
increased
in
case
of
selection
of
animals
making
large
gains
at
advanced
ages.
A
NDERSEN
(1978)
reported
a
genetic
correlation
of
+
0.40
between
mature
cow
weight
and
daily
gain
of
young
bulls
at
490
kg
and
estimated
that
an
increase
of
100
gr
in
the
average
daily
gain
(direct
selection)
would
be
followed
by
and
indirect
increase
of
48
kg
in
mature
cow
weight.
O
LSON
et
al.
(1982)
assigned
82 cows
to
four
groups
of
cow
size :
weight
(kg)
(height,
cm) :
451
(115.6) ;
517
(121.1) ;
567
(122.8) ;
647
(129.6).
The
means
for
postweaning
growth
rate
of
steers
born
from
these
cows
were :
1.42 ;
1.48 ;
1.48 ;
1.40
(kg)
not
significantly
different.
Nevertheless,
the
preweaning
traits
(birth
weight,
age
and
weaning
weight)
were
significantly
different
among
groups
of
cow
size.
M
ACNEIL
et
al.
(1984)
estimated
genetic
correlations
of
traits
of
females
with
growth
traits
of
their
steer
paternal
half-
sibs.
The
estimate
of
genetic
correlation
between
daily
gain
measured
on
males
and
mature
weight
measured
on
females
at
7
years
of
age
was
equal
to :
+
0.07.
They
calculated
that
per
standard
deviation
of
direct
response
in
daily
gain
(+
0.126
kg)
the
predicted
correlated
response
in
mature
weight
would
be
+
4.0
kg.
Analysing
estimates
of
mature
weight,
rate
of
maturing
and
weight
from
4
to
36
months
within
2
groups
of
females
(Hereford
and
Angus),
BROWN
et
al.
(1972a)
found
an
important
genetic
variation
in
growth
patterns
suggesting
that,
through
selection,
different
patterns
of
growth
could
be
achieved.
The
complex
relationships
between
an
animal’s
genotype
and
the
rearing
system
and
between
performances
at
different
phases
of
growth
need
to
be
understood
before
making
the
proper
choice
of
selection
criteria
and
testing
procedures
(feeding
system,
age
of
animals,
length
of
test).
V.
Conclusions
Among
the
4
biological
types
considered,
but
mainly
between
the
double-muscled
type
on
the
one
hand
and
the
other
3
types
on
the
other
hand,
significant
differences
were
found
regarding
feed
intake,
feed
conversion
ratio,
carcass
composition,
selling
price
and
net
income
after
fattening.
Within
biological
types,
feed
intake
and
feed
conversion
ratio
were
greatly
influen-
ced
by
initial
weight
and
daily
gain
but
to
a
small
extent
by
the
carcass
composition
as
measured
by
the
dressing-out
percentage
and
the
percent
lean
in
the
7
th
ribcut.
Lower
maintenance
requirements
of
the
double-muscled
bull
seem
to
be
the
reason
for
its
lower
feed
intake
at
equal
daily
gain.
Among
the
single
traits
considered,
daily
gain
and
feed
conversion
ratio
had
the
most
pronounced
effect
on
net
income,
the
latter
being
considered
not
for
the
total
production
system
but
only
for
a
segment
of
it,
the
fattening
period
of
the
young.
Within
the
double-muscled
type,
net
income
was
negatively
correlated
with
initial
weight.
Selection
for
higher
net
income
during
the
fattening
period
would
have
as
correlated
responses
a
larger
growth
rate,
a
lower
feed
conversion
ratio,
a
decreased
initial
weight
and
a
slightly
increased
final
weight.
Final
weight
was
a
poor
selection
criterion
if
the
objective
was
to
improve
net
income
during
the
fattening
period.
The
possibility
of
a
genetic
manipulation
of
the
growth
curve
depends
on
the
sign
and
strength
of
genetic
correlations
for
growth
between
adjacent
periods.
In
these
data
(males
fed
ad
libitum
from
one
month
of
age,
test
period
from
7
to
12
months)
the
genetic
correlation
between
initial
weight
and
on-test
gain
was
not
significantly
different
from
zero.
The
choice of
selection
criteria
and
testing
procedures
presuppose
a
good
understanding
of
the
relations
between
growth
rates
at
different
ages,
for
a
given
rearing
system.
Received
May
12,
1986.
Accepted
November
5,
1986.
References
A
NDERSEN
B.B.,
1978.
Animal
size
and
efficiency,
with
special
reference
to
growth
and
feed
conversion
in
cattle.
Anim.
Prod.,
27,
381-391.
A
VERDUNK
G.,
1968.
Genetic
aspects
of
test
period
length
for
rate
of
gain
in
cattle.
J.
Anim.
Sci.,
27,
1124
(Abstr.).
B.I.F.,
1981.
Guidelines
for
Uniform
Beef
Improvement
Programs.
Beef
Improvement
Federation.
U.S.D.A.
Ext.
Serv.
Program
Aid
1020.
BROWN
J.E.,
BROWN
C.J.,
Burrs
W.T.,
1972a.
A
discussion
of
the
genetic
aspects
of
weight,
mature
weight
and
rate
of
maturing
in
Hereford
and
Angus
cattle.
J.
Anim.
Sci.,
34,
525-537.
BROWN
J.E.,
BROWN
C.J.,
Burrs
W.T.,
1972b.
Relationships
among
weights,
gain
and
earliness
of
maturing
in
Hereford
and
Angus
females.
J.
Anim.
Sci.,
35,
507-517.
BROWN
C.J.,
JoxrrsoN
Z.,
BROWN
A.H.,
1986.
Some
genetic
aspects
of
feed
intake,
gain
and
feed
conversion
of
young
bulls
on
postweaning
gain
test.
3rd
World
Congress
on
Genetics
applied
to
Livestock
Production,
Lincoln,
July
16-22,
1986,
Agricultural
Communications,
Vol.
XI,
291-295.
University
of
Nebraska,
Lincoln.
Cntc!rwxmxr
T.C.,
D
AYHOFF
E.E.,
1959.
Some
factors
influencing
variation
in
28-day
gains
of
feedlot
cattle.
J.
Anim.
Sci.,
18,
1463
(Abstr.).
Cu
N
mF
F
L.V.,
KocH
R.M.,
GREGORY
K.E.,
SMITH
G.M.,
1981.
Characterization
of
biological
types
of
cattle -
cycle
II.
IV. Post
weaning
growth
and
feed
efficiency
of
steers.
J.
Anim.
Sci.,
53,
332-346.
D
AVIS
M.E.,
W
ILSON
G.R.,
H
ARVEY
W.R.,
TURNER
T.B.,
1985.
Adjustment
of
post
weaning
feed :
gain
ratios
of
Angus
bulls
for
differences
in
maintenance
requirements.
J.
Anim.
Sci.,
61,
1395-1401.
D
ICKERSON
G.E.,
1982.
Effects
of
genetic
changes
in
components
of
growth
on
biological
and
economic
efficiency
of
meat
production.
2nd
World
Congress
on
Genetics
applied
to
Livestock
Production,
Madrid,
October
4-8,
1982,
Vol.
V,
252-267.
Garsi,
Madrid.
D
ICKERSON
G.E.,
1985.
Potential
uses
of
genetic
variation
in
components
of
animal
growth.
J.
Anim.
Sci.,
61
(suppl.
2),
104-117.
D
UNCAN
D.B.,
1955.
Multiple
range
and
mutiple
F
tests.
Biometrics,
11,
1-42.
F
ERREL
C.L.,
J
ENKINS
T.G.,
1985.
Cow
type
and
the
nutritional
environment :
nutritional
aspect.
J. Anim.
Sci.,
61,
725-741.
F
IMLAND
E.A.,
1973.
Estimates
of
phenotypic
and
genetic
parameters
for
growth
characteristics
of
young
potential
AI
bulls.
Acta
Agric.
Scand.,
23,
209-216.
F
ITZHUGH
H.A.
Jr.,
1976.
Analysis
of
growth
curves
and
strategies
for
altering
their
shape.
J.
Anim.
Sci.,
42,
1036-1051.
G
EAY
Y.,
R
OBELIN
J.,
V
ERMOREL
M.,
B
ERANGER
C.,
1982.
Muscular
development
and
energy
utilisation
in
cattle :
the
double-muscled
as
an
extreme
or a
deviant
animal.
In :
KING
J.W.B.,
M
ENISSIER
F.
(ed.),
Muscle
hypertrophy
of
genetic
origin
and
its
use
to
improve
beef
production,
74-87.
Martinus
Nijhoff,
The
Hague.
G
ROSSMAN
M.,
B
OHREN
B.B.,
1985.
Logistic
growth
curve
of
chickens :
heritability
of
parameters.
J.
Hered.,
76,
459-462.
H
ANSET
R.,
1982.
Muscular
hypertrophy
as
a
racial
characteristic :
the
case
of
the
Belgian
Blue
Breed.
In :
KING
J.W.B.,
M
ENISSIER
F.
(ed.),
Muscle
hypertrophy
of
genetic
origin
and
its
use
to
improve
beef
production,
437-449.
Martinus
Nijhoff,
The
Hague.
H
ANSET
R.,
S
TASSE
A.,
Mic
HAux
C.,
1979.
Feed
intake
and
feed
efficiency
in
double-muscled
and
conventional
cattle.
Z.
Tierz.
Ziichtungsbiol.,
96,
260-269.
H
ANSET
R.,
M
ICHAUX
C.,
1985a.
On
the
genetic
determinism
of
muscular
hypertrophy
in
the
Belgium
White
and
Blue
cattle
breed.
I.
Experimental
data.
G6n!t.
Sel.
Evol.,
17,
359-368.
H
ANSET
R.,
M
ICHAUX
C.,
1985b.
On
the
genetic
determinism
of
muscular
hypertrophy
in
the
Belgium
White
and
Blue
cattle
breed.
II.
Population
data.
Génét.
Sel.
Evol.,
17,
369-386.
H
ANSET
R.,
MicH
A
ux
C.,
1986.
Characterization
of
biological
types
of
cattle
by
the
blood
levels
of
creatine
and
creatinine.
J.
Anim.
Breed.
Genet.,
103,
227-240.
H
ARVEY
W.R.,
1977.
User’s
guide for
LSML76.
Ohio
State
University.
KocH
R.M.,
S
WIGER
L.A.,
D
OYLE
CHAMBERS,
GREGORY
K.E.,
1963.
Efficiency
of
feed
use
in
beef
cattle.
J.
Anim.
Sci.,
22,
486-494.
KocH
R.M.,
C
UNDIFF
L.V.,
GREGORY
K.E.,
1982a.
Influence
of
postweaning
gain
interval
on
estimates
of
heritability
and
genetic
correlations.
J.
Anim.
Sci.,
55,
1310-1318.
Koc
H
R.M.,
GREGORY
K.E.,
C
UNDIFF
L.V.,
1982
b.
Critical
analysis
of
selection
methods
and
experiments
in
beef
cattle
and
consequences
upon
selection
programs
applied.
2nd
World
Congress
on
Genetics
applied to
Livestock
Production,
Madrid,
October
4-8,
1982,
Vol.
V,
514-526.
Garsi,
Madrid.
L
ICKLEY
C.R.,
S
TONAKER
H.H.,
S
UTHERLAND
T.M.,
RIDDLE
K.H.,
1960.
Relationship
between
mature
size,
daily
gain
and
efficiency
of
feed
utilization
in
beef
cattle.
J.
Anim.
Sci.,
19,
957
(Abstr.).
).
M
ACNEIL
M.D.,
C
UNDIFF
L.V.,
D
INKEL
C.A.,
K
OCH
R.M.,
1984.
Genetic
correlations
among
sex-
limited
traits
in
beef
cattle.
J.
Anim.
Sci.,
58,
1171-1180.
M
ICHAUX
C.,
S
TASSE
A.,
SONNET
R.,
L
EROY
P.,
H
ANSET
R.,
1983.
La
composition
de
la
carcasse
de
taureaux
culards
Blanc-Bleu
belge.
Ann.
Med.
Vet.,
127,
349-375.
O
LSON
L.W.,
P
ESCHEL
D.E.,
P
AULSON
W.H.,
R
UTLEDGE
J.J.,
1982.
Effects
of
cow
size
on
cow
productivity
and
on
calf
growth,
postweaning
growth
efficiency
and
carcass
traits.
J.
Anim.
Sci.,
54,
704-712.
P
RESTON
T.R.,
W
ILLIS
M.R.,
1974.
Intensive
Beef
Production.
2nd
Edition,
567
pp.,
Pergamon
Press,
Oxford.
P
YM
R.A.E.,
1982.
Selection
results
for
efficiency
of
food
utilization
in
livestock
and
poultry.
2nd
World
Congress
on
Genetics
applied
to
Livestock
Production,
Madrid,
October
4-8,
1982,
Vol.
V.,
231-244.
Garsi,
Madrid.
R
OBERTSON
A.,
1982.
Genetic
aspects
of
growth.
Proceedings
of the
World
Congress
on
Sheep
and
Beef Cattle
Breeding,
Palmerston
North,
October
28-November
13,
1980,
B
ARTON
R.A.,
SMITH
W.C.
(ed.),
Vol.
I,
427-437.
The
Dunmore
Press
Limited,
Palmerston.
S
IMM
G., S
MITH
C.,
P
RESCOTT
J.H.D.,
1986.
Selection
indices
to
improve
the
efficiency
of
lean
meat
production
in
cattle.
Anim.
Prod.,
42,
183-193.
SMITH
G.M.,
L
ASTER
D.B.,
C
UNDIFF
L.V.,
GREGORY
K.E.,
1976.
Characterization
of
biological
types
in
cattle.
II.
Postweaning
growth
and
feed
efficiency
of
steers.
J.
Anim.
Sci.,
43,
37-47.
S
NEDECOR
G.W.,
C
OCHRAN
W.G.,
1980.
Statistical
Methods.
7th
Edition,
507
pp.,
Iowa
State
University
Press,
Ames,
U.S.A.
S
WIGER
L.A.,
1961.
Genetic
and
environmental
influences
on
gain
of
beef
cattle
during
various
periods
of
life.
J.
Anim.
Sci.,
20,
183-188.
THO
MPSON
J.M.,
B
ARLOW
R.,
1986.
The
relationship
between
feeding
and
growth
parameters
and
biological
efficiency
in
cattle
and
sheep.
3rd
World
Congress
on
Genetics
applied
to
Livestock
Production,
Lincoln,
July
16-22,
1986,
Agricultural
Communications,
Vol.
XI,
271-282.
Uni-
versity
of
Nebraska,
Lincoln.
TONG
A.K.W.,
1982.
Effects
of
initial
age
and
weight
on
test
daily
gains
of
station-tested
bulls.
Can.
J.
Anim.
Sci.,
62,
671-678.
VA
LLS-O
RTtz
J.M.,
M
ENISSIER
F.,
V
ISSAC
B.,
1972.
Etude
du
caractere
culard.
VI.
Transmission
et
possibilités
d’utilisation
en
croisement
de
premiere
generation
pour
la
production
de
veaux
de
boucherie.
Ann.
Génét.
Sel.
Anim.,
4,
7-28.
V
ERMOREL
M.J.,
BouvtER
C.,
G
EAY
Y.,
1976.
The
effect
of
genetic
type
(normal
and
double-
muscled
Charolais
and
Friesian)
on
energy
utilization
by
growing
cattle
at
2
and
16
months
of
age.
V
ERMOREL
M.J.
(ed.),
Proc.
7th
Symp.
Energy
Metabolism.
Eur.
Assoc.
Anim.
Prod.,
Publ.
n°
79,
217-221.
G.
de
B
USSAC
,
Clermont-Ferrand,
France.
W
EBSTER
A.J.F.,
1985.
Differences
in
the
energetic
efficiency
of
animal
growth.
J.
Anim.
Sci.,
61
(Suppl.
2),
92-103.