Báo cáo y học: "A statistical approach for detecting genomic aberrations in heterogeneous tumor samples from single nucleotide polymorphism genotyping data" pot
Bạn đang xem bản rút gọn của tài liệu. Xem và tải ngay bản đầy đủ của tài liệu tại đây (1.56 MB, 15 trang )
MET H O D Open Access
A statistical approach for detecting genomic
aberrations in heterogeneous tumor samples
from single nucleotide polymorphism genotyping
data
Christopher Yau
1*
, Dmitri Mouradov
2
, Robert N Jorissen
2
, Stefano Colella
3,6
, Ghazala Mirza
3
, Graham Steers
4
,
Adrian Harris
4
, Jiannis Ragoussis
3
, Oliver Sieber
2
, Christopher C Holmes
1,5
Abstract
We describe a statistical method for the characterization of genomic aberrations in single nucleotide polymorphism
microarray data acquired from cancer genomes. Our approach allows us to model the joint effect of polyploidy,
normal DNA contamination and intra-tumour heterogeneity within a single unified Bayesian framework. We
demonstrate the efficacy of our method on numerous datasets including laboratory generated mixtures of normal-
cancer cell lines and real primary tumours.
Background
Single nucleotide polymorphism (SNP) genotyping
microarrays provide a relatively low-cost, high-through-
put platform for genome-wide pro ling of DNA copy
number alterations (CNAs) and loss-of-heterozygosity
(LOH) in cancer genomes. These arrays have enabled
the discovery of genomic aberrations associated with
cancer development or prognosis [1-4] and two recent
studies, in particular, have examined 746 cancer cell
lines [5] and 26 cancer types [6] revealing much about
the landscape of the cancer genome. However, whilst
numerous robust computational methods are available
for the detection of copy number variants (CNVs) in
normal genomes [7-11]; the approaches applied to can-
cers are often sub-optimal due to data properties that
are unique or more pronounced in cancer.
Potential difficulties in the analysis of SNP data from
cancers have been considered since the earliest SNP
array based cancer studies [12-14] with the principle
obstacles being (1) variable tumor purity (normal DNA
contamination), ( 2) intra-tumor genetic heterogeneity,
(3) complex patterns of CNA and LOH events, and ( 4)
genomic instability leading to aneuploidy/polyploidy.
Moreover, these issues are also confounded by pre-
viously well-described technical artifacts associated with
SNP arrays such as: signal variation due to local
sequence content [15] and, complex noise patterns due
to variable sample q uality and experimental conditions
[16].
Dedicated cancer analysis tools that compensate for
some of these factors have recently begun to emerge
[17-27] but there is currently no single coherent statisti-
cal mo del-ba sed framework that unifies and extends all
the principles underlying these man y methods. Here, we
propose s uch a framework and illustrate, on a number
of different datasets, the improvements in terms of
robustness and versatility that can be gained in cancer
genome pro ling, particularly in large-sample cancer stu-
dies involving the investigation of different molecular
sub-types and the use of modern high-res olution SNP
arrays (greater than 500,000 markers). Our methods are
implemented in a piece of software we call OncoSNP.
Characteristics of SNP data acquired from cancer
genomes
We begin with a brief examination of the characteristics
of SNP array data acquired from cancer genomes (for a
more thorough review of SNP array analysis and
* Correspondence:
1
Department of Statistics, University of Oxford, South Parks Road, Oxford,
OX1 3TG, UK
Full list of author information is available at the end of the article
Yau et al. Genome Biology 2010, 11:R92
/>© 2010 Yau et al.; licensee BioMed Central Ltd. This is an open access article distributed und er the terms of the Creative Commons
Attribution License ( which permits unrestricted use, distributio n, and reproduction in
any medium, provided the original work is properly cited.
methodology, see [28-31]). SNP array analysis produces
two types of summary measurement for each SNP
probe: (i) the Log R R atio (LRR) which i s a measure
related to total copy number, a nalogous to the log ratio
in array comparative genomic hybridization (aCGH)
experiments; and (ii) the B allele frequency (BAF),
which measures the relative contribution of the B allele
to the total signal (here we use A and B as generic labels
to refer to the two alternative SNP alleles). Normaliza-
tion methods to extract these measurements for the Illu-
mina and A ffymetrix SNP genotyping platforms have
been previously described [32,33] but is not a subject we
treat in deta il in this article. In this paper, our examples
are based on the Illumina platform and we primarily use
the default normalization offered by Illumina’sproprie-
tary BeadStudio/GenomeStudio software or the tQN
normalization [33] where appropriate. However, the
methods described are not intrinsically tied to the Illu-
mina platform and we are actively working to transfer
these techniques for use with the Affymetrix platform.
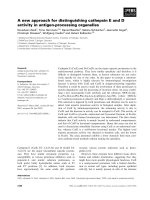
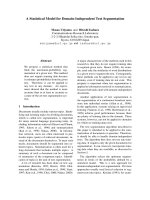
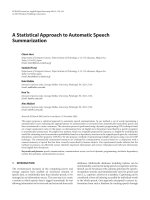
Figure 1 (top panel) depicts data for chromosome 1 of
a breast cancer cell line (HCC1395, ATCC CRL-2324)
and a EBV transformed lymphoblastoid cell line
(HCC1395BL, ATCC CRL-2325) derived from the same
patient from a previously published dataset [24]. Down-
ward shifts in the Log R Ratios indicate DNA copy
Figure 1 Example cancer SNP data. (Top panel) SNP data showing the distribution of Log R Ratio (LRR) and B allele frequencies (BAF) values
across chromosome 1 for a cancer cell line (HCC1395) and its matched normal (HCC1395BL). The normal sample is characterized by a typical
diploid pattern of zero mean LRR (copy number 2) and BAF values distributed around 0, 0.5 and 1 (genotypes AA, AB and BB) with occasional
aberrations due to copy germline number variants (CNV). The cancer cell line consists of complex patterns of LRR and BAF values due to a
variety of copy number alterations and loss-of-heterozygosity events. (Bottom panel) SNP data is shown for a single copy deletion and
duplication on chromosome 21 for various normal-cancer cell line dilutions. In the presence of normal DNA contamination, the LRR signals for
the deletion and duplication are diminished in magnitude and the distribution of the BAF values reflects the aggregated effect of mixed normal
and cancer genotypes at each SNP. Note - the Log R Ratio values are smoothed and thinned for illustrative purposes.
Yau et al. Genome Biology 2010, 11:R92
/>Page 2 of 15
number losses relative to overall genome do sage, whilst
copy number gains cause upwar d shifts. The BAF tracks
changes in the relative fractions of the B allele due to
CNA and/or LOH.
In the non-can cer (normal) lymphoblastoid cell line,
the LRRs are distrib uted around zero corresponding to
DNA copy number 2; whilst the BAFs are clustered
around values of 0, 0.5 and 1 that correspond to the
diploid genotypes AA, AB and BB. Small aberrations in
the normal data can be observed due to germ line
CNVs but the genome is otherwise stable. The cancer
cell line presents a much more complex scenario with
extensive genomic rearrangements leading to consider-
able variation in the SNP data. This is not an atypical
scenario for cancers which often feature large numbers
of focal aberrations and whole or partial chromosomal
copy number changes althoug h this can vary consider-
ably de pending on the cancer type and the stage of the
disease. The question we address here is: how do we
translate this SNP data into actual copy number and
LOH calls?
Effects of polyploidy
One distinctive difference between the normal and can-
cer datasets is that the LRR values are not directly com-
parable. Experimental protocols for SNP arrays
constrain the amount of DNA, not the number of cells,
to be the same for each sample assayed. For example, a
purely metalloid genome containing no other chromoso-
mal alterations could not be distinguished from a
diploid genome, as the same mass of genomic material
would be hybridized on to the SNP array. The situation
is further compounded by standard normalization meth-
ods that transform the probe intensity data on to a com-
mon reference scale or “ virtual diploid state” [34] in
order to correct for between-array or cross-sample
variability.
The result is that the (zero) baseline of the LRR for
the cancer cell line o r tumor sample does not corre-
spond to a normal diploid copy number but t o the
average copy n umber (ploidy) of the sample. In order
to determine absolute copy number values, a correct
baseline for the interpretation of the LRR values must
be determined but this is a c hallenging problem sin ce,
for any particular cancer sample, the ploidy is generally
unknown a priori, maybe a fractional value and varies
from one cancer to the next. Methods to tackle base-
line uncertainty for polyploid tumors have recently
been developed [17,21] but these are only effective in
the absence of normal DNA contamination and intra-
tumor heterogeneity making them most effective for
use with cancer cell lines and very high purity tumor
samples.
Normal contamination and intra-tumor heterogeneity
Normal DNA contamination can also b e a s ignificant
barrier to the correct interpretation of SNP data as illu-
strated in Figure 1 (bottom panel). The SNP data shown
comes from various artificial mixtures of the cancer cell
line and paired normal cell line [33] for a single-copy
deletion and duplicat ion on chromos ome 21. The SNP
array measures both the contribution of the normal and
tumor genotypes hence, the B allele frequencies for the
deletion and duplication appear as four bands, ref1ecting
the mixed normal-tumour genotypes AA/A, AB/A, AB/
B or BB/B for the single-copy deletion and AA/AAA,
AB/AAA, AB/BBB or BB/BBB for the single-copy dupli-
cation. Moreover, as the normal DNA content increases,
the magnitude of the shifts in the LRR values associated
with the deletion and duplication are reduced.
It is of interest to note that whilst the presence of
normal DNA affects SNP data globally, localized varia-
tion can also exist due to intra -tumor heterogeneity and
aggregation from multiple co-existing cancer cell clones
each harboring their own distinct pattern of genomic
aberrations. These mixed signals must be deconvolved
in order to ascertain the underlying somatic changes
and a number of methods [20,22,24-27] have been pro-
posed to tackle the issue of normal DNA contamination.
These approaches often assumed the absence of the
effects of polyploidy described previously and therefore
are principally suited to the analysis of n ormal DNA
contaminated and near-diploid tumor samples.
Results and Discussion
Model overview
The development of our method, implemented in
OncoSNP, has been motivated by the need to address
both the effects of normal DNA contamination and
polyploidy simultaneously. Normal tissue contaminated
polyploid tumors are frequently observed in studies of,
for example, colon or breast cancers and, at the time of
writing, only on e method Genome Alteration Print [23],
based on patter n recognition heuris tics, has been devel-
oped to manage both these highly important issues in
SNP array based cancer analysis. Our approach differs
from previo us methods in that it attempts to tackle the
issues of normal DNA contamination, intra-tumor het-
erogeneity and baseline ploidy normalization artifacts
jointly within a coherent statistical framework. The
model assumes that, at each SNP, each tumor cell of a
given specimen either retains the normal constitutional
genotype or possesses an alternative but, common,
tumor genotype. However, in contrast to other methods,
we explicitly parameterize the proportion of cells that
possess the normal genotype at each SNP. This propor-
tion is determined by a genome-wide fraction attributed
Yau et al. Genome Biology 2010, 11:R92
/>Page 3 of 15
to normal DNA contaminatio n and the proportion of
tumor cells that have remained unchanged at that SNP
which is allowed to vary along the genome thus allowing
for intra-tu mor heterogeneity (the underlying statistical
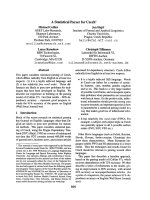
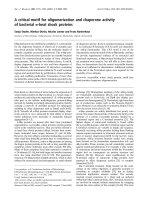
model is illustrated in Figure 2). We also include a LRR
baseline adjustment parameter that allows inference of
the unknown tumor ploidy in a statistically rigorous
manner.
Bayesian methodology is applied to impute the
unknown normal-tumor genotypes, the normal genotype
proportion and to assign a probabilistic score of each
SNP belonging to one of twenty-one different “tumor
states” (Table 1). Experimental noise is accounted for
using a flexible semi-param etric noise (mixture of Stu-
dent t-distributions) model that is able to adaptively fit
complex noise distr ibutions to the SNP data, and our
method further adjusts for wave-like artifacts correlated
to local GC content [35].
Our MATLAB implementation typically requires
between 0.5-3 hours processing per sample dataset
(containing approximately 600,000 probes) depending
on the run-time options specified. A variety of user
settings are provided to allow the performance of the
method to be tuned to the particular application and
longer processing times are required where little prior
information is provided and the method is required to
learn all characteristics directly from data. As the
method analyzes each sample independently, parallel
processing of multiple samples simultaneously is trivi-
ally implemented.
Polyploidy correction
In order to demonstrate the ability of OncoSNP to cor-
rectly adjust the baseline for the Log R Ratio to the actual
baseline for aneuploid/polyploid samples, we analyzed
SNP data f or ten well-characterized cancer cell lines
(Table 2). Karyotype information for each cell line were
retrieved from t he online database for the American
Type Culture Collection (ATCC) or previous karyotype
studies [36,37].
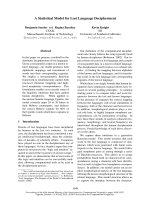
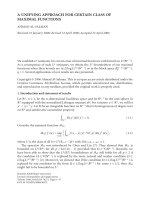
Figure 3(a-c) shows examples of the baseline adjust-
ment for three cancer cell lines foc using on selected
chromosomes. In each case, OncoSNP adjusts the base-
line to center on the regions of all elic balance (BAFs
equal t o 0.5) corresponding to copy number 2 enabling
the correct absolute copy number values to be deter-
mined. Note that it is the allele-specific infor mation in
the B allele frequencies that inform us of the baseline
error, and variati on i n the intensity-based LRR does not
yield this information on its own.
Figure 2 Illustrating the statistical model. (a) The tumor sample consists of DNA contributions from an unknown number of clones (here, we
illustrate three clones) and normal cells in different proportions. Each clone has its own set of tumor genotypes which are derived from the
normal genotypes by the loss or duplication of alleles. (b) Our statistical model assumes that, at each locus, there exists a normal and a
common tumor genotype. OncoSNP estimates the normal and common tumor genotype and the proportion of the sample explained by each
genotype from the SNP data. The situation depicted at SNP 5 involves clones with different tumor genotypes - this is not considered under our
model.
Yau et al. Genome Biology 2010, 11:R92
/>Page 4 of 15
Overall, Figure 3d shows that a st rong linear relation-
ship exists with near-diploid cell lines (SW837 and
HL60) requiring less baseline adjustment compared to
polyploid cell lines. This behavior is encouraging since
we might expect the degree of baseline adjustment
required to scale linearly with chromosome number. As
a result, OncoSNP was able to correctly estimate the
chromosome number for each cancer cell line.
Analysis of normal-cancer cell line mixtures
We applied OncoSNP to three datasets each containing
mixtures of norma l and cancer cell line DNA. SNP data
was also generated in-house for 0:100, 25:75 and 50:50
normal-cancer cel l lines mixtures (mixing ratios by
mass) for a hyp o-diploid (SW837) and triploid (SW403)
colon cancer cell line. A s paired normal cell lin es were
not available for these cancer cell lines, we used an non-
paired normal DNA sample and filtered out non-compa-
tibl e SNPs (the fi ltering method is described in detail in
Supplement ary methods in Additional file 1) to generate
pseudo-paired normal-cancer cell line mixtures. We also
analyzed the 0:100, 21:79 and 50:50 mixtures of the
HCC1395/HCC1395BL matched normal-cancer cell
lines from [24].
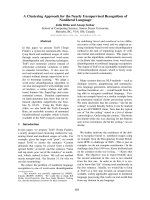
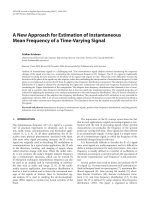
Figure 4 shows res ults from an ana lysis of chromo-
some 1 of the mixture ser ies for SW837. OncoSNP
identifies the p-arm deletion successfully in all the sam-
ples even as the level of normal contamination increases.
GenoCN and Genome Alteration Print (GAP) sh ow less
robustness particularly at the higher normal contamina-
tion level and, in the case of GAP for the 25:75 mixture,
it incorrectly predicts that the sample is tetraploid.
Addition al plots for all three cell line mixtures are given
in Additional file 2. Figure 5 shows that overall,
OncoSNP estimates of chromosome number, copy
Table 1 OncoSNP tumor states
Tumor states
Tumor state Tumor copy number Allowable tumor-normal genotypes Description
1 0 (-, AA), (-, AB), (-, BB) Homozygous deletion
2 1 (A, AA), (A, AB), (B, AB), (B, BB) Hemizygous deletion
3 2 (AAAA, AA), (AAAB, AB), (ABBB, AB), (BBBB, BB) Normal
4 3 (AAA, AA), (AAB, AB), (ABB, AB), (BBB, BB) Single copy duplication
5 4 (AAAA, AA), (AAAB, AB), (ABBB, AB), (BBBB, BB) 4n monoallelic amplification
6 4 (AAAA, AA), (AABB, AB), (BBBB, BB) 4n balanced amplification
7 5 (AAAAA, AA), (AAAAB, AB), (ABBBB, AB), (BBBBB, BB) 5n monoallelic amplification
8 5 (AAAAA, AA), (AAABB, AB), (AABBB, AB), (BBBBB, BB) 5n unbalanced amplification
9 6 (AAAAAA, AA), (AAAAAB, AB), (ABBBBB, AB), (BBBBBB, BB) 6n unbalanced amplification
10 6 (AAAAAA, AA), (AAAABB, AB), (AABBBB, AB), (BBBBB, BB) 6n unbalanced amplification
11 6 (AAAAAA, AA), (AAABBB, AB), (BBBBB, BB) 6n unbalanced amplification
12 2 (AA, AA), (AA, AB), (BB, AB), (BB, BB) 2n somatic LOH
13 3 (AAA, AA), (AAA, AB), (BBB, AB), (BBB, BB) 3n somatic LOH
14 4 (AAAA, AA), (AAAA, AB), (BBBB, AB), (BBBB, BB) 4n somatic LOH
15 5 (AAAAA, AA), (AAAAA, AB), (BBBBB, AB), (BBBBB, BB) 5n somatic LOH
16 6 (AAAAAA, AA), (AAAAAA, AB), (BBBBBB, AB), (BBBBBB, BB) 6n somatic LOH
17 2 (AA, AA), (BB, BB) 2n germline LOH
18 2 (AAA, AA), (BBB, BB) 3n germline LOH
19 2 (AAAA, AA), (BBBB, BB) 4n germline LOH
20 2 (AAAAA, AA), (BBBBB, BB) 5n germline LOH
21 2 (AAAAAA, AA), (BBBBBB, BB) 6n germline LOH
Description of the 21 tumor states showing corresponding copy numbers and genotypes. OncoSNP assigns a score of each SNP being in each of the twenty-one
tumor states.
Table 2 Cancer cell lines
Cancer cell lines
Cell line Chromosome number
(modal, range)
Reference
HL60 46 (44-46) Liang et al. (1999)
HT29 70 (69-73) Adbel-Rahman et al. (2000)
SW1417 70 (66-71) Adbel-Rahman et al. (2000)
SW403 64 (60-65) Adbel-Rahman et al. (2000)
SW480 58 (52-59) Adbel-Rahman et al. (2000)
SW620 48 (45-49) Adbel-Rahman et al. (2000)
SW837 38 (38-40) Adbel-Rahman et al. (2000)
LIM1863 80 (66-82) Adbel-Rahman et al. (2000)
MDA-MB-
175
84 (82-89) ATCC
MDA-MB-
468
64 (60-67) ATCC
A list of cancer cell lines analyzed and estimates of their chromosome number
retrieved from the literature.
Yau et al. Genome Biology 2010, 11:R92
/>Page 5 of 15
number and LOH from the mixtures remained highly
self-consistent even with the addition of the normal
DNA and were more rob ust than the other methods
tested. For the colon cancer cell lines, the chromosome
numbers predic ted by OncoSNP (40 and 64 for SW837
and SW403 respectively) matched known karyotype
information (SW837, range 38-40; SW402, range 60 to
65) [36].
Whilst it should be stressed that careful sample prepara-
tion should keep normal contamination to a minimum
in many real studies of primary tumors, the reliability of
OncoSNP, up to 50% tumor purity, is nonetheless reas -
suring as clinical estimates of tumor purity can be
inconsistent with observed genotyping data [25].
Model comparison
In order to demonstrate the utility of integrat ing both
normal DNA contamination and LRR baseline correc-
tion within a single analysis model; we examined SNP
data acquired from laboratory generated normal-cancer
cell lines mix tures to simulate normal contamination of
tumor samples.
The data was analyzed using four variants of our
model: a germline model, in which we assume no base-
line adjustment is required and no normal DNA con-
tamination exists; a ploidy-only model, in which we
perform baseline adjustment only; a normal contami na-
tion-only model, where we allow for normal DNA con-
tamination but no baseline adjustment and our full,
Figure 3 Estimating baseline Log R Ratio adjustments due to ploidy. OncoSNP Log R Ratio baseline adjustments (red) for cancer cell lines
(a) HL60 (Chr10), (b) HT29 (Chr3) and (c) SW1417 (Chr8). HL60 has a near-diploid karyotype and OncoSNP has correctly identified that no Log R
Ratio baseline adjustment is required. HT29 and SW1417 have complex polyploid karyotypes and transformation of the SNP data to a virtual
diploid state needs to baseline ambiguity for the Log R Ratio. For example, in (b) and (c), regions of allelic balance with negative Log R Ratios
are identified. OncoSNP correctly locates the true baseline level for the Log R Ratio. In (d) the estimated Log R Ratio baseline adjustment for the
ten cancer cell lines analyzed is found to show a strong linear correlation to the modal chromosome number of each cell line. Baseline
adjustments are standardized for comparison against the Log R Ratio level associated with copy number 3 as the SNP data were acquired from
different versions of the Illumina SNP array.
Yau et al. Genome Biology 2010, 11:R92
/>Page 6 of 15
integrated OncoSNP model. It should be noted that all
the model va riants we consider are nested within the
full model; and are obtained by eit her fixing parameters
or specifying strict prior probability distributions.
Figure 6 shows genome-wide copy number profiles
attained from the four variants of our model on the cell
line mixtures. The analysis of the hypo-diploid cell line
SW837 mixtures showed that the germline- and ploidy-
only models, which do not take into account normal
DNA contamination, produced substantially different
profiles as the level of normal DNA contamination was
altered. Only the normal- and full OncoSNP models
were capable of reproducing genome-wide copy number
profiles consistently with minimal discrepancy.
The analysis of the triploid SW403 cell line mixture
series highlights the particular strengths of our model.
The correct interpretation of the SNP data requires con-
sideration of the underlying triploid nature of the cancer
cell line and the varying levels of normal DNA contami-
nation. As the germline-, normal- and ploidy-only mod-
els are only able to compensate for only one of these
factors but not both, there are discrepancies in the gen-
ome-wide profiles between samples. In contrast, the full
OncoSNP model reproduces genome-wide copy number
profiles fo r each mixture sample with relatively greater
consistency. These results motivate the utility of infer-
ring both baseline ploidy and normal contamination
within an integrated framework since the ploidy s tatus
and tumor purity of actual clinical cancer samples are
often unknown.
Microdissected tumor samples
We validated our approach to determine stromal con-
tamination in an experimental setting by studying SNP
data for three primary breast tumors (Cases 114, 601
and 3,364). For each case, we analyzed data acquired
Figure 4 Example analysis of the normal-cancer cell line (SW837) mixture series. Copy number and LOH state classifications for
chromosome 1 of the colon cancer cell line SW837.
Yau et al. Genome Biology 2010, 11:R92
/>Page 7 of 15
from microdissected and non-dissected tumor material
such that, in an ideal scenario, predicted copy number
and LOH profiles obtained from the two samples should
be identical. Visual inspection of the SNP data suggests
that all three tumors are triploid and a baseline Log R
Ratio adjustment is required. Genome-wide copy num-
ber profiles for each material type a nd case are shown
in Figure 7 (more detailed plots are given in Additional
file 3). Qualitatively, the genome-wide copy number pro-
files produced by OncoSNP show the least discrepancy
compared to the other methods tested. It should be
noted that visual inspection of the SNP data for the
non-dissected material for cases 601 and 3,364 sug-
gested that they were highly contaminated by stromal
tissue and were reinforced by normal DNA content esti-
mates o f 70% and 60% by OncoSNP, compared to 30%
and 20% in the microdissected material. The ability of
OncoSNP to recover so many gross profile features
despite this level of stromal contamination demonstrates
its ability to be robust in even the most extreme circum-
stances. For case 114, the non-dissected and microdis-
sected material were estimated to contai n 30% and 10%
normal contamination.
Quantitatively, the proportion of SNPs showing copy
number classification discrepancies between the
microdissected and non-dissected sample analysis were
7.6%, 21.9% and 19.3% for cases 114, 601 and 3,364
respectively. This is compared to 6.4%, 52.1% and 27.0%
with GenoCN and 8.5%, 86.2% and 99.0% with GAP.
Note that whilst GenoCN showed strong reproducibility
for case 114, it misclassified the ploidy in both instances
as its operation is limited to diploid tumors.
Statistical uncertainty
A feature of our statistical framework is the ability to
highlight and explore ambiguity in the interpretation
of SNP data from contaminated polyploid tumor sam-
ples. Figure 8 shows a likelihood c ontour plot derived
from a cancer sample whose ploidy status and normal
DNA content are unknown. The likelihood plot gives
the probability of the SNP data associated with differ-
ent possibilities for the normal DNA content and LRR
baseline adjustments. In this example, the likelihood
possesses three modes each corresponding to a differ-
ent, but compatible, biolo gical interpretation of the
data. The likelihood associated with each of the three
modes is very similar and in the absence of external
karyotype information, or prior knowledge of the
tumorploidyorthelevelof normal DNA contamina-
tion, each of these interpretations is entirely plausible.
Figure 5 OncoSNP analysis of three normal-cancer cell line mixture series. Chromosome number estimates and copy number and LOH
state misclassification rates for three normal-cancer cell line mixture series. OncoSNP produces the greatest self-consistency of the three
methods tested. Red - OncoSNP, Green - GenoCN, Blue - GAP.
Yau et al. Genome Biology 2010, 11:R92
/>Page 8 of 15
Our statistical model allows us to explore this two-
dimensional parameter space enabling each of these
data interpretations to be considere d in a statis tically
rigorous manner. In contrast, methods that restrict
themselves to consideration of normal DNA contami-
nation or baseline adjustment only will only have
access to particular one-dimensional planes which may
lead to alternative interpretations of the SNP data
being missed. Although we anticipate that many can-
cers should exhibit a sufficient level of genomic altera-
tion to make the data informative about t umor ploidy
and purity, a consideration of alternate ploidy-purity
levels maybe an important factor in the characteriza-
tion of particular cancer sub-types that may not exhibit
complex changes.
Conclusions
The development of our method has b een motivated by
an on-going genome-wide study of one-thousand paired
normal-colorectal cancers. The pro ling of genomic
aberrations in these cancers is an important step in
identifying genetic abnormalities involved in disease
initiation and progression as well as patterns of somati-
cally-acquired alterations associated with particular clini-
cal phenotypes and therapeutic response. The genomic
features of colorectal cancer form a particularly useful
platform for methods development since colon tumor
samples frequently contain normal DNA contamination
and there exi st at least two well-characterized molecular
sub-types: the microsatellite-stable (MSS) and m icrosa-
tellite-unstable (MSI) groups. MSI colon cancers are
Figure 6 A com parison of genome-wide copy number estimates using four varian ts of the OncoSNP model. Heatmaps are shown for
genome-wide copy numbers from four variants of our model: (i) Germline model involving no Log R Ratio baseline correction or normal
contamination, (ii) Ploidy-only model estimation of baseline correction used, (iii) Normal-only model estimation of normal DNA contamination
used and (iv) Full model the complete OncoSNP model incorporating both baseline and normal DNA contamination estimation. The full model
is able to accurately reproduce the same copy number profile for both cell lines (SW837/SW403) even in the presence of increasing levels of
normal DNA contamination. If normal contamination or baseline correction estimation is not used incorrect copy number profiles maybe given.
Yau et al. Genome Biology 2010, 11:R92
/>Page 9 of 15
associated with a near-diploid karyotype, with compara-
tively few structural rearrangements; whilst MSS colon
cancers are characterized by extensive structural rear-
rangements and frequently exhibit a triploid or tetra-
ploid karyotype [38]. As our approach considers the
combined effects of ploidy changes and tumor heteroge-
neity jointly within an integrated statistical framework,
we have been able to highly automate the process of
analyzing SNP data from a large cohort of colon cancers
and robustly operate over a range of scenarios posed by
each of the molecular sub-types.
Fundamental to the success of our approach is the rig-
orous exploitatio n of allele-specific information for esti-
mating normal DNA contamination and tumor ploidy.
Historically, one of the key advantages of SNP arrays
over aCGH technologies has been the avai lability of
allele-specific information to allow the detection of
LOH events. In our method, we have utilized this sec-
ond axis of information to determine absolute copy
number and predict tumor purity that would be challen-
ging to imple ment with the one-dimensional datasets
produced by aCGH alone.
Recently, next generation sequencing (NGS) technolo-
gies have proven to be a powerful new force in the
toolkit of canc er geneti cists allowing cancer genomes to
be probe at greater resolutions and more levels o f detail
than ever before [39-42]. Nonetheless, SNP arrays are
likely to remain a useful analysis tool in cancer studies
for the foreseeable future as SNP arrays remain more
cost- and resource-effective as a means of sampling
large numbers of tumors. In addition, as shor t-read
sequencing technologies are not immune to many of the
issues that we have discussed. For instance, [42] used
pathology review to estimate tumour cellularity in their
primary tumour and the brain metastasis and xenograft
samples and adjusted sequence read counts accordi ngly.
The integration and reconciliation of SNP data with
libraries of short-read sequence data would allow more
Figure 7 Genome-wide copy number profiles of primary breast tumors. Genome-wide copy number profiles for three primary breast
tumors (non-dissected and microdissected) using OncoSNP, GenoCN and Genome Alteration Print (GAP).
Yau et al. Genome Biology 2010, 11:R92
/>Page 10 of 15
accurate determination of normal DNA con tamination
andallowtheuseofSNPdataasascaolduponwhich
to reconstruct the more detailed and low-level cancer
sequence data. It may also be possible to adapt the
methods presented here for use for short read sequen-
cing platforms. One possible approach is to model the
allele-specific read counts at known SNP locations
directly and modify the emission distribution in the
Hidden Markov model from a continuous to a discrete
distribution (for example Poisson or Negative-Binomial).
Alternatively, the existing data model can be maintained
and the read counts transformed into near-continuous
measures with the Log R Ratio represented as the log
ratio of the total read depth and a (local) normalizing
constant derived from, say, a matched germline sample
and the B Allele Frequency calculated from the ratio of
the number of reads containing the B allele to total read
depth. However, we would advise that any attempts to
implement these techniques f or application to sequen-
cing technologies should be supported by extensive con-
trol and calibration experiments of the type described in
this paper and by previous works.
In conclusion, we have described a novel computa-
tional tool (OncoSNP) for genomic copy number and
LOH pro ling of heterogeneous tumors using SNP
arrays. Using formal statistical modeling we are able to
jointly consider a number of complex factors arising in
SNP array-based tumor analysis. In a number of experi-
ments, we demonstrated the ability of o ur method to
give consistent results in the presence of both tumor
heterogeneity and unknown baseline ploidy using both
cancer cell lines and clinical samples. We believe that
Figure 8 Analysis of a tumor sa mple with an unknown ploidy sta tus and nor mal DNA contamination. A likelihood contour plot shows
that there are three modes each corresponding to an alternative explanation of the SNP data: (a) the tumor has near-diploid karyotype and
contaminated with 50% normal DNA content, (b) the tumor has a tetraploid karyotype with 60% normal DNA content and (c) the tumor has a
near-triploid karyotype with negligible normal DNA content. The maximum log-likelihood at each mode is very similar.
Yau et al. Genome Biology 2010, 11:R92
/>Page 11 of 15
our method could substantially improve the analysis of
tumor SNP data particularly in large s tudies of clinical
samples where there may be exist considerable variation
in the underlying genetics as well as factors such as
tumor purity and sample quality.
Materials and methods
Materials
Dilution series
Illumina HumanCNV370-Duo BeadChip Infinium SNP
data for dilution series of 12 mixtures of cancer cell line
(HCC1395) mixed with its paired normal cell line
(HCC1395BL) were downloaded from the NCBI Gene
Expression Omnibus accession [GEO:GSE11976]. We
excluded chromosome 6 and 16 from analysis due to
copy genomic aberrations present in the normal cell line
HCC1395BL.
Cancer cell lines
Illumina HumanHap300 data for the promyelocytic leu-
kemia cancer cell HL-60 and colon cancer cell line
HT-29 were obtained from Illumina, and Human-610
Quad SNP genotyping data for the colon cancer cell
lines SW403, SW480, SW620, SW837 , SW1417 and
LIM1863 were generated at the Ludwig Institute of Can-
cer Research using standard processing protocols. The
genotyping data for breast cancer cell lines MDA-175
and MDA-468 were downloaded from the NCBI Gene
Expression Omnibus accession [GEO:GSE18799] [23].
Primary breast tumors
Three breast tumors (cases 114, 601 and 3,364) that
had not received non-neoadjuvant therapy were ana-
lyzed in detail using material derived from microdis-
section. For each case, material containing pure tumor
and pure stroma cells respectively was microdissected
andcomparedtodataobtainedfromsurgically
obtained material from the same tumors. Case 114 was
of Luminal B type (23 mm tumor, moderately differen-
tiated infiltrating ductal carcinoma with an e xtensive
in-situ component. Node +ve, ER +ve (6.8 fm/mg pro-
tein), EGFR -ve (7.8 fm/mg protein)). Case 601 (20
mm 30 mm tumor, grade 3 with intraductal in-sit u ca.
and in filtrating ductal carcinoma, node +ve, ER -ve
(1.5 fm/mg protein), Her2 +ve (histoscore of 3), E GFR
+ve (histoscore of 208)) was classified as ERBB2 posi-
tive based on expression microarray data with a frac-
tional rank of 0.982, Case 3,364 was 25 mm grade 3
infiltrating ductal carcinoma, ER positive (8 fm/mg
protein), PR positive (histoscore 8/8), Her2 positive
(histoscore 3+, one of ten axillary nodes +ve). For each
case, DNA was extracted from microdissected stroma
and tumor, as well as the original non-dissected sam-
ple and analyzed using Illumina Human-610 Quad
SNP arrays app lying standard protocols.
Data processing
Genome Alteration Print was downloaded [43] and used
to analyze all datasets using default settings and the
highest ranked copy number and LOH predictions used
for comparisons. However, for the cancer cell line dilu-
tion series, we re-used t he results that had previously
been generated by [23] and made available on the afore-
mentioned website.
GenoCN v1.06 was downloaded [44] and used with
default settings and stromal contamination settings on
for all datasets generated using Illumina Infonaut II SNP
arrays. Adjusted GenoCN parameters for the Log R
Ratio leve ls were used for Infonaut HD SNP array pro-
cessing and in these instances we used the same levels
that we specified for OncoSNP. The copy number and
LOH predictions from the Viterbi sequence were used
for comparisons.
OncoSNP was run on all datasets using 15 E M itera-
tions and with both stromal and intra-tumor heteroge-
neity options. In all cases, the ploidy prediction with the
highest maximum likel ihood was chosen and the Viterbi
sequence of tumor states used fo r comparisons. We fil-
tered detected aberration s using a Log Bay es Factor of
30.
Statistical model
A complete description of our statistical model is p ro-
vided in Supplementary Information in Additional file 1.
Let x
i
denote the tumor state at the i-th pr obe location
and (x
i, n
, x
i, t
) denote the associated normal and tumor
copy nu mbers. Furthermore, let z
i
=(z
i, n
,z
i, t
)denotethe
B allele count for the normal and tumor genotype respec-
tively. The combinations (z
i, n
,(x
i, n
)and(z
i, t
, x
i, t
)fully
define the normal and tumor genotypes respectively. The
tumor state at each probe denotes the allowable c ombi-
nations of normal-tumor genotypes at that location as
shown in Table 1.
Let π
0
denote the normal DNA fraction of the tumor
sample due to stromal contamination and
=
=
{}
ii
n
1
denote the proportion of tumor cells having the normal
genotype at each probe. The data
yy=
=
{}
ii
n
1
consists
of a set of two- dimensional vectors y
i
=[r
i
, b
i
]′ whose
elements correspond to the Log R Ratio and B allele fre-
quency respectively.
Given (x, z, π, π
0
) the data is assumed to be distribu-
ted according to a (K + 1)-component mixture of Stu-
dent t-distributions, where k
i
indicates the mixture
component assignment of the i-th data point,
yxz m
mx z
iiii
ii
k
l
k
l
r
l
l
i
i
k
r
|, ,,,
( ( , ) , , ), ,
(
()
m
,k
=
+≠
()
∑
St
U
0
iin max
, ) ( , ), ,rk
b
×=
⎧
⎨
⎪
⎩
⎪
U01 0
(1)
Yau et al. Genome Biology 2010, 11:R92
/>Page 12 of 15
where
St( , , )
() ()
k
l
k
l
is the probability density func-
tion of the Student t-distribution with mean
k
l()
and
covariance matrix
Σ
k
l()
associated with the k-th mixture
component and the l-th genotype class and v degrees of
freedom. The 0-th component is an outlier c lass which
assumes uniformly distributed data over a specified
range.
The elements of the mean vectors m(x
i
, z
i
)=[m
r
(x
i
),
m
b
(z
i
, x
i
)]′ are given by the following:
mrrg
ri i x i x i
in x
it
()(( ) ) ( )( ) ,
,
,
x =−+ +−− ++
111
00 0 01
(2)
where g
i
is the lo cal GC content at t he i-th probe
location and
m
zz
x
bii
iiniit
i
(, )
(( ) ) ( )( )
(( ) )
,,
zx =
−+ +− −
−+
111
1
00 0
00
iin i it
x
,,
()( )
.
+− −11
0
(3)
Prior distributions
The prior distribution on the mixture weights is given
by a Dirichlet distribution:
w
()
|~ (),
l
Dir
(4)
where a is a concentration parameter which in the
numerical results we used a =1togiveaatprioron
the mixture weights.
The prior distributions on the mixture centers and
covariance matrices are given by standard conjugate
Normal-Inverse Wishart distributions:
k
l
k
l
k
l
kKl
() () ()
|, (, ), , , , ,,,
~ N 0 =… =1123
(5)
k
l
k
l
k
l
kKl
() () ()
|, ~ (, ), , , , ,,,
SSIW =… =1123
(6)
where τ is a hyperparameter that controls the strength
of the prior and IW(g, Λ) denotes the Inverse-Wishart
distribution with parameter g and scale matrix Λ.
A beta prior is assumed for the outlier rate,
|, (,),~Be
(7)
where (a
n
, b
n
) are hyperparameters associated w ith
the Beta pr ior. For the numerical results we set these as
(1,1) to give a uniform distribution.
A normal prior is assumed for the local GC content
regression parameters,
|~(, ),
N0
2
I
(8)
where I
p
is a p × p identity matrix.
A discrete prior is assumed for the stromal contami-
nation content and intra-tumour heterogeneity levels,
p()
,,
,,
0
0
0
0
0
0
0
=
=
>
⎧
⎨
⎪
⎩
⎪
(9)
and
pin
i
i
i
()
,,
,,
,,,
=
=
>
⎧
⎨
⎪
⎩
⎪
=…
0
0
1
(10)
where in the numerical results we have used a
π0
= b
π0
= 1 and a
π
=1,b
π
=2.
The tumor states are assumed to form an inhomoge-
neous Markov Chain with transition matrix,
p
ii
ii
ii
(| )
,
,
,
,
xx
xx
xx
−
−
−
=
−=
≠
⎧
⎨
⎪
⎩
⎪
1
1
1
1
(11)
where r = (1/2) (1-exp(-(1/2L)(s
i
-s
i-1
)ands
i
is the
physical coordinate of the i-th probe and L is a charac-
teristic length which we set as L = 2,000,000 for the
numerical results.
Posterior inference
We estimated the unknown model parameters using an
expectation-maximization algorithm. Multiple restarts
were used to explore different baseline of the L og R
Ratio and the baseline with the greatest likelihood was
chosen for the calculation of summary statistics.
Summary statistics
We used the Viterbi algorithm to extract the most
likely sequence of tumors states and for each aberrant
segment in the Viterbi sequence we calculated an
approximate Bayes Factor (score) of that segment
belonging to e ach of the tumor states. In addition we
also recorded the maximum a posteriori estimates of
the Log R Ratio baseline adjustment b
0
and the stro-
mal contamination π
0
.
Availability
A MATLAB based implementation (for 64 bit Linux
systems) of our software is available for academic and
non-commercial use from the associated website [45]. In
addition, SNP data analyzed in this paper are also avail-
ablefromthiswebsiteandfromtheGeneExpression
Omnibus Database under Accession No.[GEO:
GSE23785].
Additional material
Additional file 1: Supplementary methods. D etailed description of
statistical methodology.
Yau et al. Genome Biology 2010, 11:R92
/>Page 13 of 15
Additional file 2: Genome-wide analysis of three normal-cancer cell
line mixtures. Plots showing genome-wide copy number and LOH
analysis for three normal-cancer cell line mixture series.
Additional file 3: Genome-wide analysis of three primary breast
tumours. Plots showing genome-wide copy number and LOH analysis of
three primary breast tumours.
Abbreviations
aCGH: Array-based comparative genomic hybridization; BAF: B Allele
Frequency; CNV: Copy number variant; LOH: Loss of heterozygosity; LRR: Log
R Ratio; SNP: Single nucleotide polymorphisms.
Acknowledgements
The authors would like to thank Jean-Baptiste Cazier for general discussions
and careful reading of this manuscript, Rachel Natrajan and Jorge Reis-Filho
for discussion and advice on earlier versions of the work and Dan Peiffer
(Illumina) for providing the cell line data for HL-60 and HT-29. CY is funded
by a UK Medical Research Council Specialist Training Fellowship in
Biomedical Informatics (Reference No. G0701810) and previously by a UK
Engineering and Physical Sciences Research Council Life Sciences Interface
Doctoral Training Studentship. JR, GM and SC were supported by a
Wellcome Trust Grant 075491/Z/04/Z. DM, RJ and OS were supported by the
Hilton Ludwig Cancer Metastasis Initiative. OS is supported by National
Health and Medical Research Council Project Grant 489418. We also thank
the reviewers for useful comments.
Author details
1
Department of Statistics, University of Oxford, South Parks Road, Oxford,
OX1 3TG, UK.
2
Ludwig Colon Cancer Initiative Laboratory, Ludwig Institute
for Cancer Research, Royal Melbourne Hospital, Victoria 3050, Australia.
3
Wellcome Trust Centre for Human Genetics, University of Oxford, Roosevelt
Drive, Oxford, OX3 7BN, UK.
4
Molecular Oncology Laboratories, Department
of Medical Oncology, University of Oxford, Weatherall institute of Molecular
Medicine, Headington, Oxford OX3 9DS, UK.
5
MRC Harwell, Harwell Science
and Innovation Campus, Oxfordshire, OX11 0RD, UK.
6
Current Address:
UMR203 INRA INSA-Lyon BF2I, Biologie Fonctionnelle Insectes et Interactions,
Bat. L. Pasteur, 20 ave. A. Einstein, F-69621 Villeurbanne Cedex, France.
Authors’ contributions
CY, CCH, SC and JR conceived the method and generated initial ideas and
discussions. CY wrote and developed the OncoSNP algorithm. DM, RJ and
OS provided bioinformatics analysis and performed genotypi ng experiments
on cancer cell lines. GM, GS, AH and JR provided tumor samples and
performed genotyping experiments for the breast cancer analysis. CY, JR, OS
and CCH wrote the paper.
Received: 25 April 2010 Revised: 20 August 2010
Accepted: 21 September 2010 Published: 21 September 2010
References
1. Beroukhim R, Getz G, Nghiemphu L, Barretina J, Hsueh T, Linhart D,
Vivanco I, Lee JC, Huang JH, Alexander S, Du J, Kau T, Thomas RK, Shah K,
Soto H, Perner S, Prensner J, Debiasi RM, Demichelis F, Hatton C, Rubin MA,
Garraway LA, Nelson SF, Liau L, Mischel PS, Cloughesy TF, Meyerson M,
Golub TA, Lander ES, Mellinghoff IK, et al: Assessing the significance of
chromosomal aberrations in cancer: methodology and application to
glioma. Proc Natl Acad Sci USA 2007, 104:20007-20012.
2. Weir BA, Woo MS, Getz G, Perner S, Ding L, Beroukhim R, Lin WM,
Province MA, Kraja A, Johnson LA, Shah K, Sato M, Thomas RK, Barletta JA,
Borecki IB, Broderick S, Chang AC, Chiang DY, Chirieac LR, Cho J, Fujii Y,
Gazdar AF, Giordano T, Greulich H, Hanna M, Johnson BE, Kris MG, Lash A,
Lin L, Lindeman N, et al: Characterizing the cancer genome in lung
adenocarcinoma. Nature 2007, 450:893-898.
3. Caren H, Kryh H, Nethander M, Sjoberg RM, Trager C, Nilsson S,
Abrahamsson J, Kogner P, Martinsson T: High-risk neuroblastoma tumors
with 11q-deletion display a poor prognostic, chromosome instability
phenotype with later onset. Proc Natl Acad Sci USA 2010, 107:4323-4328.
4. Waddell N, Arnold J, Cocciardi S, da Silva L, Marsh A, Riley J, Johnstone CN,
Orloff M, Assie G, Eng C, Reid L, Keith P, Yan M, Fox S, Devilee P,
Godwin AK, Hogervorst FB, Couch F, Grimmond S, Flanagan JM, Khanna K,
Simpson PT, Lakhani SR, Chenevix-Trench G: Subtypes of familial breast
tumours revealed by expression and copy number profiling. Breast
Cancer Res Treat 2010, 123:661-677.
5. Bignell GR, Greenman CD, Davies H, Butler AP, Edkins S, Andrews JM,
Buck G, Chen L, Beare D, Latimer C, Widaa S, Hinton J, Fahey C, Fu B,
Swamy S, Dalgliesh GL, Teh BT, Deloukas P, Yang F, Campbell PJ,
Futreal PA, Stratton MR: Signatures of mutation and selection in the
cancer genome. Nature 2010, 463:893-898.
6. Beroukhim R, Mermel CH, Porter D, Wei G, Raychaudhuri S, Donovan J,
Barretina J, Boehm JS, Dobson J, Urashima M, Mc Henry KT, Pinchback RM,
Ligon AH, Cho YJ, Haery L, Greulich H, Reich M, Winckler W, Lawrence MS,
Weir BA, Tanaka KE, Chiang DY, Bass AJ, Loo A, Hoffman C, Prensner J,
Liefeld T, Gao Q, Yecies D, Signoretti S, et al: The landscape of somatic
copy-number alteration across human cancers. Nature 2010, 463:899-905.
7. Nannya Y, Sanada M, Nakazaki K, Hosoya N, Wang L, Hangaishi A,
Kurokawa M, Chiba S, Bailey DK, Kennedy GC, Ogawa S: A robust algorithm
for copy number detection using high-density oligonucleotide single
nucleotide polymorphism genotyping arrays. Cancer Res 2005,
65:6071-6079.
8. Komura D, Shen F, Ishikawa S, Fitch KR, Chen W, Zhang J, Liu G, Ihara S,
Nakamura H, Hurles ME, Lee C, Scherer SW, Jones KW, Shapero MH,
Huang J, Aburatani H: Genome-wide detection of human copy number
variations using high-density DNA oligonucleotide arrays. Genome Res
2006, 16:1575-1584.
9. Colella S, Yau C, Taylor JM, Mirza G, Butler H, Clouston P, Bassett AS,
Seller A, Holmes CC, Ragoussis J: QuantiSNP: an Objective Bayes Hidden-
Markov Model to detect and accurately map copy number variation
using SNP genotyping data. Nucleic Acids Res 2007, 35:2013-2025.
10. Wang K, Li M, Hadley D, Liu R, Glessner J, Grant SF, Hakonarson H, Bucan M:
PennCNV: an integrated hidden Markov model designed for high-
resolution copy number variation detection in whole-genome SNP
genotyping data. Genome Res 2007, 17:1665-1674.
11. Korn JM, Kuruvilla FG, McCarroll SA, Wysoker A, Nemesh J, Cawley S,
Hubbell E, Veitch J, Collins PJ, Darvishi K, Lee C, Nizzari MM, Gabriel SB,
Purcell S, Daly MJ, Altshuler D: Integrated genotype calling and
association analysis of SNPs, common copy number polymorphisms and
rare CNVs. Nat Genet 2008, 40:1253-1260.
12. Lindblad-Toh K, Tanenbaum DM, Daly MJ, Winchester E, Lui WO,
Villapakkam A, Stanton SE, Larsson C, Hudson TJ, Johnson BE, Lander ES,
Meyerson M: Loss-of-heterozygosity analysis of small-cell lung
carcinomas using single-nucleotide polymorphism arrays. Nat Biotechnol
2000, 18:1001-1005.
13. Zhao X, Li C, Paez JG, Chin K, Janne PA, Chen TH, Girard L, Minna J,
Christiani D, Leo C, Gray JW, Sellers WR, Meyerson M: An integrated view
of copy number and allelic alterations in the cancer genome using
single nucleotide polymorphism arrays. Cancer Res 2004, 64:3060-3071.
14. LaFramboise T, Weir BA, Zhao X, Beroukhim R, Li C, Harrington D,
Sellers WR, Meyerson M: Allele-specific amplification in cancer revealed
by SNP array analysis. PLoS Comput Biol 2005, 1:e65.
15. Diskin SJ, Li M, Hou C, Yang S, Glessner J, Hakonarson H, Bucan M,
Maris JM, Wang K: Adjustment of genomic waves in signal intensities
from whole-genome SNP genotyping platforms. Nucleic Acids Res 2008,
36:e126.
16. Peiffer DA, Le JM, Steemers FJ, Chang W, Jenniges T, Garcia F, Haden K, Li J,
Shaw CA, Belmont J, Cheung SW, Shen RM, Barker DL, Gunderson KL: High-
resolution genomic profiling of chromosomal aberrations using Infinium
whole-genome genotyping. Genome Res 2006, 16:1136-1148.
17. Attiyeh EF, Diskin SJ, Attiyeh MA, Mosse YP, Hou C, Jackson EM, Kim C,
Glessner J, Hakonarson H, Biegel JA, Maris JM: Genomic copy number
determination in cancer cells from single nucleotide polymorphism
microarrays based on quantitative genotyping corrected for aneuploidy.
Genome Res 2009, 19:276-283.
18. Bengtsson H, Irizarry R, Carvalho B, Speed TP: Estimation and assessment
of raw copy numbers at the single locus level. Bioinformatics 2008,
24:759-767.
19. Bengtsson H, Neuvial P, Speed TP: TumorBoost: normalization of allele-
specific tumor copy numbers from a single pair of tumor-normal
genotyping microarrays. BMC Bioinformatics 2010, 11:245.
Yau et al. Genome Biology 2010, 11:R92
/>Page 14 of 15
20. Goransson H, Edlund K, Rydaker M, Rasmussen M, Winquist J, Ekman S,
Bergqvist M, Thomas A, Lambe M, Rosenquist R, Holmberg L, Micke P,
Botling J, Isaksson A: Quantification of normal cell fraction and copy
number neutral LOH in clinical lung cancer samples using SNP array
data. PLoS One 2009, 4:e6057.
21. Greenman CD, Bignell G, Butler A, Edkins S, Hinton J, Beare D, Swamy S,
Santarius T, Chen L, Widaa S, Futreal PA, Stratton MR: PICNIC: an algorithm
to predict absolute allelic copy number variation with microarray cancer
data. Biostatistics 2010, 11:164-175.
22. Lamy P, Andersen CL, Dyrskjot L, Torring N, Wiuf C: A Hidden Markov
Model to estimate population mixture and allelic copy-numbers in
cancers using Affymetrix SNP arrays. BMC Bioinformatics 2007, 8:434.
23. Popova T, Manie E, Stoppa-Lyonnet D, Rigaill G, Barillot E, Stern MH:
Genome Alteration Print (GAP): a tool to visualize and mine complex
cancer genomic profiles obtained by SNP arrays. Genome Biol 2009, 10:
R128.
24. Staaf J, Lindgren D, Vallon-Christersson J, Isaksson A, Goransson H,
Juliusson G, Rosenquist R, Hoglund M, Borg A, Ringner M: Segmentation-
based detection of allelic imbalance and loss-of-heterozygosity in cancer
cells using whole genome SNP arrays. Genome Biol 2008, 9:R136.
25. Sun W, Wright FA, Tang Z, Nordgard SH, Van Loo P, Yu T, Kristensen VN,
Perou CM: Integrated study of copy number states and genotype calls
using h igh-density SNP arrays. Nucleic Acids Res 2009, 37:5365-5377.
26. Wang K, Li J, Li S, Bolund L, Wiuf C: Estimation of tumor heterogeneity
using CGH array data. BMC Bioinformatics 2009, 10:12.
27. Yamamoto G, Nannya Y, Kato M, Sanada M, Levine RL, Kawamata N,
Hangaishi A, Kurokawa M, Chiba S, Gilliland DG, Koeffler HP, Ogawa S:
Highly sensitive method for genomewide detection of allelic
composition in nonpaired, primary tumor specimens by use of
affymetrix single-nucleotide-polymorphism genotyping microarrays. Am
J Hum Genet 2007, 81:114-126.
28. Yau C, Holmes CC: CNV discovery using SNP genotyping arrays. Cytogenet
Genome Res 2008, 123:307-312.
29. LaFramboise T: Single nucleotide polymorphism arrays: a decade of
biological, computational and technological advances. Nucleic Acids Res
2009, 37:4181-4193.
30. Ragoussis J: Genotyping technologies for genetic research. Annu Rev
Genomics Hum Genet 2009, 10:117-133.
31. Winchester L, Yau C, Ragoussis J: Comparing CNV detection methods for
SNP arrays. Brief Funct Genomic Proteomic 2009, 8:353-366.
32. Pfeifer D, Pantic M, Skatulla I, Rawluk J, Kreutz C, Martens UM, Fisch P,
Timmer J, Veelken H: Genome-wide analysis of DNA copy number
changes and LOH in CLL using high-density SNP arrays. Blood 2007,
109:1202-1210.
33. Staaf J, Vallon-Christersson J, Lindgren D, Juliusson G, Rosenquist R,
Hoglund M, Borg A, Ringner M: Normalization of Illumina Infinium whole-
genome SNP data improves copy number estimates and allelic intensity
ratios. BMC Bioinformatics 2008, 9:409.
34. Gardina PJ, Lo KC, Lee W, Cowell JK, Turpaz Y: Ploidy status and copy
number aberrations in primary glioblastomas defined by integrated
analysis of allelic ratios, signal ratios and loss of heterozygosity using
500K SNP Mapping Arrays. BMC Genomics 2008, 9:489.
35. Marioni JC, Thorne NP, Valsesia A, Fitzgerald T, Redon R, Fiegler H,
Andrews TD, Stranger BE, Lynch AG, Dermitzakis ET, Carter NP, Tavare S,
Hurles ME: Breaking the waves: improved detection of copy number
variation from microarray-based comparative genomic hybridization.
Genome Biol 2007, 8:R228.
36. Abdel-Rahman WM, Katsura K, Rens W, Gorman PA, Sheer D, Bicknell D,
Bodmer WF, Arends MJ, Wyllie AH, Edwards PA: Spectral karyotyping
suggests additional subsets of colorectal cancers characterized by
pattern of chromosome rearrangement. Proc Natl Acad Sci USA 2001,
98:2538-2543.
37. Liang JC, Ning Y, Wang RY, Padilla-Nash HM, Schrock E, Soenksen D,
Nagarajan L, Ried T: Spectral karyotypic study of the HL-60 cell line:
detection of complex rearrangements involving chromosomes 5, 7, and
16 and delineation of critical region of deletion on 5q31.1. Cancer Genet
Cytogenet 1999, 113:105-109.
38. Rowan A, Halford S, Gaasenbeek M, Kemp Z, Sieber O, Volikos E, Douglas E,
Fiegler H, Carter N, Talbot I, Silver A, Tomlinson I: Refining molecular
analysis in the pathways of colorectal carcinogenesis. Clin Gastroenterol
Hepatol 2005, 3:1115-1123.
39. Chiang DY, Getz G, Jaffe DB, O’Kelly MJ, Zhao X, Carter SL, Russ C,
Nusbaum C, Meyerson M, Lander ES: High-resolution mapping of copy-
number alterations with massively parallel sequencing. Nat Methods
2009, 6:99-103.
40. Pleasance ED, Stephens PJ, O’Meara S, McBride DJ, Meynert A, Jones D,
Lin ML, Beare D, Lau KW, Greenman C, Varela I, Nik-Zainal S, Davies HR,
Ordonez GR, Mudie LJ, Latimer C, Edkins S, Stebbings L, Chen L, Jia M,
Leroy C, Marshall J, Menzies A, Butler A, Teague JW, Mangion J, Sun YA,
McLaughlin SF, Peckham HE, Tsung EF, et al: A small-cell lung cancer
genome with complex signatures of tobacco exposure. Nature 2010,
463:184-190.
41. Stephens PJ, McBride DJ, Lin ML, Varela I, Pleasance ED, Simpson JT,
Stebbings LA, Leroy C, Edkins S, Mudie LJ, Greenman CD, Jia M, Latimer C,
Teague JW, Lau KW, Burton J, Quail MA, Swerdlow H, Churcher C,
Natrajan R, Sieuwerts AM, Martens JW, Silver DP, Langerod A, Russnes HE,
Foekens JA, Reis-Filho JS, van’t Veer L, Richardson AL, Borresen-Dale AL,
et al: Complex landscapes of somatic rearrangement in human breast
cancer genomes. Nature 2009, 462:1005-1010.
42. Ding L, Ellis MJ, Li S, Larson DE, Chen K, Wallis JW, Harris CC, McLellan MD,
Fulton RS, Fulton LL, Abbott RM, Hoog J, Dooling DJ, Koboldt DC,
Schmidt H, Kalicki J, Zhang Q, Chen L, Lin L, Wendl MC, McMichael JF,
Magrini VJ, Cook L, McGrath SD, Vickery TL, Appelbaum E, Deschryver K,
Davies S, Guintoli T, Lin L, et al: Genome remodelling in a basal-like
breast cancer metastasis and xenograft. Nature 2010, 464:999-1005.
43. GAP [ />44. GenoCN [ />45. OncoSNP
[ />doi:10.1186/gb-2010-11-9-r92
Cite this article as: Yau et al.: A statistical approach for detecting
genomic aberrations in heterogeneous tumor samples from single
nucleotide polymorphism genotyping data. Genome Biology 2010 11:R92.
Submit your next manuscript to BioMed Central
and take full advantage of:
• Convenient online submission
• Thorough peer review
• No space constraints or color figure charges
• Immediate publication on acceptance
• Inclusion in PubMed, CAS, Scopus and Google Scholar
• Research which is freely available for redistribution
Submit your manuscript at
www.biomedcentral.com/submit
Yau et al. Genome Biology 2010, 11:R92
/>Page 15 of 15