Báo cáo y học: "Improved variant discovery through local re-alignment of short-read next-generation sequencing data using SRMA" pot
Bạn đang xem bản rút gọn của tài liệu. Xem và tải ngay bản đầy đủ của tài liệu tại đây (1.67 MB, 12 trang )
Homer and Nelson Genome Biology 2010, 11:R99
/>
METHOD
Open Access
Improved variant discovery through local
re-alignment of short-read next-generation
sequencing data using SRMA
Nils Homer1,2,3*, Stanley F Nelson2
Abstract
A primary component of next-generation sequencing analysis is to align short reads to a reference genome, with
each read aligned independently. However, reads that observe the same non-reference DNA sequence are highly
correlated and can be used to better model the true variation in the target genome. A novel short-read micro realigner, SRMA, that leverages this correlation to better resolve a consensus of the underlying DNA sequence of the
targeted genome is described here.
Background
Whole-genome human re-sequencing is now feasible
using next generation sequencing technology. Technologies such as those produced by Illumina, Life, and
Roche 454 produce millions to billions of short DNA
sequences that can be used to reconstruct the diploid
sequence of a human genome. Ideally, such data alone
could be used to de novo assemble the genome in question [1-6]. However, the short read lengths (25 to 125
bases), the size and repetitive nature of the human genome (3.2 × 10⁹ bases), as well as the modest error rates
(approximately 1% per base) make such de novo
assembly of mammalian genomes intractable. Instead,
short-read sequence alignment algorithms have been
developed to compare each short sequence to a reference genome [7-12]. Observing multiple reads that differ
similarly from the reference sequence in their respective
alignments identifies variants. These alignment algorithms have made it possible to accurately and efficiently
catalogue many types of variation between human individuals and those causative for specific diseases.
Because alignment algorithms map each read independently to the reference genome, alignment artifacts
could result, such that SNPs, insertions, and deletions
are improperly placed relative to their true location.
This leads to local alignment errors due to a
* Correspondence:
1
Department of Computer Science, University of California - Los Angeles,
Boelter Hall, Los Angeles, CA 90095, USA
Full list of author information is available at the end of the article
combination of sequencing error, equivalent positions of
the variant being equally likely, and adjacent variants or
nearby errors driving misalignment of the local
sequence. These local misalignments lead to false positive variant detection, especially at apparent heterozygous positions. For example, insertions and deletions
towards the ends of reads are difficult to anchor and
resolve without the use of multiple reads. In some cases,
strict quality and filtering thresholds are used to overcome the false detection of variants, at the cost of reducing power [13]. Since each read represents an
independent observation of only one of two possible
haplotypes (assuming a diploid genome), multiple read
observations could significantly reduce false-positive
detection of variants. Algorithms to solve the multiple
sequence alignment problems typically compare multiple
sequences to one another in the final step of fragment
assembly. These algorithms use graph-based approaches,
including weighted sequence graphs [14,15] and partial
order graphs [16,17]. Read re-alignment methods also
have been developed [2,18] for finishing fragment
assembly but have not been applied to the short reads
produced by next generation sequencing technologies.
In this study, a new method to perform local re-alignment of short reads is described, called SRMA: the
Short-Read Micro re-Aligner. Short-read sequence alignment to a reference genome and de novo assembly are
two approaches to reconstruct individual human genomes. Our proposed method has the advantage of utilizing previously developed short-read mapping as the
© 2010 Homer and Nelson; licensee BioMed Central Ltd. This is an open access article distributed under the terms of the Creative
Commons Attribution License ( which permits unrestricted use, distribution, and
reproduction in any medium, provided the original work is properly cited.
Homer and Nelson Genome Biology 2010, 11:R99
/>
input, coupled with an assembly-inspired approach
applied over discrete small windows of the genome
whereby multiple reads are used to identify a local consensus sequence. The proposed method overcomes problems specific to alignment and genome-wide assembly,
respectively, with the former treating reads independently and the latter requiring nearly error-free data.
Unlike de novo assembly, SRMA only finds a novel
sequence variant if at least one read in the initial alignment previously observed this variant. De novo assembly
algorithms, such as ABySS and Velvet [1-3,5,6,19], could
be applied to reads aligned to local regions of the genome to produce a local consensus sequence, which
would need to be put in context to the reference
sequence. This approach may still show low sensitivity
due to the moderate error found in the data and has
not been implemented in practice. For this reason, an
important contribution of SRMA is to automate the
return of alignments for each read relative to the
reference.
SRMA uses the prior alignments from a standard
sequence alignment algorithm to build a variant graph
in defined local regions. The locally mapped reads in
their original form are then re-aligned to this variant
graph to produce new local alignments. This relies on
the presence of at least one read that observes the correct variant, which is subsequently used to inform the
alignments of the other overlapping reads. Observed
variants are incorporated into a variant graph, which
allows for alignments to be re-positioned using information provided by the multiple reads overlapping a given
base. We demonstrate through human genomic DNA
simulations and empirical data that SRMA improved
sensitivity to correctly identify variants and to reduce
false positive variant detection.
Page 2 of 12
decoded base sequence and base qualities produced by
BWA were used by SRMA. The aligned reads were used
for variant calling before and after local SRMA re-alignment by implementing the MAQ consensus model
within SAMtools [10,20].
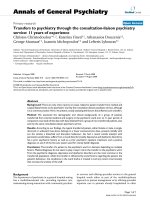
In Figure 1, we plot receiver operator characteristic
(ROC) curves for the detection of the known SNPs,
deletions, and insertions. For all types of variants, performing local re-alignment with SRMA greatly reduced
the false-positive rate while maintaining the same level
or increased sensitivity prior to SRMA. The false-positive reduction is more evident for indels, largely due to
the ambiguity of placing indels relative to the reference
sequence based on the initial gapped alignment. At this
level of mean coverage, false discovery can be reduced
to a rate of 10-6 for all variants while maintaining >80%
power (sensitivity). We note that because inserted bases
are directly observed, insertions are more powerfully
corrected to the actual sequence relative to deletions.
This may help explain the relatively greater improvement in the false positive rate for insertions over deletions at comparable sensitivities.
These simulations assumed ideal conditions: no genomic contamination, a simple error model with a modest
uniform error rate, and a simplification that includes
only a subset of all possible variants (SNPs, deletions,
and insertions). Nevertheless, the false positive rates
achieved after variant calling with no filtering criteria
applied is striking and indicates that local re-alignment
can be a powerful tool to improve variant calling from
short read sequencing. Longer insertions (>5 bp) are not
sufficiently examined in the simulation model. However,
we note that longer indels are supported by SRMA, but
SRMA requires that the initial global alignment permits
the sensitive alignment of reads with longer indels to
the approximate correct genomic position.
Results and discussion
Local re-alignment of simulated data
Local re-alignment of empirical data
To assess the performance of local re-alignment on a
dataset with a known diploid sequence, two whole genome human re-sequencing experiments were simulated
(see Materials and methods) to generate 1 billion 50
base-paired end reads for a total of 100 Gb of genomic
sequence representing a mean haploid coverage of 15 ×
for either Illumina or ABI SOLiD data. SNPs, small
deletions, and small insertions were introduced to provide known variants and test improvements of SRMA
for their discovery genome-wide, as described in the
Materials and methods. The data were initially aligned
with BWA (the Burrows Wheeler Alignment tool) [9]
and then locally re-aligned with SRMA. For ABI SOLiD
data, SRMA is able to utilize the original color sequence
and qualities in their encoded form. However, BWA
does not retain this information, so that only the
To assess the performance of local re-alignment with
SRMA on a real-world dataset, a previously published
whole-genome human cancer cell line (U87MG) was
used (SRA009912.1) [13]. This dataset was aligned with
BFAST (Blat-like Fast Accurate Search Tool) [7], which
reported the original color sequence and color qualities
accompanying each alignment. This allows local realignment to be performed in color space by adapting
the existing two-base encoding algorithm to work on
the variant graph structure [12,21]. The aligned
sequences were then used for variant-calling with SAMtools [20], which also reported the zygosity of each call.
In the case of SNPs called from color space (two-base
encoded) data, the decoded reads can be improperly
decoded such that SNP positions have a reference allele
bias, which is reflected in the original alignments. Thus, in
Homer and Nelson Genome Biology 2010, 11:R99
/>
Page 3 of 12
Figure 1 Local re-alignment receiver operator characteristic curves for simulated human genome re-sequencing data. A synthetic
diploid human genome with SNPs, deletions, and insertions was created from a reference human genome (hg18) as described in main text.
One billion paired 50-mer reads for both base space and color space were simulated from this synthetic genome to assess the true positive and
false positive rates of variant calling after re-sequencing. An increasing SNP quality filter was used to generate each curve. The simulated dataset
was aligned with BWA (v.0.5.7-5) with the default parameters [9]. The alignments from BWA and SRMA were variant called using the MAQ
consensus model implemented in SAMtools (v.0.1.17) using the default settings [10,20]. For the simulated datasets, the resulting variant calls
were assessed for accuracy by comparing the called variants against the known introduced sites of variation. The BWA alignments were locally
re-aligned with SRMA with variant inclusive settings (c = 2 and p = 0.1).
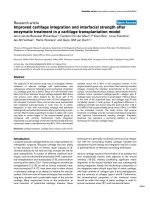
order to assess if SRMA is improving the overall fraction of
reads appropriately aligned, we analyzed in aggregate all
variant positions to determine if the ratio of reference/variants at heterozygous positions is shifted towards the
expected 50%. With respect to heterozygous-called variants,
a binomial distribution centered around 0.5 frequency
based on sampling/coverage is expected. The observed variant allele frequency after SRMA is substantially shifted
towards this expected distribution (Figure 2). Similarly, at
homozygous positions, the non-reference allele is substantially closer to 100% across observed variant positions for
SNPs, deletions, and insertions (Figure 2). For example, the
Homer and Nelson Genome Biology 2010, 11:R99
/>
Page 4 of 12
Figure 2 Allele frequency distribution with local re-alignment of U87MG. SRMA was applied to the alignments produced with BFAST of a
human cancer cell line (U87MG; SRA009912.1). Variants were called with SAMtools before and after application of SRMA (see Materials and
methods). Homozygous and heterozygous calls were examined independently using zygosity calls produced by SAMtools. The observed nonreference allele frequency for SNPs, deletions, and insertions are plotted for homozygous (left panels) or heterozygous variants (right panels).
Ideally, non-reference allele frequencies for homozygous and heterozygous variants approach 1.0 and 0.5, respectively. The absolute counts of
observed variants are plotted (y-axis) against non-reference allele frequency ranges (x-axis).
Homer and Nelson Genome Biology 2010, 11:R99
/>
median allele frequencies for heterozygous SNPs, deletions,
and insertions before SRMA were 0.404, 0.038, and 0.038,
respectively, and after SRMA were 0.434, 0.538, and 0.328,
respectively. This demonstrates the ability of SRMA to
improve variant calling, especially for indels.
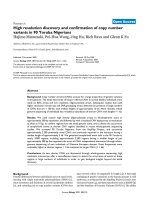
To further examine the accuracy of the variant calls
genome-wide, indels were compared to the known database of common variants found in dbSNP (dbSNP Build
ID: 129) [22]. We sought to determine if the indel
matches a previously observed indel in dbSNP, which is
plotted as the discordance rate (one minus concordance;
Figure 3). An indel was called concordant if the length
of the called indel matched that of any indel in dbSNP
within five bases. This ‘wiggle’ of five bases was used
since the precise location of an indel relative to the
reference is not always systematically and consistently
described in dbSNP. SRMA improves the concordance
between observed indels within the sequencing data and
indels reported in dbSNP. The discordance rate of indels
is inflated due to the lack of completeness within the
variant databases, as well as artifacts introduced by tandem repeats, and artifacts related to the arbitrary position of indels relative to the reference in dbSNP.
However, using similar metrics, SRMA measurably
improves the concordance: greater than 99% of SNPs
(data not shown) and greater than 90% of indels were
concordant with dbSNP regardless of the stringency
threshold applied.
Page 5 of 12
To further assess the quality of SNP calls, heterozygous
genotypes from an Illumina SNP microarray were compared with genotypes called from sequence data before
and after application of SRMA to estimate SNP concordance. In Figure 4, the concordance between heterozygous
calls and genotypes is reported after filtering positions
using three metrics: consensus quality, base coverage, and
SNP quality. A true positive occurred if a heterozygous
SNP was called with the sequence data and genotyped as a
heterozygote. A genotype was discordant if a heterozygous
SNP was called with the sequence data but the genotype
was called homozygous on the DNA microarray. For all
metrics, local SRMA re-alignment reduces the discordance
rate while preserving sensitivity. It is interesting to note
that the discordance rate after SRMA approaches the
assumed DNA microarray error rate, thus limiting further
utility of this type of comparison.
The variant calls of SRMA are improved genome-wide
by SRMA, and several dramatic examples of sequence
improvement can be demonstrated. For instance, a 15bp deletion flanked by a nearby C-to-T SNP was
observed in the coding sequence of ALPK2 in the original BFAST alignments of U87MG and was confirmed
by Sanger sequencing. However, a large fraction of the
original alignments did not contribute to the calling of
this haploid event (Figure 5a), instead displaying spurious SNPs, deletions, and insertions. This nicely demonstrates the inherent difficulty of comparing a short read
Figure 3 dbSNP concordance before and after local re-alignment of U87MG. SRMA was applied to the alignments produced with BFAST of
a human cancer cell line (U87MG; SRA009912.1). Variants were called with SAMtools before and after application of SRMA (see Materials and
methods). Deletions and insertions (indels) called within U87MG were compared with those indels reported in dbSNP (v129). An increasing
minimum SNP quality filter was used to improve concordance (y-axis) while reducing the number of indels observed at dbSNP positions (x-axis).
Using SRMA significantly reduced the discordance (one minus concordance) between observed indels at dbSNP positions.
Homer and Nelson Genome Biology 2010, 11:R99
/>
Page 6 of 12
Figure 4 SNP microarray concordance with known genotypes before and after local re-alignment of U87MG. SRMA was applied to the
alignments produced with BFAST of a human cancer cell line (U87MG; SRA009912.1). Heterozygous genotypes from an Illumina SNP microarray
were compared with genotypes called from sequence data before and after application of SRMA (see Materials and methods). A minimum
threshold on three different variant-calling metrics was applied, respectively, to improve the concordance (y-axis) while reducing the total
number of SNP positions on the microarray that were called. Regardless of the metric, SRMA reduced the discordance (one minus concordance)
of heterozygous SNPs reported by the SNP microarray and sequencing data.
sequence to a reference sequence in the presence of variation and sequencing error, even though the short reads
were all aligned to the correct location in the genome.
After re-alignment with SRMA (Figure 5b), the majority
of the reads support both the 15-bp deletion and SNP,
while false variation has been virtually eliminated.
Performance of local re-alignment
The running time and memory required by this re-alignment procedure is based on the number of start nodes
as well as the complexity of the variant graph. More
start nodes (larger w) will increase the number of paths
examined. Furthermore, any variant within the graph
will lead to a larger branching factor (nodes with multiple neighbors either upstream or downstream) and
increase the number of paths examined. Highly polymorphic genomes will also increase the graph’s complexity. The complexity of the graph is also influenced
by the sequencing technology. For technologies that
sequence DNA bases directly, sequencing errors that are
indistinguishable from variants will thus be represented
in the graph. The two-base encoded data produced by
the ABI SOLiD system in practice tends to have fewer
spurious variants. With such an encoding, it is more difficult to interpret sequencing error in the encoded color
sequence in such a fashion as to produce base changes
Homer and Nelson Genome Biology 2010, 11:R99
/>
Page 7 of 12
Figure 5 A deletion and SNP in ALPK2 in U87MG. SRMA was applied to the alignments produced with BFAST of a human cancer cell line
(U87MG; SRA009912.1). (a,b) The resulting alignments from within the coding region of ALPK2 (chr18:54,355,303-54,355,477) are shown before
applying SRMA (a) and after applying SRMA (b). In this haploid region, Sanger sequencing confirmed a 15-bp deletion and a C-to-T SNP eight
bases downstream of the deletion. Panel (a) shows the difficulty of aligning sequence reads from a region with a large deletion and a SNP, as
false variation is observed (SNPs and indels). Nevertheless, some reads in (a) (BFAST) do correctly observe the deletion and SNP, which are
therefore included in the variant graph created by SRMA. After local re-alignment using SRMA (b), the majority of the reads support the
presence of the deletion and SNP, while false variation has been eliminated. The Integrated Genomics Viewer was used to view the alignments
[30].
in the decoded base sequence. Nevertheless, without filtering using the c or p parameters, any observed base
difference from an alignment will be included in the
graph. Therefore, setting reasonable parameters for
c and p beyond removing spurious variants is important
to bound the number of search paths and make realignment computationally feasible. In practice, the settings used in our evaluations (c = 2 and p = 0.1) work
well for human genome re-sequencing experiments
SRMA was run in a Map-Reduce framework using a
cluster submission script (for Sun Grid Engine (SGE) or
Portable Batch System (PBS) systems) provided with the
SRMA distribution. The alignments to the reference
genome were implicitly split into 1-Mb regions and processed in parallel on a large computer cluster; the realignments from each region were then merged in a
hierarchical fashion. This allows for the utilization of
multi-core computers, with one re-alignment per core,
as well as parallelization across a computer cluster or a
cloud. The average peak memory utilization per process
was 876 Mb (on a single-core), with a maximum peak
memory utilization of 1.25 GB. On average, each 1-Mb
region required approximately 2.58 minutes to complete,
requiring approximately 86.17 hours total running time
for the whole U87MG genome. SRMA also supports realignment within user-specified regions for efficiency, so
that only regions of interest need to be re-aligned. This
is particularly useful for exome-sequencing or targeted
re-sequencing data.
Conclusions
Here we describe a novel local re-alignment algorithm,
SRMA, which can significantly reduce the false positive
variant detection rate with short-read next generation
sequencing technology. While global sequence alignment examines each read independently, multiple reads
aligned over a common position are highly correlated
especially when a single diploid genome is being
sequenced. SRMA uses these correlated alignments to
build a limited graph structure that represents these
Homer and Nelson Genome Biology 2010, 11:R99
/>
alignments and their differences in compact form such
that the alternative allele is more readily observed. The
original reads are then re-aligned within a local coordinate window to improve the resulting alignments relative to the target genome rather than a reference
genome.
Simulations of whole genome human re-sequencing
data from both ABI SOLiD and Illumina sequencing
technology were used to assess SRMA under simplified
conditions in which the variant positions and alleles are
known. SRMA was able to improve the ultimate variant
calling using a variety of measures on the simulated
data from two different popular aligners, BWA and
BFAST. These aligners were selected based on their sensitivity to insertions and deletions since a property of
SRMA is that it produces a better consensus around
indel positions. The initial alignments from BFAST
allow local SRMA re-alignment using the original color
sequence and qualities to be assessed as BFAST retains
this color space information. This further reduces the
bias towards calling the reference allele at SNP positions
in ABI SOLiD data, and reduces the false discovery rate
of new variants. Thus, local re-alignment is a powerful
approach to improving genomic sequencing with next
generation sequencing technologies.
We note as well that while clearly demonstrating
improvements in human genomic sequencing, more
substantial improvements in variant discovery would be
expected when a more distantly related genome is used
as the reference. Currently, SRMA does not support
enumerating over insertions or deletions caused by
homopolymer errors that can be found in 454 data and
other flow-based technologies. Nevertheless, similar to
utilizing the original color sequence for ABI SOLiD
data, the original flow-space data from 454 data could
be used during re-alignment and represents future work.
Incorporating known variants, for example from dbSNP,
into the variant graph as a prior also represents future
work. SRMA is publicly available under the GPL license
at [23].
Materials and methods
Overview of SRMA
This method relies on short-read alignment algorithms to
first align each read to a reference sequence [7-12]. After
all reads are aligned, they are passed to SRMA for realignment. SRMA first builds a variant graph from these
initial alignments. Once the variant graph is built, all
reads are re-aligned to the variant graph. If the new alignment compared to the original is found, it is reported and
annotated as being re-aligned by SRMA, otherwise the
original alignment is reported. A novel aspect of this
method is the process of building the variant graph iteratively for each genomic region, while reporting new
Page 8 of 12
alignments for each read initially aligned within that
region. While de novo assembly (or re-assembly) algorithms report novel sequences without comparing the
reads to a reference sequence, this method provides new
improved alignments relative to a reference sequence
improving downstream consensus calling. Iterative application of SRMA is possible, whereby further rounds of
building a variant graph and read re-alignment are performed, but is not examined here.
Creating a variant graph from existing alignments
Here we seek to use individual sequence reads to create a
series of possible variant options that include the true
variants present within the target genome being
sequenced. Ultimately, the goal is to distinguish between
true variants and sequencing errors genome-wide. Since,
in the interest of novel mutation discovery, we must
allow for all possible base positions being variant, as well
as for an exponentially larger number of possible indels,
we opt for an approach that creates a variant graph that
includes all aligned reads at a given position in the genome prior to performing re-alignment. This graph is a
compact mathematical representation of the initially
determined alignments. Each alignment is represented as
a path through the graph, although not every path
through the graph corresponds to an actual alignment.
The variant graph is composed of nodes. Each node
represents a DNA base at a specific position relative to
the forward strand of the reference genome. Two nodes
share an undirected edge if they are adjacent read bases
in an existing alignment. For example, the variant graph
of the reference sequence that is aligned perfectly to
itself consists of one node per reference base, with edges
connecting nodes that represent adjacent bases in the
reference. In this case, the variant graph has one path.
To properly order the nodes in the graph relative to the
reference, each node is also assigned a position and an
offset. The offset is non-zero only if the node represents
an insertion relative to the reference. Insertions relative
to the reference are given the reference position of the
next non-inserted base with higher physical position on
the forward strand, and with its offset set as the number
of bases from the beginning of the insertion. Insertions
at the same reference position can be combined by merging the paths that represent their longest common prefix and longest common suffix, respectively. A single
nucleotide substitution would be annotated to have the
same position as its relative reference base. In summary,
nodes are described as three distinct types: reference,
substitution, and insertion. A node’s position, base, type,
and offset are unique among all nodes in the graph and
define a canonical ordering over all nodes in the graph.
Initially, the graph is empty. Bases that match the
reference and variants are incorporated into the graph
Homer and Nelson Genome Biology 2010, 11:R99
/>
by adding new nodes and edges. Substitutions and insertions are represented as additional nodes in the graph.
Deletions, on the other hand, are added as edges that
connect nodes that have a positional difference greater
than one. An example of creating a variant graph from
four alignments is shown in Figure 6. The variant graph
also stores the number of alignments that pass through
each node and edge, corresponding to the coverage.
This is useful for eliminating unlikely paths when performing re-alignment and will be discussed later.
Alignment to a variant graph
Once the variant graph is constructed from all aligned
reads, local re-alignment of the reads proceeds through a
series of weighted steps to optimize the final alignments.
The variant graph is not modified after re-alignment
begins. A dynamic programming procedure is used to
compare a read to the variant graph in a similar manner
to the Smith-Waterman algorithm [24-27]. Each path
through the graph represents a potential (new) alignment. All paths that begin within w base positions from
the start of the existing alignment are considered as start
nodes for a new alignment. A node in the graph is visited
at most w times per re-alignment, even though every
path reachable from a starting node is examined. Note
that the direction of the paths through the graph match
the direction implied by the strand of the original alignment. Therefore, the graph is a directed acyclic graph
(DAG) during each local re-alignment, with a partial
ordering imposed on the nodes as was explained earlier
(position, base, type, and offset). All valid paths from the
starting nodes can be efficiently examined using a
breadth-first traversal using a heap data structure.
The heap stores nodes sorted by their partial order,
the current path length, and the current alignment
score, in that order; the path length and alignment score
are also stored in the heap. Initially, the start nodes are
added to the heap with a path length of one and an
alignment score based on comparing the read’s first
base to the base represented by the start node. If the
read base matches the start node base, then no penalty
is added to the previous re-alignment score. Otherwise,
a negative score based on the original base quality of
the read is added to the previous re-alignment score to
return the current re-alignment score. Other alignment
scoring schemes are possible, but mismatched bases are
scored using base quality since it has been shown to
improve alignment quality [28].
The heap is polled while it is non-empty. Paths to the
given node that have the same path length and a smaller
alignment score can be removed (from the top of the
heap) to remove suboptimal alignment paths. Paths to
the same node but with different lengths result from differing start nodes, deletions, and insertions. This
Page 9 of 12
pruning step uses a dynamic programming procedure,
where the best paths to and from the current node are
assumed to be conditionally independent given their
respective path lengths (number of read bases examined). Next, if the path length equals the length of the
read, all of the bases in the read have been examined.
The best (highest alignment score) complete path, if
any, is compared to the current path and updated
accordingly. Otherwise, the path is extended to each
child (successor) of the given node. For each child node,
the child node’s base is compared to the corresponding
base in the read (determined by the path length), with
the alignment score modified as above. The child node,
incremented path length, and updated alignment score
are added to the heap. Once the heap is empty, the path
with the best score is returned to give a new alignment.
This new alignment may match or differ from the original alignment depending on the graph structure.
As observed during graph creation, the original alignment is represented as a path through the graph, and
therefore will be reconsidered during re-alignment. In
fact, the original alignment can be used to set a bound
on the minimum re-alignment score. Since the alignment score implemented above decreases monotonically,
any path with lower alignment score than the original
alignment can be removed from the heap. If the original
alignment is likely to be the best alignment after realignment, then this bound significantly reduces the
practical running time of local re-alignment.
The entire variant graph does not need to be constructed before beginning re-alignment, but rather only
nodes in the graph that are reachable from the starting
nodes need be considered. Therefore, only original
alignments that pass through any of these reachable
nodes need to be included when creating the variant
graph for a specific alignment. Thus, the variant graph
can be dynamically built from previous read alignments,
with nodes removed from the graph when no longer
reachable from the next read re-alignment. This allows
only a small local window of the variant graph to be
explicitly built and kept in memory, significantly reducing memory requirements.
Accounting for sampling and coverage
Two input parameters prune potential alignment paths
through the graph: minimum node/edge coverage, and
minimum edge probability. Given a minimum node/
edge coverage c, only nodes observed in least c original
alignments are considered. The minimum edge probability p considers the all edges through non-insertion
nodes (that is, zero offset) at a given genomic position.
The total number of observations N across all nodes
with the same position (and zero offset) along with the
minimum edge probability p is used to bound paths
Homer and Nelson Genome Biology 2010, 11:R99
/>
Page 10 of 12
Figure 6 The creation of a variant graph. Four alignments (left) are successively used to create a variant graph (right). (a) An alignment of a
read that matches the reference. The associated variant graph consists of nodes that represent each base of the read. (b) An alignment of a
read with a base difference at the second position. The base difference adds a new node that is connected to the existing first and third node.
(c) An alignment of a read that has a base difference and a deletion relative to the reference. A new edge connecting the sixth and ninth
nodes is added to the graph. (d) An alignment of a read that has a base difference, a deletion, and an insertion relative to the reference. Two
new nodes are added creating a path from the previously existing SNP at the second position to the reference base at the second position. (e)
The resulting variant graph with each edge labeled with the number of alignment paths containing this edge.
through edges incoming to nodes at that position. Suppose an incoming edge to a node is observed n times,
then the edge is pruned if Pr(x ≤ n | N)
(
)
Pr x ≤ n N =
∑
x
⎛N⎞
x
N −x
=
⎜ ⎟ ( 0.5 ) ( 0.5 )
x ⎠
i =0 ⎝
∑
x
⎛N⎞
N
⎜ ⎟ ( 0.5 )
x ⎠
i =0 ⎝
While this is a valid assumption if the genome has
two copies of each chromosome (diploid), deviations
from this do not greatly change the pruning strategy as
Homer and Nelson Genome Biology 2010, 11:R99
/>
both input parameters are used in conjunction with an
OR logical relationship: a path through a node/edge is
included if it passes one or both of the filters. Within
high coverage locations, the former filter removes variants that occur by random chance due to sequencing
error but is intended to remain sensitive to the detection of alleles that can be obscured by alignment ambiguities. In contrast, within low coverage regions, the
former filter will overly penalize variants that were not
observed due to insufficient sampling. Thus, the latter
filter is designed to include variants in low coverage
regions while strictly penalizing variants that do not
occur frequently in high coverage regions. These parameters are important for both removing spurious variants and inclusively including potentially real variants
in low coverage regions.
Leveraging ABI SOLiD two-base encoded data
Special considerations need to be made to incorporate
sequencing reads produced by the ABI SOLiD platform,
which are generated in a two-base encoded form. When
re-aligning such data to the variant graph, a modified
version of the two-base encoded dynamic programming
algorithm is used [12,21]. In this case, the decoded
DNA sequence must exactly match the bases represented by a valid path in the variant graph. The re-alignment score is produced by using the original color
sequence and quality scores and is calculated by comparing the original color in the color sequence with the
expected color. The expected color is determined by
encoding the two bases connected by the previously
examined edge in the path, or encoding the known start
adapter and first base in the path (for starting nodes).
By constraining the decoded bases to match bases represented by nodes in the graph, the computational complexity of the original dynamic programming procedure
is reduced to be equivalent to that of the base or
nucleotide space sequence comparison.
Simulated and empirical data
Two simulated datasets were created to evaluate SRMA,
one simulating data from an Illumina sequencer, and
one simulating data from an ABI SOLiD sequencer. A
uniform 1% per-base error rate was used for the Illumina dataset, while a uniform 5% per-color read error
rate was used for the ABI SOLiD dataset. In practice,
sequencing error per read is not uniform, tending to be
low at the 5’ end (the beginning) of the sequence read
and higher towards the end of each read, but that is not
modeled here. The distance between the two ends of
each paired end read was randomly drawn from a normal distribution of mean 500 bases and standard deviation of 50 bases. Polymorphisms were added to the
simulated genome at a rate of 1/1000 with a 1/3
Page 11 of 12
probability of being a homozygous variation. Insertions
and deletions each accounted for 5% of all polymorphisms. The probability of an insertion or deletion extending beyond one base was 0.3 per extended base to
simulate observed in/del distributions in the human
genome. The whole-genome simulation program and
subsequent accuracy evaluation can be found in the
DNA Analysis (DNAA) package [29].
To empirically test the feasibility and utility of SRMA
in a whole genome context, a previously published
human whole-genome brain cancer dataset was obtained
from the Sequence Read Archive (SRA009912.1) [13].
The original alignments were obtained, which were performed by BFAST [7], and retained the original color
sequence and qualities to allow for color space local realignment [12,21]. The alignments from BFAST and
SRMA were variant-called using the SOAP consensus
model implemented in SAMtools (v.0.1.17) using the
default settings [10,20]. The subsequent alignments were
locally re-aligned with SRMA with variant inclusive settings (c = 2 and p = 0.1).
SAMtools reports three metrics for each variant position: SNP quality, consensus quality, and base coverage.
The SNP quality is the Phred-scaled probability that the
consensus is identical to the reference, while the consensus quality is the Phred-scaled likelihood that the
called genotype is wrong. Typically, a minimum SNP
quality filter can be used to reduce false positives while
somewhat reducing sensitivity.
Abbreviations
ABI: Applied Biosystems Inc.; BFAST: Blat-like Fast Accurate Search Tool; bp:
base pair; BWA: Burrows Wheeler Alignment tool; dbSNP: Single Nucleotide
Polymorphism Database; SNP: single nucleotide polymorphism; SRA:
Sequence Read Archive; SRMA: Short-Read Micro re-Aligner.
Acknowledgements
This research was supported by the NIH Neuroscience Microarray
Consortium (U24NS052108) as well as grants from the NIMH (R01
MH071852), and NHGRI (U01HG005210). We would like to thank Michael
Brudno, Buhm Han, and Hyun Min Kang for their valuable comments, and
members of the Nelson Lab, Kevin Squire, Hane Lee, and Bret Harry, for
input and computational infrastructure support. Finally, we would like to
thank the developers of the Picard Java API, which was used in the
implementation of SRMA.
Author details
1
Department of Computer Science, University of California - Los Angeles,
Boelter Hall, Los Angeles, CA 90095, USA. 2Department of Human Genetics,
David Geffen School of Medicine, University of California - Los Angeles, 695
Charles Young Drive South, Los Angeles, CA 90025, USA. 3Current address:
Ion Torrent, Life Technologies, 7000 Shoreline Court, South San Francisco, CA
94080, USA.
Authors’ contributions
NH designed and implemented the algorithm, and drafted the manuscript.
SFN drafted the manuscript. All authors read and approved the final
manuscript.
Received: 26 June 2010 Revised: 25 August 2010
Accepted: 8 October 2010 Published: 8 October 2010
Homer and Nelson Genome Biology 2010, 11:R99
/>
References
1. Kent WJ, Haussler D: Assembly of the working draft of the human
genome with GigAssembler. Genome Res 2001, 11:1541-1548.
2. Myers EW: The fragment assembly string graph. Bioinformatics 2005,
21(Suppl 2):ii79-85.
3. Pevzner PA, Tang H, Waterman MS: An Eulerian path approach to DNA
fragment assembly. Proc Natl Acad Sci USA 2001, 98:9748-9753.
4. Simpson JT, Durbin R: Efficient construction of an assembly string graph
using the FM-index. Bioinformatics 2010, 26:i367-373.
5. Simpson JT, Wong K, Jackman SD, Schein JE, Jones SJ, Birol I: ABySS: a
parallel assembler for short read sequence data. Genome Res 2009,
19:1117-1123.
6. Zerbino DR, Birney E: Velvet: algorithms for de novo short read assembly
using de Bruijn graphs. Genome Res 2008, 18:821-829.
7. Homer N, Merriman B, Nelson SF: BFAST: an alignment tool for large scale
genome resequencing. PLoS One 2009, 4:e7767.
8. Langmead B, Trapnell C, Pop M, Salzberg SL: Ultrafast and memoryefficient alignment of short DNA sequences to the human genome.
Genome Biol 2009, 10:R25.
9. Li H, Durbin R: Fast and accurate short read alignment with BurrowsWheeler transform. Bioinformatics 2009, 25:1754-1760.
10. Li H, Ruan J, Durbin R: Mapping short DNA sequencing reads and calling
variants using mapping quality scores. Genome Res 2008, 18:1851-1858.
11. Li R, Li Y, Kristiansen K, Wang J: SOAP: short oligonucleotide alignment
program. Bioinformatics 2008, 24:713-714.
12. Rumble SM, Lacroute P, Dalca AV, Fiume M, Sidow A, Brudno M: SHRiMP:
accurate mapping of short color-space reads. PLoS Comput Biol 2009, 5:
e1000386.
13. Clark MJ, Homer N, O’Connor BD, Chen Z, Eskin A, Lee H, Merriman B,
Nelson SF: U87MG decoded: the genomic sequence of a cytogenetically
aberrant human cancer cell line. PLoS Genet 2010, 6:e1000832.
14. Benno S, Martin V: Weighted sequence graphs: boosting iterated
dynamic programming using locally suboptimal solutions. Discrete Appl
Math 2003, 127:95-117.
15. Vladimir Y, Stephen MR, Michael B: Read mapping algorithms for single
molecule sequencing data. In Proceedings of the 8th International
Workshop on Algorithms in Bioinformatics: September 15-19 2008; Karlsruhe,
Germany. Edited by: Crandall KA, Lagergren J. Springer-Verlag; 2008:38-49,
[Lecture Notes in Computer Science, volume 5251].
16. Lee C: Generating consensus sequences from partial order multiple
sequence alignment graphs. Bioinformatics 2003, 19:999-1008.
17. Lee C, Grasso C, Sharlow MF: Multiple sequence alignment using partial
order graphs. Bioinformatics 2002, 18:452-464.
18. Anson EL, Myers EW: ReAligner: a program for refining DNA sequence
multi-alignments. J Comput Biol 1997, 4:369-383.
19. Simpson JT, Durbin R: Efficient construction of an assembly string graph
using the FM-index. Bioinformatics 26:i367-373.
20. Li H, Handsaker B, Wysoker A, Fennell T, Ruan J, Homer N, Marth G,
Abecasis G, Durbin R: The Sequence Alignment/Map format and
SAMtools. Bioinformatics 2009, 25:2078-2079.
21. Homer N, Merriman B, Nelson SF: Local alignment of two-base encoded
DNA sequence. BMC Bioinformatics 2009, 10:175.
22. Sherry ST, Ward MH, Kholodov M, Baker J, Phan L, Smigielski EM, Sirotkin K:
dbSNP: the NCBI database of genetic variation. Nucleic Acids Res 2001,
29:308-311.
23. SRMA: the Short Read Micro re-Aligner.. [].
24. Gotoh O: An improved algorithm for matching biological sequences. J
Mol Biol 1982, 162:705-708.
25. Myers EW, Miller W: Optimal alignments in linear space. Comput Appl
Biosci 1988, 4:11-17.
26. Needleman SB, Wunsch CD: A general method applicable to the search
for similarities in the amino acid sequence of two proteins. J Mol Biol
1970, 48:443-453.
27. Smith TF, Waterman MS: Identification of common molecular
subsequences. J Mol Biol 1981, 147:195-197.
28. Smith AD, Xuan Z, Zhang MQ: Using quality scores and longer reads
improves accuracy of Solexa read mapping. BMC Bioinformatics 2008,
9:128.
29. DNAA: the DNA Analysis Package.. [].
30. IGV: the Integrated Genomics Viewer.. [ />].
Page 12 of 12
doi:10.1186/gb-2010-11-10-r99
Cite this article as: Homer and Nelson: Improved variant discovery
through local re-alignment of short-read next-generation sequencing
data using SRMA. Genome Biology 2010 11:R99.
Submit your next manuscript to BioMed Central
and take full advantage of:
• Convenient online submission
• Thorough peer review
• No space constraints or color figure charges
• Immediate publication on acceptance
• Inclusion in PubMed, CAS, Scopus and Google Scholar
• Research which is freely available for redistribution
Submit your manuscript at
www.biomedcentral.com/submit