Báo cáo y học: "An atlas of bovine gene expression reveals novel distinctive tissue characteristics and evidence for improving genome annotation" pot
Bạn đang xem bản rút gọn của tài liệu. Xem và tải ngay bản đầy đủ của tài liệu tại đây (2.26 MB, 18 trang )
RESEA R C H Open Access
An atlas of bovine gene expression reveals novel
distinctive tissue characteristics and evidence for
improving genome annotation
Gregory P Harhay
1*
, Timothy PL Smith
1
, Leeson J Alexander
2
, Christian D Haudenschild
3
, John W Keele
1
,
Lakshmi K Matukumalli
4,5
, Steven G Schroeder
5
, Curtis P Van Tassell
5
, Cathy R Gresham
6
, Susan M Bridges
6
,
Shane C Burgess
7
, Tad S Sonstegard
5
Abstract
Background: A comprehensive transcriptome survey, or gene atlas, provides information essential for a complete
understanding of the genomic biology of an organism. We present an atlas of RNA abundance for 92 adult,
juvenile and fetal cattle tissues and three cattle cell lines.
Results: The Bovine Gene Atlas was generated from 7.2 million unique digital gene expression tag sequences
(300.2 million total raw tag sequences), from which 1.59 million unique tag sequences were identified that
mapped to the draft bovine genome accounting for 85% of the total raw tag abundance. Filtering these tags
yielded 87,764 unique tag sequences that unambiguously mapped to 16,517 annotated protein-coding loci in the
draft genome accounting for 45% of the total raw tag abundance. Clustering of tissues based on tag abundance
profiles generally confirmed ontology classification based on anatomy. There were 5,429 constitutively expressed
loci and 3,445 constitutively expressed unique tag sequences mapping outside annotated gene boundaries that
represent a resource for enhancing current gene models. Physical measures such as inferred transcript length or
antisense tag abundance identified tissues with atypical transcriptional tag profiles. We report for the first time the
tissue-specific variation in the proportion of mitochondrial transcriptional tag abundance.
Conclusions: The Bovine Gene Atlas is the deepest and broadest transcriptome survey of any livestock genome to
date. Commonalities and variation in sense and antisense transcript tag profiles identified in different tissues
facilitate the examination of the relationship between gene expression, tissue, and gene function.
Background
Comprehensive surveys of transcript abundance among
tissues, often refe rred to as gene atlases, are relatively
few [1-10], but provide novel and detailed insights into
the genomic biology of the organism surveyed. For
example, genomic studies often reveal chromosomal
segments harboring variation affecting a trait, and
knowledge of the expression profiles of genes lying in
these segments enhances selection of candidate genes
for further investigation. From another perspective,
knowle dge of the tissues in which a particul ar transcript
is expressed may provide additional evidence about gene
function. The utility and quality of a gene atlas for these
types of analyses is l imited by its depth (defined as the
sensitivity to rare transcripts relative to abundant tran-
scripts) and breadth, represented by the diversity of the
tissue types and developmental stages.
The emergence of next generation sequencing (NGS)
technologies has expanded the depth available for crea-
tion of gene atlases by providing an alternative to DNA
microarray approaches for monitoring gene expression
[1]. Profiling using NGS has a greater capacity to repre-
sent all extant transcripts (since microarrays monitor
only those sequences for which probes have been or can
be created) and wider dynamic range (up to the limit of
the efficiency of cDNA synthesis, depending on number
of sequences collected). Two approaches to enumerate
transcripts with NGS have been developed, either based
* Correspondence:
1
USDA-ARS US Meat Animal Research Center, State Spur 18 D, Clay Center,
NE 68901, USA
Full list of author information is available at the end of the article
Harhay et al. Genome Biology 2010, 11:R102
/>© 2010 Harhay et al.; licensee BioMed Central Ltd. This is an open access article distributed under the terms of the Creati ve Commons
Attribution License ( which permits unrestricted use, distribution, and reproduction in
any medium, provided the origina l work is prop erly cited.
on sequencing specific tags related to restriction sites in
the cDNA (digital gene expression (DGE)) or random
cDNA fragments (RNAseq) [2]. The former approach
was the only one available making use of NGS at the
time of this transcriptome study based on restriction
digestion of bovine cDNA with the enzyme DpnII and
capture of 20-base tags (including the GATC restriction
site) from the 3’-most restriction site. The disadvantage
of DGE is that it fails to capture expression information
from transcripts lacking DpnII sites (approximately 3%
of current bovine gene models do not have predicted
DpnII recognition sequences). On the other hand, col-
lapsing tag counts to a unique locus to precisely quan-
tify transcript abundance using DGE tags can be more
straightforward than the assembly of short, sometimes
non-overlapping reads, especially for organisms lacking
high quality genome sequences and annotation (as is the
case for cattle).
The breadth of existing gene atlases varies, with some
aiming for extreme breadth in a limited set of tissue
types, such as the adult mouse brain atlas with a fine-
grained localization of expression [4], and others being
less specialized, such as the mouse atlas describing
approximately 34 tissue types at multiple developmental
stages [5]. In cattle, where the bulk of research is
focused on tissues important to efficient production of
unadulterated beef, additional considerations in selecting
tissues for a gene atlas come into play. For example, cat-
tle research is more concerned with variation in gene
expression among muscle classes, fat depots, or the
digestive system than is normally the case in mouse stu-
dies. In contrast, much mouse research is related to
basic studies in developmental biology as a model
organism and, thus, a useful gene atlas for mice will
tend to concentrate more on breadth across develop-
mental stages than breadth across subclasses of tissue
types within a stage (such as different muscles). The
breadth of an atlas can be evaluated in the light of tissue
ontologies, such as that in the Braunschweig Enzyme
Database (BRENDA) classification system [6,7].
In general, there are impediments to drawing biologi-
cal inferences f rom transcriptional profiles. These bar-
riers include the complexity of biological systems, the
lack of knowledge about the details of cattle-specific
biological processes, and the fact that the cattle draft
genome is relatively new and not as well annotated as
more mature genomes such as human or mouse. The
Bovine Gene Atla s (BGA) was created to addr ess some
of these shortcomings. For instance, associating Bovi-
dae-specific tissues, such as the rumen, with other tis-
sues with a similar transcript profile that are also
present and well studied in other non-ruminant organ-
isms will be a useful first step to seed investigations of
biological processes specific to Rumina ntia species. We
collected a total of 95 samples (including three cell
lines) spanning one fetal stage, one juvenile stage, and a
number of adult animals, and constructed the first BGA,
which to our knowledge is also the first organism-wide
atlas to be constructed using NGS technology. The BGA
is available for viewing online within a genomic context
[8].
Results and discussion
Breadth and depth of the BGA
The breadth of the tissues in the BGA is illustrated in
Figure 1. The majority of the tissues were harvested
from animals relate d to L1 Dominet te 01449, the Here-
ford cow whose genome was s equenced [9,10]. Most of
these samples were from her male late-gestation fetus
and juvenile daughter to reduce the impact of poly-
morphisms on analyses and capture changes in the tran-
scriptomes early in the life cycle that may influence the
adult state. The tissues selected were chosen based on
their presumed influence on livestock traits, most of
which are growt h related. Therefore, the atlas consists
in large part (58%) of endocrine (BRENDA [6,7] gland),
alimentary (BRENDA viscus), and nervous tissues that
provide for a wide diversity in expressio n profiles. In
addition, muscle and fat depots from adult and juvenile
steers were sampled to compare transcript levels among
these economica lly important tissues. A complete list of
specific tissues can be found in Additional file 1.
The depth of the BGA is demonstrated with the
observation of 300,268,171 tags representing 7,296,656
unique 20-base sequences collected from 92 tissues and
three cell lines for a total of 94,997,401 tags per million
(TPM). TPM is a normalized measure of tag count,
where each library was norma lized to contain 1 million
TPM. The slight deviation (0.003%) of the observed tag
count from the theoretical 95 × 10
6
was due to round-
ing errors. Eliminating tags with indeterminate bases
(N) and adaptor sequence yielded 296,179,417 tags con-
sisting of 7,280,319 unique 20-base sequences for a tot al
of 93,750,421 TPM. This set was defined to be the
operative set (Os) of all completely defined tags from
which mapping and filtering can be performed, as illu-
strated in Figure 2b. First, Figure 2a illustrat es terminol-
ogyusedindescribingthewayinwhichtagsmaymap
to the draft genome and the gene models annota ted on
the bovine draft genome sequence [9]. Out of 24,294
bovine RefSeq transcripts [11], 23,481 (96.7%) had a
DpnII site that could potentially contribute to this atlas.
Many transcripts contain multiple predicted restriction
sites, and some transcripts may conta in sites n ot anno-
tated as a result of polymorphisms between animals.
The use of the index cow for sequencing and her
immediate offspring should minimize such occurrenc es.
Annotation of the RefSeq set on the draft genome
Harhay et al. Genome Biology 2010, 11:R102
/>Page 2 of 18
sequence can be used to classify the tags according to
their relative location: either within or outside annotated
gene boundaries, in exons or introns within a gene
boundary, or in the UTRs of the transcript. Further-
more, the tags may match the sense or antisense strand
of the genomic DNA relative to the gene model, and
mayeithermatchthe3’ -most predicted DpnII site as
intended in the protocol, or one of the upstream sites (if
present) depending on a number of factors, such as
alternative splice forms or incomplete DpnII digestion.
Considering only t he two 3 ’-most DpnII sites, the pri-
mary 3’-most DpnII site is associated with 91.5% of the
observed tag abundance, while the next to 3’ -most
DpnII site constituted 8.5% of the observed tag abun-
dance, suggesting that the protocol is yielding acceptable
results.
Figure 2b describes the results of mapping tags to the
draft genome, starting with the Os where 1,588,191 dis-
tinct tag sequences (Os-G) aligned perfectly to the draft
genome for a total tag abundance of 80,326,698 TPM.
Inotherwords,only21.8%oftheOsuniquetag
sequences mapped to the draft genome, but these tags
represented 85.7% o f the O s tag abundance. This was
due mainly t o a diverse set of singleton tags that may
Figure 1 The 95 samples comprising the Bovine Gene Atlas. The samples are classified according to BRENDA tissue class, developmental
stage, breed, and sex. Most tissues were sampled from animals related to L1 Dominette, the Hereford cow whose genome was sequenced.
Harhay et al. Genome Biology 2010, 11:R102
/>Page 3 of 18
represent sequence errors (or other phenomena; see sec-
tion on non-matching tags below). T o more efficiently
remove artifactual tags, an additional criterion was used
to eliminate tags with very low abundance (less than 2
TPM). However, because tags were collected from a
relatively larger number of tissues compared to other
transcriptomic investigations, transcripts from lowly
transcribed genes, present at levels below 2 TPM, were
included for consideration if they were present in at
least ten libraries on the grounds that their presence in
at least ten libraries suggests that the tag sequences
were not the result of sequencing error. This 2 TPM/
ten tissue constraint was applied to subsequent analyses
in this report, and resu lted in 483,788 unique 20-base
tag sequences (Os-F) totaling 89,858,285 TPM among
all 95 samples, of which 2 72,610 unique tag sequences
(Os-fG; 56.3% of the Os-F) amounted to 79,282,121
TPM (88.2% of the Os-F) mapped to the draft genome.
This 2 TPM/ten tissue filter reveals that only 6.65% of
the unique tag sequences account for 95.8% of the total
normalized Os tag abundance. Thus, requiring the tags
to map to a single position in the draft genome reduces
the Os-fG tag set to 227,481 unique tag sequences (Os-
fgU; 83.4% of the Os-fG) for a total tag abundance of
Figure 2 Tag processing. (a) Tags mapping to a hypothetical gene model, definition of terms. Sense tags were defined to be those tags on
the same strand as the gene model, antisense tags were on the opposite strand. The ‘On 3’ terminus’ tags were defined to be on the 3’
terminus derived from the two downstream-most positions on the transcript, while the rest of the tags within the gene boundaries were
defined to be ‘Not on 3’ terminus’. The union of these two sets was defined as tags ‘Within locus’. (b) Tag genome mapping and filtering. The
ordinate ‘Total normalized tag abundance’ is the sum of all normalized tag counts (TPM) over all tissues, while the abscissa ‘Number of unique
tag sequences’ is the set of tags from all 95 tissues. Os, operative set of all observed tags that do not possess an ambiguous base; Os-G, subset
of Os tags perfectly mapping to the draft bovine genome; Os-F, subset of Os tags found in at least ten tissues and/or have a tag abundance of
2 TPM or greater in at least one tissue; Os-fG, subset of Os-F tags that mapped to the draft bovine genome; Os-fgU, subset of Os-fG tags with
unique matches to the draft bovine genome - the Os-fgU tag set is analyzed further in Additional file 1 and is marked with a concentric circle;
OS-fgu-PC, the subset of Os-fgU tags mapping to protein-coding genes; OS-fNG, the subset of Os-F tags that do not map to the draft bovine
genome; OS-fng-SMM, the subset of Os-fNG tags that map back to the draft genome because of a single base mismatch at tag base positions 5
to 20; Os-fng-EST, subset of the Os-fNG tags that map to bovine ESTs.
Harhay et al. Genome Biology 2010, 11:R102
/>Page 4 of 18
59,373,362 TPM (74.9% of the Os-fG) in all samples,
and accounting for 66.1% of the o bserved t otal tag
abundance in the Os-F. This requirement results in a
floor in the estimate in the number of unique transcript
sequences and genes observed in all tissues. The con-
straint that the tags must map to a single position in
the draft genome has been applied to subsequent ana-
lyses in this report (that is, the Os-fgU subset of tags
was used for all subsequent analyses) since tags that do
not map uniquely to the draft genome cannot be unam-
biguously assigned to particular loci. For instance, the
subset of tags that mapped within the gene boundaries
of annotated protein-coding loci yielded 87,764 unique
tag sequences (Os-fgu-PC) mapping to 16,517 loci with
distinct GeneIDs, totaling 42,681,813 TPM.
Using a filter that required tags to match a single loca-
tion in the draft genome was instituted because this
simplified the interpretation of the results; however,
there were consequences to this choice, as tag sites
from relatively intact pseudogenes or duplicated genes
were left out of the analysis . An illustrative example is
provided by GAPDH [GeneID:281181], the gene encod-
ing the constitutively expressed glyceraldehyde-3-phos-
phate dehydrogenase. The tag associated with the 3’-
most DpnII site in GAPDH was found in seven other
locations of the draft genome, making it impossible to
infer with cert ainty whether the tag was generated from
GAPDH mRNA, especially given that the tag maps
within gene boundaries of three other annotated loci in
addition to four unannotated, presumably intergenic
locations. As a result, this tag associated with GAPDH
gene expression was not part of the analysis using the
Os-fgU subset, and as many as 32.0% of the RefSeq
bovine transcripts (16,517 loci with Os-fgU tags versus
24,294 transcripts in RefSeq) were not included in the
summary data. This is a problem for all NGS short-read
transcriptome approaches, since individual reads from
the newer RNAseq methods may also map to multiple
places in the genome and may not be unambiguously
assigned a single genomic location. This does not pre-
clude closer examination using the comprehensive data-
set in the supplementary materials for individual loci to
determine whether the BGA data can be used to evalu-
ate expression of confounding tags. In the GAPDH
example, the other positions in the draft genome to
which the tag maps include four apparent pseudogenes
where >90% of the GAPDH transcript is copied in the
draft genome and lacking exons, and another location
with intron-carrying similarity to the gene (but lacking
upstream exons) and annotated as ‘similar to GAPDH’
(according to GenBank). One might reasonably conclude
that all occurrences of the tag are related to GAPDH
expression and include the tag in analysis; however,
such decisions are not practicable to automate on a
scale that considers all multiple-mapping tags and are
best left for decisions by investigators focusing on speci-
fic genes.
A summary of the tissue libraries and chara cteristics
oftagsgeneratedfromthemisfoundinAdditionalfile
1. The tag data are broken out by tissue, classified
according to the BRENDA tissue ontology, and tag-
mapping parameters such as number of unique loci
mapped, number of unique sense/antisense tag
sequences mapping to these loci, abundance of the
sense/antisense tags mapping within loci, and mitochon-
drial genome-encoded expression.
Bovine tissue classification based on expression profiles
It seems reasonable to expect that similar functions in
different tissues will require sim ilar sets of genes to be
expressed, such that functional relatedness of tissues is
likely to be reflected in shared patterns of transcript
abundance. The static transcript profiles created in the
BGA reflect the state of the tissues’ activity at the time
of sampling , and may not always reflect common devel-
opmental origin. Therefore, it should be informative to
determine how the tissues relate to one another in
terms of their expression patterns exemplified by tran-
script diversity and abundance measures. A straightfor-
ward approach is to cluster the tissues based on
commonalities in transcript abundance, such as imple-
mented in the Simcluster application [12]. This applica-
tion was chosen because it was developed and
optimized specifically to cluster enumeration (Serial ana-
lysis of gene expression (SAGE), massively parallel sig-
nature sequencing (MPSS), this BGA data) expression
data based on the computed similarity between the tran-
script tag profiles in a simplex space where the summa-
tion of the tag abundances, by definitio n, is constrai ned.
To put the results in context, the hierarchical Simcluster
dendrogram is annotated with the BRENDA anatomical
tissue classifications to determine if this classifica tion
schema fits with patterns of transcript abundance in cat-
tle tissues.
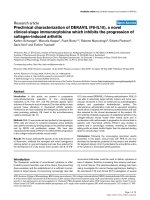
The hierarchical clustered dendrogram constructed
using abundance data from the Os-fgU tag set in Figure
3 illustrates how classification based on BGA data lar-
gely reflects the anatomical model at the top-most level
of BRENDA ontology. For example, cluster E2 indicated
in Figure 3 includes all of the muscles collected from
both juvenile and adult animals, and cluster C includes
all 13 tissues of the ‘nervous tissue’ class. These results
indicate the validi ty of using transcript abunda nce to
deter mine relatedness of tissu es. However, not all of the
clustering behaves in this fashion; for example, the ‘con-
nective tissue’ class comprises four adipose samples in
the BGA, indicating that adult marbling fat and fetal
white fat are closely related to one another and to
Harhay et al. Genome Biology 2010, 11:R102
/>Page 5 of 18
Figure 3 Simplex clustering (Simcluster) of tissue transcrip tion profiles and their correspondence with BRENDA tiss ue classification.
Tissue names are colored according to the topmost level of BRENDA tissue classes noted as the first term for each leaf; however, only those
classes that had more than three tissue members are given a non-black color.
Harhay et al. Genome Biology 2010, 11:R102
/>Page 6 of 18
skeletal muscle in cluster E1, while juvenile white fat
and adult subcutaneous (SubQ) fat are substantially dif-
ferent from these two tissues in cluster F1. The analysis
of fatty tissues also illustrates a limitation of the ontol-
ogy system, as clearly the fat pads of the mammary and
kidney capsu le, which are placed in the gland classifica-
tion in cluster F1, are more similar to the subcutaneous
and juvenile white-fat samples than they are to other
members of their own classification. Similarly, the inclu-
sion of the diaphragm, classified as ‘cardio’,inthemus-
cle cluster E2 is unsurprising, but suggests that
diaphragm should a lso be a child node under skeletal
muscle in the BRENDA tissue ontology.
It is interesting to note the clustering of all three cell
lines (two adipose cell lines and one satellite cell line) in
cluster F2 in Figure 3. The relatively close similarity to
several fat tissues (mammary, kidney, juvenile white and
adult SubQ) in cluster F1 indicates that the fat cell lines
retain transcript profiles approximating their source tis-
sue, but the close relatednes s of the muscle satellite cell
line suggests that there is a transcriptional pr ofile com-
ponent common to cell cultures or the satellite cell line
has an adipose-related transcript profile. Another inter-
esting result from the clustering is that the adult testis
has a tag profile with low similarity to any other tissue,
being the sole tissue in cluster A. This presumably
reflects that the mature primary sex organ of a mammal
hasuniquesetsofgeneexpressionrequirements.In
contrast, the fetal testis is clustered with fetal vas defe-
rens, juvenile oviduct and ovary, and juvenile kidney in
cluster G , presumably because at this immature stage it
has not developed the specialized function(s) that distin-
guish the adult testis.
The expression profile similarity b etween the juvenile
anterior pituitary and retina samples, as indicated in
cluster D of Figure 3, is interesting, as a relationship
between these tissues is not obvious from an anatomy-
based ontology. Some other surprising results include
the observation that the three lymph nodes collect ed
(juvenile cheek and mesenteric, fetal body cavity) have
relatively distantly related profiles, with che ek being clo-
sest to lactating mammary gland, body cavity being clo-
sest to the pineal gland, and mesenteric being closest to
adrenal medulla and cortex. Similarly surprising is the
distant relationship between the fetal and juvenile thyr-
oid samples, with the fetal sample most closely related
to fetal thymus an d the juvenile less closely related but
clustered with the same group of tissues as fetal testis.
Clustering of tissues by expression profile in the ali-
mentary canal is of interest because cattle are ruminants
with a more comple x digestive system than other mam-
mals.Thefetalrumen,omasum,andreticulum,which
are compartments of the stomach, are tightly clustered
in cluster K, but are d istantly related to expression in
their juvenile counterparts in clusters J and E3. Simi-
larly, fetal jejunu m and ileum sections of small intestine
in cluster E3 have similar expression profiles, which are
substantially distant from profiles of their juvenile coun-
terparts, probably because of the ongoing digestive pro-
cesses in the juvenile animal. In contrast, the fetal and
juvenile abomasums are clustered in I, perhaps because
the secretory functions of this ‘fourth stomach’ have
already begun at 180 days gestation. In terms of the
rumen, which has no exact counterpart with other spe-
cies having broad gene atlas data, the expression profile
of the fetal sample in cluster K is closest to those of the
fetal samples of coronary band (area above the hoof
where hair growth ends) or bone marrow, while the
juvenile rumen sample most closely resembles the juve-
nile duodenum and fetal ventricle patterns in cluster E3.
Mitochondrial gene expression profiles
The DGE procedure provided data for 9 of the 11 pro-
tein-coding genes present in the bovine mit ochondrial
genome (the COX3 and ND3 transcripts have no DpnII
sites). The data on mitochondrial gene expression were
of special i nterest because of the important role of this
organelle in muscle, the most important tissue in beef
production; however, these data provided a different
perspective on the classification of other tissues as well.
A heat map of expression of the nine mitochondrial
genes in Figure 4 provides visual context for the basis of
clustering used by Simcluster in both of the Simcluster
dendrogram (this depiction was not possible for Figure
3 because, instead of the 11 c olumns in Figure 4, it
would require in excess of 200,000 columns). The heat
map includes t he abundance of all sense and antisense
tags mapping within the annotated boundaries of the
nine mitochondrial genes, although the contribution of
antisensetagabundanceisnegligible(5%).Theheat
map illustrate s that ND4L has the lowest transcript
abundance across all tissues, with ATP6, COX1,and
COX2 being commonly the most highly abundant. We
note that the percentage of antisense tag to total (sense
+antisense) tag abundanc e for the 11 mitochondrial
genes i s 4.4%. This low percentage indicates that mito-
chondrial-related tags were generated directi onally from
mRNA and not from putative contaminating mtDNA,
since DpnII sites in mtDNA should have no bias toward
sense tag generation.
The relative abundance of mitochondrial genome-
derived and nuclear-encoded transcripts was interesting,
as in some brain tissues (juvenile thalamus, temporal
cortex, and medulla oblongata) the majority of tags
observed were derived from these nine m itochondrial
genes ( > 57%, range 57.6 to 68.0%; Additional file 1). In
contrast, the juvenile hippoc ampus displayed 34.3%
mitochondrial tags and the eight muscle samples
Harhay et al. Genome Biology 2010, 11:R102
/>Page 7 of 18
Figure 4 Simplex clustering (Simcluster) of tissues with mitochondrial tag profiles (TPM) only. The heatmap shows the absolute
abundance of tags associated with each mitochondrial gene. Tissue names are colored according to the topmost level of BRENDA tissue classes
noted as the first term for each leaf; however, only those classes that had more than three tissue members are given a non-black color.
Harhay et al. Genome Biology 2010, 11:R102
/>Page 8 of 18
averaged 23.6% (range 17.5 to 35.6%). Among all tissues,
the average mitochondrial tag abundance was 11.4% of
the total of mitochondrial and nuclear-encoded abun-
dance (range 3.5 to 68.0%).
A hierarchical dendrogram of the tissues in the BGA
based on mitochondrial tag profiles (right side of Figure
4) shows the clustering of tissues has many similarities
to that from the entire set of tags in Figure 3, despite
being based on only nine data points per tissue. The
skeletal muscles cluster together, with the notable
exception that the muscle near the caesarean opening
(external abdominal oblique) is less closely related and
is clustered with adrenal gland. Also, the tongue muscle
clusters with the s mooth muscle-containing rumen and
duodenum more tightly than with the skeletal muscles,
a cluster that would be difficult to predict apriori.The
fetal rumen and omasum still cluster together, but the
fetal reticulum is not a member of the same cluster in
the mitochondrial profile, being most closely related to
thejuvenileovary.Muchofthenervoustissueremains
clustered, although the overall clustering is divided into
two more distant clus ters (D and E in Figure 4), with
the principal division related to the much higher tag
abundances of three genes (ATP6, COX1, and COX2)in
the tissues in cluster E relative to D (see data in Addi-
tional file 1). To the best of our knowledge, this is the
first time these nervous tissues have been categorized
into two distinct groups according to mitochondrial
gene expres sion profiles. Cluster E i s especially interest-
ing since this cluster has the highest proportion of mito-
chondrial to nuclear gene expression and its
constituents are the same tissues (medulla oblongata,
thalamus, and hippocampus) shown to be enriched in
the pathogenic form of the prion protein symptomatic
of bovine spongiform encephalopathy [13]. More
broadly, mitochondrial dysfunction has been associated
with neurological disorders affecting tissues in both
clusters D and E [ 14-16], suggesting that the o bserved
differences in the mitochondrial gene expression profiles
may not only be useful in classifying nervous tissue, but
also that changes in these differences may provide new
insights into the progression of neurological diseases.
Overall, the classi fication based on all tags shows bet-
ter agreement with the BRENDA ontology than that
based only on nine mitochondrial genes. While this is
not surprising, the data on mitochondrial gene expres-
sion still provides a new perspective on classification of
tissues that are similar in the overall tag profile. For
instance, the three cell lines that were clustered together
in the full set of tags are quite different in mitochondrial
gene expression profile, despite having quite similar per-
centages of tag abundance derived from the mitochon-
drial genome (11 t o 12%). Moreover, the fact that many
tissues are clustered similarly in both profiles supports
the existence of a coordination of expression between
nuclear and mitochondrial genes.
Localization of sense and antisense tags within gene
models and confounding effects of overlapping genes
The procedure used in creating the BGA should result
only in tag sequences reflecting the sequence of
expressed, polyadenylated RNA immediately 3’ from the
DpnII site closest to the polyA tail. Thus, tags mapping
to unique genomic locations that lie within gene models,
but matching the opposite strand from the predicted
mRNA product, represent apparent transcription in the
antisense direction (note that tags mapping outside gene
models cannot be assigned sense or antisense dir ection).
The fidelity of the tag g eneration and sequencing pro-
cess from mRNA is therefore reflected in the propensity
ofthetagstolocalizetotheDpnIIsiteatthe3’ end of
the NM or NR RefSeq transcript. The proportion of
tags mapping to the 3’-mostornextto3’ -most DpnII
position on the RefSeq transcripts relative to all tags
mapping to the these loci had a mean of 0.906 ( 0.023
standard deviation (SD)), validating the fidelity of t he
tag generation and sequencing protocols.
A comparison of antisense tags to sense tags in all 95
samples in Additional file 1 shows that there were 2.13
times as many observed sense tag sequences versus anti-
sense, while the normalized tag abundance (TPM) of
sense tags was 11.5 times that of antisense tags. An ana-
lysis of the behavior of the number of unique sense and
antisense tag sequences within loci versus the number
of unique loci (different GeneID)foreverytissuein
Additional file 2 shows a looser association of the num-
ber of unique sense tag sequences versus unique loci
than observed in the antisense case; specifically, when
the data were fitted to a quadratic curve, the norm of
the residuals in the sense case was 24,208 versus 6,323
TPM in the antisense case, a 3.7-fold difference. A pos-
sible explanation for this difference was gleaned from a
comparison of the antisense and sense empirical cum u-
lative distribution functions (ECDFs) of the number of
tag sequences with respect to their distances upstream
of the 3’ terminus of the gene model using all tissues in
Figure 5. This implies that the only tag sequences
accounted for fell within a gene model, while tags map-
ping outside of annotated gene models were not
considered.
Figure 5 shows that a larger proportion of the antisense
tag sequences are closer to the 3’ end of the gene
model. This too has been observed in the human ‘anti-
sense t ranscriptome’ [17], where antisense transcription
was found to be relatively higher in the 1-kb regions
upstream (promoter) and downstream (terminator),
respectively, of the transcription start and stop sites.
The BGA data are consistent with the results of He
Harhay et al. Genome Biology 2010, 11:R102
/>Page 9 of 18
et al. [17], if one takes into account that terminators
were much more likely to b e observed than promoters
because the tags were generated with a heavy 3’ bias.
These data show that not only were there fewer
observed antisense tags than sense tags, the antisense
tags tended more towards the 3’ terminus than the
sense tags, restricting the set of observed tag sequences
even further and yielding a closer association of
observed antisense tag sequences with number of loci
than observed with the sense tags. Precisely quantifying
this effect is difficult because of the imprecision of the
computational-based gene models, especially with regard
to overlapping g enes. There were 2,075 tags that were
antisense to a gene model in on e strand but sense to an
overlapping gene model on the complementary strand,
accounting for 1,058,662 TPM in all tissues, or 28.5% of
the total antisense tag abundance of 3,718,974 TPM
from 1,471,248 antisense tag sequences in all tissues.
These 2,075 ta gs constitute a mere 0.141% of all anti-
sense tag sequences. Confidently associating a tag in an
overlapping region of the draft genome can be difficult,
especially in cases where a tag resides close to the 3’ ter-
minus of a gene model, either upstream or downstream.
Small changes in these overlapping gene models can
have large effects on the relative proportion of antisense
to sense total tag a bundances by enlarging or contract-
ing the class of 2,075 tags shared by the overlapping
gene models. There is evidence that errors are present
in gene models associated with antisense tags, suggest-
ing that the class of 2,075 tags shared by the overlapping
gene models may change. The tag abundance-weighted
histograms of the antisense tag distances upstream of
the 3’ termini considering only those based on expert
reviewed NM transcripts are shown in Figure 6a, while
thos e including all gene models are shown in Figure 6b.
ThehistogrambasedonNMgenemodelsinFigure6a
exhibits a relatively smoothly decreasing tag abundance-
weighted tag sequence count profile as the distance
from the 3’ terminus increases. This observation, ba sed
on thousands of experimentally verified distinct genes,
suggests that this profile is reasonably accurate. This
profile is different from the one in Figure 6b that
includes computationally deriv ed gene models. The
inclusion of computationally derived gene models pro-
duced a spike in the TPM-weighted tag sequence counts
400 nucleotides upstream of the 3’ termini, and is most
likely due to errors in the gene models or draft genome
assembly. If the tags responsible for this spike at 400
nucleotides can be removed by correcting the likely
antisense and sense tag mis-annotation upstream of the
3’ terminus, a higher propor tion of the anti sense tags in
Figure 6b would likely shift towards the 3’ te rminus,
increasing the rate at which the antisense curve
approaches 1 in the ECDF. Although these corrections
will likely significantly affect the overall antisense tag
abundance, they will have a much smaller e ffect on the
sense tags because they are 11.5 times more abundant.
Tissues with atypical transcription tag profiles
Due to the relatively high frequency of incorrectly pre-
dicted gene models in the draft bovine genome (espe-
cially at the 3’ end of transcripts where a high
propo rtion of predicted BGA tags sho uld lie), we used a
set of tags t hat mapped uniquely within the boundaries
of genes with expert reviewed, high-quality annotation
(Os-fgU tags that mapped to NM/NR in the RefSeq
database) to examine general characteristics of tag distri-
butions relative to tissue and tissue class. The tissue
with the highest sense tag abundance mapping to the 3’
terminus of the NM/NR transcripts is the juvenile
female hypothalamus (BGA16) at 499,200 total TPM
(49.9% of all tags in this library mapped to NMs and
NRs, by definition) compared to all tissues with a mean
value of 252,249 TPM (53,104 SD) or 25.2% of all tags
mapping to NMs and NRs. Given that this tissue has
the highest proportion of tags mapping to the NM/NR
RefSeq transcripts, it follows that there should be a
lower proportion of tags not corresponding to the 3’-
most DpnII site relative to the other tissues - if the tag
generation process is working prope rly. Indeed, the
hypothalamus tissue had the second lowest percentage
of tags mapping upstream of the 3’ endtagsat4.4%
relative to all NM/NR tags. The tissue with the lowest
percentage was the lact ating mammary gland (BGA173)
Figure 5 Empirical cumulative distribution functio n (ECDF) of
the upstream tag sequence distance from the 3’ terminus (all
distances upstream of the 3’ terminus). This ECDF plot was
created using Os-fgU tags that mapped to all RefSeq transcripts, in
either the sense or antisense orientation. Nt, nucleotides.
Harhay et al. Genome Biology 2010, 11:R102
/>Page 10 of 18
Figure 6 Comparison of the distributions of antisense tags upstream from the 3’ terminus using different RefSeq gene models. (a) Tag
abundance-weighted histogram of the upstream distance from the 3’ terminus of antisense tag sequences mapping to NM RefSeq transcripts
(all distances upstream of the 3’ terminus). Os-fgU tags from all libraries were mapped only to NM RefSeq transcripts (curated and considered
reliable). (b) Tag abundance-weighted histogram of the upstream distance from the 3’ terminus of antisense tag sequences mapping to all
RefSeq transcripts (all distances upstream of the 3’ terminus). Os-fgU tags from all libraries were mapped to both NM and XM RefSeq transcripts.
The XM transcripts are model sequences that are considered less reliable than the NM transcripts. Nt, nucleotides.
Harhay et al. Genome Biology 2010, 11:R102
/>Page 11 of 18
at 2.4%, consistent with its ranking a s the third highest
percentage of tags mapping to NM/NR transcripts of
37.1%.
The lactating mammary gland is distinctive in at least
two other ways. First, this tissue exhibits the lowest per-
centage (3.18%, range up to 12.7%; Additional file 1) of
antisense tag abundance relative to total (antisense + sense
tag) abundance for tags mapping within loci, although the
juvenile female thalamus (BGA5) at 4.24% and the juvenile
female temporal cortex (BGA49) at 5.44% show similar
behavior relative to the mean value for all tissues of 10.3%
(2.4% SD). Second, the lactating mammary gland exhibits
the low est number of unique Gen eIDs with sen se tag
matches at 8,687 GeneIDs compared to a mean of 11,469
GeneIDs (862 SD), although the distribution of GeneIDs is
non-Gaussian (data not shown).
Characterizing the tissues with independently verifi-
able predicted physica l measures is a powerful mechan-
ism to compare the B GA data with data generated by
different experimental methods, such as proteomics. As
an illustration, w e identified tissues with atypical pat-
terns of tag abundance r elative to transcript length for
tags mapping uniquely to NM transcripts. First, the
extent to which the distribution of inferred NM (pro-
tein-coding) transcript lengths of each tissue transcript
profile deviates from the distribution of the lengths of
all NM transcripts (Figure 7b) was calculated in a man-
ner similar to that used for investigating G+C tag bias
[18]. Figure 7a is a histogram of the tag abundance-
weighted inferred mean transcript length in each tissue
that reveals a modest tag bias towards shorter tran-
scripts, for most libraries, with a MEL (M-estimator of
location) of -0. 214 (in units of median absolute devia-
tion (MAD) scale estimate of all known NM transcript
lengths). Robust estimators of location were used
because the distribution in Figure 7a is clearly non-
Gaussian . The distribution of inferred transcript lengths
in Figure 7a has a MAD scale estimate of 0.2952. Two
tissues, BGA173 (90-day lactating gland) and BGA92
(male fetal bone) are outliers at either end of the distri-
bution of inferred transcript lengths. The extreme beha-
vior of these two tissues for the MEL of transcr ipt
length was investigated by plotting the inferred tran-
script length of each NM Ref Seq against tag abundance
within each tissue.
Figures 8 and Figure 9 are h istograms of the inferred
NM RefSeq tag a bundance-weighted transcript length
profiles for the juvenile 90-day lactating gland (BGA173)
and male fetal bone (BGA92), respectively. In both pro-
files, tags related to a handful of transcripts dominated
the tag abundance. In the case of lactating mammary
gland in Figure 8, the tags from just four transcripts/
genes dominated. The most abundant transcript was
casein alpha s1 (CSN1S1 [GeneID:282208]) at 1,172
nucleotides, fol lowed by casein alpha s2 (CSN1S2 [Gen-
eID:282209]) at 1,024 nucleotides, casein kappa (CSN3
[GeneID:281728]) at 850 nucleotides, then glycosylation-
dependent cell adhesion molecule 1 (GLYCAM1 [Gen-
eID:282430]) at 679 nucleotides. This result is consistent
with previous studies of the lactating ma mmary gland
that indicated these genes were highly expressed
[19-21], and demonstrate that the tag abundance-
weighted low average transcript length for this library
was due to the high expression of a few relatively short
transcripts. Although tags were observed that uniquely
map to the casein beta (CSN2 [GeneID:281099]) geno-
mic region, there are no DpnII sites within the asso-
ciated RefSeq mRNA [GenBank:NM_181008.2] (98.0%
BLAST similarity to the genomic sequence) and, there-
fore, it is not included in Figure 8. Notably absent in
Figure 8 was high expression of the transcript encoding
alpha-lactal bumin (LALBA [GeneID:281894]), usually
abundant during mid-lactation. This was because the
tag sequence associated with the 3’-most DpnII site of
LALBA transcript matches three places in the draft gen-
ome sequence, all of which lie near one another on
chromosome 5 adjacent to a segment of 144,722 ‘N’
residues (unknown base) and potent ially indicating pro-
blems with t he assembly. Similar to the description of
GAPDH earlier, the pattern of expression of the tag was
consistent with LALBA anditwaspresentinhighcon-
centration ( > 57,000 TPM) in lactating mammary
gland, suggesting that it would be reasonable to assume
all instances of the tag were generated from LALBA.
The histogram in Figure 9, BGA92 (male fetal bone),
exhibits the expected behavior for this ‘outlier’ tissue. A
high number of tags related to two genes with particu-
larly long transcripts, encoding structural collagens,
dominated the distribution and led to a high average tag
abundance-weighted transcript length. This profile is
consistent with actively growing bone tissue and gives a
glimpse into which transcripts’ abundances dominated
at this stage of development.
Constitutively expressed genes
Asetof‘housekeeping’ genes was identified from tags
that mapped to single genomic locations within the
bounda ries of genes annotated with NM/NR transcripts
(that is, mostly from the Os-fgu-PC set in Figure 2b)
and observed in all 95 BGA samples. Variability in the
expression level of these genes betwe en tissues was
quantified by the coefficient of variation of their tag
abundances to identify candidate genes that might be
used as normalization controls in cross-tissue gene-
expression experiments. A complete list of all 5,429 con-
stitutively expressed genes is presented in Additional file
3, ordered from the genes with the lowest coefficient of
variation to the greatest.
Harhay et al. Genome Biology 2010, 11:R102
/>Page 12 of 18
A gene’s absence from the list in Additional file 3 may
be due to a number of factors, including the two dis-
cussed earlier: 1) the gene doesn’t have a DpnII s ite, 2)
the gene’s constitutively expressed tags matches more
than one genome location, 3) the gene cannot be
mapped to at least one Os-fgU tag in each and every tis-
sue, and 4) that genes previously thought to be constitu-
tively expressed are not in t he relatively large number
(compared to previous studies) of functional diversity
tissues (e.g., coronary band, medulla oblongata, and kid-
ney fat) presented in this study. Consider the case of the
canonical housekeeping gene, b-actin (ACTB,[Gen-
eID:280979]), predicted to produce a ubiquitously
expressed tag that fails to make the list because it
matched to multiple places in the draft genome. As with
GAPDH, another canonical housekeeping gene discussed
above, the tag ca nnot be unambigu ously associated with
expression of the particular transcript and the BGA data
must be carefully interpreted before making conclusions
about the variation in expression among tissues. There-
fore, the list of constitutively expressed genes should be
considered a putative ordering of a list of candidate
housekeeping genes with mean values and other statis-
tics validated by other experimental means. However,
the data do su ggest that the gene encoding stomatin-
like 2, STOML2 [GeneID:510324], has the lowest coeffi-
cient of variation among those in the list and is
expressed at a high enough level in all tissues that it
Figure 7 Distributi on of the inferre d mean RefSeq tra nscrip t lengths by libr ary. (a) Histogram of the tag abundance-weighted mean
transcript lengths. The abscissa unit is the mean absolute deviation (MAD) scale estimate (a robust estimate of the dispersion in the data) of all
RefSeq NM transcript lengths, while the origin is set to the M-estimator of location (MEL; robust estimate of the mean) of the NM transcript
lengths. If the inferred transcript lengths were unbiased, the histogram would be centered on 0 at the red star. The inferred transcript lengths
were biased towards shorter transcripts. (b) Histogram of the length of all bovine RefSeq NM transcripts. The MEL of this distribution is marked
with the red star and corresponds to the origin in (a). Nt, nucleotides.
Harhay et al. Genome Biology 2010, 11:R102
/>Page 13 of 18
may be a potentially useful and stable reference in cross-
tissue expression experiments.
Constitutively expressed and non-genome-mapping tags
The breadth and diversity of the BGA samples were
used to identify constitutively expressed genomic
regions mapping to the NCBI 4.1 draft genome, map-
ping both within and outside of the known gene models.
There were 5,429 constitutively expressed loci that were
associated with 45,178 unique tag sequences, mapping
anywhere within the known boundaries of the loci, for a
total of 33,26 1,577 TPM. There were 8 ,694 unique tag
sequences constitutively expressed with a total normal-
ized abundance of 37,290,551 TPM, 5,249 of which were
found to map to 4,610 distinct loci (GeneIDs) for a total
normalized abundance of 29,402,2 65 TPM. The remain-
ing 3,445 tags, with a total 7,888,287 TPM, mapped to
the draft genome, but outside k nown gene boundaries.
Since these constitutively expressed tags were generate d
from polyadenylated mRNA, these tags likely correspond
to genuine transcripts from incompletely annotated
genes. Supporting the proposition that these 3,445 tags
originated from extant constitutively expressed tran-
scripts, 2,603 of the 3,445 tags were found to exactly
map to contigs de novo assembled from norma lized
bovine adipose tissue transcriptome reads sampled from
an animal not contributing to the BGA data (data not
shown). Since the library was normalized, it was unlikely
that all 3,445 tags would be found in this library.
In a similar analysis, the diversity of the BGA samples
was used to identify constitutively expressed tags not
mapping to the draft genome. The presence of these
tags in all tissues suggests that they are not artifacts, but
represent genuine transcripts. There were 206,963
unique tag sequences with an aggregated tag abundance
of 9,737,034 TPM (10.8% of Os-F TPM) that did not
match the cattle draft genome (Os-fNG in Figure 2b),
including the mitochondrial genome. There were 797
tags with 3,0 22,585 TPM or 31.0% of Os-fNG that did
not map to the draft genome but were constitutively
expressed, often in relatively high abundance, while
those found in fewer libraries were more likely to b e
found in low abundance. These non-matching tags
could be artifacts, genomic regions specific to the indivi-
dual animals sampled (allelic variants), or they could
represent regions of the transcribed genome not
included in the draft bovine genome. To check the pos-
sibility that some of these non-matching tags were due
to single base mismatches, MAQ was used to screen
these non-matching tags from positions 5 to 20 (the
first four bases representing the DpnII recognition site)
against the NCBI 4.1 build of the draft bovine genome
and all 1.52 million bovine ESTs in GenBank. Those
tags that exhibited single-base mismatches to the draft
bovine genome amounted to 139,537 unique tag
sequences for 4,938,528 TPM (Os-fng-SMM; Figure 2b)
or 50.7% of the non-matching tag abundance (Os-fNG).
Mapping the non-matching tags to the bovine ESTs
rev ealed 18,436 Os-fng-EST tags that perfectly matched
the ESTs and accounted for 5,542,181 TPM or 56.9% of
the non-matching tag abundance (Os-fNG). From the
Os-fng-SMM that were a single-base mismatch away
from matching a genomic region, 8,767 unique tag
Figure 8 Histogram of the tag abundance-weighted inferred
NM RefSeq transcript lengths for BGA173 (90-day lactating
mammary gland). The histogram shows the inferred distribution of
transcript lengths for the 90-day lactating mammary gland shown in
Figure 7a to be composed of atypically shorter transcripts. Nt,
nucleotides.
Figure 9 Histogram of the tag abundance-weighted inferred
NM RefSeq transcript lengths for BGA92 (male fetal bone). The
histogram shows the inferred distribution of transcript lengths for
the male fetal bone shown in Figure 7a to be composed of
atypically longer transcripts. Nt, nucleotides.
Harhay et al. Genome Biology 2010, 11:R102
/>Page 14 of 18
sequences with a tag abundance of 2,011,638 TPM
(20.7% of the Os-fNG) were also a perfect match to the
bovine ESTs. The behavior of the non-matching tags in
these different categories, with respect to the number of
tissues that they are present in, is shown in Additional
file 4.
Theconstitutivelyexpresseduniquenon-genome-
matching tag sequences at the rightmost position in
Additional file 4 are surprisingly few relative to their
contribution to the overall non-genome mapping tag
abundance. There were 613 tag sequences at 2,693,431
TPM constitutively expressed that mapped to EST s,
amounti ng to 27.7% of all non-mapp ing tags. Expanding
this list to include constitutively expressed tags with sin-
gle-base mismatches to the draft genome resulted in
761 tags at 2,970,598 TPM (30.5% of the Os-fNG) that
accounted for 95.4% of the constitutively expresse d
uniq ue tag sequences and 98.3% of the total normalized
constitutively expressed tag abundance. These data show
that a small fraction (0.37%) of the total number of tag
sequences accounts for 31.0% of the total tag abundance
of non-genome-matching tags. The observation of con-
stitutively expressed tags suggests that these were
derived from rea l biological entiti es. While it is difficult
to determine the relative contributions of artifacts, geno-
mic variation between individuals, and undiscovered
regions of the draft bovine genome, this analysis shows
that between 28 and 57% of the total non-matching tag
abundance can be associated w ith observed tra nscripts,
suggesting that the NCBI 4.1 draft bovine genome
assembly could be improved to account for these obser-
vations. Although the 10.8% of the total tag a bundance
(Os-F) that does not match the draft genome constitutes
a significant fraction of the Os-F, most of the non-
matching tags map to previously sequenced transcript s,
sugge sting that these non-genome mapping tags are not
indicative of a systematic problem with tag generation
or sequencing.
Conclusions
The BGA tissue transcriptome resource provides new
insights into mammalian biology. C lustering all the tis-
sues based on the similarities of their transcript tag pro-
files reveals both expected and unexpected associations
that, in most cases, confirms the BRENDA ontology
and, at least in one case, suggest s additional tissue asso-
ciations. The demonstration of wide variation in the
mitochond rial percentage of overall gene expression and
the observation of it being relatively extremely high
(over 50%) for the juvenile female thalamus, temporal
cortex, medulla oblongata, as well as their highly similar
mitochondrial transcript profiles, were unexpected.
These observations m ay serve to seed new hypotheses
concerning mitochondrial-related neurodegenerative
diseases. The lactating mammary gland exhibited the
lowest number of expressed distinct genes, the lowest
proportion of antisense tags to all tags, and the highest
proportion of the shortest transcripts of any of the tis-
sues, reflecting its role as a factory for milk proteins.
The distribution of inferred transcript lengths in all tis-
sues is a simple example of computing a metric that can
be used to compare the tissues and link the transcrip-
tome profiles with other methods, for instance,
proteomic.
Certain antisense and sense tags that both did and did
not map to the draft genome were used to show that
the NCBI 4.1 draft genome assembly and/or annotation
could be improved, most likely in or around computa-
tionally derived gene models and overlapping genes. In
addition, we provide a list of candidate housekeeping
genes and their coefficient of variation that may prove
useful in future investigations. The BGA website [8] pre-
sents a view of the transcriptome from a genome posi-
tion perspective, providing a useful resource to address
questions concerning the diversity of tissues in which a
particular gene, or set of cluster ed genes, are expressed.
This resource will also be useful for studies examining
coordinated expression of genes by genomic region.
Materials and methods
Tissue collection and total RNA isolation
All bovine tissues were collected following the US
Department of Agr iculture (USDA) Agricultural
Research Service (ARS) animal use and care protocols.
Mos t tissues were snap frozen in liquid N
2
immediately
after excision. Exception s were bone marrow that was
separated from bone with a syringe needle and white
blood cells collected as a buffy coat by centrifugation
(3000 × g, 4°C, 30 minutes). Residual red blood cells
were removed from the buffy coat by resuspending
twice in 140 mM NH
4
Cl, 17 mM Tris/HCl and collect-
ing the unlysed cells by repeating centrifugation after
each resuspension. All samples were stored at -80°C
until sonicated or pulverized and then homogenized
using a polytron homogenizer for extraction of total
RNA with TRIZOL (Molecular Research Center, Cincin-
nati, OH, USA), using the manufacturer’s protocol. The
integrity of the RNA was confirmed by a 2100 Bioanaly-
zer and RNA 6000 Nano-chip (Agilent, Santa Clara, CA,
USA). The samples used had an average RNA integrity
number (RIN) value of 8.0 and a 28S:18 S rRNA ratio of
1.42.
Tag library construction and sequencing
Tag library preparation was performed at Illumina
(formerly Solexa, Hayward, CA, USA) using a progeni-
tor version of DGE-Tag Profiling DpnII Sample Prep
kit and protocol. In brief, total RNA aliquots (1 or 2
Harhay et al. Genome Biology 2010, 11:R102
/>Page 15 of 18
μg) were diluted in 50 ml of nuclease-free H
2
Oand
heated at 65°C for 5 minutes to disrupt secondary
structure prior to incubation with magnetic oligo-dT
beads to capture the poly-adenlyated RNA fraction.
First- and second-strand cDNA was synthesized and
bead-bound cDNA was subsequently digested with
DpnII to reta in a cDNA fragment from the 3’ -most
GATC to the poly(A)-tail. Unbound cDNA fragments
were washed away prior to ligation with GEX DpnII
adapter to the 5’ end of the bead-bound digested
cDNA fragments. This adapter contains a restriction
site for MmeI that cuts 17 bp downstream of the
DpnII site. After subsequent digestion with MmeI, 2 1
bp tags starting with the DpnII recognition sequence
were recovered from the beads and dephosphorylated
prior to phenol/chloroform extraction. Then, a second
adapter (GEX adapter 2) was ligated onto the 3’ end of
the cDNA tag at the MmeI cleavage site. The adapter-
ligated cDNA tags were enriched by a 15-cycle PCR
amplification using Phusion polymerase (Finnzymes
(now Thermo Fisher Scientific), Lafayette, CO, USA)
and primers complementary to the adapter sequences.
The resulting fragments were purified by excision from
a 6% polyacrylamide Tris-borate-EDTA (TBE) gel. The
DNA was eluted from the gel debris with 1× NEBuffer
2 by gentle rotation for 2 hours at room tempe rature.
Gel debris were removed using Spin-X Cellulose Acet-
ate Filter (2 ml, 0.45 μm) and the DNA was prec ipi-
tated by adding 10 μl of 3 M sodium acetate (pH 5.2)
and 325 μl of ethanol (-20°C), followed by centrifuga-
tion at 14,000 rpm for 20 minutes. After washing the
pellet with 70% ethanol, the DNA was resuspended in
10 μl of 10 mM Tris-HCl, pH8.5 and quantified with a
Nanodrop 1000 spectrophotometer. Sequenc ing using
Solexa/Illumina Whole Genome SequencerCluster gen-
eration was performed after applying 4 picomoles of
each sample to the individual lanes of the Illumina 1G
flowcell. After hybridization of the sequencing primer
to the single-stranded products, 18 cycles of base
incorporation were carried out on the 1G analyzer
according to the manufa cturer’sinstructions.Image
analysis and base calling were performed using the
Illumina Pipeline, where sequence tags were obtained
after purity filtering.
Primers
GEX adapter 1: 5’ P-GATCGTCGGACTGTAGAACTCT-
GAAC; 5’ ACAGGTTCAGAGTTCTACAGTCCGAC.
GEX adapter 2: 5’ CAAGCAGAAGACGGCATACGANN;
5’ P-TCGTATGCCGTCTTCTGCTTG. GEX PCR primer
1: 5’ CAAGCAGAAGACGGCATACGA. GEX PCR pri-
mer 2: 5’ AATGATACGGCGACCACCGACAGGTTCA-
GAGTTCTACAGTCCGA. GEX sequencing primer: 5’
CGACAGGTTCAGAGTTCTACAGTCCGACGATC.
Tag processing
The sequence, abundance, and position in the draft gen-
ome of each of the tags were stored within the database
backends of GBrowse [22] and Identitag [23]. Represent-
ing the tags within the GBrow se database was a conve-
nient way to visualize the tags within a gene-centric
context, while the Identitag data were optimized for tag-
centric queries. The tag sequences were provided in
fastq files for each library. Each fastq library file was
processed with a custom perl script that aggregated
identical sequences and produced a tag library file with
three columns: unique sequence, raw tag count, and
normalized tag count in TPM. Each library was normal-
ized to contain 1 million TPM. The tag library files
were processed though a customized version of the
Identitag pipeline that created and populated a MySQL
database of tags for all libraries. The adaptor sequence
GTCGGACTGTAGAACT constituted 4,047,333 total
raw tag counts and 1,235,500 total normalized tag
counts (TPM). Tags with the adaptor sequence or inde-
terminate bases were filtered out for subsequent
analyses.
Tags mapping to the draft genome
The tags in the Identitag database were related to
bovine genomic position and annotation by processing
the tags in the Identitag database with a custom perl
script. The purpose of this perl script was two-fold: to
create tag-mapping files that could be imported into
GBrowse; and to populate two tables within the Identi-
tag database that linked the tags mapping within gene
boundaries in the Identitag database to the loci anno-
tated in the GBrowse database. Tag-mapping genome
coordinates, tag, and library information were written to
GFF3 files with this script. These GFF3 data were subse-
quently parsed into the database using the standard
GBrowse parsing tool, bp_fast_load_gff.pl. The script
used regular expression searching of the bovine genomic
(NCBI version 4.1) contig FASTA files for all possible
20-base tags beginning with the DpnII restriction site,
GATC, resident on either strand of the genomic DNA.
All putative tags discovered were q ueried for their pre-
sence in the Identitag database, while the tags’ locations
were determined using the fdata table in the GBrowse
database. If a tag was present within a gene boundary
and i n the Identitag database, the script associated and
recorded the gene’s unique GBrowse identifier (fdata.fid)
with the tag’ s unique Identitag identifier in a dedicated
table. Because a tag may be present in more than one
tissue, this association was performed for all tag-tissue
combinations. This script also associated the gene’ s
unique GBrowse identifier with t he tag sequence, the
tag’s starting and ending positions, and strand on the
genomic contig in a separate table.
Harhay et al. Genome Biology 2010, 11:R102
/>Page 16 of 18
Computed tag characteristics
Often used computed tag characteristics such as tag
sequences passing the significance filter (tag abundance
greater than 2 TPM in at lea st one library or present in
at least ten libraries) were computed with SQL queries
of the Identitag and GBrows e databases and parsed into
their own tables in the Identitag database. Typical exam-
ples include the numb er of times an observed tag
sequence was found to ma tch the draft genome, the
number of tags for each locus (GeneID), constitutively
expressed genes, and tags not matching the draft gen-
ome. The R computing environment [24] was used to
calculate the empirical cumulati ve distribut ion functions
and histograms using the heR package [25], robust esti-
mators were calculated w ith the Rallfun-v7 functions
[26], and most plots were created using the ggplot2
package [27]. MAQ [28] (version 0.7.1) was used with
default parameters to map the non-genome mapping
tags to the draft genome all owing for a s ingl e base mis-
match between tag base positions 5 to 20. MAQ was
also used to find all non-genome mapping tags that per-
fectly map any Bos taurus EST in GenBank. Simcluster
[12] was used to plot the similarities in the transcrip-
tional tag profiles with complete linkage.
Data availability
The data are archived at the NCBI Gene Expression
Omnibus (GEO) under accession [GEO:GSE21544] [29].
Additional material
Additional file 1: Tissues sampled and annotation. BRENDA tissue
ontology terms are given when known, with the hyphenated number at
the end of the column headings specifying level of granularity, where 1
is the lowest level of granularity and the broadest scope. Only tags
mapping uniquely to the draft genome that passed our filters (Os-fgU;
Figure 2b) were considered. Total Sense TPM Within NM & NR
Transcripts: sum of normalized tag counts (tags per million) that mapped
on the same strand and within the boundaries of NM and NR transcripts.
On 3’ terminus: sum of normalized tag abundance of those tags that
mapped on the same strand and at the 3’-most and next to 3’-most
DpnII sites on the NM or NR transcript (Figure 2a). Not on 3’ terminus:
sum of normalized tag abundance of those tags that did not map to the
3’-most and next to 3’-most DpnII sites on the NM or NR transcript
(Figure 2a): Count Sense GeneID: total number of unique GeneIDs
associated with the loci that the tags mapped to on the same strand
and within the boundaries of the annotated genes. Count Sense Tags
within Loci: number of unique tag sequences that mapped within the
boundaries of annotated genes. Total Sense TPM within Loci: sum of
normalized tag abundance of those tags that mapped on the same
strand and within the boundaries of all annotated genes. The headings
including the word ‘AntiSense’ are similarly defined, except that these
tags mapped to the strand opposite to that of the annotated gene.
Additional file 2: (a) Association of the number of unique sense tag
sequences within protein-coding loci with the number of unique protein
coding loci for each tissue library. CSTL_PC: count unique sense tag
sequence within protein-coding loci. CSG_PC: count sense protein-
coding loci from Additional file 1. Each data point represents a single
tissue library. The top pane shows that number of sense tags found with
protein coding loci varies quadratically with the number of protein
coding loci. The bottom pane shows the residuals from the fit of the
data to the quadratic above. (b) Association of the number of unique
antisense tag sequences within loci with the number of unique loci for
each tissue library. CATL_PC: count unique antisense tag sequence
within protein-coding loci. CAG_PC: count antisense protein-coding loci
from Additional file 1. Each data point represents a single tissue library.
The top pane shows that number of antisense tags found with protein
coding loci varies quadratically with the number of protein coding loci.
The bottom pane shows the residuals from the fit of the data to the
quadratic above.
Additional file 3: Housekeeping genes. Loci that were observed to be
ubiquitously expressed were ordered according to the coefficient of
variation in the sum of the observed normalized tag abundance (TPM) of
all tags mapping on the same strand and within the boundaries of the
gene. Only tags mapping uniquely to the draft genome that passed our
filters (Os-fgU; Figure 2b) were considered.
Additional file 4: Classification of non-genome mapping tags with
respect to the number of libraries they were present in and their
mapping behavior with respect to EST and genome mismatches.
This figure shows that the dominant class of non-genome mapping tags
are those that are found in nearly every tissue and that most of these
map to ESTs or exhibit a single base mismatch from genome mapping
tags.
Abbreviations
BGA: Bovine Gene Atlas; bp: base pair; BRENDA: Braunschweig Enzyme
Database; DGE: digital gene expression; ECDF: empirical cumulative
distribution function; EST: expressed sequence tag; MAD: median absolute
deviation; MEL: M-estimator of location; NGS: next generation sequencing ;
Os: Operative set of tags where all bases were defined; Os-F: subset of Os
that passes the 2 TPM or ten library filter; Os-fG: subset of Os-f that maps to
the draft bovine genome; Os-fgU: subset of Os-fG that maps uniquely to
draft bovine genome; Os-fgu-PC: subset of Os-fgU that map to protein
coding genes; Os-fNG: subset of Os-f that does not map to the draft
genome; Os-fng-EST: subset of Os-fNG that matches any of the 1.52 × 10
6
bovine EST in GenBank; Os-fng-SMM: subset of Os-fNG that matches the
draft genome allowing for a single base mismatch from tag base 5 to 20;
Os-G: subset of Os that maps to draft bovine genome; RIN: RNA integrity
number; SD: standard deviation; SubQ: subcutaneous; TBE: Tris-borate-EDTA;
TPM: tags per million; UTR: untranslated regions.
Acknowledgements
This project was supported by NRI-Animal genome reagent and tool
development no. 2006-35616-16648 from the USDA Cooperative State
Research, Education, and Extension and by projects 1265-31000-098 D
(BFGL) and 5438-31000-073 D (USMARC) from the USDA Agricultural
Research Service. We thank Andy Roberts, Richard Waterman (USDA, LARRL),
Steve Moore (University of Alberta), Mike Brownstein (Venter Institute), Steve
Smith (TAMU), and Anthony Capuco (USDA, BFGL) for collecting and
contributing tissue samples. We also thank Alicia Bertles (USDA, BFGL) for
RNA standardization and Keith Moon (Illumina, Inc., formerly Solexa) for
cDNA synthesis and next generation sequence analysis of these DGE library
samples. Mention of trade names or commercial products in this article is
solely for the purpose of providing specific information and does not imply
recommendation or endorsement by the US Department of Agriculture.
Author details
1
USDA-ARS US Meat Animal Research Center, State Spur 18 D, Clay Center,
NE 68901, USA.
2
USDA-ARS Fort Keogh Livestock and Range Research
Laboratory, 243 Fort Keogh Road, Miles City, MT 59301, USA.
3
Illumina, Inc.,
25861 Industrial Boulevard, Hayward, CA 94545, USA.
4
Department of
Bioinformatics and Computational Biology, George Mason University, 10900
University Blvd, Manassas, VA 20110, USA.
5
USDA-ARS Bovine Functional
Genomics Laboratory, 10300 Baltimore Avenue, Bldg 200 Rm 2A BARC-East,
Beltsville, MD 20705, USA.
6
Department of Computer Science, Mississippi
State University, Mississippi State, MS 39762, USA.
7
Department of Basic
Sciences, College of Veterinary Medicine, Mississippi State University,
Mississippi State, MS 39762, USA.
Harhay et al. Genome Biology 2010, 11:R102
/>Page 17 of 18
Authors’ contributions
GPH developed the data processing pipelines, website, and database
schema. GPH, TSS, TPLS, and LJA developed the concept of the BGA
resource and wrote the manuscript. LJA collected the Hereford tissues and
extracted total RNA. TSS standardized RNA samples for cDNA library
construction. CDH supervised quality control of all incoming RNA, library
preparation, sequence production, and all outgoing datasets. GPH, JWK, TSS,
LKM, SMS, and CPVT analyzed the data. CRG, SMB and SCB adapted the BGA
database and host the BGA website.
Received: 20 April 2010 Revised: 22 July 2010
Accepted: 20 October 2010 Published: 20 October 2010
References
1. Wang Z, Gerstein M, Snyder M: RNA-Seq: a revolutionary tool for
transcriptomics. Nat Rev Genet 2009, 10:57-63.
2. Mortazavi A, Williams BA, McCue K, Schaeffer L, Wold B: Mapping and
quantifying mammalian transcriptomes by RNA-Seq. Nat Methods 2008,
5:621-628.
3. Torres TT, Metta M, Ottenwalder B, Schlotterer C: Gene expression profiling
by massively parallel sequencing. Genome Res 2008, 18:172-177.
4. Lein ES, Hawrylycz MJ, Ao N, Ayres M, Bensinger A, Bernard A, Boe AF,
Boguski MS, Brockway KS, Byrnes EJ, Chen L, Chen L, Chen T-M, Chin MC,
Chong J, Crook BE, Czaplinska A, Dang CN, Datta S, Dee NR, Desaki AL,
Desta T, Diep E, Dolbeare TA, Donelan MJ, Dong H-W, Dougherty JG,
Duncan BJ, Ebbert AJ, Eichele G, et al: Genome-wide atlas of gene
expression in the adult mouse brain. Nature 2007, 445:168-176.
5. Siddiqui AS, Khattra J, Delaney AD, Zhao Y, Astell C, Asano J, Babakaiff R,
Barber S, Beland J, Bohacec S, Brown-John M, Chand S, Charest D,
Charters AM, Cullum R, Dhalla N, Featherstone R, Gerhard DS, Hoffman B,
Holt RA, Hou J, Kuo BY-L, Lee LLC, Lee S, Leung D, Ma K, Matsuo C,
Mayo M, McDonald H, Prabhu A-l, et al: A mouse atlas of gene expression:
large-scale digital gene-expression profiles from precisely defined
developing C57BL/6J mouse tissues and cells. Proc Natl Acad Sci USA
2005, 102:18485-18490.
6. Chang A, Scheer M, Grote A, Schomburg I, Schomburg D: BRENDA,
AMENDA and FRENDA the enzyme information system: new content
and tools in 2009. Nucleic Acids Res 2009, 37:D588-592.
7. Schomburg I, Chang A, Ebeling C, Gremse M, Heldt C, Huhn G,
Schomburg D: BRENDA, the enzyme database: updates and major new
developments. Nucleic Acids Res 2004, 32:D431-433.
8. The Bovine Gene Atlas. [].
9. Elsik CG, Tellam RL, Worley KC, Gibbs RA, Muzny DM, Weinstock GM,
Adelson DL, Eichler EE, Elnitski L, Guigo R, Hamernik DL, Kappes SM,
Lewin HA, Lynn DJ, Nicholas FW, Reymond A, Rijnkels M, Skow LC,
Zdobnov EM, Schook L, Womack J, Alioto T, Antonarakis SE, Astashyn A,
Chapple CE, Chen HC, Chrast J, Camara F, Ermolaeva O, Henrichsen CN,
et al: The genome sequence of taurine cattle: a window to ruminant
biology and evolution. Science 2009, 324:522-528.
10. Zimin AV, Delcher AL, Florea L, Kelley DR, Schatz MC, Puiu D, Hanrahan F,
Pertea G, Van Tassell CP, Sonstegard TS, Marcais G, Roberts M,
Subramanian P, Yorke JA, Salzberg SL: A whole-genome assembly of the
domestic cow, Bos taurus. Genome Biol 2009, 10:R42.
11. Pruitt KD, Maglott DR: RefSeq and LocusLink: NCBI gene-centered
resources. Nucleic Acids Res 2001, 29:137-140.
12. Vencio , Varuzza , Pereira , Brentani , Shmulevich : Simcluster: clustering
enumeration gene expression data on the simplex space. BMC
Bioinformatics 2007, 8:246.
13. Vidal E, Márquez M, Ordóñez M, Raeber AJ, Struckmeyer T, Oesch B, Sisó S,
Pumarola M: Comparative study of the PrPBSE distribution in brains from
BSE field cases using rapid tests. J Virol Methods 2005,
127:24-32.
14. Sakudo A, Ikuta K: Fundamentals of prion diseases and their involvement
in the loss of function of cellular prion protein. Protein Pept Lett 2009,
16:217-229.
15. Dubinsky JM: Heterogeneity of nervous system mitochondria: Location,
location, location! Exp Neurol 2009, 218:293-307.
16. Miele G, Jeffrey M, Turnbull D, Manson J, Clinton M: Ablation of cellular
prion protein expression affects mitochondrial numbers and
morphology. Biochem Biophys Res Commun 2002, 291:372-377.
17. He Y, Vogelstein B, Velculescu VE, Papadopoulos N, Kinzler KW: The
antisense transcriptomes of human cells. Science 2008, 322:1855-1857.
18. Siddiqui AS, Delaney AD, Schnerch A, Griffith OL, Jones SJM, Marra MA:
Sequence biases in large scale gene expression profiling data. Nucleic
Acids Res 2006, 34:e83.
19. Lemay DG, Lynn DJ, Martin WF, Neville MC, Casey TM, Rincon G,
Kriventseva EV, Barris WC, Hinrichs AS, Molenaar AJ, Pollard KS, Maqbool NJ,
Singh K, Murney R, Zdobnov EM, Tellam RL, Medrano JF, German JB,
Rijnkels M: The bovine lactation genome: insights into the evolution of
mammalian milk. Genome Biol 2009, 10:R43.
20. Sonstegard TS, Capuco AV, White J, Van Tassell CP, Connor EE, Cho J,
Sultana R, Shade L, Wray JE, Wells KD, Quackenbush J: Analysis of bovine
mammary gland EST and functional annotation of the Bos taurus gene
index. Mamm Genome 2002, 13:373-379.
21. Harris S, McClenaghan M, Simons JP, Ali S, Clark AJ: Gene expression in
the mammary gland. J Reprod Fertil 1990, 88:707-715.
22. Stein LD, Mungall C, Shu S, Caudy M, Mangone M, Day A, Nickerson E,
Stajich JE, Harris TW, Arva A, Lewis S: The generic genome browser: a
building block for a model organism system database. Genome Res 2002,
12:1599-1610.
23. Keime C, Damiola F, Mouchiroud D, Duret L, Gandrillon O: Identitag, a
relational database for SAGE tag identification and interspecies
comparison of SAGE libraries. BMC Bioinformatics 2004, 5:143.
24. R Development Core Team: R: A Language and Environment for Statistical
Computing Vienna, Austria 2009.
25. The heR Software Project. [ />26. Wilcox RR: Introduction to Robust Estimation and Hypothesis Testing San
Diego, CA: Academic Press, 2 2005.
27. Wickham H: ggplot2: Elegant Graphics for Data Analysis New York, NY:
Springer 2009.
28. Li H, Ruan J, Durbin R: Mapping short DNA sequencing reads and calling
variants using mapping quality scores. Genome Res 2008, 18:1851-1858.
29. Gene Expression Omnibus entry GSE21544. [ />geo/query/acc.cgi?acc=GSE21544].
doi:10.1186/gb-2010-11-10-r102
Cite this article as: Harhay et al.: An atlas of bovine gene expression
reveals novel distinctive tissue characteristics and evidence for
improving genome annotation. Genome Biology 2010 11:R102.
Submit your next manuscript to BioMed Central
and take full advantage of:
• Convenient online submission
• Thorough peer review
• No space constraints or color figure charges
• Immediate publication on acceptance
• Inclusion in PubMed, CAS, Scopus and Google Scholar
• Research which is freely available for redistribution
Submit your manuscript at
www.biomedcentral.com/submit
Harhay et al. Genome Biology 2010, 11:R102
/>Page 18 of 18