Báo cáo y học: "Immunostaining of modified histones defines high-level features of the human metaphase epigenome" potx
Bạn đang xem bản rút gọn của tài liệu. Xem và tải ngay bản đầy đủ của tài liệu tại đây (4.41 MB, 14 trang )
RESEA R C H Open Access
Immunostaining of modified histones defines
high-level features of the human metaphase
epigenome
Edith Terrenoire
1,2†
, Fiona McRonald
1,3†
, John A Halsall
1
, Paula Page
2
, Robert S Illingworth
4,5
, A Malcolm R Taylor
6
,
Val Davison
2
, Laura P O’Neill
1
, Bryan M Turner
1*
Abstract
Background: Immunolabeling of metaphase chromosome spreads can map components of the human
epigenome at the single cell level. Previously, there has been no systematic attempt to explore the potential of
this approach for epigenomic mapping and thereby to complement approaches based on chromatin
immunoprecipitation (ChIP) and sequencing technologies.
Results: By immunostaining and immunofluorescence microscopy, we have defined the distribution of selected
histone modifications across metaphase chromosomes from normal human lymphoblastoid cells and cons tructed
immunostained karyotypes. Histone modifications H3K9ac, H3K27ac and H3K4me3 are all located in the same set
of sharply defined immunofluorescent bands, corresponding to 10- to 50-Mb genomic segments. Primary
fibroblasts gave broadly the same banding pattern. Bands co-localize with regions relatively rich in genes and CpG
islands. Staining intensity usually correlates with gene/CpG island content, but occasional exceptions suggest that
other factors, such as transcription or SINE density, also contribute. H3K27me3, a mark associated with gene
silencing, defines a set of bands that only occasionally overlap with gene-rich regions. Comparison of metaphase
bands with histone modification levels across the interphase genome (ENCODE, ChIP-seq) shows a close
correspondence for H3K4me3 and H3K27ac, but major differences for H3K27me3.
Conclusions: At me taphase the human genome is packaged as chromatin in which combinations of histone
modifications distinguish distinct regions along the euchromatic chromosome arms. These regions reflect the high-
level interphase distributions of some histone modifications, and may be involved in heritability of epigenetic
states, but we also find evidence for extensive remodeling of the epigenome at mitosis.
Background
Large scale projects are underway to map the epigen-
omes of various eukaryotes, including humans. The
objective is usually to define the distribution across the
genome of modified histones, various non-histone
proteins or methylated cytosines, and then link these
modifications to genomic functions [1-3]. Genome-wide
analyses have been made possib le by coupling the long-
established technique of chromatin immunoprecipitation
(ChIP) with either high density DNA microarrays
(ChIP-chip) or next-generation DNA sequencing (ChIP-
seq) [4]. These powerful technologies require material
from large numbers of cells and the data generated
inevitably represent a mean value derived from cells
with differing patterns of expression from a significant
subset of genes. Differences can arise through intrinsic
transcriptional noise or because cells are in different
phases of the cell cycle . Such cell to cel l heterogeneity
inevitably limits the precision with which histone modi-
fications can be linked to chromatin function.
In principle, this issue can be addressed by using immu-
nomicroscopy to examine the distribution of histone
modifications at the single cell level. Metaphase chro-
mosome spreads provide a source of material in which
* Correspondence:
† Contributed equally
1
Chromatin and Gene Expression Group, Institute of Biomedical Research,
College of Medical and Dental Sciences, University of Birmingham,
Edgbaston, Birmingham B15 2TT, UK
Full list of author information is available at the end of the article
Terrenoire et al. Genome Biology 2010, 11:R110
/>© 2010 Terrenoire e t al.; licensee BioMed Central Ltd This is an open access article distribu ted under the terms of the Creative
Commons Attribution License ( which permits unrestricted use, distribution, and
reproduction in any medium, provided the original work is properly cited
individual chromosomes can be identified and in which
the entire human epigenome can be scanned in a single
cell. This approach has several additional advantages:
there is little or no transcription at metaphase, removing a
major source of variability between cells, consistency from
cell to cell can be monitored, fluorescent probes are extre-
mely sensitive (offering detection at the single gene level if
required) and the procedure is quick (once experimental
conditions are estab lished) and relatively cheap. It should
also be noted that immunostaining, if properly controlled,
can detect modified histones and other proteins across the
entire genome, including repeat-rich regions that are inac-
cessible to sequencing-based approaches [4]. While micro-
scopy cannot match the ultimate resolving power of ChIP-
seq, it has the potential to provide a valuable complemen-
tary approach to epigenomic mapping.
Immunolabeling o f metaphase chromosomes is a well
established technique and has revealed dramatic regional
differences in the distribution of specific histone modifi-
cations, particularly the distinctive pattern of modifica-
tions present on cent ric (constitutive) heterochromatin
in plants and animals [5-7] and the facultative hetero-
chromatin of the inactive X c hromosome in female
mammals [8,9]. Immunolabeling of meiotic (pachytene)
chromosomes in maize has shown regional variation in
levels of various methylated histone isoforms, with dis-
tinctive differences between heterochromatin a nd
euchromatin [10].
Surprising ly, there has been only limited use of meta-
phase chromosome immunostaining to map histone
modifications across individual chromosomes [11,12],
and no systematic attempt to explore the genome-wide
distribution of multiple histone modifications.
Here we describe a systematic analysis of the distribu-
tion of selected histone modifications across metaphase
chromosomes from normal human cells. Antibodies to
histone modifications previously linked to active tran-
scription (H3K9ac, H3K27acandH3K4me3,described
collectively as active modifications) all highlight the
same 10- to 50-Mb genomic regions, giving a character-
istic and consistent banding pattern. B ands closely cor-
respond to regions rich in genes and CpG islands
(CGIs). In contrast, H3K27me3, a mark associated with
gene silencing, shows a preference for telomeric regions
and defines bands that only occasionally overlap with
gene rich regi ons. At 10-Mb resolution, active modifica -
tions have similar, though not identical, distributions
across interphase [13] and metaphase chromosomes,
while H3K27me3 is clearly different. The results suggest
that there is extensive remodeling of the epigenome as
cells enter mitosis, but that a high-level memory of
some components of the interphase epigenome is
retained into metaphase.
Results
Classification of unfixed metaphase chromosomes
Standard protocols for preparation and staining of meta-
phase chromosomes require fixation in acidified organic
solvents, a step that ext racts the great majority of his-
tones and other proteins [14]. We have adopted an
approach using unfixed chromosomes [9,15,16], a proce-
dure that has the major advantage that histones remain
in their native (that is, unfixed, undenatured) form and
are therefore structural ly compatible with t he synthetic
peptides used to raise anti-histone antisera [17,18]. We
found that both the relative sizes and centromeric
indices (arm ratios) of unfixed chromosomes were very
similar to their counterparts fixed in methanol/acetic
acid (Additional files 1 and 2), allowing us to use these
properties as a first step in chromosome identification.
Unfixed chromosomes are not amenable to conventional
G-banding procedures. To distinguish morphologically
similar chromosomes, we used the chromosome-specific
banding patterns generated by the DNA counterstain
DAPI (4,6-diamino-2-phenyl-indole). DAPI selectively
stains regions that are AT-rich and GC-poor, and gives
a bandi ng pattern that resembles G -banding and is
unique for each chromosome [17].
Modifications associated with transcriptionally active and
silent chromatin show distinctive, banded distributions
across metaphase chromosomes
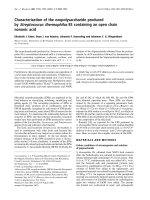
Unfixed metaphase chromosome spreads from human
lymphoblastoid cells were immunostained with
antibodies to histone H3 tri-methylated at lysine 4
(H3K4me3), a modification that has been associated
with transcript ionally active, or potentially active, chro-
matin [18-21]. Centromeric heterochromatin was consis-
tently unstained, while the arms of most chromosomes
showed a characteristic pattern of brightly stained and
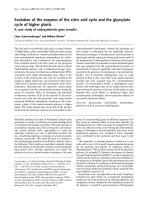
weakly sta ined region s (Figure 1a, b). Using a combina-
tion of size, centromeric index and reverse DAPI band-
ing (Figure 1c), we were able to identify all
chromosomes and co nstruct karyotypes (Figure 1d, e).
There was consistently strong staining of both arms of
chromosome 19, weak staining of chromosome 13 and
distinctive banding of most chromosomes, with particu-
larly prominent bands on chromosomes 1, 6, 9, 11 and
12. The immunofluorescent banding pattern was consis-
tent between sister chromatids and homologues and
reproducible from one spread to another, despite the
inevitable differences in overall chromosome size. Align-
ments of chromosomes from five immunostained
spreads are shown in Additional file 3.
Very similar immunostaini ng patterns were given by
antisera to two other modifications also loosely asso-
ciated with transcriptionally active chromatin, namely
Terrenoire et al. Genome Biology 2010, 11:R110
/>Page 2 of 14
H3 acetylated at lysine 27 (H3K27ac) and H3 acetylated
at lysine 9 (H3K9ac) [22,23] (Figure 2a; Additional files
4 and 5). Conversely, staining with a variety of antisera
to ac etylated H4 was more unifo rm. The acetyla ted H4
bands corresponded to those seen with antisera to
H3K4me3 but the differential labeling of bands and
interband regions was less extreme. A typical example is
shown in Figure 2c. H4K8ac is absent from both consti-
tutive (centric) and facultative heterochromatin and our
findings are generally consistent with previous studies
on acetylated H4 [10,13].
H3 tri-methylated at lysine 27 (H3K27me3) is put in
place by the methyltransferase Ezh2, a component of
the Polycomb silencing complex PRC2 and has been
(a
a)
(d)
(b)
1 2 3 4 5
6 7 8 9 10 11 12
13 14 15 16 17 18
19 20 21 22 X Y
(c)
(c
c)
(e)
1 2 3 4 5
6 7 8 9 10 11 12
13 14 15 16 17 18
19 20 21 22 X Y
Figure 1 Distribution of H3K4me3 across human metaphase c hromosomes. (a-c) Metaphase chromosome spreads from human
lymphoblastoid cells immunostained with antibodies to H3K4me3 (fluorescein isothiocyanate (FITC), green) and counterstained with DAPI
(pseudocolored red). Panel (a) shows both stains, panel (b) FITC only and panel (c) DAPI only, shown in black to resemble conventional G-
banding. (d) Immunostained karyotype constructed from the chromosome spread shown in (a-c). (e) Reverse DAPI (rDAPI) karyotype constructed
from the same spread.
Terrenoire et al. Genome Biology 2010, 11:R110
/>Page 3 of 14
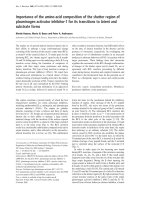
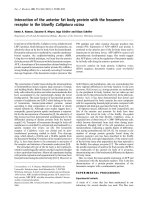
Figure 2 Immunolabeling of metaphase chromosomes from human lymphoblastoid cells with antisera to H3K27ac, H3K27me3,
H4K8ac and H4K20me3. (a) Immunostained karyotype from a metaphase chromosome spread immunostained with antibodies to H3K27ac
(fluorescein isothiocyanate (FITC), green) and counterstained with DAPI (pseudocolored red). (b) Immunostained karyotype from a metaphase
chromosome spread immunostained with antibodies to H3K27me3 (FITC, green) and counterstained with DAPI (pseudocolored red). (c)
Metaphase chromosome spread immunostained with antibodies to H4K8ac (FITC, green) and counterstained with DAPI (pseudocolored red).
Note the complete absence of FITC labeling at centric (constitutive) heterochromatin and the facultative heterochromatin of the inactive X (Xi).
(d) Metaphase chromosome spread immunostained with antibodies to H4K20me3 (FITC, green) and counterstained with DAPI (pseudocolored
red). Note the extensive, patchy staining of the interphase nucleus on the right. The arms of the Y chromosome (indicated) are labeled but its
centric heterochromatin is not.
Terrenoire et al. Genome Biology 2010, 11:R110
/>Page 4 of 14
associated with formation of facultative heterochromatin
and gene silenc ing [24-26]. In female cells, one of the
two X chromosomes generally stained more strongly
than its h omologue, and more strongly than the single
X in male cells (Figure 2b; Additional file 6). The m ore
intensely s tained X is likely to be the inactive homolo-
gue [27]. H3K27me3 was undetectable on blocks of con-
stitutive centric heterochromatin (Figure 2b; Additional
file 6) or on the Y heterochromatin in male cells (Addi-
tional file 7). There are distinctive regional variations in
H3K27me3 staining intensity along the chromosome
arms, but without the sharply defined banded distribu-
tion typical of H3K4me3 (Figure 1). We find only lim-
ited overlap between the two modificati ons. For
example, the sho rt arm of chromosome 6 is relatively
enriched in both modifications, but on closer in spection
H3K27me3 has a more telomeric location (6pter-22.3)
than H3K4me3, which is centrally located in the short
arm (centered at 6p21), leaving the telomeric region
relatively weakly stained (compare the multiple exam-
ples of chromosome 6 in Additional files 3 and 6). Also,
the prominent H3K4me3 band on chromosome 11q just
below the centromere (11q12.1-13.3) is not enriched in
H3K27me3 (Figure 2b). Overall, we find that H3K27me3
is consistently enriched at telomeric regions, at least on
the larger chromosomes (chromosomes 1 to 15). This
distinctive staining pattern was seen with two different
antisera to H3K27me3 (listed in Additional file 8).
H3K27ac is a modification that may act as an antagonist
of Polycomb-mediated silencing thro ugh suppression of
H3K27 tri-methylation [4,24]. While the distribution
of H3K27ac (Figure 2a) is clearly different f rom that of
H3K27me3 (Figure 2b), H3K27me3 is not consistently
excluded from regions rich in H3K27ac, or vice versa.
Immunostaining with antibodies to H4 tri-methylated
at lysine 20 (H4K20me3) strongly and selectively labeled
the centric heterochrom atin of metaphase chromosomes
from human lymphoblastoid cells (Figure 2d), consistent
with previo us results in other cell types [6]. Absence of
staining of centric heterochromatin by antisera to the
other histone modifications tested here is clearly not
due to a general inaccessibility of histone epitopes in
heterochromatin. Chromosome arms were essentially
unstained by antibodies to H4K20me3, with the excep-
tion of the Y chromosome in male cells, on which het-
erochromatic regions on the distal long arm were
consistently stained (Figure 2d).
Immunofluorescent chromosome banding in primary
fibroblasts closely resembles that in lymphoblastoid cells
Over the course of the work presented here, complete
immunostained karyotypes for H3K4me3, H3K9ac,
H3K27ac and H3K2 7me3 have be en constructed from
lymphoblastoid cell lines (LCLs) derived from two
different individuals, one male and one female. At the
present level of resolution, we have found no evidence
for indiv idual differences in chromosome banding. The
same banding patterns have also been seen in occasional
preparations from two other LCLs (results not shown).
Analyses of other cell types have been less extensive,
but immunostaining of chromosomes from human pri-
mary fibroblasts with antibodie s to H3K4me3 revea led a
banding pattern essentially the same as that seen in
LCLs (Additional file 9). The banding patterns described
are not restricted to a particular cell lineage. However,
difference s may occur among more widely divergent, or
aberrant, cell types. Improved resolution of immuno-
fluorescent bands, perhaps through analysis of extended,
prophase chromosomes, may also reveal differences not
apparent with the present approach.
Modifications associated with active chromatin are
enriched in regions rich in genes and CpG islands
Recent analyses have confirmed that most genes are
clustered i n a relatively small number of genomic
regions [28-30]. These gene-rich regions are also
enriched in CGIs, relatively CpG-rich DNA sequences
found at and around the promoter regions of many
genes and characterized by low levels of DNA methyla-
tion [31,32]. We constructed gene density/CGI maps for
each human chromosome by calculating the gene and
CGI content of 10-Mb windows across the chromo-
some. In F igure 3, the resulting histograms are aligned
with a representat ive example of each chromosome
immunostained for H3K4me3. There is a close and con-
sistent correspondence between high levels of H3K4me3
and regio ns of relati vely high gene/CGI content. This is
true not only for region s of intense staining (for exam-
ple, landmark bands on chromosomes 1q, 6p and 11q)
but also for less strongly staining bands that do not
stand out in the original spreads (for example, the bands
distributed across chromosomes 3 and 12) (Figure 1;
Additional file 3). As expectedfromourearlierresults,
chromosomes immunostained with antibodies to
H3K9ac and H3K27ac showed essentially the same close
relationship between staining intensity and gene/CGI
density (results not shown). In contrast, on chromo-
somes immunostained for H 3K27me3, there was only
limited overlap between gene/CGI-rich regions and
staining intensity (Additional file 7).
To allow a quantitative analysis of the relationship
between the distribution of histone modifications at meta-
phase and other chromosome properties, we measured the
level of H3K4me3 across chromosome 1 by scanning.
Typical scans of sister chromatids are shown in Figure 4a.
Fluorescence intensity is expressed as a percentage of the
most highly fluorescent element and distance along the
chromosome is expressed in megabases (chromosome 1 is
Terrenoire et al. Genome Biology 2010, 11:R110
/>Page 5 of 14
247 Mb long and we have assumed a linear relationship
between posit ions on the metaphase chromosome and
genomic DNA). To allow us to combine data from multi-
ple scans, the chromosome was divided into 25 equal seg-
ments (each having a nominal length of 10 Mb) and the
total fluorescence within each segment calculated. The
fluorescence distribution (banding pattern) obtained by
averaging scans from 12 chromosomes (24 chromatids) is
shown in Figure 4b. Comparison of these quantitative data
with gene and CGI frequencies across chromosome 1, also
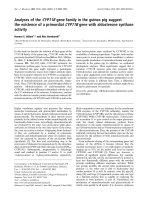
Figure 3 Correspondence between gene density, CpG island density and H3K4me3 levels across human metaphase chromosomes.
Metaphase chromosomes from human lymphoblastoid cells immunostained with antibodies to H3K4me3 are aligned with histograms showing
the distribution of genes (filled bars) and CpG islands (open bars) across the same chromosome. The example of each immunostained
chromosome shown was selected, for clear and representative banding, from the chromosomes aligned in Additional file 3.
Terrenoire et al. Genome Biology 2010, 11:R110
/>Page 6 of 14
grouped within 10-Mb windows (Figure 3), shows that
they are closely correlated (r = 0.70 and 0.68 respectively,
P < 0.0002).
As a first step in exploring the link between H3K4me3
levels at metaphase and transcription in interphase, we
used single color, high-density oligonucleotide arrays to
measure transcript levels for 3,071 RefSeq genes a cross
chromosome 1 in the same lymphoblastoid cells used
for immunolabeling. T otal transcript levels within
10-Mb windows across chromosome 1 are shown in Fig-
ure 4b. There is a close correlation between interphase
transcription and levels of H3K4me3 at metaphase,
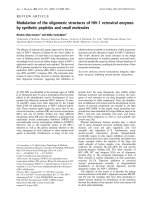
Figure 4 Quantitative analysis of H3K4me3 across metaphase chromosome 1 and comparison with interphase transcription. (a)
Scanning of human chromosome 1 immunostained with antibodies to H3K4me3. Scans from each sister chromatid are shown (dotted and solid
lines). The blue line on the immunostained chromosome was inserted manually to mark the centromere prior to scanning (see Materials and
methods for details). Note that peak positions differ slightly between sister chromatids, presumably due to differential stretching during
preparation. (b) Transcription from 3,071 RefSeq genes across chromosome 1 in human LCLs was measured by expression microarray and
summed within 10-Mb windows across the chromosome. Transcription (open bars) is plotted as the sum of normalized gene expression values
per 10-Mb window. H3K4me3 levels across chromosome 1 (solid line) were obtained by scanning (a). To obtain the mean distribution shown,
each scanned chromatid was divided linearly into 25 equal segments (nominally 10 Mb each) and fluorescence values within each segment
(expressed as percent maximum value for that scan) were summed. Each value shown is the average of 24 chromatids. The minimum value at
the centromere (120 to 130 Mb) was used as a background value and subtracted. There is some broadening of peaks derived from multiple
scans compared to single chromatid scans because of the shifts in peak position caused by differential stretching (a). A standard chromosome 1
ideogram showing major G bands is aligned with the histogram. FITC, fluorescein isothiocyanate.
Terrenoire et al. Genome Biology 2010, 11:R110
/>Page 7 of 14
measured by immunofl uorescence labeling (Figure 4b; r
=0.73,P < 0.00002). Both transcription and H3K4me3
immunofluorescence are strongest in regions of the
chromosome depleted in major G bands (for example,
1pter-p33, 1q21-23; Figure 4a, b).
Genome-wide distribution of histone modifications in
interphase and metaphase cells
The genome-wide distribution of various histone modifi-
cations in asynchronous (mostly interphase) human
lymphoblastoid cells has re cently been defined b y ChIP-
seq [33] (see Materials and methods). The results can be
aligned with immunostained metaphase chromosomes
to provide an initial comparison of the interphase and
metaphase epigenomes. Results for three modifications
(H3K27ac, H3K4me3 and H3K27me3) on three chromo-
somes (chromosome 1, 6 and 11) are shown in Figure 5.
At 10-Mb resolution, there is a close correspondence
between the interphase and metaphase distributions of
H3K27ac and H3K4me3, with clearly defined interphase
peaks aligning with the major metaphase bands. The
correspondence for H3K4me3 is particularly precise,
with even the weakly stained double band on distal
chromosome 1q evident in interphase (Figure 5). Quan-
titative analysis using chromosome scanning data (Fig-
ure 4) confirms the visual alignment of H3K4me3 levels
across chromosome 1 at metap hase and interphase, with
a strong correlation between them (r = 0.74, P <
0.00002; all pairwise correlations are presented in Addi-
tional file 10). In contrast, we find little correspondence
between the distributions of H3K27me3 in interphase
and metaphase. The chromosome-wide distribution of
H3K27me3 in interphase at 10-Mb resolution is rela-
tively homogeneous, the most prominent feature being
its depletion across the block of centric heterochromatin
on chromosome 1 (Figur e 5). There are no interphase
peaks corresponding to the highly stained H3K27me3
bands present at metaphase.
Previous studies have shown that progression into
mitosis is accompanied by an overall decrea se in global
histone acetylation levels, reduced acetate turnover and
changes in the relative levels of acety lation at specific
lysines [34,35]. In view of this, it is perhaps surprising
that the high level distribution of histone acetylation
across the inte rphase genome, as revealed by ChIP-se q,
is retained in metaphase chromosomes (Figure 5). A
possible explanation comes from the finding that for
both H3K27ac and H3K4me3, the differences between
enriched and deple ted regions are more extreme in
metaphase chromosomes than in int erphase chromatin.
For example, the regions on chromosome 1p and 1q
that lie between the brightly stained bands (distal 1p,
proximal 1q) are virtually unstained and comparable to
centric heterochromatin, a finding confirmed for
H3K4me3 by quantitative scanning (Figure 4a). The
equivalent regions at interphase show levels of modifica-
tion well abo ve that of centric heterochromatin (Fig-
ure 5). While the different technologies used to derive
the two sets of data may contribute to these differences,
the comparison suggests that at least some histone mod-
ifications are preferentially removed from gene-poor
chromosomal regions as cells enter mitosis.
Histone modification and genomic features
H3 di-methylated at lysine 4 (H3K4me2) has been
shown to be strongly enriched at promoters with the
highest CpG content (CGI promoters), even when they
are transcriptionally silent [36]. It has been suggested
that H3K4 methylation protects these promoters from
silencing by CpG methylation, a proposition supported
by in vitro experiments [37]. In light of these findings,
one could propose that H3K4me3 levels at metaphase
are a simple reflection of CGI density. However, closer
inspection of the chromosome labeling patterns suggests
that banding is unlikely to be solely attributable to sim-
ple genomic features such as gene or CGI density. For
example, the gene-rich, CGI-rich region 11q12.1-13.3 is
consistently one of the most strongly stained regions in
the genome with antisera to the three activating modifi-
cations tested. The region at 11pter-15.3 is similarly
gene-rich and only slightly less CGI-rich (Figure 3), yet
stains much less strongly with antisera to H3K27ac and
H3K4me3 (Additional files 3, 4 and 5). Another example
is provided by the gene/CGI-rich regions across chro-
mosome 12. The region on the q arm adjacent to the
centromere labels with antisera to all three active modi-
fications tested, but the labeling intensity is consistently
less than, o r at best equal to, labeling of the less gene/
CGI-rich region on the distal q arm (Figure 3; Add i-
tional files 3, 4 and 5). It is interesting to note that this
strongly staining distal region has a higher density of
short interspersed nuclear element (SINE) repeats
(UCSC hg18 [13]) than the more gene-rich, centromere
proximal region (Figure 6). This is unusual because
gene/CGI density and SINE density are very clo sely cor-
related across the genome (figures for chromosome 1
are shown in Additional file 10 ). On the basis of th ese
examples, it could be argued that SINE density is more
closely associated with levels of active histone modifica-
tions than gene/CGI density. This possibility is
supported by the correlations derived from the chromo-
some 1 scanning data (Additional file 10).
Discussion
Levels of genome organization
Immunostaining of polytene chromosomes from the sali-
vary glands of chironimid insects established the principle
that levels of histone acetylation across the interphase
Terrenoire et al. Genome Biology 2010, 11:R110
/>Page 8 of 14
Figure 5 Comparison of histone modifications across interphase and metaphase chromosomes. Representative metaphase chromosomes
immunostained for H3K27ac, H3K4me3 and H3K27me3 are aligned with the distribution of the same modification across the equivalent
interphase chromosome assembled from ENCODE ChIP-seq data [13]. Graphs were constructed by adding the number of reads within 10-Mb
windows, as used to plot gene/CGI frequencies (Figure 3), transcript levels and fluorescein isothiocyanate (FITC) staining intensity (Figure 4).
Figure 6 Correspondence between SINE repe at frequency and levels of H3K4 me3 and H3K27ac across human chromosomes 11 and
12. Metaphase chromosomes 11 and 12 from human lymphoblastoid cells immunostained with antibodies to H3K4me3 or H3K27ac, as
indicated, are aligned with histograms showing the distribution of SINE repeat sequences across the same chromosome. The examples of
immunostained chromosomes shown were selected, for clear and representative banding, from the chromosomes aligned in Additional files 3
and 4. Repeat masker-defined SINE repeats were taken from USCS (hg18) human genome build [13] and allocated to 10-Mb windows spanning
each chromosome.
Terrenoire et al. Genome Biology 2010, 11:R110
/>Page 9 of 14
genomes of higher eukaryotes show extreme regional var-
iation, giving distinctive and reproducible immunofluores-
cent banding patterns [38,39]. Islands of acetylated histone
H4 occurred within transcriptionally active and silent
regions and within condensed (phase dense) and more
open (phase light) chromatin, and were therefore not
solely dependent on either transcription or chromatin
compaction [39]. In the absence of polytene chromo-
somes, it is only comparatively recently that the same
principle has been sho wn to ap ply to th e inter phase gen-
omes of mammals. By combining ChIP with a cloning
strategy based o n the serial analysis of gene expression
(SAGE) technique, Roh et al. [40] identified over 46,000
regions enriched in H3 acetylated at lysine 9 and/or 14 in
human T-cells. These regions, designated ‘ acetylation
islands’, were often associated with promoters, putative
control elements and CGIs. At least some of the acetylated
islands were dynamic features; activation of T cells with
accompanying gene activation and chromatin remodeling
resulted in the appearance of over 4,000 new islands and
the disappearance of some pre-existing ones [40]. There
was a close correlation between the frequency of acety-
lated islands and gene density [40] and in a chromosome-
by-chromosome presentation of the data (supplementary
Figure 3 in [40]), regions of high acetylation (for example,
on chromosomes 1q, 6p, 11q and 19) correspond to the
brightly staining H3K9ac and H3K27ac metaphase bands
presented here.
H3K27me3 also shows evidence of regional variation
across the genome. An analysis of H3K27me3 across
mous e chromosome 17 by ChIP-chip and application of
a n ew algorithm for detecting broad regions of histone
modification [41] showed that the modification tends to
occur in l arge regions, designated BLOCs, of average
size 43 kb. There are examples of H3K27me3 spreading
across large domains in humans, where consistently
high levels of H3K27me3 cover the 100- to 200-kb
regions encompassing the human HOX gene clusters. At
a higher level, H3K27me3 BLOCs were found to be
more frequent in gene-rich, SINE -rich regions, along
with high levels of H3 and H4 acetylation. The authors
propose that these regions alte rnate across the chromo-
some with gene-poor, SINE-poor, long interspersed
nuclear element (LINE)-rich regions with relatively high
levels of H3K 9me3 and H4K20me3, two histone modifi-
cations associated with constitutive heterochromatin
[42,43]. As discussed by the authors, this model is not
supported by mouse ChIP-seq data [3] analyzed in the
same way, or with ENC ODE data from human cell lines
that showed no evidence for c onsistent co-localization
of H3K27me3 and active histone modifications such as
acetylated H3 and H4 and H3K4me3 [44]. The data pre-
sented here show that in human metaphase chromo-
somes, H3K27me3 is preferentially located across
defined regions of 10 Mb and above. These regions are
not gene-rich, nor does H3K27me3 consistently co-loca-
lize with acetylated histones or H3K4me3. However,
there is overlap between H3K27me3-rich and
H3K4me3/H3K9ac/H3K27ac-rich regions (examples can
be seen in Figure 5), showing that, at the highest level,
the two chromatin types are not mutually exclusive. As
yet we have not been able to align the H3K27me3 band-
ing pattern with any genomic features. H3K27me3
bands do not correspond to the frequency of LINE
repeatsplottedas10-Mbwindows(resultsnotshown),
or to SINE and ALU repeats, which closely correlate, as
expected, with gene/CGI density (Additional file 10).
Functional significance of metaphase chromosome bands
The bands we de scribe are large, approximately 10 to
50 Mb, and presumably encompass many (perhaps sev-
eral hundred) smaller chrom atin domains, some asso-
ciated with specific genes and gene clusters and their
control elements. A crucial question is whether the
bands have any functional significance in their own
right, or whether they passively reflect the net level of
histone modification among the subdomains that they
contain. In assessing this, it is relevant that genes and
their control elements make up only a small propor-
tion of the chromatin within a b and, with even the
most gene-rich band having only approximately
30 genes/Mb. The histone modifications studied here
are relatively common and therefore must be mostly
located in intergenic chromatin. The difference in
gene/CGI density between the most gene-rich and
gene-poor domains at 10-Mb resolution is only about
6-fold and differences in repeat density are even less.
It is questionable whether differences of this order are
sufficient to account for the differences in staining
intensity between bands and interbands, with the latter
often essentially unstained (that is, comparable to cen-
tric heterochromatin). It is also interesting that the
banding patterns given by three very different modifi-
cations (H3K4me3, H3K9ac and H3K27ac) are so simi-
lar. It may be that the banding giv en by H4K8ac, and
other acetylated H4 isoforms, for which the difference
in staining intensity between bands and interbands is
less extreme, may be a closer reflection of gene/CGI
density. It should also be borne in mind that, for some
modifications at least, high-level chromosome banding
may not be directly determined by DNA sequence ele-
ments but by other aspects of chromosome behavior.
For example, if interphase chromosome territories are
configured so that some regions are accessible to, or
share a nuclear location with, subsets of histone modi-
fying enzymes, then one would expect to see large
chromosome domains displaying high levels of selected
histone modifications, just as we observe.
Terrenoire et al. Genome Biology 2010, 11:R110
/>Page 10 of 14
Our results show that for active modifications
(H3K4me3, H3K9a c and H3K27ac) immunofluoresc ent
bands on metaphase chromosomes correspond to
enriched regions in the interphase epigenome revealed by
ChIP-based approaches [18,40]. The localized persistence
of active modifications through mitosis may play a role in
determining gene function in the following G1 phase,
thereby contributing to the heritability of epigenetic states
[45]. This could be done by maintaining a general chroma-
tin property, such as the open chromatin structure found
across gene-rich regions of the chromosome [46]. A close
analysis of the human transcriptome map (HTM) by Ver-
steeg and colleagues [29] showed that many highly
expressed genes are clustered in about 40 gene-rich
regions of 10 to 15 Mb in size, designated ridges. Weakly
expressed genes tend to cluster in similarly sized, gene
poor regions designated antiridges. A quantitative analysis
of the properties of ridges and antiridges on chromosomes
1, 6 a nd 11 in six different human cell lines, all in G1
phase, showed that ridges were consistently less con-
densed, less spherical and further from the nuclear periph-
ery than antiridges. These properties were not changed by
the major differences between cell types in karyotype and
gene expression pattern [28 ]. Ridges often correspond i n
both position and extent to the metaphase chromo some
bands rich in active histone modifications described here
(the band at 60 to 70 Mb on chromosome 11p is a g ood
example) [28,29]. It may be that the distribution of histone
modifications at metaphase repre sents part of a mechan-
ism by which the structural properties of gene-rich regions
and subregions are maintained through mitosis. Large
chromatin regions carrying specific combinations of modi-
fied histones could also help establish chromosome terri-
tories in the reforming G1 nucleus, perhaps to ensure
optimum positioning of gene-rich chromatin [47].
The H3K27me3-rich bands on metaphase chromo-
somes appear to have no equivalents in interphase, indi-
cating that they are generated by regional adjustment of
this modification as cells progress through mitosis. In
this context, it is interesting that the intensi ty o f
H3K27me3 staining, particu larly of the smaller chromo-
somes such as 19 and 20, is more variable between cells
than is that of the ot her modifications studied here
(Additional file 6). Perhaps this is attributable to
ongoing demethylation of H3K27 in metaphase cells,
with the paler-staining chromosomes being derived
from cells that had been blocked in metaphase
for longer (up to 4 hours). As noted earlier, close com-
parison of interphase and metaphase distrib utions of
active modifications suggests that here too there are tar-
geted changes in modification levels, with a selective
reduction in interband regions serving to enhance the
banding pattern in metaphase. Taken together, these
findingssuggestthatthereis widespread remodeling of
the epigenome during mitosis. The enzymatic mechan-
isms responsible for such remodeling can be investi-
gated by selective disruption of candidate enzymes and
it will be of particular interest to explore how these
mechanisms might be subverted in disease states.
Conclusions
There is a characteristic distribution of histone modifi-
cations across the metaphase genome, giving each chro-
mosome a d istinctive immunofl uorescent banding
pattern. Bands o f the active modifications H3K4me3,
H3K9ac and H3K27ac are virtually indistinguishable,
but differ from bands of H3K27me3. Bands are consis-
tent between cell lines of the same type and, for
H3K4me3 at least, between two different cell lineages.
There is a close correlation between bands of active
modifications and gene/CGI density, SINE density and
transcript levels in interphase, though none of these
parameters alone provides a complete explanation for
the location and relative staining intensities of the differ-
ent bands. The functional, or DNA sequence properties
that correlate with the H3K27me3 bands remain myster-
ious. For H3K4me3, H3K9a c and H 3K27ac, the meta-
phase banding resembles their distribution at interphase,
whereas for H3K27me3 metaphase and interphase distri-
butions are different. The results provide evidence of
extensive remodeling of the epigenome as cells enter
mitosis, even for modifications where the resemblance
between interphase and metaphase distributions is clear.
Materials and methods
Cell lines
Immortalized, Epstein Barr virus-transformed LCLs
from healthy, karyotypically normal individuals were
established in-house and maintained at 37°C, 5% CO
2
in
RPMI 1640 medium, 10% fetal bovine serum, supple-
mented with L-glutamine (2 mM) and penicillin/strepto-
mycin (all additives from Gibco (Gibco, Grand Island,
NY, USA)). These lines retain a normal diploid karyo-
type over many years in culture and provide a consistent
source of experimental material. All results presented
here are from two individuals, one male (line AH) and
one female (line VM).
Antisera
Rabbit polyclonal antisera used for immunolabeling are
listed in Additional file 8. In-house antisera were pre-
pared b y immunization with synthetic peptides as pre-
viously described [35,48]. The specificity of all antisera
was confirmed by inhibition ELISA using native histones
immobilized on mi crotiter plates and a selection of syn-
thetic peptides, as described previously [48].
Terrenoire et al. Genome Biology 2010, 11:R110
/>Page 11 of 14
Preparation of chromosome spreads and immunostaining
Cells in exponential growth were treated for 2 hours with
colcemid (KaryoMax, Gibco) at 0.1 μg/ml. Cells were pel-
leted by centrifugation at 1,200 rpm (Chillspin, MSE,
London, UK) for 5 minutes at 4°C, washed twice with
cold phosphate buffered saline, resuspended in 75 mM
KCl at 2 × 10
5
cells/ml and left at room temperature for
10 minutes. Aliquots (200 μl) of the swollen cell suspen-
sion were spun onto glass slides at 1,800 rpm for 10 min-
utes in a Shandon Cytospin 4. Slides were then immersed
for 10 minutes at room temperature in KCM buff er (120
mM KCl, 20 mM NaCl, 10 mM Tris/HCl pH 8.0, 0.5
mM EDTA, 0.1% Triton X-100). Immunolabeling was
carried out for 1 hour at 4°C, as described previously [9],
with antisera diluted 200- to 400-fold in KCM supple-
mented with 1 to 1.5% BSA (Sigma-Aldrich, Dorset, UK).
For all labelings, the secondary antibody was fluorescein
isothio cyanate (FITC)-conjugate d goa t anti-rabbit immu-
noglobulin (Sigma F1262) diluted 150-fold in KCM, 1%
BSA. S lides were wash ed twice in KCM (5 minutes at
room temperature), fixed in 4% (v/v) formaldehyde (10
minutes, room temperature), r insed in deionized water
and mounted in Vector Shield (Vector Lab, Peterbor-
ough, UK) supplemented with DAPI (Sigma) at 2 μg/ml.
Chromosome identification and karyotyping
Labeled slides were visual ized on a Zeiss Axioplan 2 epi-
fluorescence microscope and potentially suitable meta-
phases spreads captured using Smart Capture software
(Digital Scientific, Cambridge, UK). The filmstrip obtained
was screened for the best spreads and poor quality spreads
discarded. The coordinates of each spread were recorded
using an England Finder(tm) graticule. Each identified
spread was recaptured at t he West Midlands Regional
Genetics Laboratory on a Zeiss microscope and images
stored in the ISIS software (Meta systems, Altlussheim,
Germany). Karyotyping was based on reverse DAPI stain-
ing, which gives a conventional G-banding pattern, using
the standard chromosome identification criteria used for
clinical diagnostic work. A printout of each karyotype was
produced and each chromosome located in the spread and
numbered. Immunofluorescent karyotypes were then
reconstituted in Smart Type software (Digital Scientific) to
reveal the distribut ion of histone modifications across
identified chromosomes.
Chromosome scanning and data analysis
Twelve representative examples of chromosome 1 (that
is, 24 chromatid arms) were scanned for fluorescence
intensity using the GraphPolygon Extension of IPLab in
SmartCapture. The centromere of each chromosome
was manually marked by adding a line of blue pixels,
and each chromatid arm was manually tracked from
pter, to centromere, to qter. GraphPolygon data
comprised color intensities averaged over the pixels on
each segment perpendicular to the manually tracked
medial axis of the chromatid (for a line of specified
width, which is slightly less than the chromatid arm).
Numerical pixel values were obtained for green (FITC),
red (DAPI) and blue (manually annotated centromere).
The relative longitudinal position of each segment of
each chromatid was then normalized to the actual
length of chromosome 1 (247 Mb). The segment data
from each chromatid were first anchored at the centro-
mere (120 Mb), whose po sition was determined by t he
maximal level of pixel staining in the blue channel.
Colo r intensity of FITC and D API staining was normal-
ized for each chromatid arm as a percentage of the
maximum staining for the relevant color. The normal-
ized longitudinal segment positions were then grouped
into 25 10-Mb windows and the mean and s tandard
deviation of FITC intensity and DAPI intensity were cal-
culated for each window.
ChIP-seq data from the Bernstein laboratory at the
Broad Institute of MIT and Harvard were downloaded
from the ENCODE data coordination center at UCSC
[13].SignaldataforthelymphoblastoidlineGM12878
was averaged for each 10-Mb window for comparison
with our data. The CGI distributions presented in this
paper are all calculated from the data re cently generated
and compiled by Illingworth et al. [49] using CXXC affi-
nity purification and deep sequencing.
Microarray expression analysis
RNA was extracted and purified from log-phase lym-
phoblastoid cells using the RNeasy kit with DNase
digestion (Qiagen, Crawley, West Sussex, UK), accord-
ing to the manufacturer’ s instructions. cDNA was
synthesized using the Superscript double- stranded DNA
synthesis kit (Invitrogen, Paisley, UK), cleaned up by
RNase A treatment (Invitrogen; 4 μgper150μl reac-
tion) followed by phenol:chloroform extraction and
ethanol precipitation. Samples were labeled with cy3,
hybridized to a 12 × 135 k HD2 expression array
(Roche Nimblegen, Madison, Wisconsin, USA); contain-
ing 3 probes per gene for 44,049 human genes) and
scanned (GenePix 4000B, Molecular Devices, Sunnyvale,
CA, USA). Data were extracted, normalized by quantile
normalization and gene calls generated by the robust
multichip average algorithm using Nimblescan (Roche
Nimblegen). Normalized expression data from three
biological replicates is available at the Gene Expression
Omnibus [50], accession number [GEO:GSE24459]; the
data cover the entire human genome and are limited to
RefSeq gene sequences. For comparison with H3K4me
3 levels and gene/CGI density, transcription from
RefSeq genes was summed within 10-Mb windows
across chromosome 1.
Terrenoire et al. Genome Biology 2010, 11:R110
/>Page 12 of 14
Additional material
Additional file 1: Figure showing relative lengths of human
chromosomes with and without fixation in methanol acetic acid.
Additional file2: Figure showing centromeric indices of human
chromosomes with and without fixation in methanol acetic acid.
Additional file 3: Figure showing alignment of individ ual
metaphase chromosomes immunostained for H3K4me3 from five
different chromosome spreads.
Additional file 4: Figure showing alignment of individ ual
metaphase chromosomes immunostained for H3K27ac from six
different chromosome spreads.
Additional file 5: Figure showing alignment of individ ual
metaphase chromosomes immunostained for H3K9ac from two
different chromosome spreads.
Additional file 6: Figure showing alignment of individ ual
metaphase chromosomes immunostained for H3K27me3 from six
different chromosome spreads.
Additional file 7: Figure showing the correspondence between
gene density, CpG island density and H3K27me3 levels across
human metaphase chromosomes.
Additional file 8: Table showing antibodies used for labeling and
their origins.
Additional file 9: Immunostained karyotype showing the
distribution of H3K4me3 across human fibroblast chromosomes.
Additional file 10: Table showing correlations between H3K4me3
levels across metaphase chromosome 1, gene-, CGI- and repeat-
frequencies and various properties of the interphase epigenome.
Abbreviations
BSA: bovine serum albumin; CGI: CpG island; ChIP: chromatin
immunoprecipitation; DAPI: 4,6-diamino-2-phenyl-indole; ELISA: enzyme-
linked immunosorbant assay; FITC: fluorescein isothiocyanate; LCL:
lymphoblastoid cell line; LINE: long interspersed nuclear element; SINE: short
interspersed nuclear element.
Acknowledgements
We thank Rebecca Sie and Milan Fernando for skilful technical assistance,
Thomas Jenuwein for generously supplying antisera, Rogier Versteeg for
sharing data with us early in the project, Steve Kissane for advice on
microarray hybridization protocols and Adrian Bird and Karl Nightingale for
valuable comments on the manuscript. This work was supported by Cancer
Research UK (programme grant C1015) and by the European Union via FP6
and the Epigenome Network of Excellence.
Author details
1
Chromatin and Gene Expression Group, Institute of Biomedical Research,
College of Medical and Dental Sciences, University of Birmingham,
Edgbaston, Birmingham B15 2TT, UK.
2
West Midlands Regional Genetics
Laboratory, Birmingham Women’s NHS Foundation Trust, Metchley Park
Road, Edgbaston, Birmingham B15 2TG, UK.
3
Current address: School of
Biosciences, University of Birmingham, Edgbaston, Birmingham B15 2TT, UK.
4
The Wellcome Trust Centre for Cell Biology, University of Edinburgh, The
King’s Buildings, Edinburgh EH9 3JR, UK.
5
Current address: MRC Human
Genetics Unit, Crewe Road, Edinburgh EH4 2XU, UK.
6
School of Cancer
Sciences, College of Medical and Dental Sciences, University of Birmingham,
Edgbaston, Birmingham B15 2TT, UK.
Authors’ contributions
ET, FM, JAH and BMT conceived and designed experiments; ET, FM, JAH and
PP performed experiments; ET, FM, JAH, PP, LPO and BMT analyzed data; RSI,
AMRT, VD and LPO contributed reagents, materials and analytical/technical
expertise; ET, FM, JAH and BMT wrote the paper. All authors read and
approved the final manuscript.
Competing interests
The authors declare that they have no competing interests.
Received: 27 August 2010 Revised: 4 October 2010
Accepted: 15 November 2010 Published: 15 November 2010
References
1. Fan S, Zhang X: CpG island methylation pattern in different human
tissues and its correlation with gene expression. Biochem Biophys Res
Commun 2009, 383:421-425.
2. Meissner A, Mikkelsen TS, Gu H, Wernig M, Hanna J, Sivachenko A, Zhang X,
Bernstein BE, Nusbaum C, Jaffe DB, Gnirke A, Jaenisch R, Lander ES:
Genome-scale DNA methylation maps of pluripotent and differentiated
cells. Nature 2008, 454:766-770.
3. Mikkelsen TS, Ku M, Jaffe DB, Issac B, Lieberman E, Giannoukos G, Alvarez P,
Brockman W, Kim TK, Koche RP, Lee W, Mendenhall E, O’Donovan A,
Presser A, Russ C, Xie X, Meissner A, Wernig M, Jaenisch R, Nusbaum C,
Lander ES, Bernstein BE: Genome-wide maps of chromatin state in
pluripotent and lineage-committed cells. Nature 2007, 448:553-560.
4. Schones DE, Zhao K: Genome-wide approaches to studying chromatin
modifications. Nat Rev Genet 2008, 9:179-191.
5. Peters AH, Kubicek S, Mechtler K, O’Sullivan RJ, Derijck AA, Perez-Burgos L,
Kohlmaier A, Opravil S, Tachibana M, Shinkai Y, Martens JH, Jenuwein T:
Partitioning and plasticity of repressive histone methylation states in
mammalian chromatin. Mol Cell 2003, 12:1577-1589.
6. Kourmouli N, Jeppesen P, Mahadevhaiah S, Burgoyne P, Wu R, Gilbert DM,
Bongiorni S, Prantera G, Fanti L, Pimpinelli S, Shi W, Fundele R, Singh PB:
Heterochromatin and tri-methylated lysine 20 of histone H4 in animals.
J Cell Sci 2004, 117:2491-2501.
7. Jin W, Lamb JC, Zhang W, Kolano B, Birchler JA, Jiang J: Histone
modifications associated with both A and B chromosomes of maize.
Chromosome Res 2008, 16:1203-1214.
8. Jeppesen P, Turner BM: The inactive X chromosome in female mammals
is distinguished by a lack of histone H4 acetylation, a cytogenetic
marker for gene expression. Cell 1993, 74:281-289.
9. Keohane AM, O’Neill LP, Belyaev ND, Lavender JS, Turner BM: X-Inactivation
and histone H4 acetylation in embryonic stem cells. Dev Biol 1996,
180:618-630.
10. Shi J, Dawe RK: Partitioning of the maize epigenome by the number of
methyl groups on histone H3 lysines 9 and 27. Genetics 2006,
173:1571-1583.
11. Chadwick BP, Willard HF: Multiple spatially distinct types of facultative
heterochromatin on the human inactive X chromosome. Proc Natl Acad
Sci USA 2004, 101:17450-17455.
12. Jeppesen P: Histone acetylation: a possible mechanism for the
inheritance of cell memory at mitosis. Bioessays 1997, 19:67-74.
13. ENCODE Project at UCSC. [ />14. Comings DE, Avelino E: Mechanisms of chromosome banding. II.
Evidence that histones are not involved. Exp Cell Res 1974, 86:202-206.
15. Stenman S, Rosenqvist M, Ringertz NR: Preparation and spread of unfixed
metaphase chromosomes for immunofluorescence staining of nuclear
antigens. Exp Cell Res 1975, 90:87-94.
16. Jeppesen P, Mitchell A, Turner B, Perry P: Antibodies to defined histone
epitopes reveal variations in chromatin conformation and
underacetylation of centric heterochromatin in human metaphase
chromosomes. Chromosoma 1992, 101:322-332.
17. Craig JM, Bickmore WA: Chromosome bands - flavours to savour.
Bioessays 1993, 15:349-354.
18. Bernstein BE, Meissner A, Lander ES: The mammalian epigenome. Cell
2007, 128:669-681.
19. Ingvarsdottir K, Edwards C, Lee MG, Lee JS, Schultz DC, Shilatifard A,
Shiekhattar R, Berger SL: Histone H3 K4 demethylation during activation
and attenuation of GAL1 transcription in Saccharomyces cerevisiae. Mol
Cell Biol 2007, 27:7856-7864.
20. Regha K, Sloane MA, Huang R, Pauler FM, Warczok KE, Melikant B, Radolf M,
Martens JH, Schotta G, Jenuwein T, Barlow DP: Active and repressive
chromatin are interspersed without spreading in an imprinted gene
cluster in the mammalian genome. Mol Cell 2007, 27:353-366.
21. Wei G, Wei L, Zhu J, Zang C, Hu-Li J, Yao Z, Cui K, Kanno Y, Roh TY,
Watford WT, Schones DE, Peng W, Sun HW, Paul WE, O’Shea JJ, Zhao K:
Global mapping of H3K4me3 and H3K27me3 reveals specificity and
Terrenoire et al. Genome Biology 2010, 11:R110
/>Page 13 of 14
plasticity in lineage fate determination of differentiating CD4+ T cells.
Immunity 2009, 30:155-167.
22. Tie F, Banerjee R, Stratton CA, Prasad-Sinha J, Stepanik V, Zlobin A, Diaz MO,
Scacheri PC, Harte PJ: CBP-mediated acetylation of histone H3 lysine 27
antagonizes Drosophila Polycomb silencing. Development 2009,
136:3131-3141.
23. Wang Z, Zang C, Rosenfeld JA, Schones DE, Barski A, Cuddapah S, Cui K,
Roh TY, Peng W, Zhang MQ, Zhao K: Combinatorial patterns of histone
acetylations and methylations in the human genome. Nat Genet 2008,
40:897-903.
24. Margueron R, Li G, Sarma K, Blais A, Zavadil J, Woodcock CL, Dynlacht BD,
Reinberg D: Ezh1 and Ezh2 maintain repressive chromatin through
different mechanisms. Mol Cell 2008, 32:503-518.
25. Shen X, Liu Y, Hsu YJ, Fujiwara Y, Kim J, Mao X, Yuan GC, Orkin SH: EZH1
mediates methylation on histone H3 lysine 27 and complements EZH2
in maintaining stem cell identity and executing pluripotency. Mol Cell
2008, 32:491-502.
26. Hansen KH, Bracken AP, Pasini D, Dietrich N, Gehani SS, Monrad A,
Rappsilber J, Lerdrup M, Helin K: A model for transmission of the
H3K27me3 epigenetic mark. Nat Cell Biol 2008, 10:1291-1300.
27. Shen Y, Matsuno Y, Fouse SD, Rao N, Root S, Xu R, Pellegrini M, Riggs AD,
Fan G: X-inactivation in female human embryonic stem cells is in a
nonrandom pattern and prone to epigenetic alterations. Proc Natl Acad
Sci USA 2008, 105:4709-4714.
28. Goetze S, Mateos-Langerak J, Gierman HJ, de Leeuw W, Giromus O,
Indemans MH, Koster J, Ondrej V, Versteeg R, van Driel R: The three-
dimensional structure of human interphase chromosomes is related to
the transcriptome map. Mol Cell Biol 2007, 27:4475-4487.
29. Versteeg R, van Schaik BD, van Batenburg MF, Roos M, Monajemi R,
Caron H, Bussemaker HJ, van Kampen AH: The human transcriptome map
reveals extremes in gene density, intron length, GC content, and repeat
pattern for domains of highly and weakly expressed genes. Genome Res
2003, 13:1998-2004.
30. Gilbert N, Gilchrist S, Bickmore WA: Chromatin organization in the
mammalian nucleus. Int Rev Cytol 2005, 242:283-336.
31. Bird AP: CpG-rich islands and the function of DNA methylation. Nature
1986, 321:209-213.
32. Illingworth RS, Bird AP: CpG islands - ‘a rough guide’. FEBS Lett 2009,
583:1713-1720.
33. ENCODE Project Consortium, Birney E, Stamatoyannopoulos JA, Dutta A,
Guigó R, Gingeras TR, Margulies EH, Weng Z, Snyder M, Dermitzakis ET,
Thurman RE, Kuehn MS, Taylor CM, Neph S, Koch CM, Asthana S,
Malhotra A, Adzhubei I, Greenbaum JA, Andrews RM, Flicek P, Boyle PJ,
Cao H, Carter NP, Clelland GK, Davis S, Day N, Dhami P, Dillon SC,
Dorschner MO, et al:
Identification and analysis of functional elements in
1% of the human genome by the ENCODE pilot project. Nature 2007,
447:799-816.
34. Patzlaff JS, Terrenoire E, Turner BM, Earnshaw WC, Paulson JR: Acetylation
of core histones in response to HDAC inhibitors is diminished in mitotic
HeLa cells. Exp Cell Res 2010, 316:2123-2135.
35. Turner BM, Fellows G: Specific antibodies reveal ordered and cell-cycle-
related use of histone-H4 acetylation sites in mammalian cells. Eur J
Biochem 1989, 179:131-139.
36. Weber M, Hellmann I, Stadler MB, Ramos L, Paabo S, Rebhan M,
Schubeler D: Distribution, silencing potential and evolutionary impact of
promoter DNA methylation in the human genome. Nat Genet 2007,
39:457-466.
37. Ooi SK, Qiu C, Bernstein E, Li K, Jia D, Yang Z, Erdjument-Bromage H,
Tempst P, Lin SP, Allis CD, Cheng X, Bestor TH: DNMT3L connects
unmethylated lysine 4 of histone H3 to de novo methylation of DNA.
Nature 2007, 448:714-717.
38. Turner BM, Birley AJ, Lavender J: Histone H4 isoforms acetylated at
specific lysine residues define individual chromosomes and chromatin
domains in Drosophila polytene nuclei. Cell 1992, 69:375-384.
39. Turner BM, Franchi L, Wallace H: Islands of acetylated histone H4 in
polytene chromosomes and their relationship to chromatin packaging
and transcriptional activity. J Cell Sci 1990, 96:335-346.
40. Roh TY, Cuddapah S, Zhao K: Active chromatin domains are defined by
acetylation islands revealed by genome-wide mapping. Genes Dev 2005,
19:542-552.
41. Pauler FM, Sloane MA, Huang R, Regha K, Koerner MV, Tamir I, Sommer A,
Aszodi A, Jenuwein T, Barlow DP: H3K27me3 forms BLOCs over silent
genes and intergenic regions and specifies a histone banding pattern
on a mouse autosomal chromosome. Genome Res 2009, 19:221-233.
42. Schotta G, Lachner M, Sarma K, Ebert A, Sengupta R, Reuter G, Reinberg D,
Jenuwein T: A silencing pathway to induce H3-K9 and H4-K20
trimethylation at constitutive heterochromatin. Genes Dev 2004,
18:1251-1262.
43. Martens JH, O’Sullivan RJ, Braunschweig U, Opravil S, Radolf M, Steinlein P,
Jenuwein T: The profile of repeat-associated histone lysine methylation
states in the mouse epigenome. EMBO J 2005, 24:800-812.
44. Thurman RE, Day N, Noble WS, Stamatoyannopoulos JA: Identification of
higher-order functional domains in the human ENCODE regions. Genome
Res 2007, 17:917-927.
45. Probst AV, Dunleavy E, Almouzni G: Epigenetic inheritance during the cell
cycle. Nat Rev Mol Cell Biol 2009, 10:192-206.
46. Gilbert N, Boyle S, Fiegler H, Woodfine K, Carter NP, Bickmore WA:
Chromatin architecture of the human genome: gene-rich domains are
enriched in open chromatin fibers. Cell 2004, 118:555-566.
47. Bolzer A, Kreth G, Solovei I, Koehler D, Saracoglu K, Fauth C, Müller S, Eils R,
Cremer C, Speicher MR, Cremer T: Three-dimensional maps of all
chromosomes in human male fibroblast nuclei and prometaphase
rosettes. PLoS Biol 2005, 3:e157.
48. White DA, Belyaev ND, Turner BM: Preparation of site-specific antibodies
to acetylated histones. Methods 1999, 19:417-424.
49. Illingworth RS, Gruenewald-Schneider U, Webb S, Kerr ARW, James KD,
Turner DJ, Smith C, Harrison DJ, Andrews R, Bird AP: Orphan CpG islands
identify numerous conserved promoters in the mammalian genome.
PLoS Genet 2010, 6:e1001134.
50. Gene Expression Omnibus (GEO) genomics data repository [http://www.
ncbi.nlm.nih.gov/geo/].
51. O’Neill LP, Spotswood HT, Fernando M, Turner BM: Differential loss of
histone H3 isoforms mono-, di- and tri-methylated at lysine 4 during X-
inactivation in female embryonic stem cells. Biol Chem 2008, 389:365-370.
52. Perez-Burgos L, Peters AH, Opravil S, Kauer M, Mechtler K, Jenuwein T:
Generation and characterization of methyl-lysine histone antibodies.
Methods Enzymol 2004, 376:234-254.
doi:10.1186/gb-2010-11-11-r110
Cite this article as: Terrenoire et al.: Immunostaining of modified
histones defines high-level features of the human metaphase
epigenome. Genome Biology 2010 11:R110.
Submit your next manuscript to BioMed Central
and take full advantage of:
• Convenient online submission
• Thorough peer review
• No space constraints or color figure charges
• Immediate publication on acceptance
• Inclusion in PubMed, CAS, Scopus and Google Scholar
• Research which is freely available for redistribution
Submit your manuscript at
www.biomedcentral.com/submit
Terrenoire et al. Genome Biology 2010, 11:R110
/>Page 14 of 14