Báo cáo y học: "Genetic diversity in India and the inference of Eurasian population expansion" doc
Bạn đang xem bản rút gọn của tài liệu. Xem và tải ngay bản đầy đủ của tài liệu tại đây (801.05 KB, 13 trang )
RESEARC H Open Access
Genetic diversity in India and the inference of
Eurasian population expansion
Jinchuan Xing
1
, W Scott Watkins
1
,YaHu
2
, Chad D Huff
1
, Aniko Sabo
2
, Donna M Muzny
2
, Michael J Bamshad
3
,
Richard A Gibbs
2
, Lynn B Jorde
1*
, Fuli Yu
2*
Abstract
Background: Genetic studies of populations from the Indian subcontinent are of great interest because of India’s
large population size, complex demographic history, and unique social structure. Despite recen t large-scale efforts
in discovering human genetic variation, India’s vast reservoir of genetic diversity remains largely unexplored.
Results: To analyze an unbiased sample of genetic diversity in India and to investigate human migration history in
Eurasia, we resequenced one 100-kb ENCODE region in 92 samples collected from three castes and one tribal
group from the state of Andhra Pradesh in south India. Analyses of the four Indian populations, along with eight
HapMap populations (692 samples), showed that 30% of all SNPs in the south Indian populations are not seen in
HapMap populations. Several Indian populations, such as the Yadava, Mala/Madiga, and Irula, have nucleotide
diversity levels as high as those of HapMap African populations. Using unbiased allele-frequency spectra, we
investigated the expansion of human populations into Eurasia. The divergence time estimates among the major
population groups suggest that Eurasian populations in this study diverged from Africans during the same time
frame (approximately 90 to 110 thousand years ag o). The divergence among different Eurasian populations
occurred more than 40,000 years after their divergence with Africans.
Conclusions: Our results show that Indian populations harbor large amounts of genetic variation that have not
been surveyed adequately by public SNP discovery efforts. Our data also support a delayed expansion hypothesis
in which an ancestral Eurasian founding population remained isolated long after the out-of-Africa diaspora, before
expanding throughout Eurasia.
Background
The Indian subcontinent is currently populated by more
than one billion people who belong to thousands of lin-
guistic and ethnic groups [1,2]. Genetic and anthropolo-
gical studies have shown that the peopling of the
subcontinent is characterized by a complex history, with
contributions from different ancestral populations [2-5].
Studies of ma ternal lineages by mitochondrial resequen-
cing have shown that the two major mitochondrial
lineages that emerged from Africa (haplogroups M and
N, dating to approximately 60 thousand years ago (kya))
are both very diverse among Indian populations [6,7].
Additional studies of mitochondrial haplogroups show
that an early migration may have populated the Indian
subcontinent, leaving ‘relic’ populations in present-day
India represented by some Austroasiatic-and Dravidian-
speaking t ribal populations [7-10]. These results high-
light that the init ial peopling of the Indian subcontinent
likely occurred early in the history of anatomically mod-
ern humans. Concordant with the mitochondrial DNA
(mtDNA) data, paternal lineages within I ndia also show
high diversity based on short tandem repeat (STR) mar-
kers on the Y chromosome and support an early and
continuous presence of populations on the subcontinent
[11]. Recent studies of autosomal SNPs and STRs also
demonstrate a high degree of genetic differe ntiation
among Indian ethnic and linguistic groups [12-14].
The high diversity and the deep mitochondrial
lineages in India support the hypothesis that Eurasia
was initially populated bytwomajorout-of-Africa
* Correspondence: ;
1
Department of Human Genetics, Eccles Institute of Human Genetics,
University of Utah, 15 North 2030 East, Salt Lake City, UT 84112, USA
2
Human Genome Sequencing Center, Department of Molecular and Human
Genetics, Baylor College of Medicine, One Baylor Plaza, Houston,
TX 77030, USA
Full list of author information is available at the end of the article
Xing et al. Genome Biology 2010, 11:R113
/>© 2010 Xing et al.; licensee BioMed Central Ltd. This is an open access article distributed under the terms of the Creative Commons
Attribution License (http://creativecommons .org/licenses/by/2.0), which permits unrestr icted use, distribution, an d reproduction in
any medium, provided the original work is properly cited.
migration routes [3,15-17]. Populati ons migrati ng along
an early ‘ southern-route’ originated from the Horn of
Africa, crossed the mouth of the Red Sea into the
Arabian Peninsula, and subsequently migrated into
India, Southeast Asia, and Australia. Later, populations
migrated out of Africa along a ‘northern route’ from
northern Africa into the Middle East and subsequently
populated E urasia. A recent study suggests that a popu-
lation ancestral to all Eurasians has limited admixture
with Neanderthals after the out-of-Africa migration
event but prior to either of the two major Eurasian
migrations [18]. This scenario, which we termed the
‘ delayed expansion’ hypothesis [19], predicts that the
ancestral Eurasian population separated from African
populations long b efore the expansion int o Eurasia.
However, the long-term existence of such an ancestral
Eurasian population has never been documented. This
hypothesis can be tested by using DNA sequence data
to examine the demographic history of African popula-
tions and a diverse array of Eurasian po pulations,
including previously under-represented samples f rom
South Asia.
Recently, insights into population structure were
gained from analyses of data from high-density SNP
arrays [13,19-26]. Although high-density SNP genotypes
are useful for assessing population structure, qua ntita-
tive analyses of demographic history depend critically on
the patterns of variation represented not just by com-
mon SNPs (minor allele frequency ≥0.05) contained in
genotyping SNP panels, but also by rare variants (minor
allele frequency <0.05) that have not been thoroughly
characterized to date [27]. Furthermore, most SNPs pre-
sent on the high-density SNP genotyping platforms have
been ascertained in an ana lytically intractable and ad
hoc fashio n [28]. A lack of unbi ased polymorphism data
limits our ability to accurately estimate the genetic
diversity level found in the Indian subcontinent and to
correctly infer demographic parameters, such as effective
population size, migration rate, and date o f population
origin and divergence. In addition, despite the
large amount of genetic diversity suggested by Y-
chromosome, mtDNA, and autosomal microarray ana-
lyses, Indian genetic diversity remains largely unexplored
by previous large-scale human variant discovery efforts
(for example, HapMap and PopRes).
To overcome the limitations and biases associated
with SNP microarrays, we used the PCR-Sanger sequen-
cing method to resequence a 100-kb ENCODE region in
92 Indian samples from f our population groups (three
castes and one tribal population) from the south Indian
state Andhra Pradesh and combined our results with
eight HapMa p populations that are resequenced for the
same region [29]. By examining the complete distribu-
tion of rare and common variants in several populations
that are not included in HapMap/ENCODE studies, we
assess the additional information that can b e gained by
sampling more diverse populations, especially in geo-
graphic regions with little or no coverage. Furthermore,
using resequencing data from 12 populations covering
Africa, Europe, India, and East Asia, w e are able to
obtain accurate estimates of parameter s such as ances-
tral population sizes and divergence dates and to test
the ‘delayed expansion’ hypothesis of Eurasian popula-
tion history.
Results
ENCODE region selection and SNP discoveries
We sequenced one 100-kb ENCODE region-ENr123
(hg18: Chr12 38,826,477-38,926,476) in four different
Andhra Pradesh ethnic groups representing three cas tes,
Brahmin, Yadava, and Mala/Madiga, and one tribal
group Irula (Figure 1a). We chose ENr123 because it
has a low gene density and should represent a selectively
neutral region (gene density of 3.1% and non-exonic
conservation rate of 1.7%). Among the 92 individuals
that passed quality-control steps, a total of 453 SNPs
were identified, corresponding to a SNP density of one
SNP per 221 bp. To determine the accuracy of the
newly iden tified SNPs, we carried out additional experi-
ments using the Roche 454 sequencing platform to vali-
date the Indian-specific SNPs in individuals with
heterozygous genotypes (see Materials and methods for
details). The validation results showed that the geno-
types of new SNPs have a high confirmation rate
(approximately 80% for heterozygous SNPs). For alleles
that have been seen only once in the dataset, the confir-
mation rate is grea ter than 85% (Supplemental Table S1
in Additional file 1).
Togenerateacomparabledataset,weappliedthe
same SNP calling criteria on 722 HapMap individual s
who were sequenced using the same protocol in the
ENCODE3 project [29]. We then merged these two
datasets (four Indian populations and eight HapMap
populations (CEU, CHB, CHD, G IH, JPT, LWK, TSI,
and YRI)) to obtain a fin al data set that consists of
1,484 SNPs in 722 individuals from 12 populations ( see
Materials and methods for SNP merging and filtering
details).
Among the 1,484 total SNPs, 234 (15.8%) are specific
to Indian populations (four Andhra Pradesh populations
and the HapMap northern Indian GIH; Figure 1b). For
Indian indivi duals, the aver age numbe r of specific SNPs
per individual is 1.5. This number is lower than in Hap-
Map African individuals (2.4 S NPs), but higher than
both HapMap European (1.3 SNPs) and HapMap East
Asian individuals (1.1 SNPs). This result suggests that
higher autosomal genetic diversity is ha rbored in Indian
samples compar ed to other HapMap Eurasian samples.
Xing et al. Genome Biology 2010, 11:R113
/>Page 2 of 13
Among the 453 SNPs in the four newly sequenced south
Indian populations, 137 (30%) are not present in any
HapMap populations (Figure 1c), including one novel
non-synonymous singleton variant (Supplemental text in
Additional file 1).
Genetic diversity in India
Because many genetic diversity measurements are in flu-
enced by sample size, we normalized the sample size of
each group by randomly selecting a subset of HapMap
individ uals to match the sample size of the I ndians. For
convenience, we denote four groups of populations
(African, East Asian, European, and Indian) as ‘conti-
nental groups’. For continental groups, 152 unrelated
individuals were randomly selec ted from HapMap
African, European, and East Asian samples, respectively
(matching the 152 Indian individuals in the dataset). At
the population level, 24 individuals were randoml y
selected from each HapMap population, and all indivi-
duals from s outh Indian populations were included in
the analyses. After sample size normalization, we mea-
sured genetic diversity using various summary statistics,
including the number of segregating sites (S), Watter-
son’s θ estimator, nucleotide diversity (π), and observed
SNP heterozygosity (H) for each population and conti-
nental group (Table 1). We also evaluated the haplotype
diversity in each group by averaging the haplotype het-
erozygosity in ten 10-kb non-overlapping windows and
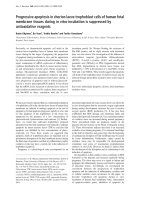
Figure 1 SNP discovery in Indian populations. (a) Population samples. The number of individuals sampled from each Indian population is
shown. (b) The number of SNPs found in HapMap non-Indian and Indian populations. (c) The number of SNPs found in south Indian, HapMap
GIH, and HapMap non-Indian populations. HapMap non-Indian populations include CEU, CHB, CHD, JPT, LWK, TSI, and YRI. South Indian
populations include Brahmin, Irula, Mala/Madiga, and Yadava.
Xing et al. Genome Biology 2010, 11:R113
/>Page 3 of 13
tested the neutrality of the region using the Tajima’s D
test. The Tajima’s D test result was consistent with neu-
trality, providing no evidence for either positive or bal-
ancing selection in t his region (Table 1), as expected
given the low gene density in this region.
At the population level, π and H indicate that some
Indian populations have diversity levels comparable to
or even higher than those of HapMap African popula-
tions. Specifically, Mala/Madiga, Yadava, and Irula have
the highest π among all populations (84.46 π 10
-5
, 88.94
π 10
-5
, and 82.77 π 10
-5
, respectively). In contrast, Brah-
mins and HapMap GIH have lower diversity levels,
comparable to HapMap European and East Asian popu-
lations (Table 1). Due to small sample sizes, the confi-
dence i ntervals of π for all populat ions overlap.
However, at the continental level, Indians have signifi-
cantly higher nucleotide diversity than Europeans and
East Asians, although θ and haplotype diversity are simi-
lar among the three groups (Table 1). Removal of
unconfirmed genotypes in Indian individuals does not
change the results (Supplemental text and Supplemental
Table S3 in Additional file 1).
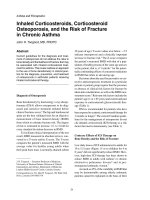
Several studies have shown that heterozygosity
decreases with increasing distance from eastern Africa,
presumably due to multiple bottlenecks that human
populations experienced during the m igration [22,30].
Among non-Indian p opulations, we observed a signifi-
cant negative correlation between H and the distan ce to
eastern Africa (Figure 2; r = -0.77, P = 0.04). However,
when the I ndian p opulations were i ncluded, the
correlation became non-significant (r = -0.33, P =0.29).
This lack of correlation is due to large variation in H
among the Indian populations (60.02 π 10
-5
in Brahmins
to 95.12 π 10
-5
in the Irula). This result demonstrates
great variation in diversity among groups within India.
Demographic history of Eurasian populations
To study the relationship among populations, we first
performed principal components analysis (PCA) on the
genetic distances between populations using the normal-
ized dataset. When all populations are included in the
analysis, the first principal component (PC1) accounts
Table 1 Genetic diversity in continental groups and populations
nInd S Sp θπ(π10
-5
) H (π10
-5
) Hap Het Tajima’sD P
Continent
India 152 533 237 84.70 (82.72-86.68) 83.68 (79.20-88.17) 77.53 0.89 -0.04 0.97
Africa 152 656 416 104.25 (101.82-106.68) 85.28 (80.71-89.86) 78.03 0.95 -0.57 0.57
Europe 152 535 205 85.02 (83.03-87.01) 74.64 (70.63-78.65) 67.95 0.88 -0.38 0.70
East Asia 152 436 186 69.29 (67.66-70.92) 73.61 (69.66-77.57) 73.10 0.90 0.19 0.85
Population
Brahmin 23 287 16 65.30 (59.72-70.88) 75.08 (64.51-85.64) 60.02 0.79 0.55 0.58
GIH 24 282 47 63.54 (58.27-68.81) 72.41 (62.45-82.38) 60.96 0.87 0.51 0.61
Irula 23 292 20 66.44 (60.76-72.12) 82.77 (71.13-94.40) 95.12 0.89 0.90 0.37
Mala/Madiga 24 342 46 77.06 (70.69-83.43) 84.46 (72.85-96.07) 89.33 0.87 0.35 0.73
Yadava 22 317 28 72.87 (66.45-79.29) 88.94 (76.15-101.73) 92.82 0.95 0.81 0.42
LWK 24 359 85 80.89 (74.21-87.57) 82.51 (71.17-93.86) 85.81 0.96 0.07 0.94
YRI 24 349 91 78.64 (72.14-85.14) 82.03 (70.75-93.31) 76.86 0.95 0.16 0.88
CEU 24 262 43 59.04 (54.13-63.94) 70.64 (60.91-80.37) 77.68 0.85 0.72 0.47
TSI 24 298 58 67.15 (61.58-72.71) 73.95 (63.78-84.13) 72.54 0.89 0.37 0.71
CHB 24 254 34 57.23 (52.47-61.99) 76.49 (65.97-87.01) 78.88 0.90 1.23 0.22
CHD 24 212 24 47.77 (43.78-51.76) 69.87 (60.24-79.49) 72.34 0.81 1.68 0.09
JPT 24 236 34 53.18 (48.75-57.61) 73.66 (63.52-83.80) 62.88 0.88 1.40 0.16
nInd, number of individuals; S, number of segregating sites; Sp, number of private segregating sites; θ, estimated theta (4N
e
u) from S; π, nucleotide diversity; H,
observed heterozygosity; Hap Het, averaged haplotype diversity over ten 10-kb windows; Tajima’s D, Tajima’s D; P, P-value for Tajima’s D test. Confidence
intervals of θ and π are shown in parentheses.
Figure 2 Population SNP heterozygosity as a function of
geographic distance from eastern Africa. The correlation
coefficient of HapMap non-Indian populations is shown.
Xing et al. Genome Biology 2010, 11:R113
/>Page 4 of 13
for 93% of the total variance and separates African and
non-African populations (Supplemental Figure S1 in
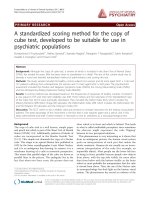
Additional file 1). In P CA of only Eurasian populations,
PC1 separates Indian populations from European and
East Asian populations, and PC2 separates European
and Asian popu lations (Figure 3). Among Indian popu-
lations, the tribal Irula and HapMap GIH have the
shortest distance to East Asian populations while Brah-
min has the largest distance. The northern Indian GIH
population diverges from south Indians and its closest
relationship is with HapMap TSI populations. This
observation i s consistent w ith the general genetic cline
in India observed in previous studies [13,31]. We also
performed PCA and ADMIXTURE analysis at the indivi-
dual level (Supplemen tal Figur e S2 in Additional file 1).
Because of the relatively small size of our dataset, indivi-
duals are no t tightly clustered as seen i n studies with
genome-wide data [19,22,23]. The African individuals
are separated from the Eurasian individuals , but Eura -
sian individuals from different populations are not sepa-
rated into distinct clusters.
Next, we examined the divergence between Indian and
non-Indian populations using pairwise F
ST
estimates. In
comparing major continental groups, India and Europe
have the smallest F
ST
value (Table 2). At the individual
population level, however, Indian populations show
varying affinities to other Eurasian populations: the
Indian tribal population (Irula) shows closer affinity to
HapMap East Asian populations while the HapMap
GIH and the Brahmin show a closer relationship to
HapMap European populations. The Mala/Madiga and
Yadava show a similar distance to the HapMap Eur-
opean and East Asian populations (Table 3). Among
Indian populations (Supplemental Table S2 in Addi-
tional file 1), the smallest F
ST
value is between Yadava
and Mala/Madiga (0.1%), and the largest F
ST
value is
between HapMap GIH and the tribal Irula (10.4%).
The complete sequence data allow us to obtain an
accurate derived-allele frequency (DAF) spectrum. At
both the continental and population levels, the DAF
spectra in our dataset are characterized by a high
Figure 3 Principal components analysis of Eurasian populat ions. The first two principal components (PCs) and the percentage of variance
explained by each PC are shown.
Table 2 Pairwise F
ST
values (%) between and among
continental groups
Africa Europe India East Asia
Africa 12.7
Europe 28.9 8.2
India 30.3 6.1 6.7
East Asia 31.5 10.9 7.8 3.3
The within continent (among populations) F
ST
values are shown on the
diagonal line.
Xing et al. Genome Biology 2010, 11:R113
/>Page 5 of 13
proportion of low-frequency SNPs, as expected for
sequencing data (Supplemental text and Supplemental
Figure S3 in Additional file 1). Based on the DAF spec-
tra, we are able to infer the parameters a ssociated with
Indian population history, such as the divergence time,
effective size, and migration rate between populations
using the program ∂a∂i (Diffusion Approximation for
Demographic Inference) [32].
Because ∂a∂i can simultaneously infer popu lation
parameters in mo dels involving three populations, we
first estimated the parameters associated with the out-
of-Africa event using the African cont inental group and
two continental Eurasian groups. We started from a
simplified three-population divergence model based on
the out-of-Africa model described in ∂a∂i [32] and
assessed the model-fitting improvement of adding differ-
ent parameters to the model (Supplemental text in
Additional file 1). Our results suggest that allowing
exponential growth in the Eurasian continental groups
substantially improves the model. On the other hand,
allowing migrations among groups provides little
improvement in the data-model fitting, suggesting that
little gene flow occurred between the continental groups
(Supplemen tal Figure S5 in Additional file 1). Therefore,
we inferred the parameters from the three-population
out-of-Africa model, allowing exponential growth in the
Eurasian groups but no migration among groups (Figure
4a). Under this model, a one-time change in African
population size occurs at time T
Af
before any population
divergence, and the population size changes from the
ancestral population size N
A
to N
Af
in Africa. At time
T
B
the Eurasian ancestral population with a population
size of N
B
diverges from the African population, while
the African population size N
Af
remains constant until
the present. The two Eurasian groups split from the
ancestral popu lation N
B
at time T
1-2
, with initial popula-
tion sizes of N
1_0
and N
2_0
, respectively. Both popula-
tions experience exponential population size changes
from the time of divergence to reach the current popu-
lation sizes N
1
and N
2
.
The inferred parameters between continental groups,
along with confidence intervals (CIs) for each parameter,
are sh own in Table 4. When the mutation rate is set at
1.48 π 10
-8
per base pair per generation (see Materials
and methods for mutation rate estimate), the ancestral
population size is estimated to be between 13,000 and
14,000 for all models (Table 4). The African e ffective
population size estimates (N
Af
, 18,036 to 18,976; CI,
15,077 to 22,673) are comparable to the size of the Eur-
asian ancestral population (N
B
,12,624to21,371;CI,
7,360 to 32,843). A t the time of t he Eurasian population
divergence, the population sizes of the two Eurasian
continental groups in each model (N
1_0
and N
2_0
)are
consistently smaller than the African and the Eurasian
ancestral population sizes, with one exception for the
estimated European population size (25,543; CI 6,101 to
29,016) in the Africa-East Asia-Europe model. These
results suggest that the Eurasian population experienced
population bottlenecks at the time of their divergence.
Among Eurasians, East Asians have the smallest effec-
tive population size at the time of divergence (approxi-
mately 1,500; CI, 779 to 3,703; Table 4). The divergence
time estimates between Africans and non-Africans range
from 88.4 to 111.5 kya and the CIs of all three estimates
overlapped, consistent with the existence of a single
Table 3 Pairwise F
ST
values (%) between Indian and
HapMap non-Indian populations
LWK YRI CEU TSI CHB CHD JPT
Brahmin 35.1 37.6 12.3 9.5 18.0 13.0 17.0
GIH 32.6 34.9 11.5 6.2 11.5 5.9 10.0
Mala/Madiga 31.7 34.3 10.4 6.7 12.8 8.1 11.8
Yadava 31.8 34.5 12.8 9.1 12.9 8.9 12.2
Irula 33.2 35.4 15.8 11.5 8.3 6.2 8.0
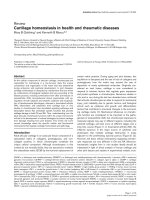
Figure 4 Illustration of the ∂a∂i models. (a) Three-population
out-of-Africa model. The ten parameters estimated in the model
(N
A
, N
Af
, N
B
, N
1_0
, N
1
, N
2_0
, N
2
, T
Af
, T
B
, T
1-2
,) are shown. (b) Four-
population out-of-Africa model. The ten parameters estimated in
the model (N
A
, N
C
, N
1_0
, N
1
, N
2_0
, N
2
, N
3_0
, N
3
, T
C
, T
2-3
,) are shown.
N
Af
, N
B
, T
Af
, and T
B
are fixed in this model.
Xing et al. Genome Biology 2010, 11:R113
/>Page 6 of 13
ancestral Eurasian population. The three non-African
continental groups diverged from each other more
recently than 40 kya: East Asians were separated from
Indians (39.3 kya; CI, 29.7 to 59.1) and Europeans (39.2
kya; CI, 29.8 to 55.8) before the divergence of Indians
and Europeans (26.6 kya; CI, 20.1 to 40.8). Overall,
these results support a scenario in which the ancestors
of the Indian, European, and East Asian individuals left
Africa in one major migration event, and then diverged
from one another more than 40,000 years later.
To further examine the population history among
Eurasian populations, we constructed a four-population
model containing all four continental groups (Figure
4b). Because parameters from only three populations
can be estimated by ∂a∂i at the same time, we fixed the
parameters of the out-of-Africa epoch (N
Af
, N
B
, T
Af
,
and T
B
) in the model based on the parameters estimated
from the three-population model with the highest likeli-
hood (Africa-East Asia-European), as described in ∂a∂i
[32]. A model comparison again suggests t hat adding
migrations to the model does not substantially improve
the model-fitting (Supplemental text and Supplemental
Figure S6 in Addit ional file 1). Therefore, migrations
were excluded from the model to reduce the number of
inferred parameters and to improve the speed of com-
putation. Among the three population divergence sce-
narios, two models (’East Asia first’ and ‘ India first’ )
showed similar maximum likelihood values (-1,278.9
and -1,278.7, respectively), indicating comparable fitting
to the data. In contrast, the ‘Europe first’ model has a
substantially lower maximum likelihood value (-1,280.7),
suggesting that this model is less plausible. The esti-
mated parameters for the ‘ East Asia first’ and the ‘India
first’ models are shown in Table 5. Consistent with the
three-population models, the ‘East Asia first’ mode esti-
mates that East Asians diverged from the ancestral
Eurasian population approximately 44 kya, and Eur-
opeans and Indians diverged approximately 24 kya.
Interestingly, the ‘India first’ model suggests that the
divergence time among the three continental groups are
similar, with Indians diverging only 0.2 kya before Eur-
opeans and East Asians. Under this model, the initial
population size of the Indian population (N
1_0
, 11,410;
CI, 4,568 to 28,665) is comparable to the Eurasian
ancestral population size (N
B
, 12,345), consistent with
the high diversity we observed in these Indian samples.
Table 4 ∂a∂ iinferred parameters for the three-population out-of-Africa model
Continent 1 Africa Africa Africa
Continent 2 East Asia India India
Continent 3 Europe East Asia Europe
N
A
13,107 13,647 13,390
N
Af
18,976 (15,077-22,673) 18,036 (15,277-20,401) 18,387 (14,948-20,674)
N
B
12,624 (7,360-21,768) 18,923 (8,230-32,825) 21,371 (13,078-31,684)
N
1_0
1,563 (903-2,760) 4,073 (1,791-27,445) 1,829 (1,055-5,463)
N
1
40,488 (20,734-77,945) 36,425 (11,976-86,661) 75,961 (20,902-137,972)
N
2_0
25,543 (6,101-29,016) 1,504 (780-3,702) 3,471 (1,813-25,273)
N
2
18,400 (14,733-52,112) 39,580 (18,835-91,179) 70,960 (17,890-139,643)
T
Af
(kya) 115.4 (62.9-219.7) 112.0 (72.0-728.2) 113.7 (77.0-411.0)
T
B
(kya) 88.4 (62.5-125.4) 111.5 (72.0-150.2) 103.9 (76.8-134.5)
T
1-2
(kya) 39.2 (29.8-55.8) 39.3 (29.7-59.1) 26.6 (20.8-40.8)
Maximum likelihood -1,232.6 -1,272.6 -1,276.0
Confidence intervals are shown in parentheses.
Table 5 ∂a∂ iinferred parameters for the four-population
out-of-Africa model
Model
East Asia first India first
Continent 1 East Asia India
Continent 2 India East Asia
Continent 3 Europe Europe
N
A
13,195 13,483
N
Af
a
19,023 19,438
N
B
a
12,081 12,345
N
1_0
2,003 (1,198-3,529) 11,410 (4,568-28,665)
N
1
31,020 (16,773-54,561) 18,182 (9,643-45,162)
N
C
77,786 (25,900-143,596) 171 (14-127,200)
N
2_0
1,881 (1,160-5,214) 1,735 (891-2,571)
N
2
77,285 (21,282-135,595) 33,571 (20,084-66,737)
N
3_0
2,029 (1,552-6,314) 11,689 (3,309-27,864)
N
3
131,889 (26,976-142,541) 28,370(15,869-64,163)
T
Af
(kya)
a
119.6 117.8
T
B
(kya)
a
92.2 89.8
T
C
(kya) 43.9 (25.9-69.3) 40.5 (30.9-56.2)
T
2-3
(kya) 23.9 (18.2-35.6) 40.3 (31.0-44.6)
Maximum likelihood -1,278.9 -1,278.7
a
N
Af
, N
B
, T
Af
,andT
B
were fixed in the model based on the best parameters
from the three-population model. Confidence intervals are shown in
parentheses.
Xing et al. Genome Biology 2010, 11:R113
/>Page 7 of 13
When individual populations are analyzed, the pat-
terns are largely consistent with the re sults from conti-
nental groups (Supplemental text and Supplemental
Table S4 in Additional file 1). The CIs around the para -
meters are generally larger, indicating a loss of power
due to the smaller sample sizes of the individual popula-
tions compared to the continental groups.
Discussion
India has served as a major passageway for the dispersal
of modern humans, and Indian demographics have been
influenced by multiple waves of human migrations
[3,9,33]. Because of its long history of human settlement
and its enormous social, linguistic, and cultural diversity,
the population history of India has long intrigued anthro-
pologists and human geneticists [3,12-14,20,34,35].
A better understanding of Indian genetic diversity and
population history can provide new insights into early
migration patterns that may have influenced the evolu-
tion of modern humans.
By sampling and resequencing 92 south Indian indivi-
duals we found 137 novel SNPs in the 100-kb region.
These new SNPs represent approximately 30% of the
tot al SNPs in these individuals. This resu lt is consistent
with several previous studies that showed that genetic
variants in Indian po pulations, especially the less com-
mon variants, are incompletely captured by HapMap
populations [12,29,36]. More importantly, we found that
genetic diversity varies substantially among Indian popu-
lations. At the continent al level, the Indian continental
group has significantly higher n ucleotide diversity than
both European and East Asian groups. Although the
HapMap GIH and the Brahmin populations have genetic
diversity values comparable to those of other HapMap
Eurasian populations, diversity values (π and H)inthe
Irula, Mala/Madiga, and Yadava samples are higher than
those of t he HapMap African populations. The genetic
diversity difference among Indian populations has been
observed previously in mitochondria [37], autosomal
[34], and Y chromosome [11] studies. Even among geo-
graphically proximate populations, genetic diversity can
vary greatly due to differences in effective po pulation
sizes, mating patterns, and population history among
these populations. Our finding highlights the importance
of including multiple Indian populations in the human
genetic diversity discovery effort.
Because sequence data are free of ascertainment bias,
we were able to study the relationship between popula-
tions in detail. In addition to examining population dif-
ferentiati on (by F
ST
estimates) and population structure,
we inferred the divergence time and migration rate
among continent al groups using the prog ram ∂a∂i.The
estimates of continental F
ST
values and PCA results
show that the greatest population differe ntiation occurs
between African and non-African groups, while the least
amount of differentiation occurs between Europeans
and Indian populations. This is consistent with the esti-
mates of divergence time between continental groups
based on the three-population models (Table 4): the
divergence time between African and the ancestral Eura-
sian population (88 to 112 kya; CI, 63 to 150 kya) is
much older than the divergence time am ong the Eura-
siangroups(27to39kya;CI,20to59kya).Themore
recent d ivergence time and the low migration rate esti-
mates a mong the current Eurasian populations support
the ‘delayed expansion’ hypothesis for the human colo-
nization of Eurasia (Figure 5). Consistent with previous
studies [18,19], these estimates indicate that a single
Eurasian ancestral population remained separated from
African populations for more than 40,000 years prior to
the population expansion t hroughout Eurasia and the
divergence of individual Eurasian populations.
Although this Eurasian ancestral population would
have been isolated from the sub-Saharan African popu-
lations in this study, the geographic location of this
population is uncertain. T he most plausible location is
the Middle East and/or northern Africa. A Middle East
location o f this population could explain the admixture
patterns of Neanderthal and the non-African popula-
tions [18], although current archeological evidence does
not support continuous occupation of the Middle East
by modern humans prior to the Eurasian expansion
[38]. Alternatively, a north African location is more con-
sistent with the archeologic al record but re quires
extreme population stratification within Africa [39].
A more comprehensive sampling of Africa n populations
could help to pinpoint the location of this population.
Under the four-population out-of-Africa model, the
divergence times among the three Eura sian continental
groups are similar. The likelihood of the model with an
earlier East Asian divergence is similar to that of the
model with an earlier Indian divergence. This result
appears to contradict the hypothesis that the Indian
sub-continent was first populated by an early ‘southern-
route’ migration through the Arabian Peninsula
[3,15-17]. Previous studies have identified unique mito-
chondrial M haplogroups in some tribal populations
that are consistent with an older wave of migration
[7-9]. For example, some Dravidian-and Austroasiatic-
speaking Indian tribal populations share ancestral mar-
kers with Australian Aborigines on a mitochondrial M
haplogroup (M42), which is dated to approximately 55
kya [40]. However, because our samples of the Indian
continental group are composed of three caste popula-
tions and one tribal Indian population, these populations
are unlikely to effectively represent the descendants of
the e arly ‘southern-route’ migration event. This sample
collection might partially explain why we were unable to
Xing et al. Genome Biology 2010, 11:R113
/>Page 8 of 13
distinguish the ‘ East Asia first’ model from the ‘ India
first’ model.
The between-population F
ST
esti mates and divergence
time estimates show that the Indian populations have
different affinities to European and East Asian popula-
tions. South Indian Brahmin and northern Indian GIH
have higher aff inity to European s than to East Asians,
while the tribal Irula generally have closer affinity to
East Asian populations. The differential population affi-
nities of Indian populations to other Eurasian p opula-
tions have been observed previously using mtDNA, Y-
chromosome, and autosomal markers. Regardless of
caste affiliation, genetic distance estimates with mito-
chondrial markers showed a gre ater affinity of south
Indian castes to East Asians, while distance estimates
with Y-chromosome markers showed greater affinity of
Indian castes to Europeans [14,41,42]. Distances esti-
mated from autosomal STRs and SNPs also showed dif-
ferential affinity of caste populations to Eur opean and
East Asian populations [12-14,20].
There are some limitations on our ability to infer
demographic history in this study. First, our results are
based on the sequence of a continuous 100-kb region.
Therefore, these results reflect the history of a number
of possibly co-segregating markers from a small portion
of the genome. Our CIs around the parameter estimates,
however, account for this co-segregation. Second,
although we incorporated a number of parameters of
population history, our demographic model is still a
simplification of the true population history. Third,
parameters estimated in o ur model are dependent on
the estimate of the huma n mutation rate, which varie s
several-fold using different methods or datasets [43,44].
Nevertheless, with appropriate caution, the sequence
data allow us to explore demographic models in ways
that are not possible with genotype data alone.
Conclusions
By sequencing a 100-kb autosomal region, we show that
Indian populations harbor large amounts of genetic var-
iation that have not b een surveyed adequately by public
SNP discovery efforts. In addition, our results strongly
support the existence of an ancestral Eurasian popula-
tion that remained separated from African populat ions
for a long period of time before a major population
expansion throughout Eurasia. With the rapid develop-
ment of sequencing technologies, in the near future we
will obtain exome and whole-genome data sets from
Figure 5 The ‘dela yed expansion’ hypothesis. In this hypothesis, the ancestal Eurasian population separated from African populations
approximately 100 kya but did not expand into most of Eurasia until approximately 40 kya.
Xing et al. Genome Biology 2010, 11:R113
/>Page 9 of 13
many diverse populations, such as isolated Indian tribal
groups who might better represent the descendants of a
‘southern-route’ migration event. These data will allow
us to evaluate more complex models and refine the
demographic history of the human Eurasian expansion.
Materials and methods
DNA samples, DNA sequencing and SNP calling
Ninety-fo ur individuals from three caste groups and one
tribal group from Andhra Pradesh, India were sampled
(Figure 1a). All samples b elong to the Dravidian lan-
guage family and were colle cted as unrelated individuals
as described previously [45,46]. All studies of South
Indian populatio ns were performed with approval of the
Institutional Review Board of the University of Utah and
Andhra University, India. To sequence the ENCODE
region ENr123, we used the same sets of primers that
were used for the ENCODE3 project for PC R amplific a-
tion and the same Sanger sequencing. Next, we obtained
the sequence of 722 HapMap individuals from the
ENCODE3 project [29] and performed SNP calling
using the same SNP discovery pipeline [47]. This experi-
mental design allowed us to directly compare genetic
variation patterns observed in these Indian populations
with those ob served in the HapMap populations studied
by ENCODE3 [29]. The sequence traces of the Indian
samples generated from this study can be accessed at
NCBI trace archive [48] by submitting the query: cen-
ter_project = ‘RHIDZ’.
SNPs and individual selection
After the SNP-calling process, two individuals with less
than 80% call rates were removed from the dataset (one
Brahmin and one Yadava). The SNP calls from the
remaining 92 samples that passed quality control were
then combined with the SNP calls from eight HapMap
non-admixed populations studied by ENCODE3, includ-
ing individuals from the Centre d’Etude du Polymor-
phisme Humain collection in Utah, USA, with ancestry
from Northern and Western Europe (CEU), Han Chi-
nese in Beijing, China (CHB), Japanese in Tokyo, Japan
(JPT), Yoruba in Ibadan, Nigeria (YRI), Chinese in
Metropolitan Denver, CO, USA (CHD), Gujarati Indians
in Houston, TX, USA (GIH), Luhya in Webuye, Kenya
(LWK), and Toscani in Italy (TSI), to create a final data-
set containing 722 individuals from 12 populations.
After merging the HapMap and the so uth Indian data
sets, 112 loci that are fixed in all 12 populations were
removed from the dataset. Thirteen tri-allelic SNPs were
also removed because most analyses in this study are
designed for bi-allelic SNPs. For SNPs that are fixed in
certain populations, genotypes were filled-in using the
hg18 reference allele because the reference allele infor-
mation was used in the SNP calling process (that is,
only genotypes that are different from the reference
alleles are called as SNPs).
The Hardy-Weinberg equilibrium test was performed
on each of the 12 populations, and P-values from each
test were obtaine d and transformed to Z-scor es. Twelve
Z-scores were combined to a single Z-score and trans-
formed to a single P-value for each SNP. Bonferroni
correction was used, and 48 SNPs that failed the test at
the 0.01 level (P < 0.01/1,532) were removed. The
ancestral/derived allele states of each SNP were deter-
mined using the human/chimpanzee alignment obtained
from the UCSC database (hg18 vs.panTro2 [49]).
Minor-alleles of 17 SNPs were assigned as the derived
allele because the derived allele could not be determined
by human-chimpanzee alignments. Genotypes of all
samples in the final dataset are available as a supple-
mental file on our website [50] under Published Data.
SNP validation
For the 137 SNPs that are specific to our samples (that
is, not present in any HapMap populations), we per-
formed a validation experiment using an independent
platform (Roche 454). When the minor allele is present
in more than five individuals at a given locus, five indi-
viduals w ith the heterozygous genotype were randomly
selected for va lidation. Among the 137 SNPs, we suc-
cessfully designed and assayed 119 SNPs in 211 indivi-
dual experiments. For the validat ion pipeline, we used
PCR to amplify regions around the variants using the
same primers as those used in the initial variant detec-
tion pipeline. In order to make genotype calls on all
experiments simultaneously and also to reduce the cost
of Roche 454 sequencing, we pooled PCR reactions in
ten different pools and each pool was sequenced using a
quarter of a Roche Titanium 4 54 sequencing run. The
analysis was done using the Atlas-SNP2 pipeline avail-
able at the BCM-HGSC [51]. Reads from the 454 runs
were anchored using BLAT [52] to a unique spot in the
genome, followed with the refined alignments using the
cross_match program [53]. We required at least 50
reads mapped to the variant site to make a validation
call and the fraction of reads with the variant to be
>15% of all reads mapping to that site.
Sequence statistics, F
ST
estimates, and PCA
Sequence-analysis statistics (S, θ, π, H and Tajima’s D),
and the co nfidence intervals for θ and π were calculated
using the Popul ation Genetics and Evolution Toolbox
[54] in MATLAB (version r2009a). To assess haplotype
diversity, the dataset was phased using fas tPHASE (ver-
sion 1.2) [55] with imputation, and the phased dataset
was separated into ten 10-k b non-overlapping windows.
Haplotype heterozygosity was then calculated for each
window, and the mean heterozygosity for each
Xing et al. Genome Biology 2010, 11:R113
/>Page 10 of 13
population/continental group was calculated. For the
SNP heterozygosity/geographic distance correlation ana-
lysis, the great-circle distance between each population
and Addis Ababa, Ethiopia, a proposed point of modern
human origin [56], was calculated. For populations that
were collected from places other than their origins, an
approximate origin location was used, s uch as Beijing,
China for CHD, and Gujarat, India for GIH. F
ST
esti-
mates between populations were calculated by the
method described by Weir and Cockerha m [57]. Nei ’ s
genetic distances between populations were estimated
from allele-frequency data as implemented in the PHY-
LIP software package [58] and PCA was performed
using MATLAB.
Demographic history inference
Demographic history parameters were inferred using the
program ∂a∂i (version 1.5.2) [59]. Using a diffusion
approximation to the al lele-frequency spectrum, ∂a∂i
implements a series of methods to infer population his-
tory based on sequence data. We compared three differ-
ent three-population o ut-of-Africa models and three
four-population out-of A frica models to test the effect
of adding different parameters to the model (Supple-
mental text and Supplemental Figures S5 and S6 in
Additional file 1). For the two models used in the final
analysis, the python programs that were u sed to esti-
mate the parameters, including the function calls, grid
sizes, initial parameters, and parameter boundaries, are
shown in Supplemental Figures S7 and S8 in Additional
file 1. To ensure that the algorithm ident ified the opti-
mal parameters, ten independent runs were performed
on each model, and the parameter set with the highest
likelihood was selected as the final result. For each
model, 500 bootstrap replicates were performed on the
dataset to obtain the confidence intervals. The per-gen-
eration m utation rate was estimated based on the
human-chimpanzee divergence in this region (1.2%)
using the method de scribed in [43], with a gene ration
time of 25 years, a human-chimpanzee speciation time
of 6 million years ago, and a human-chimpanzee ances-
tral effective popul ation size of 84,000 (averaged from
the estimates from [60-62]).
Additional material
Additional file 1: Supplemental text, four supplemental tables, and
nine supplemental figures.
Abbreviations
Bp: base pair; CI: confidence interval; DAF: derived-allele frequency; kb, kilo-
base; kya, thousand years ago; PC: principal component; PCA: principal
components analysis; SNP: single nucleotide polymorphism; STR: short
tandem repeat.
Acknowledgements
We thank BVR Prasad, JM Naidu, and B Baskara Rao for help in collecting
samples in Andhra Pradesh, India. We thank Lora R Lewis, David Wheeler,
and Kyle Chang for assistance with resequencing and pipeline analysis. We
also thank two anonymous reviewers for their constructive comments. This
study was funded by the National Human Genome Research Institute,
National Institute of Health (5U54HG003273 and 1U01HG005211-01 to RG),
and National Institute of Health (GM-59290 to LBJ). JX is supported by the
National Human Genome Research Institute, National Institute of Health
(K99HG005846). CH is supported by the University of Luxembourg-Institute
for Systems Biology Program and the Primary Children’s Medical Center
Foundation National Institute of Diabetes and Digestive and Kidney Disea ses
(DK069513). Part of the computation for the project was performed at the
Center for High Performance Computing, University of Utah.
Author details
1
Department of Human Genetics, Eccles Institute of Human Genetics,
University of Utah, 15 North 2030 East, Salt Lake City, UT 84112, USA.
2
Human Genome Sequencing Center, Department of Molecular and Human
Genetics, Baylor College of Medicine, One Baylor Plaza, Houston,
TX 77030, USA.
3
Department of Pediatrics, University of Washington, 1959 NE
Pacific Street, Seattle, WA 98105, USA.
Authors’ contributions
JX, LJ, and FY conceived and designed the study. JX, WSW, YH, CH, and FY
performed the analysis and wrote the manuscript. AS and DM generated
sequencing data and performed the validation experiment. MB collected the
Indian samples. RG, LJ, and FY participated in project coordination. All
authors read and approved the final manuscript.
Competing interests
The authors declare that they have no competing interests.
Received: 21 July 2010 Revised: 29 October 2010
Accepted: 24 November 2010 Published: 24 November 2010
References
1. Singh KS: People of India: An Introduction Calcutta Anthropological Survey of
India; 1992.
2. Chaubey G, Metspalu M, Kivisild T, Villems R: Peopling of South Asia:
investigating the caste-tribe continuum in India. Bioessays 2007,
29:91-100.
3. Cavalli-Sforza LL, Menozzi P, Piazza A: The History and Geography of Human
Genes Princeton: Princeton University Press; 1994.
4. Thapar R: Early India Berkeley: University of California Press; 2002.
5. Majumder PP: The human genetic history of South Asia. Curr Biol 2010,
20:R184-187.
6. Palanichamy MG, Sun C, Agrawal S, Bandelt HJ, Kong QP, Khan F, Wang CY,
Chaudhuri TK, Palla V, Zhang YP: Phylogeny of mitochondrial DNA
macrohaplogroup N in India, based on complete sequencing:
implications for the peopling of South Asia. Am J Hum Genet 2004,
75:966-978.
7. Chandrasekar A, Kumar S, Sreenath J, Sarkar BN, Urade BP, Mallick S,
Bandopadhyay SS, Barua P, Barik SS, Basu D, Kiran U, Gangopadhyay P,
Sahani R, Prasad BV, Gangopadhyay S, Lakshmi GR, Ravuri RR, Padmaja K,
Venugopal PN, Sharma MB, Rao VR: Updating phylogeny of mitochondrial
DNA macrohaplogroup m in India: dispersal of modern human in South
Asian corridor. PLoS One 2009, 4:e7447.
8. Kumar S, Padmanabham PB, Ravuri RR, Uttaravalli K, Koneru P,
Mukherjee PA, Das B, Kotal M, Xaviour D, Saheb SY, Rao VR: The earliest
settlers’ antiquity and evolutionary history of Indian populations:
evidence from M2 mtDNA lineage. BMC Evol Biol 2008, 8:230.
9. Macaulay V, Hill C, Achilli A, Rengo C, Clarke D, Meehan W, Blackburn J,
Semino O, Scozzari R, Cruciani F, Taha A, Shaari NK, Raja JM, Ismail P,
Zainuddin Z, Goodwin W, Bulbeck D, Bandelt HJ, Oppenheimer S, Torroni A,
Richards M: Single, rapid coastal settlement of Asia revealed by analysis
of complete mitochondrial genomes. Science 2005, 308:1034-1036.
Xing et al. Genome Biology 2010, 11:R113
/>Page 11 of 13
10. Thangaraj K, Chaubey G, Kivisild T, Reddy AG, Singh VK, Rasalkar AA,
Singh L: Reconstructing the origin of Andaman Islanders. Science 2005,
308:996.
11. Sengupta S, Zhivotovsky LA, King R, Mehdi SQ, Edmonds CA, Chow CE,
Lin AA, Mitra M, Sil SK, Ramesh A, Usha Rani MV, Thakur CM, Cavalli-
Sforza LL, Majumder PP, Underhill PA: Polarity and temporality of high-
resolution y-chromosome distributions in India identify both indigenous
and exogenous expansions and reveal minor genetic influence of
central asian pastoralists. Am J Hum Genet 2006, 78:202-221.
12. Indian Genome Variation Consortium: Genetic landscape of the people of
India: a canvas for disease gene exploration. J Genet 2008, 87:3-20.
13. Reich D, Thangaraj K, Patterson N, Price AL, Singh L: Reconstructing Indian
population history. Nature 2009, 461:489-494.
14. Watkins WS, Thara R, Mowry BJ, Zhang Y, Witherspoon DJ, Tolpinrud W,
Bamshad MJ, Tiripati S, Padmavati R, Smith H, Nancarrow D, Filippich C,
Jorde LB: Genetic variation in South Indian castes: evidence from Y-
chromosome, mitochondrial, and autosomal polymorphisms. BMC Genet
2008, 9:86.
15. Lahr MM, Foley R: Multiple dispersals and modern human origins. Evol
Anthropol 1994, 3:48-60.
16. Forster P, Matsumura S: Evolution. Did early humans go north or south?
Science 2005, 308:965-966.
17. Disotell TR: Human evolution: the southern route to Asia. Curr Biol 1999,
9:R925-928.
18. Green RE, Krause J, Briggs AW, Maricic T, Stenzel U, Kircher M, Patterson N,
Li H, Zhai W, Fritz MH, Hansen NF, Durand EY, Malaspinas AS, Jensen JD,
Marques-Bonet T, Alkan C, Prufer K, Meyer M, Burbano HA, Good JM,
Schultz R, Aximu-Petri A, Butthof A, Hober B, Hoffner B, Siegemund M,
Weihmann A, Nusbaum C, Lander ES, Russ C, et al: A draft sequence of
the Neandertal genome. Science 2010, 328:710-722.
19. Xing J, Watkins WS, Shlien A, Walker E, Huff CD, Witherspoon DJ, Zhang Y,
Simonson TS, Weiss RB, Schiffman JD, Malkin D, Woodward SR, Jorde LB:
Toward a more uniform sampling of human genetic diversity: A survey
of worldwide populations by high-density genotyping. Genomics 2010,
96:199-210.
20. Xing J, Watkins WS, Witherspoon DJ, Zhang Y, Guthery SL, Thara R,
Mowry BJ, Bulayeva K, Weiss RB, Jorde LB: Fine-scaled human genetic
structure revealed by SNP microarrays. Genome Res 2009, 19:815-825.
21. Tian C, Plenge RM, Ransom M, Lee A, Villoslada P, Selmi C, Klareskog L,
Pulver AE, Qi L, Gregersen PK, Seldin MF: Analysis and application of
European genetic substructure using 300 K SNP information. PLoS Genet
2008, 4:e4.
22. Li JZ, Absher DM, Tang H, Southwick AM, Casto AM, Ramachandran S,
Cann HM, Barsh GS, Feldman M, Cavalli-Sforza LL, Myers RM: Worldwide
human relationships inferred from genome-wide patterns of variation.
Science 2008, 319:1100-1104.
23. Jakobsson M, Scholz SW, Scheet P, Gibbs JR, VanLiere JM, Fung HC,
Szpiech ZA, Degnan JH, Wang K, Guerreiro R, Bras JM, Schymick JC,
Hernandez DG, Traynor BJ, Simon-Sanchez J, Matarin M, Britton A, van de
Leemput J, Rafferty I, Bucan M, Cann HM, Hardy JA, Rosenberg NA,
Singleton AB: Genotype, haplotype and copy-number variation in
worldwide human populations.
Nature 2008, 451:998-1003.
24. Novembre J, Johnson T, Bryc K, Kutalik Z, Boyko AR, Auton A, Indap A,
King KS, Bergmann S, Nelson MR, Stephens M, Bustamante CD: Genes
mirror geography within Europe. Nature 2008, 456:98-101.
25. Abdulla MA, Ahmed I, Assawamakin A, Bhak J, Brahmachari SK, Calacal GC,
Chaurasia A, Chen CH, Chen J, Chen YT, Chu J, Cutiongco-de la Paz EM, De
Ungria MC, Delfin FC, Edo J, Fuchareon S, Ghang H, Gojobori T, Han J,
Ho SF, Hoh BP, Huang W, Inoko H, Jha P, Jinam TA, Jin L, Jung J,
Kangwanpong D, Kampuansai J, Kennedy GC, et al: Mapping human
genetic diversity in Asia. Science 2009, 326:1541-1545.
26. Bryc K, Auton A, Nelson MR, Oksenberg JR, Hauser SL, Williams S,
Froment A, Bodo JM, Wambebe C, Tishkoff SA, Bustamante CD: Genome-
wide patterns of population structure and admixture in West Africans
and African Americans. Proc Natl Acad Sci USA 2010, 107:786-791.
27. Wall JD, Cox MP, Mendez FL, Woerner A, Severson T, Hammer MF: A novel
DNA sequence database for analyzing human demographic history.
Genome Res 2008, 18:1354-1361.
28. Clark AG, Hubisz MJ, Bustamante CD, Williamson SH, Nielsen R:
Ascertainment bias in studies of human genome-wide polymorphism.
Genome Res 2005, 15:1496-1502.
29. Altshuler DM, Gibbs RA, Peltonen L, Dermitzakis E, Schaffner SF, Yu F,
Bonnen PE, de Bakker PI, Deloukas P, Gabriel SB, Gwilliam R, Hunt S,
Inouye M, Jia X, Palotie A, Parkin M, Whittaker P, Chang K, Hawes A,
Lewis LR, Ren Y, Wheeler D, Muzny DM, Barnes C, Darvishi K, Hurles M,
Korn JM, Kristiansson K, Lee C, McCarrol SA, et al: Integrating common and
rare genetic variation in diverse human populations. Nature 2010,
467:52-58.
30. Ramachandran S, Deshpande O, Roseman CC, Rosenberg NA, Feldman MW,
Cavalli-Sforza LL: Support from the relationship of genetic and
geographic distance in human populations for a serial founder effect
originating in Africa. Proc Natl Acad Sci USA 2005, 102:15942-15947.
31. Metspalu M, Kivisild T, Metspalu E, Parik J, Hudjashov G, Kaldma K, Serk P,
Karmin M, Behar DM, Gilbert MT, Endicott P, Mastana S, Papiha SS,
Skorecki K, Torroni A, Villems R: Most of the extant mtDNA boundaries in
south and southwest Asia were likely shaped during the initial
settlement of Eurasia by anatomically modern humans. BMC Genet 2004,
5:26.
32. Gutenkunst RN, Hernandez RD, Williamson SH, Bustamante CD: Inferring
the joint demographic history of multiple populations from
multidimensional SNP frequency data. PLoS Genet 2009, 5:e1000695.
33. Majumder PP: Genomic inferences on peopling of south Asia. Curr Opin
Genet Dev 2008, 18:280-284.
34. Watkins WS, Prasad BV, Naidu JM, Rao BB, Bhanu BA, Ramachandran B,
Das PK, Gai PB, Reddy PC, Reddy PG, Sethuraman M, Bamshad MJ, Jorde LB:
Diversity and divergence among the tribal populations of India. Ann
Hum Genet 2005, 69:680-692.
35. Wooding S, Ostler C, Prasad BV, Watkins WS, Sung S, Bamshad M, Jorde LB:
Directional migration in the Hindu castes: inferences from
mitochondrial, autosomal and Y-chromosomal data. Hum Genet 2004,
115:221-229.
36. Xing J, Witherspoon DJ, Watkins WS, Zhang Y, Tolpinrud W, Jorde LB:
HapMap tagSNP transferability in multiple populations: general
guidelines. Genomics
2008, 92:41-51.
37. Basu A, Mukherjee N, Roy S, Sengupta S, Banerjee S, Chakraborty M, Dey B,
Roy M, Roy B, Bhattacharyya NP, Roychoudhury S, Majumder PP: Ethnic
India: a genomic view, with special reference to peopling and structure.
Genome Res 2003, 13:2277-2290.
38. Stringer CB, Andrews P: Genetic and fossil evidence for the origin of
modern humans. Science 1988, 239:1263-1268.
39. Hodgson JA, Bergey CM, Disotell TR: Neandertal genome: the ins and outs
of African genetic diversity. Curr Biol 2010, 20:R517-519.
40. Kumar S, Ravuri RR, Koneru P, Urade BP, Sarkar BN, Chandrasekar A, Rao VR:
Reconstructing Indian-Australian phylogenetic link. BMC Evol Biol 2009,
9:173.
41. Bamshad M, Kivisild T, Watkins WS, Dixon ME, Ricker CE, Rao BB, Naidu JM,
Prasad BV, Reddy PG, Rasanayagam A, Papiha SS, Villems R, Redd AJ,
Hammer MF, Nguyen SV, Carroll ML, Batzer MA, Jorde LB: Genetic evidence
on the origins of Indian caste populations. Genome Res 2001, 11:994-1004.
42. Cordaux R, Aunger R, Bentley G, Nasidze I, Sirajuddin SM, Stoneking M:
Independent origins of Indian caste and tribal paternal lineages. Curr Biol
2004, 14:231-235.
43. Nachman MW, Crowell SL: Estimate of the mutation rate per nucleotide
in humans. Genetics 2000, 156:297-304.
44. Roach JC, Glusman G, Smit AF, Huff CD, Hubley R, Shannon PT, Rowen L,
Pant KP, Goodman N, Bamshad M, Shendure J, Drmanac R, Jorde LB,
Hood L, Galas DJ: Analysis of genetic inheritance in a family quartet by
whole-genome sequencing. Science 2010, 328:636-639.
45. Bamshad MJ, Watkins WS, Dixon ME, Jorde LB, Rao BB, Naidu JM, Prasad BV,
Rasanayagam A, Hammer MF: Female gene flow stratifies Hindu castes.
Nature 1998, 395:651-652.
46. Watkins WS, Bamshad M, Dixon ME, Bhaskara Rao B, Naidu JM, Reddy PG,
Prasad BV, Das PK, Reddy PC, Gai PB, Bhanu A, Kusuma YS, Lum JK,
Fischer P, Jorde LB: Multiple origins of the mtDNA 9-bp deletion in
populations of South India. Am J Phys Anthropol 1999, 109:147-158.
47. Zhang J, Wheeler DA, Yakub I, Wei S, Sood R, Rowe W, Liu PP, Gibbs RA,
Buetow KH: SNPdetector: a software tool for sensitive and accurate SNP
detection. PLoS Comput Biol 2005, 1:e53.
48. NCBI Trace Archive. [ />49. UCSC database human-chimpanzee alignments. [.
ucsc.edu/goldenPath/hg18/vsPanTro2/].
50. Jorde Laboratory Website. [].
Xing et al. Genome Biology 2010, 11:R113
/>Page 12 of 13
51. Shen Y, Wan Z, Coarfa C, Drabek R, Chen L, Ostrowski EA, Liu Y,
Weinstock GM, Wheeler DA, Gibbs RA, Yu F: A SNP discovery method to
assess variant allele probability from next-generation resequencing data.
Genome Res 2010, 20:273-280.
52. Kent WJ: BLAT-the BLAST-like alignment tool. Genome Res 2002,
12:656-664.
53. The cross_match program. [].
54. Cai JJ: PGEToolbox: A Matlab toolbox for population genetics and
evolution. J Hered 2008, 99:438-440.
55. Scheet P, Stephens M: A fast and flexible statistical model for large-scale
population genotype data: applications to inferring missing genotypes
and haplotypic phase. Am J Hum Genet 2006, 78:629-644.
56. White TD, Asfaw B, DeGusta D, Gilbert H, Richards GD, Suwa G, Howell FC:
Pleistocene Homo sapiens from Middle Awash, Ethiopia. Nature 2003,
423:742-747.
57. Weir BS, Cockerham CC: Estimating F-statistics for the analysis of
population structure. Evolution 1984, 38:1358-1370.
58. Felsenstein J: PHYLIP (Phylogeny Inference Package) version 3.6 Department of
Genome Sciences, University of Washington, Seattle; 2004.
59. The dadi program. [ />60. Burgess R, Yang Z: Estimation of hominoid ancestral population sizes
under bayesian coalescent models incorporating mutation rate variation
and sequencing errors. Mol Biol Evol 2008, 25:1979-1994.
61. Chen FC, Li WH: Genomic divergences between humans and other
hominoids and the effective population size of the common ancestor of
humans and chimpanzees. Am J Hum Genet 2001, 68:444-456.
62. Wall JD: Estimating ancestral population sizes and divergence times.
Genetics 2003, 163:395-404.
doi:10.1186/gb-2010-11-11-r113
Cite this article as: Xing et al.: Genetic diversity in India and the
inference of Eurasian population expansion. Genome Biology 2010 11:
R113.
Submit your next manuscript to BioMed Central
and take full advantage of:
• Convenient online submission
• Thorough peer review
• No space constraints or color figure charges
• Immediate publication on acceptance
• Inclusion in PubMed, CAS, Scopus and Google Scholar
• Research which is freely available for redistribution
Submit your manuscript at
www.biomedcentral.com/submit
Xing et al. Genome Biology 2010, 11:R113
/>Page 13 of 13