Báo cáo y học: " Large scale comparison of global gene expression patterns in human and mous" pot
Bạn đang xem bản rút gọn của tài liệu. Xem và tải ngay bản đầy đủ của tài liệu tại đây (2.02 MB, 11 trang )
RESEARCH Open Access
Large scale comparison of global gene expression
patterns in human and mouse
Xiangqun Zheng-Bradley
*
, Johan Rung, Helen Parkinson, Alvis Brazma
*
Abstract
Background: It is widely accepted that orthologous genes between species are conserved at the sequence level
and perform similar functions in different organisms. However, the level of conservation of gene expression
patterns of the orthologous genes in different species has been unclear. To address the issue, we compared gene
expression of orthologous genes based on 2,557 human and 1,267 mouse samples with high quality gene
expression data, selected from experiments stored in the public microarray repository ArrayExpress.
Results: In a principal component ana lysis (PCA) of combined data from human and mouse samples merged on
orthologous probesets, samples largely form distinctive clusters based on their tissue sources when projected onto
the top principal components. The most prominent groups are the nervous system, muscle/heart tissues, liver and
cell lines. Despite the great differences in sample characteristics and experiment conditions, the overall patterns of
these prominent clusters are strikingly similar for human and mouse. We further analyzed data for each tissue
separately and found that the most variable genes in each tissue are highly enriched with human-mouse tissue-
specific orthologs and the least variable genes in each tissue are enriched with human-mouse housekeeping
orthologs.
Conclusions: The results indicate that the global patterns of tissue-specific expression of orthologous genes are
conserved in human and mouse. The expression of groups of orthologous genes co-varies in the two species, both
for the most variable genes and the most ubiquitously expressed genes.
Background
Over the past two decades, both tissue specificity and
the conservation of expression between orthologous
genes have been much discussed but comparative analy-
sis at the transcriptome level has produced ambiguous
results. While studies suggested that orthologous genes
do not share similar expression patterns [1-5], other
groups reported the opposite observations [6-9]. In fact,
gene-specific expression regulation is different in mouse
and human. For instance, it has been shown that even
for highly conserved and tissue-specific transcription
factors , promoter-binding events are highly species spe-
cific, and binding patterns do not align between species
[10]. We took advantage of the vast amount of human
and mouse gene expression data deposited in ArrayEx-
press to investigate possible corr elation of global
patterns between mouse and human orthologous genes
at the expression level.
The challenge of comparing expression patterns of
orthologous genes in different species is mainly due to
different affinities of probes on different chips, leading to
difficulties in comparing data from different platforms.
Different approaches have been tried to compare gene
expression patterns in different organisms (reviewed
in [11]). Some studies used the same microarray for
cross-hybridization in samples from different species to
eliminate the variations in hybridization and scanning
protocols. This approach typically used either a single-
species array, to which samples from closely related
species or subspecie s were hybridized and expression
levels of orthologous genes were measured [12,13], or
a custom-designed chip that contained probes from
different species [14,15]. Alternatively, many other
studies made use of species-speci fic arrays to identify co-
expressed groups of orthologous genes [4-6,16,17]. In
such studies, how to minimize the platform effects was
* Correspondence: ;
European Bioinformatics Institute, Wellcome Trust Genome Campus,
Cambridge, CB10 1SD, UK
Zheng-Bradley et al. Genome Biology 2010, 11:R124
/>© 2010 Zheng-Bradley et al.; licensee BioMed Central Ltd. This is an open access article distributed under the terms of the Creative
Commons Attribution Li cense ( which permits unrestricted use, distribution, and
reproduction in any medium, provided th e original work is properly cited.
the key to meaningful comparison of the cross-species
data. Some studies identified differentially expressed
genes within species; then the resulting significant gene
lists were compared cross-species to look for patterns of
conservation [3,18]. A few other studies used more
sophisticated algorithms and analyzed c ombined data
from different species at the same time to identify cell
cycle genes with conserved expression patterns between
species [19-21].
Our study used data generated on species-specific
microarray platforms. Only human data from the Affy-
metrix HG-U133A array and mouse data fr om the Affy-
metrix MG_U74Av2 array were considered to exclude
between-array variability within each species. These two
wholegenomearrayswereselectedbecausetheyhave
been used for the highest number of human and mouse
samples in ArrayExpress. Raw data consisting of 5,372
and 1,323 high quality human and mouse CEL files
were selected from ArrayExpress. Each CEL file corre-
sponds to the hybridization of one biological sample.
Since the data matrices are extremely large and the
information content is very rich, we first normalized
and filtered for h uman-mouse orthologous probesets,
then used principal component analysis (PCA) to reduce
the data dimensions. PCA has been often used to study
high-dimensional data generated by genome-wide gene
expression studies [22-25]. In an earlier PCA analysis of
the 5,372 human hybridizations it was found that, on
PCA scatter plots, samples in general clustered together
based on tissue types. Despite the great diversity, the
samples are predominantly clustered into the following
classes of distinctive biological characteristics: hemato-
poietic system, malignancy samples including cell lines,
neoplastic sample and non-n eoplastic primary tissues,
and nervous system. Specific classes of genes are
expressed in different clusters [25]. The study suggested
that samples of similar physiological attributes have
similar gene expression profiles globally and they would
tend to group together on PCA scatter plots.
It is intriguing whether these major gene expression
patterns are conserved across evolutionarily diverse spe-
cies such as human and mouse. We answer this ques-
tion positively and report a similar PCA analysis of the
1,323 mouse hybridizations. Similar to what was
observed in the previous study of human data [25], the
mouse samples also clustered on PCA scatter plots. The
samples were loosely partitioned into a nervous system
cluster, a muscle/heart cluster, a liver cluster and a clus-
ter of samples with lower variability, including cell line
samples. Since the distribution of samples on the scatter
plots is driven by the underlying transcriptome, we
anticipate that samples in each cluster have distin ctive
gene expression profiles. To compare gene expression
profiles between human and mouse, the data from the
two species were normalized and merged into a single
data matrix based on orthologous gene pairings. The
merged data matrix was subjected to PCA analysis. We
observed that the clustering of samples in individual
species is well preserved in the multi-species analysis;
more interestingly, human and mouse share a very simi-
lar pattern of sample clustering. The resemblance of the
human and mouse sample clusters was also observed in
hierarchical clustering of Pearson correlation between
human and mouse tissues. A ll observations suggest that,
for at least a fraction of orthologous genes, the expres-
sion profiles are largel y conserved between the two spe-
cies. The speculation is supported by elevated ge ne
expression correlation co-efficient between human and
mouse orthologous genes comparing with a randomized
negative control. Additional investigations allowed us to
identify orthologous genes whose expression levels co-
vary in the two species.
Results and discussion
Sample clustering analysis of the mouse dataset
An integrated mouse gene expression dataset based on
Affymetrix platform MG_U74Av2 was created as
described in Materials and methods. It can be down-
loaded from the ArrayExpress website [26], accession
number E-MTAB-27. The data matrix of E-MTAB-27
contains normalized gene expression measurements for
1,323 samples from 71 independent experiments for
12,488 probesets, which map to 8,741 genes with
Ensembl identifiers (Table 1). To explore whether the
1,323 samples form d istinct groups based on their gene
expression profiles, the data matrix was subjected to PCA
and the results are visualized by scatter plots. As shown
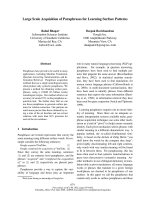
in Figure 1, the majority of brain and nerve samples form
adistinctgrouptogetherwithanumberofretinasam-
ples. The retina and the optic nerve originate as out-
growths of the developing brain and are considered as
part of the central nervous system, which can explain this
co-clustering. Liver samples form a loose cluster com-
pared to the denser nervous system cluster. The third
dominant cluster consists of heart and muscle samples,
and this co-clustering is not surprising considering that
Table 1 Summary of probesets and probeset annotations
for the platforms used in the study
Mouse Human Cross-species
Number of probesets 12,488 22,283 6,180
Number of annotated probesets 9,396 18,387 6,180
Number of Ensembl genes 8,741 13,199 5,925
Three platforms are listed: mouse platform MG_U74Av2, human platform HG-
U133A and the reduced cross-species platform containing only orthologous
probesets between human and mouse. Annotated probesets are those with
gene annotations. The last row in the table is numbers of Ensembl genes
represented by the probesets in each platform.
Zheng-Bradley et al. Genome Biology 2010, 11:R124
/>Page 2 of 11
heart is composed mainly of cardiac muscles. A central
cluster, denser t han the three main tissue specific
clusters, consists of cell lines and other less numerous
samples, such as bone and immune system. This co-
clustering of many sample types in t he central PCA clus-
ter, in particular the cell line samples, was observed in
human studies [25] and may be due to a relatively small
degree of correlation variability between samples. Cell
lines of various tissue types are more homogeneous in
their expression profiles than the original tissues, either
because of less possi ble variability in the sample prepara-
tion, or because the immortalization procedure has had a
profound effect on expression regulation.
Further analysis demonstrated that samples of a parti-
cular tissue type are always represented by multiple
experiments (Additional files 1 and 2), suggesting that
lab effects did not drive the tissue clustering. We con-
clude that, similarly to what has been observed in
human, mouse samples from a given tissue class share
similar global gene expression patterns, causing the
samples to cluster together when they are projected to
the top principal components. When profiling the tran-
scriptome of thousands of samples from different tissues
and different conditions, the subtle variations within the
same class of samples give way to the grand differences
between different sample classes.
Nervous system
Liver
Muscle + heart
Cell line + others
N
ervous system
L
iv
er
Mu
sc
sc
sc
c
c
c
c
sc
c
c
c
c
sc
sc
c
c
c
c
c
s
s
s
le
le
le
le
l
l
l
l
+
hea
rt
l
l
in
e
+ ot
h
he
r
s
Principal component 2
P
r
i
nc
i
pa
l
component
3
Figure 1 PCA plot of the integrated mouse gene expression data matrix. Each dot represents a sample, which is colored by the annotation
of its tissue type. The samples can be loosely divided in four areas from left to right: nervous system (blue), muscle/heart (red), cell line (green)
and others, and liver (purple). The brown dots co-clustering with nervous system samples are retina samples. Samples with unknown organism
part (-) are white so they are invisible.
Zheng-Bradley et al. Genome Biology 2010, 11:R124
/>Page 3 of 11
Sample clustering analysis of combined human and
mouse datasets
To compare the expression pattern of human and
mouse, a direct way is to put normalized expression
data of the two species together and reduce the data
complexity by PCA. On scatter plots of two principal
components, will samples cluster by species or by tissue
types? To answer this question, we created an integrated
mouse and human gene expression matrix, co ntaining
6,180 orthologous probesets measured for 3,824 samples
(2,557 human and 1,267 mouse), as described in Materi-
als and methods. The data can be downloaded from our
web site [27] in the form of Bioconductor’s Expression-
Set objects; a README in the same directory gives
instructions on how to extract matrix of expression
values a nd sam ple annota tion f rom the R objects.
The 6,180 probesets represent 5,925 Ensembl genes
(Table 1). The samples for this analysis were selected to
maintain a balance in tissue representation between
mouse and human, to allow as much comparability
between sample groups as possible between the two spe-
cies. Samples prevailingly dominant in one species were
removed from both species, which include all mammary
gland and all blood and bone marrow samples. This
process removed 2,815 human samples and 56 mouse
samples from the raw datasets. The normalized human
and mouse matrices were merged based on orthologous
probesets; the merged matrix was then analyzed by
PCA. When the data were normalized by probeset, the
first three principal components explain more than half
of the data variance (Additional file 3a). Scatter plots of
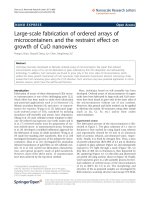
components 1 and 3 are shown in Figure 2a,b, in which
samples are labeled by species and tissue type,
respectively.
In the combined analysis, we observe the same cluster
pattern as in the mouse-only analysis. The four predo-
minant groups are a central cluster of mostly cell line
samples, and three tissue-specific clusters: muscle/heart,
nervous system, and liver samples (Figure 2). Human
samples and mouse samples form the same major clus-
ters, and the tissue-specific clusters of samples from
each species are adjacent in the PCA plot. Similar sam-
ple clustering patterns were observed in scatter plots of
other principal components; one example is components
1 and 2 in Additional file 4. Since the distance between
two samples when projected onto the principal compo-
nents is determined by the covariance of their gene
expression profiles, we believe the similarity of the
Nervous system
Liver
Mouse
Human
Mouse
Human
Human
Mouse
Nervous system
Liver
Muscle + heart
Principal component 1Principal component 1
Principal component 3
(
a
)(
b
)
Figure 2 PCA plots of a combined human and mouse gene expression data matrix (principal components 1 and 3). Each dot represents
a sample, which is labeled by (a) species and (b) tissue type. Cell line samples from both species form a big central cluster, together with a
relative small number of samples from immune system, reproductive system, bone, endocrine organs and other tissue sources from both
species. Away from this central cluster, three major sample clusters are indicated: muscle/heart samples (red), nervous system samples (blue) and
liver samples (purple). For these three clusters, human and mouse samples exhibit subclustering in proximity to each other. In the nervous
system cluster, a few mouse head and neck samples (yellow) are mixed in - these are retina samples that have been generalized into the head
and neck category. In the muscle/heart cluster, a few human bone samples (black) and a few head and neck samples (yellow) are mixed in.
Zheng-Bradley et al. Genome Biology 2010, 11:R124
/>Page 4 of 11
human and mouse tissue clusters reflect the correlation
between the transcriptomes of human and mouse tis-
sues. Our hypothesis is that, in the same types of tissues,
orthologous genes are expressed in a correlated fashion
at the global level in both species. The systematic shift
of the locations between corresponding human and
mouse tissue clusters may be explained by platform
effects that remain after data normalization or it may
reflect the genuine difference in expression patterns
between the species.
Samples such as mammary gland and hematopoietic
system were removed from the analysis presented in
Figure 2 and Additional file 4 due to their one-sided
presence in one species. Our initial PCA studies
included these samples; the overall landscape of the
PCAplotwasdifferentfromwhatwehaveseensofar
but the clustering of samples from nervous system, sam-
ples from muscle and heart, as w ell as the resemblance
of such clusters between human and mouse is still evi-
dent (Additional file 5). Thus, we believe that the cross-
species global gene expression similarity we observed is
not due to sample filtering.
It is interesting to observe that all mouse clusters are
closer to the center than their human counterparts
(Figure 2; Additional files 4 and 5). The observation
may reflect that the expression values on the mouse
chip are not as widely diversified as those on the
human chip; or may simply reflect that the mouse data-
set scaled differently to the human dataset during
normalization.
How the data were normalized before they were
merged into a combined matrix has profound impact on
the PCA landscape. In all PCA results we presented so
far,thedatawerenormalizedbyprobesetacrossall
samples to minimize the platform differences among
samples; thus, the data are more comparable cross-spe-
cies. If we normalized the human and mouse data
matrices by sample, in the combined matrix, the plat-
form difference is the largest variance captured in the
top principal component (Additional file 3b), separating
mouse samples and human samples into two distinctive
areas (Additional file 6a). Within each species cluster,
the tissue clusters a re still preserved and the relative
order of the tissue clusters is the same in the two spe-
cies (Additional file 6b), reflecting the global gene
expression resemblance of the two species.
The similarity between the human and mouse tissue
clusters observed on PCA plots is also observed after
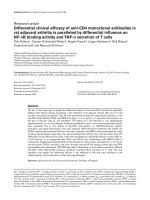
hierarchical clustering of sample groups. A Pearson corre-
lation coeffici ent matrix between 26 categories of tissues
(13 for human and the same 13 for mouse) was hierarchi-
cally clustered (see Materials and methods for details). For
liver, muscle/heart, nervous system, cell lines, adipocyte
tissues, immune system, skin and gastrointesti nal organs,
human and mouse data clustered side by side on both X
and Y axis (Figure 3). Within such tissue clusters of
human and mouse, while the same tissue of the same spe-
cies displays the highest correlation of gene expression
levels, the same tissue of different species often has a
higher correlation of gene expression levels than back-
ground away from the diagonal. Such cross-specifies cor-
relation is seen in a similar heatmap with a more detailed
tissue annotation (Additional file 7).
Identification of expression correlation between
orthologous genes of different species
Cross-platform comparison of gene expression data is
always a challenge. Even for the same tissue type,
human and mouse samples differ in many ways; thus,
it is difficult to take a pair of orthologous genes
between the two species and compare their expression
levels directly. A condition that induces or suppresses
theexpressionofageneinonespeciesmaynotbe
applicable to another species. To minimize sample and
platform variations, we used a measurement called cor-
relation of correlation coefficient or corCor [28]. It
compares transcriptome-wide correlation in two
groups of corresponding probesets by calculating the
vector of correlation coefficients for one probeset to
all other probesets in each of the tw o groups sepa-
rately, then calculating the correlation coefficient
between these two vectors. In our study, the mouse
data matrix of 1,267 samples and 6,180 probesets and
the human data matrix of 2,557 samples and 6,180
probesets were compared by calculating corCor for
every probeset (see Materials and methods). As a nega-
tive control, the expression values in the mouse and
human data matri ces were randomized and the corCor
for each probeset was calculated between mouse and
human.
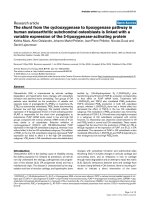
The distribution of corCor for all 6,180 probesets
shows that orthologous genes have high corCor com-
pared to a negative control (Figure 4a,b): in the test
group, 599 genes had corCor >0.1; in the negative con-
trol no gene had corCor >0.05, suggesting, w hen we
look at the data globally taking all tissue types in consid-
eration, a fraction of human and mouse orthologs a re
exp ressed in a correlated way. The corCor quantity was
also calculated in a positive control comparing 233
human muscle and heart samples with 411 human ner-
vous system samples (Figure 4c). As can be assumed,
human genes in different human samples exhibit higher
between-group correlations than human genes and
mouse orthologous genes.
In contrast to what we observed in Figure 4b, when
corCor was measured between mouse and human sam-
ples within specific tissues, corCor distributions are not
strongly deviating from the negative control (Additional
Zheng-Bradley et al. Genome Biology 2010, 11:R124
/>Page 5 of 11
file 8). We believe when samples are of a single tissue
type and relatively homogenous, the platform effects
and laboratory effects become more dominant and can
mask the tissue-specific global expression patterns
observed in a nalyses using much larger and heteroge-
neous datasets.
Since corCor is not suitable to identify correlating
human and mouse genes at the tissue level, an alterna-
tive approach was attempted to identify orthologous
genes that are expressed in a correlated fashion in the
two species. The expression variance of every gene was
calculated one tissue and one specie s at a time. For
each tissue type, the genes are sorted based on their
variance. When comparing the sorted gene lists for a
human tissue and its corresponding mouse tissue, we
observed that, on average, 42% of the most variable
600 genes in one species have ortholog counterparts in
the most variable 600 genes in the other species
(Figure 5; Additional file 9). For the 600 least variable
genes, this fig ure is 27%. This enrichment of orthologs
in highly and lowly variable genes is present in all four
tissue types that have segregating clusters in the PCA
analysis - liver, nervous system, muscle/heart, and cell
lines, as well as in the set of all samples combined and
Liver
Heart + muscle
Cell line
Immune system
Brain + nerve
Skin, gastrointestinal organs
Adipocyte
Figure 3 Hierarchical clustering heatmap of Pearson correlation coefficients between major tissue types of human and mouse.The
outlined boxes indicate tissues in which human and mouse data clustered together.
Zheng-Bradley et al. Genome Biology 2010, 11:R124
/>Page 6 of 11
analyzed together. As a negative control, the data were
randomized by shuffling the expression values in the
data matrices and the percentage of overlapping ortho-
log pairs is, on average, 10% for all tissues and all var-
iance windows we tested. It is clear that a human
tissue and its corresponding mouse tissue share
through orthology a good fraction of the most variable
genes (tissue-specific genes) and the most constant
genes (housekeeping genes); the level of sharing is as
strong as the level of human genes co-vary between
(a) (b) (c)
corCor corCor corCor
Figure 4 Distribution of corCor between human and mouse ortholog genes. X-axis is corCor value; Y-axis is number of orthologs.
(a) Randomized negative control. (b) corCor between human genes and their mouse orthologs in all samples. (c) Positive control with corCor
between human genes measured in nervous system and human genes measured in muscle/heart. Please note that the values on the X-axis in
(b,c) are a magnitude higher than those in (a).
50
40
45
30
35
age
Li
15
20
25
Percen t
Li
ver
Heart+Muscle
Nerve
Cell lines
All
5
10
15
All
0
Windows of genes sorted by expression variance
Figure 5 Percent age of sha red mouse and human orthologs in windows of 600 genes sorted by expression variance (descending
from left to right).
Zheng-Bradley et al. Genome Biology 2010, 11:R124
/>Page 7 of 11
two different human tissues, which is also around 40%
for the top 10% most variable genes (Additional file 9).
Data used for this analysis can be found o n our web
site [27].
A simple binary test done by Chan et al. [6] also identi-
fied close to 400 1-1-1-1-1 orthologous genes across
vertebrate clades that display conserved expressi on in at
least one of ten tissues they tested at the most stringent
threshold. To see how many genes the two studies iden-
tified as those with evolutionarily conserved expression
profile overlap, we created two lists: a list of 273 ortho-
logs we identified as ex pressed in the nervous system of
both human and mouse with top10% variance, and a list
of 110 genes that are expressed in the nervous system of
all 5 species tested by Chan et al. at the highest thresh-
old (top 1/6). We identified 13 overlap genes betw een
the two lists. Our study used 6,108 orthologs, whereas
Chan’s study used 3,074, with an overlap of 1,344 genes.
Of the 273 genes we identified, 51 are in the 1,344-gene
set, and of the 110 genes Chan et al. identified, 79 are
in the same 1,344-gene set. A simple hypergeometric
probability test shows that the chance of having 13 over-
laps between 51 and 79 genes randomly taken from a
common pool of 1,344 genes is low (P =2.9×10
-6
),
suggesting the overlap of the results from the two stu-
dies is significant. The same comparison was also don e
in heart/muscle and liver; similar overlaps with more
significant P-values were observed between the two
methods, showing significant overlap between gene sets
identified by the two studies (Table 2).
The functions of the enriched human mouse orthologs
were examined by studying Gene Ontology (GO) term
over-representation i n the gene list using ONTO-
EXPRESS [29]. ONT O-EXPRESS uses the ontology tree
and calculates statistical significance for each biological
process as P-values. We found that the most variable
genes shared by human and mouse tend to be genes
with tissue-specific functions. For instance, for nervous
system samples, the shared gene list contains genes
involved in nervous system development and synaptic
transmission (Additional file 10a). For muscle and heart
samples, the over-represented GO terms in the most
variable genes are muscle development, regulation of
striated muscle contraction, ventricular cardiac muscle
morphogenesis, cardiac muscle contraction, muscle fila-
ment sliding, and actin filament-based movement (Addi-
tional file 10b). For liver samples, liver-specific GO
terms such as oxidation-reduction, lipid metabolic pro-
cess, response to mercury ion, and cholesterol homeos-
tatasis are enriched (Additional file 10c). This leads to
the conclusion that genes with evolutionarily conserved
expression patterns across species are mostly the ones
performing highly tissue-specific functions and are
expressed in specific tissues with limited cell types. This
expl ains the observation made by others [6] and us that
tissues with relatively homogenous composition of cell
types, such as heart/muscle, liver, and nervous system,
would be segregated when profiling large-scale gene
expression data. On the other hand, the shar ed ortho-
logs among the least variable genes tend to be house-
keeping genes, such as genes controlling transcription,
apoptosis, cell adhesion, cell differentiation and protein
amino acid phosphorylation (Additional file 10d). Not
surprisingly, the housekeepin g genes are also expressed
in a similar manner across species.
Conclusions
With large amounts of gene expression data obtained
from public repositories, we i nvestigated the transcrip-
tomes of human and mouse across a large variety of
experimental conditions. Where single experiments ben-
efit from reducing experimental variability to discover
gene-specific expression regulation, by instead selecting
as wide a variety of experim ental and sample conditions
as possible, we can gain insights into regulation at a
higher level of complexity. When analyzing samples
from a large variety of tissues, such large-scale studies
revealed that the patterns of global gene expression are
strong enough to segregate samples based on key biolo-
gical properties, despite vast variations in experiment
conditions, genetic background, age, sex and other sam-
ple characteristics. The results confirmed the common
belief that samples of similar tissue types share similari-
ties at the transcriptome level. At the same time, the
patterns of this segregation, as detected by PCA, are
similar between mouse and human and indicate that, on
Table 2 Comparison of the lists of genes that display the evolutionarily conserved expression patterns in different
tissues as identified by us and by Chan and colleagues [6]
Tissue Study Conserved probesets Conserved genes Conserved genes in the common list Overlaps P-value
Heart/muscle This study 259 260 49 17 1.8 × 10
-8
Chan et al. [6] NA 141 101
Liver This study 233 244 40 13 2.3 × 10
-7
Chan et al. [6] NA 106 83
Nervous system This study 269 273 51 13 2.9 × 10
-6
Chan et al. [6] NA 110 79
Zheng-Bradley et al. Genome Biology 2010, 11:R124
/>Page 8 of 11
a global level, the signals driving tissue specificity are
similar between the species. It supports previous f ind-
ings [6-9] that although mechanisms of individual gene
regulation may be different between the species, global
functional patterns are similar and identifiable with
whole transcriptome analysis. In particular, like in our
study, Chan and colleagues [6] observed in a cross-spe-
cies comparison of five different vertebrates ranging
from human to pufferfish that the expression profiles of
orthologous genes across the five species in related tis-
sues of different species were conserved; among other
tissues, they also identified heart/muscle, central nervous
system and li ver as tissues with evolutionarily conserved
gene expression profiles [6].
Our results provide strong evidence that, on a global
level, gene expression patterns of human-mouse ortho-
logs are c onserved. The cross-species conservation of
expression profiles of tissue-specific genes and house-
keeping genes is the foundation for the similar land-
scapes of sample clustering between human and mouse
in large-scale transcriptome comparison. A recent publi-
cation [30] documents that approximately half of mea-
sured subnetworks of transcription factors are conserved
between human and mouse; this may at least partially
explain the conservation of global gene expression pat-
terns we observed in this study.
Materials and methods
Creating an integrated mouse gene expression dataset
We identified 2,290 CEL files genera ted on Affymetrix
chip MG_U74Av2 from ArrayExpress; these are all from
publicly available experiment s deposited to ArrayExpress
before May 2008. The quality of the CEL files was evalu-
ated individually using the R simpleaffy package and four
quality control measurements were produced: average
background (AvgBg), scale factors (sfs), percent present
(PP) and RNA degrad ation slope (RNAdeg). Arrays were
selected for inclusion in this study based on these quanti-
ties using the following ranges: AvgBg, 20 to 150; PP, 25
to 65; RNAdeg, <1.7; sfs, 0.1 to 2.5 (suggested by [31]).
In addition to the simpleaffy assessments, the CEL files
selected were further evaluated by probe level model
(PLM) using the Bioconductor’s affyPLM package. Two
quality assessments were derived from the PLM fitting
output: normalized unscaled standard error (nuse) and
relative log expression (rle). The cutoffs were set as: nuse,
0.97 to 1.05; rle, -0.15 to 0.15. Arrays not passing these
criteria were discarded from further analysis.
The resulting 1,323 C EL files were pre-processed
using Bioconductor’s RMA package [32] to create an
integrated, normalized data matrix. Annotations for
each sample were retrieved from the database and
manually curated to ensure uniform representation and
minimal redundancy. For instance, when in some
experiments samples were originally annotated as ‘hepa-
tocyte samples’ , we would change the annotation to
‘liver’ for consistency. The annotations of the 1,323 sam-
ples were generalized so the whole dataset contains a
limited number of unique categories of tissue type anno-
tation, such as nervous system, reproductive system,
immune system and so on. The integrated dataset was
submitted t o ArrayExpress and assigned accession
[E-MTAB-27].
Merging human and mouse gene expression datasets
The high quality CEL files of 5,372 human samples
tested on the HG-U133A microarray were selected an d
prepared as previously described [25]. The high quality
CEL files for mouse samples were selected as described
above. The data were normalized separately for human
and mouse in R using the justRMA function. In the
resulting matrices, each column contains data for one
sample and each row data for one probeset. The two
matrices were then reduced to a subset of probesets
representing orthologous genes between mouse and
human. The pairing of these orthologous probesets was
done based on gene orthologs obtained from Ensembl
Compara [33]. Since the probe effect is well known to
be very significant in all microarray analyses, we chose
to identify orthologous probesets by maximizing the
number of probes with similar sequences as follows. For
each orthologous gene pair, data for all probesets and
their associat ed probes and probe sequences were
retrieved from Affymetrix. Probes for each human gene
were BLASTed against mouse probes of the correspond-
ing ortholo gous gene using bl2seq, and the best one-to-
one match was retained. Default settings were used with
bl2seqexcept-W7,-G5,-E2,-F=F.Thehuman-
mouse probeset pair with the most probe-probe top
matches was selected to represent the ortholog pair on
the probeset level.
After we discarded rows with non-or thologous probe-
sets from the human and mouse matrices, the remaining
data on each matrix were normalized either by probeset
or by sample. To normalize by probeset, we first cen-
tered data row by row on median z ero by subtracting
the row median from each value in the row. Then the
centered values were divided by median absolute devia-
tion to scale the data. To normalize by sample, we used
the same procedure but centered and scaled the data by
columns instead of by rows; column median was used
to center the data and column median absolute devia-
tion was used to scale the data. After normalization
either by probeset or by sample, the two data matrices
of centered and scaled values were merged into one
matrix by concatenating the sample columns of ortholo-
gous probesets. In the merged matrix, the rows are pro-
besets and the columns are human and mouse samples.
Zheng-Bradley et al. Genome Biology 2010, 11:R124
/>Page 9 of 11
Principal component analysis
PCA is a technique that transforms a dataset onto a lin-
ear space spanned by a number of orthogonal compo-
nents, ordered by decreasing variance of the data when
projected on it. The technique facilitates dimensionality
reduction and noise filtering by the projection of data
onto a number of the principal components, maximizing
the variance retained. The function prcomp with default
settings provided in the R statistic package was used to
perform PCA on different data matrices throughout this
study. The results were visualized by scatter plots.
Hierarchical clustering
The combined data matrix of 2,557 human samples and
1,267 mouse samples created as described above was
used for hierarchical clustering. The matrix contains
gene expression values centered and scaled by probeset.
Each sample in the matrix is assigned to one of 13 gen-
eral tissue cat egories that are well represented in both
species so the total number of annotation types is 26
(tissue combining species). We extracted 26 submatrices
containing data from samples of 26 different annotatio n
types; Pearson correlation coefficients were calculated
for 26 × 26 permutations of the submatrices; for eac h
pair of submatrices, a mean correlation coefficient was
taken and p laced in a 26 × 26 matrix. Hierarchical clus-
tering of the samples in the matrix was performed by R
function heatmap.2.
Calculation of corCor
For a gene A on the human array composed of n
genes, we computed its pair wise Spearman correlation
coefficient with every gene on the same chip, giving a
vector v(A) of length n - 1. Given gene A’ is the ortho-
logofgeneAonthemousearray,wesimilarlycom-
puted its pair wise correlation coefficient with every
mousegeneasv(A’ ) of length n - 1. The correlation
coefficient between v(A) and v(A’), corCor, provides an
indication of whether A and A’ are correlated in
mouse and human on the transcriptome level, regard-
less of the vast sample variations. The higher the abso-
lute corCor value, the stronger correlation of the
orthologous genes is; negative corCor indicates nega-
tive correlation. The R package MergeMaid was used
forthisanalysis[34].
Additional material
Additional file 1: PCA plot of the integrated mouse gene expression
data matrix. The two axes are components 2 and 3; each dot represents
a sample, colored by experiment accession number. While experiments
with more than 15 samples are labeled as individual experiments,
experiments with smaller numbers of samples are grouped into one
category, ‘small exp’ (light brown). Tissue clusters observed in Figure 1
are circled. No apparent clustering of samples based on experiments is
observed.
Additional file 2: Experiments and samples used for the mouse
PCA.
Additional file 3: Distribution of gene expression variances for the
top 50 principal components. The histograms were plotted for PCA
results of the combined human mouse data matrix normalized by
(a) probeset or (b) sample.
Additional file 4: PCA plot of a combined human and mouse gene
expression data matrix (principal components 1 and 2). The samples
are labeled by (a) species and (b) tissue type. Four major sample clusters
are indicated: muscle/heart samples (red), nervous system samples (blue),
liver samples (purple) and cell line samples (green). For these clusters,
human and mouse samples exhibit subclustering in proximity to each
other.
Additional file 5: PCA plots of a combined human and mouse gene
expression data matrix with all samples. The samples are labeled by
(a) species and (b) tissue type. Unlike previous PCA plots, samples such
as mammary gland and hematopoietic system whose presentation is
mostly one-sided in one species were removed from the analysis; this
PCA included all high quality data from both human and mouse. The
clustering of samples from nervous system (green), muscle/heart (lilac),
cell lines (brown), and liver (pink) is still evident among the
overwhelmingly dominant hematopoietic samples (blue) and mammary
gland samples (turquoise). The corresponding human and mouse sample
clusters resemble each other. Samples of unknown tissue type
annotation are colored white and labeled as ‘0’.
Additional file 6: PCA plots of a combined human and mouse gene
expression data matrix normalized by sample. The samples are
labeled by (a) species and (b) tissue type. Mouse samples (black) and
human samples (red) are well separated on the axis of component 1.
Tissue clusters in the two species are projected to the second principal
component in a similar order: nervous system (blue), muscle/heart (red),
liver (purple) and cell lines (green).
Additional file 7: Hierarchical clustering heatmap of Pearson
correlation coefficients between different types of tissues in human
and mouse. Tissues in which human and mouse data clustered together
are outlined by boxes.
Additional file 8: Distribution of corCor between human and mouse
ortholog genes in specific tissues. The X-axis is the corCor value
between human and mouse gene expression levels in (a) nervous
system and (b) cell line samples. The Y-axis is the number of orthologs.
In these analyses, corCor distribution is not very different from a
randomized negative control (Figure 4a).
Additional file 9: Percentage of common genes in the top 10%
most variable genes between different tissues of the same species,
as well as between different tissues of human and mouse.
The numbers in bold are those represented in the top 10% group in
Figure 5.
Additional file 10: Functional analysis of orthologous genes shared
between mouse and human in the top 10% most variable genes
and the top 10% least variable genes. (a-c) The top 10% most
variable genes and (d) the top 10% least variable genes: (a,d) nervous
system; (b) muscle/heart; (c) liver. In (a-c), GO over-representation was
sorted by corrected P-val ue and then by level of GO term enrichment;
only the top ten categories are displayed. Genes with tissue-specific
functions are colored in orange. The over-represented GO terms in
(d) were sorted by count of genes in each category; the top categories
are mostly housekeeping molecular functions.
Abbreviations
corCor: correlation of correlation coefficient; GO: Gene Ontology; PCA:
principal component analysis ; PLM: probe level model.
Zheng-Bradley et al. Genome Biology 2010, 11:R124
/>Page 10 of 11
Acknowledgements
The study is funded by the MUGEN consortium (grant LSHG-CT-2005-
005203) and the ENGAGE consortium (grant HEALTH-F4-2007-201413 from
the European Commission FP7 program). We thank Margus Lukk for sharing
his experience in analyzing large-scale expression data, and Wolfgang Huber,
Richard Bourgon, Misha Kapushesky, Nils Gehlenborg, and Angel a Goncalves
for discussions and technical help.
Authors’ contributions
XZ designed and carried out all analyses and wrote the manuscript. JR
participated in the design and interpretation of the study and contributed
to manuscript writing. HP participated in the design and coordination of the
study. AB conceived the study and participated in its design and helped to
draft the manuscript. All authors read and approved the final manuscript.
Authors’ information
AB is a senior team leader and senior scientist at EMBL-EBI and serves on
the board of FGED (Functional Genomics Data) Society.
Competing interests
The authors declare that they have no competing interests.
Received: 10 September 2010 Revised: 3 December 2010
Accepted: 23 December 2010 Published: 23 December 2010
References
1. Yanai I, Graur D, Ophir R: Incongruent expression profiles between
human and mouse orthologous genes suggest widespread neutral
evolution of transcription control. Omics 2004, 8:15-24.
2. Jordan IK, Marino-Ramirez L, Koonin EV: Evolutionary significance of gene
expression divergence. Gene 2005, 345:119-126.
3. Han ES, Hickey M: Microarray evaluation of dietary restriction. J Nutr 2005,
135:1343-1346.
4. Su AI, Wiltshire T, Batalov S, Lapp H, Ching KA, Block D, Zhang J, Soden R,
Hayakawa M, Kreiman G, Cooke MP, Walker JR, Hogenesch JB: A gene atlas
of the mouse and human protein-encoding transcriptomes. Proc Natl
Acad Sci USA 2004, 101:6062-6067.
5. Rustici G, Mata J, Kivinen K, Lio P, Penkett CJ, Burns G, Hayles J, Brazma A,
Nurse P, Bahler J: Periodic gene expression program of the fission yeast
cell cycle. Nat Genet 2004, 36:809-817.
6. Chan ET, Quon GT, Chua G, Babak T, Trochesset M, Zirngibl RA, Aubin J,
Ratcliffe MJ, Wilde A, Brudno M, Morris QD, Hughes TR: Conservation of
core gene expression in vertebrate tissues. J Biol 2009, 8:33.
7. Xing Y, Ouyang ZQ, Kapur K, Scott MP, Wong WH: Assessing the
conservation of mammalian gene expression using high-density exon
arrays. Mol Biol Evol 2007, 24:1283-1285.
8. Liao BY, Zhang JZ: Low rates of expression profile divergence in highly
expressed genes and tissue-specific genes during mammalian evolution.
Mol Biol Evol 2006, 23:1119-1128.
9. Liao BY, Zhang JZ: Evolutionary conservation of expression profiles
between human and mouse orthologous genes. Mol Biol Evol 2006,
23:530-540.
10. Odom DT, Dowell RD, Jacobsen ES, Gordon W, Danford TW, MacIsaac KD,
Rolfe PA, Conboy CM, Gifford DK, Fraenkel E: Tissue-specific transcriptional
regulation has diverged significantly between human and mouse. Nat
Genet 2007, 39:730-732.
11. Lu Y, Huggins P, Bar-Joseph Z: Cross species analysis of microarray
expression data. Bioinformatics 2009, 25:1476-1483.
12. Whiteford CC, Bilke S, Greer BT, Chen QR, Braunschweig TA, Cenacchi N,
Wei JS, Smith MA, Houghton P, Morton C, Reynolds CP, Lock R, Gorlick R,
Khanna C, Thiele CJ, Takikita M, Catchpoole D, Hewitt SM, Khan J:
Credentialing preclinical pediatric xenograft models using gene
expression and tissue microarray analysis. Cancer Res 2007, 67:32-40.
13. Nuzhdin SV, Wayne ML, Harmon KL, McIntyre LM: Common pattern of
evolution of gene expression level and protein sequence in Drosophila.
Mol Biol Evol 2004, 21:1308-1317.
14. Vallee M, Robert C, Methot S, Palin MF, Sirard MA:
Cross-species
hybridizations on a multi-species cDNA microarray to identify
evolutionarily conserved genes expressed in oocytes. BMC Genomics
2006, 7:113.
15. Oshlack A, Chabot AE, Smyth GK, Gilad Y: Using DNA microarrays to study
gene expression in closely related species. Bioinformatics 2007,
23:1235-1242.
16. Bergmann S, Ihmels J, Barkai N: Similarities and differences in genome-
wide expression data of six organisms. PLoS Biol 2004, 2:E9.
17. Stuart JM, Segal E, Koller D, Kim SK: A gene-coexpression network for
global discovery of conserved genetic modules. Science 2003,
302:249-255.
18. Subramanian A, Tamayo P, Mootha VK, Mukherjee S, Ebert BL, Gillette MA,
Paulovich A, Pomeroy SL, Golub TR, Lander ES, Mesirov JP: Gene set
enrichment analysis: a knowledge-based approach for interpreting
genome-wide expression profiles. Proc Natl Acad Sci USA 2005,
102:15545-15550.
19. Alter O, Brown PO, Botstein D: Generalized singular value decomposition
for comparative analysis of genome-scale expression data sets of two
different organisms. Proc Natl Acad Sci USA 2003, 100:3351-3356.
20. Lu Y, Rosenfeld R, Bar-Joseph Z: Identifying cycling genes by combining
sequence homology and expression data. Bioinformatics 2006, 22:
e314-322.
21. Lu Y, Mahony S, Benos PV, Rosenfeld R, Simon I, Breeden LL, Bar-Joseph Z:
Combined analysis reveals a core set of cycling genes. Genome Biol 2007,
8:R146.
22. Ringner M: What is principal component analysis? Nat Biotechnol 2008,
26:303-304.
23. Alter O, Brown PO, Botstein D: Singular value decomposition for genome-
wide expression data processing and modeling. Proc Natl Acad Sci USA
2000, 97:10101-10106.
24. Khan J, Wei JS, Ringner M, Saal LH, Ladanyi M, Westermann F, Berthold F,
Schwab M, Antonescu CR, Peterson C, Meltzer PS: Classification and
diagnostic prediction of cancers using gene expression profiling and
artificial neural networks. Nat Med 2001, 7:673-679.
25. Lukk M, Kapushesky M, Nikkila J, Parkinson H, Goncalves A, Huber W,
Ukkonen E, Brazma A: A global map of human gene expression. Nat
Biotechnol 2010, 28:322-324.
26. ArrayExpress Archive. [ />27. Large scale comparison of global gene expression patterns in human
and mouse, supplementary data. [ />Genome_Biology_Paper/].
28. The Integrative Correlation Coefficient: a Measure of Cross-study
Reproducibility for Gene Expressionea Array Data. [ress.
com/jhubiostat/paper152].
29. Draghici S, Khatri P, Martins RP, Ostermeier GC, Krawetz SA: Global
functional profiling of gene expression. Genomics 2003, 81:98-104.
30. Ravasi T, Suzuki H, Cannistraci CV, Katayama S, Bajic VB, Tan K, Akalin A,
Schmeier S, Kanamori-Katayama M, Bertin N, Carninci P, Daub CO,
Forrest AR, Gough J, Grimmond S, Han JH, Hashimoto T, Hide W,
Hofmann O, Kamburov A, Kaur M, Kawaji H, Kubosaki A, Lassmann T, van
Nimwegen E, MacPherson CR, Ogawa C, Radovanovic A, Schwartz A,
Teasdale RD, et al: An atlas of combinatorial transcriptional regulation in
mouse and man. Cell 2010, 140:744-752.
31. Bolstad BM, Collin F, Brettschneider J, Simpson K, Cope L, Irizarry RA,
Speed TP: Quality assessment of Affymetrix GeneChip data in
bioinformatics and computational biology solutions using R and
Bioconductor. In Bioinformatics and Computational Biology Solutions Using R
and Bioconductor. Edited by: Gentleman R, Carey V, Huber W, Irizarry R,
Dudoit S. Springer; 2005:33-49.
32. Irizarry RA, Hobbs B, Collin F, Beazer-Barclay YD, Antonellis KJ, Scherf U,
Speed TP: Exploration, normalization, and summaries of high density
oligonucleotide array probe level data. Biostatistics 2003, 4:249-264.
33. Vilella AJ, Severin J, Ureta-Vidal A, Heng L, Durbin R, Birney E:
EnsemblCompara GeneTrees: Complete, duplication-aware phylogenetic
trees in vertebrates. Genome Res 2009, 19:327-335.
34. Cope L, Zhong X, Garrett E, Parmigiani G: MergeMaid: R tools for merging
and cross-study validation of gene expression data. Stat Appl Genet Mol
Biol 2004, 3:Article29.
doi:10.1186/gb-2010-11-12-r124
Cite this article as: Zheng-Bradley et al.: Large scale comparison of
global gene expression patterns in human and mouse. Genome Biology
2010 11:R124.
Zheng-Bradley et al. Genome Biology 2010, 11:R124
/>Page 11 of 11