Báo cáo y học: " Identification of fusion genes in breast cancer by paired-end RNA-sequencing" potx
Bạn đang xem bản rút gọn của tài liệu. Xem và tải ngay bản đầy đủ của tài liệu tại đây (1.91 MB, 13 trang )
RESEARCH Open Access
Identification of fusion genes in breast cancer by
paired-end RNA-sequencing
Henrik Edgren
1†
, Astrid Murumagi
1†
, Sara Kangaspeska
1†
, Daniel Nicorici
1
, Vesa Hongisto
2
, Kristine Kleivi
2,3
,
Inga H Rye
3
, Sandra Nyberg
2
, Maija Wolf
1
, Anne-Lise Borresen-Dale
1,4
, Olli Kallioniemi
1*
Abstract
Background: Until recently, chromosomal translocations and fusion genes have been an underappreciated class of
mutations in solid tumors. Next-generation sequencing technologies provide an opportunity for systematic
characterization of cancer cell transcriptomes, including the disc overy of expressed fusion genes resulting from
underlying genomic rearrangements.
Results: We applied paired-end RNA-seq to identify 24 novel and 3 previously known fusion genes in breast
cancer cells. Supported by an improved bioinformatic approach, we had a 95% success rate of validating gene
fusions initially detected by RNA-seq. Fusion partner genes were found to contribute promoters (5’ UTR), coding
sequences and 3’ UTRs. Most fusion genes were associated with copy number transitions and were particularly
common in high-level DNA amplifications. This suggests that fusion events may contribute to the selective
advantage provided by DNA amplifications and deletions. Some of the fusion partner genes, such as GSDMB in the
TATDN1-GSDMB fusion and IKZF3 in the VAPB-IKZF3 fusion, were only detected as a fusion transcript, indicating
activation of a dormant gene by the fusion event. A number of fusion gene partners have either been previously
observed in oncogenic gene fusions, mostly in leukemias, or otherwise reported to be oncogenic. RNA
interference-mediated knock-down of the VAPB-IKZF3 fusion gene indicated that it may be necessary for cancer cell
growth and survival.
Conclusions: In summary, using RNA-sequencing and improved bioinformatic stratification, we have discovered a
number of novel fusion genes in breast cancer, and identified VAPB-IKZF3 as a potential fusion gene with
importance for the growth and survival of breast cancer cells.
Background
Gene fusions are a well-known mechanism for oncogene
activation in leukemias, lymphomas and sarcomas, with
the BCR-ABL fusion gene in chronic myeloid leukemia
as the protot ype example [1,2]. The recent identificat ion
of recurrent ETS-family translocations in prostate cancer
[3] and EML4-ALK in lung cancer [4] now suggests that
fusion genes may play an important role also in the
development of epithelial cancers. The reason why they
were not previously detected was the lack of suitable
techniques to identify balanced recurrent chromosomal
aberrations in the often chaotic karyotypic profiles of
solid tumors.
Massively parallel RNA-sequencing (RNA-seq) using
next-generation sequencing instruments allows identifi-
cation of gene fusions in individual cancer samples and
facilitates comprehensive characterization of cellular
transcriptomes [5-11]. Sp ecifically, the new sequencing
technologies enable the discovery of chimeric RNA
molecules, where the same RNA molecule consists of
sequences derived from two physically separated loci.
Paired-end RNA-seq, where 36 to 100 bp are sequenced
from both ends of 200 to 500 bp long DNA molecules,
is especially suitable for identification o f such chimeric
mRNA transcripts. Whole-genome DNA-sequencing
(DNA-seq) can also be used to identify potential fusion-
gene-creating rearrangements. However, only a fraction
of gene fusions predicted based on DNA-seq is expected
* Correspondence:
† Contributed equally
1
Institute for Molecular Medicine Finland (FIMM), Tukholmankatu 8, Helsinki,
00290, Finland
Full list of author information is available at the end of the article
Edgren et al . Genome Biology 2011, 12:R6
/>© 2011 Edgren et al.; licensee BioMed Central Ltd. This is an open access article distributed under the terms of the Creative Commons
Attribution License (http://creativecom mons.org/licenses/by/2.0), which permits unrestricted use, distribu tion, and reproduction in
any medium, provided the original work is properly cited.
to generate an expressed fusion mRNA, making this
approach tedious to discover activated, oncogenic fusion
gene events. In contrast, RNA-seq directly identifies
only those fusion genes that are expressed, providing an
efficient tool to identify candidate oncogenic fusions.
In breast cancer, recurrent gene fusions have only
been identified in rare subtypes, such as ETV6-NTRK3
in secretory breast carcinoma [12] and MYB-NFIB in
adenoid cystic carcinoma of the breast [13]. Here, we
demo nstrate the effectiveness of paired-e nd RNA- seq in
the comprehensive detection of fusion genes. Combined
with a novel bioinformatic strategy, which allowed >95%
confirmation rate of the identified fusion events, we
identify several novel fusion genes in breast cancer from
as little as a single lane of sequencing on an Illumina
GA2x instrument. We validate the fusion events and
demonstrate their potential biological significance by
RT-PCR, fluorescence in situ hybridization (FISH) and
RNA interference (RNAi), thereby highlighting the
importance of gene fusions in breast cancer.
Results
Criteria for identification of fusion gene candidates
To detect fusion genes in breast cancer, we performed
paired-end RNA-seq using cDNA prepared from four
well-characterized cell line models, as well as normal
breast, which was used as a control. Between 2 and 14
million filtered short read pairs were obtained per sam-
ple for each lane of an Illumina Genome Analyzer II
flow cell (Additional file 1). We discarded all fusion can-
didates consisting of two overlapping or adjacent genes
as likely instances of transcriptional readthrough, even if
this may miss gene fusions occurring between adjacent
genes - for example, as a result of tandem duplications
or inversions [14]. Candidate fusion events between
paralogous genes were excluded as likely mapping
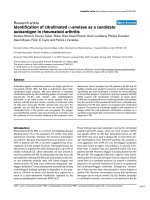
errors. Selecting gene-gene pairs supported by two or
more short read pairs (Figure 1a) provided an initial list
of 303 to 349 fusion candidates per cell line and 152 in
normal breast. Of the initial 83 candidates tested, only
seven (8.5%) were validated by RT-PCR, indicating that
most of them represented false positives. We reasoned
that if the process that gave rise to false positives
involved PCR amplification or misalignment of short
reads, we would expect that the artifactual r eads span-
ning an exon-exon junction all align to the same posi-
tion, whereas for a genuine fusion gene, we would
expect a tiling pattern of short rea d alignment start
positions across the fusion junction (Figure 1b). Examin-
ing the pattern among the initial list of fusion candi-
dates indicated that all s even validated fusion genes
displayed a tiling pattern. In contrast, the fusions we
had been unable to validate had a freque ntly high num-
ber of identically mapping short reads (plus or minus a
single base pair) a ligning to the junction. These short
reads also almost exclusively aligned to one of the
exons. The paired-ends of identical short reads did not
map within one to two bases of each othe r, suggesting
misalignment, not PCR artifacts, is the likely reason for
this phenomenon (data not shown). Utilizing the above-
described criteria, we identified a total of 28 fusion gene
candidates in the four breast cancer cell lines, whereas
none were predicted in the normal breast sample.
Fusion gene validation
Using the improved bioinformatic pipeline described
above, we were able to significantly reduce the number
of false positive observati ons. We validated 27 of 28
SUMF1−LRRFIP2
120406080
PSMD3−ERBB2
120406080
ACACA−STAC2
120406080
IGFBP5−INPPL1
120406080
True positives
False positives
gene X
gene Y
fusion
junction
(a)
(b)
Figure 1 Fusion gene identification by paired-end RNA-
sequencing. (a) Identification of fusion gene candidates through
selection of paired-end reads, the ends of which align to two
different and non-adjacent genes. (b) Identification of the exact
fusion junction by aligning non-mapped short reads against a
computer generated database of all possible exon-exon junctions
between the two partner genes. Separation of true fusions (left)
from false positives (right) by examining the pattern of short read
alignments across exon-exon junctions. Genuine fusion junctions are
characterized by a stacked/ladder-like pattern of short reads across
the fusion point. False positives lack this pattern; instead, all junction
matching short reads align to the exact same position or are shifted
by one to two base pairs. Furthermore, this alignment is mostly to
one of the exons.
Edgren et al . Genome Biology 2011, 12:R6
/>Page 2 of 13
(96%) fusion gene candidates using RT-PCR across the
fusion break points followed by Sanger sequencing in
the four breast cancer cell lines BT-474, KPL-4, MCF-7
and SK-BR-3 (Table 1, Figure 2). Of these, the three
fusions identified in MCF-7 were previously known
(BCAS4-BCAS3, ARFGEF2-SULF 2, RPS6KB1-TMEM49),
whereas all the others were novel. The validation of
NFS1-PREX1 is tentative, as only a short segment of
NFS1 was included in the fusion, complicating PCR pri-
mer design and subsequent sequencing. The fusion
genes were unique to each cell line (Additional file 2).
In order to ascertain whether the observed fusion
mRNAs arise through rearrangements of the genomic
DNA, we performed long-range genomic PCR (Addi-
tional file 3). Interphase FISH was also done to confirm
selected fusions (Table 1, Figure 3b; Additional file 4). A
genomic rearrangement was confirmed for 20 of 24
novel fusion genes. In the remaining cases, the lack of a
PCR product may have been due to the difficulties w ith
long DNA fragments in genomic PCR (Additional file
5), although we cannot exclude the possibility of mRNA
trans-splicing in some of the cases [15].
Association with copy number breakpoints
Integration of RNA-seq wit h array comparative genomic
hybridization (aCGH) data showed that, in 23 of 27
fusion genes, at least one partner gene was locate d at a
copy number transition detected by aCGH, indicating
that most of the fusion genes are not representing
balanced translocations. In the case of 17 fusion genes,
one or both genes were located at the borders of, or
within, high-level amplifications on chromosomes 8, 17
and 20 (Figure 4a; Additi onal file 6). Since not all fus ion
genesintheproximityofampliconswerehighlyampli-
fied, and many were not associated with DNA amplifica-
tions, we consider it likely that the association between
fusion genes and DNA copy number changes is not
markedly confounded by potential amplification-driven
Table 1 Identified and validated fusion gene candidates
Sample 5’ gene 5’
chromosome
3’ gene 3’
chromosome
Number of
paired-end
reads
Number of
junction reads
In
frame
Amplified Genetic
rearrangement
validated
BT-474 ACACA 17 STAC2 17 57 72 Yes Yes Yes
BT-474 RPS6KB1 17 SNF8 17 43 68 Yes Yes Yes
BT-474 VAPB 20 IKZF3 17 41 26 Yes Yes Yes
BT-474 ZMYND8 20 CEP250 20 35 14 No Yes Yes
BT-474 RAB22A 20 MYO9B 19 9 12 No Yes Yes
BT-474 SKA2 17 MYO19 17 8 7 Yes Yes Yes
BT-474 DIDO1 20 KIAA0406 20 8 1 Yes No
BT-474 STARD3 17 DOK5 20 4 6 Yes Yes Yes
BT-474 LAMP1 13 MCF2L 13 5 3 No No Yes
BT-474 GLB1 3 CMTM7 3 6 2 Yes No Yes
BT-474 CPNE1 20 PI3 20 4 2 No Yes Yes
SK-BR-3 TATDN1 8 GSDMB 17 28 447 Yes Yes Yes
SK-BR-3 CSE1L 20 ENSG00000236127 20 10 20 Yes Yes
SK-BR-3 RARA 17 PKIA 8 13 10 Yes Yes Yes
SK-BR-3 ANKHD1 5 PCDH1 5 12 6 Yes No Yes
SK-BR-3 CCDC85C 14 SETD3 14 6 6 Yes No Yes
SK-BR-3
SUMF1 3 LRRFIP2 3
14 5 Yes No
SK-BR-3 WDR67 8 ZNF704 8 3 3 Yes Yes Yes
SK-BR-3 CYTH1 17 EIF3H 8 38 2 Yes Yes Yes
SK-BR-3 DHX35 20 ITCH 20 3 2 Yes No Yes
SK-BR-3 NFS1 20 PREX1 20 5 9 Yes Yes
KPL-4 BSG 19 NFIX 19 22 14 Yes No Yes
KPL-4 PPP1R12A 12 SEPT10 2 2 6 Yes No Yes
KPL-4 NOTCH1 9 NUP214 9 4 6 Yes No Yes
MCF-7 BCAS4 20 BCAS3 17 133 142 Yes Yes Previously reported
MCF-7 ARFGEF2 20 SULF2 20 17 25 Yes Yes Previously reported
MCF-7 RPS6KB1 17 TMEM49 17 2 7 Yes Yes Previously reported
A total of 24 novel fusion genes were identified in BT-474, SK-BR-3 and KPL-4. Three fusion genes detected in MCF-7 have been reported before and served as
positive controls in our study. Two paired-end reads and two fusion junction spanning short reads were required for selecting a fusion candidate for further
validation. In-frame prediction, copy number amplification (at least one of the fusion partner genes) and validation of the genomic rearrangement are indicated.
Lower level copy number gains were excluded.
Edgren et al . Genome Biology 2011, 12:R6
/>Page 3 of 13
overexpressio n [16]. We also observed complex rearran-
gements, where multiple breaks in a narrow genomic
region led to the formation of more than one gene
fusion in the same sample. For instance, altogether six
genes in the ERBB2-amplicons in BT-474 and SK-BR-3
took part in gene fusions (Figure 4b). As seen with the
FISH analysis (Figure 3b; Additional file 4), the fusions
were only seen in two to five copies per cell on average,
indicating that the multiple genomic breakpoints
required for the formation of high-level ampli fications
were probably contributing to the formation of the
fusions as secondary genetic events.
Another important group of gene fusions was associated
with breakpoints of low- level copy number changes,
involving both gains and deletions. These are interesting
in the sense that they represent the types of fusion
events leading to gene activation with no association
with gene amplifications. For example, this is the case
for TMPRSS2-ERG and many leukemia-associated trans-
locations [17]. Eight out of 27 fusion genes (BSG-NFIX,
CCDC85C-SETD3, DHX35-ITCH, CMTM7-GLB1,
LAMP 1-MCF2L, NOTCH1-NUP214, PPP1R12A-SEPT10
and SUMF1-LRRFIP2) identified here were not asso-
ciated with high-level gene amplifications, but typically
had one of the fusion partners associated with a low-
level copy number breakpoint, mostly gains or deletions.
Interestingly, only the fusion gene PPP1R12A-SEPT10 in
KPL-4 was not associated with either copy number tran-
sitions or changes at the location of either of the fusion
counterparts as detected with the 1M probe aCGH.
Structural properties of the novel fusion genes
Several consistent patterns observed for the gene fusions
suggest their potential importance. First, most of the
fusions (23 of 27) were predicted to be in-frame (Table 1),
assuming that the splicing pattern of the rest of the
transcript is retained. Should the reading frame not be
retained across the fusion junction, it would likely lead
to appearance of a pr emature stop codon and the tran-
script would be degraded by nonsense-mediated mRNA
decay. Therefore, it is possible that some of the highly
expressed fusions that were predicted to be out-of-
frame, such as ZMYND8-CEP250, may retain an intact
open reading frame through alternative splicing or
mutations that place the gene back in frame. Second,
we obs erved 19 intra- and 8 interchromo somal translo-
cations (Figure 4a; Additional file 6), which is in line
with the previously observed pattern of intrachromoso-
mal rearrangements occurring more frequently based on
data from genomic sequencing [14]. Several (9 of 27)
fusion partner genes were located on opposite strands,
implying inversion, which in some cases has been fol-
lowed by amplification of the rearranged region (for
example, ZMYND8-CEP250). Third, the rearranged
gene s were occasionally exclusively expressed compared
to their wild type partner genes (for example, CEP250,
IKZF3, GSDMB,andBCAS4; Figure 5). Fourth, discov-
ered fusi ons cont ributed bo th prom oters ( 5’ UTR; for
example, TATDN1-GSDMB), coding sequences (for
example, ACACA-STAC2) as well as 3’ UTRs (for exam-
ple, CSE1L- ENSG00000236127). Fifth, in the vast
majority of the fusions (82%), at least one partner gene
was located at a copy number breakpoint as revealed by
aCGH, indicating that fusion gene formation is closely
associated with unbalanced genomic rea rrangements,
particularly high-level amplifications [14,18]. Sixth, a
number of fusion genes, such as SKA2-MYO19 and
CPNE1-PI3, displayed alternative splicing at the fusion
junction, suggesting fusion junction diversity (Figure 2).
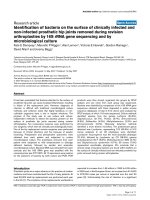
VAPB-IKZF3 fusion is required for the cancer cell
phenotype
In order to gain insight into the functional role of the
novel fusion genes, we performed small interfering RNA
(siRNA) knock-down analysis targeting the parts of the
3’ partner genes that are involved in the fusions. Based
on the screen, the VAPB-IKZF3 fusion gene was selected
for detailed validation. Knock-down of the IKAROS
family zinc finger 3 (IKZF3), which is part of the VAPB-
M
ARFGEF2-SULF2
BCAS4-BCAS3
RPS6KB1-TMEM49
GAPDH
BSG-NFIX
PPP1R12A-SEPT1
0
NOTCH1-NUP214
GAPDH
M
RARA-PKIA
TATDN1-GSDMB
CSE1L-ENSG00000236127
ANKHD1-PCDH1
CCDC85C-SETD3
SUMF1-LRRFIP2
WDR67-ZNF704
CYTH1-EIF3H
DHX35-ITCH
NFS1-PREX1
GAPDH
M
ACACA-STAC2
RPS6KB1-SNF8
VAPB-IKZF3
ZMYND8-CEP250
RAB22A-MYO9B
SKA2-MYO19
STARD3-DOK5
LAMP1-MCF2L
GLB1-CMTM7
CPNE1-PI3
DIDO1-KIAA040
6
GAPDH
dH2
O
dH2O
dH2O
BT
-
474
SK-BR-3
MCF-7 KPL-4
300 bp
2
00 bp
100 bp
M
300 bp
200 bp
100 bp
300 bp
200 bp
100 bp
Figure 2 Experimental validation of identified breast cancer
fusion transcripts. RT-PCR validation of fusions found in MCF-7
and KPL-4 (upper), SK-BR-3 (middle), and BT-474 (lower). Also shown
is the marker and the negative control.
Edgren et al . Genome Biology 2011, 12:R6
/>Page 4 of 13
5
15
0
2
4
VAPB
IKZF
3
(
a
)
control
fusion BT-474
(b)
chr20
chr17
(d)
scramble
IKZF3 siRNA 1
IKZF3 siRNA 2
% knock−d own
0
20
40
60
80
100
VAPB wt
IKZF3 wt
fusion
RPKM
0
50
100
150
200
(c)
scramble
I
KZF3 siRNA 1
IKZF3 siRNA 2
% growth reduction
0
20
40
60
80
100
***
***
(e)
Figure 3 Gen omic structure, validatio n and functional significance of VAPB-IKZF3. (a) Exonic expression of VAPB-IKZF3 is indicated by
sequencing coverage (red). Copy number changes measured by array comparative genomic hybridization (aCGH; black dots) in reference to
normal copy number (horizontal grey line) and fusion break points (vertical grey line) are indicated. Gene structures are shown below the aCGH
data. Arrows below gene structures indicate which strand the genes lie on. Fusion transcript structure is pictured below wild-type (wt) gene
structures. (b) Interphase FISH showing amplification of VAPB and IKZF3 and the VAPB-IKZF3 fusion in BT-474. White arrows indicate gene fusions.
(c) Expression of the 5’ and 3’ partner genes and the fusion gene. RPKM denotes reads per kilobase per million sequenced short reads. (d)
Quantitative RT-PCR validation of small interfering RNA (siRNA) knock-down efficiency of cells transfected either with a scramble siRNA or with
gene-specific siRNAs. Error bars show standard deviation. (e) CTG cell viability analysis of cells transfected either with a scramble siRNA or with
gene-specific siRNAs. Asterisks indicate the statistical significance of growth reduction: ***P < 0.001. Error bars show standard deviation.
Edgren et al . Genome Biology 2011, 12:R6
/>Page 5 of 13
1
2
3
4
5
6
7
8
9
10
11
12
13
14
15
16
18
19
20
21
22
X
ENSG00000236127
TATDN1
GSDMB
ZNF704
WDR67
NFS1
CYTH1
DHX35
PREX1
CSE1L
EIF3H
RARA
ITCH
PKIA
CCDC85C
ANKHD1
LRRFIP2
SUMF1
PCDH1
SETD3
17
(a)
1
2
3
4
5
6
7
8
9
10
11
12
13
14
15
16
18
19
20
21
22
X
KIAA0406
RPS6KB1
ZMYND8
SKA2
STARD3
RAB22A
CEP250
ACACA
MYO19
CPNE1
STAC2
DIDO1
DOK5
IKZF3
VAPB
SNF8
PI3
CMTM7
MYO9B
LAMP1
MCF2L
GLB1
17
BT-474
(n = 11)
SK-BR-3
(n = 10)
−1
0
1
2
3
4
35000000
40000000
45000000
50000000
55000000
5' 3'
SNF8
MYO19
RPS6KB1
STAC2
GSDMB
ACACA
IKZF3
RARA
STARD3
ERBB2
SKA2
chr 17
20q
8q
(b)
Figure 4 Genomic rearrangements in SK-BR-3 and BT-474. (a) Circos plots representing chromosomal translocations in SK-BR-3 (upper right)
and BT-474 (lower left). Chromosomes are drawn to scale around the rim of the circle and data are plotted on these coordinates. Selected
chromosomes involved in the fusion events are shown in higher magnification. Each intrachromosomal (red) and interchromosomal (blue) fusion
is indicated by an arc. Copy number measured by aCGH is plotted in the inner circle where amplifications are shown in red and deletions in
green. N denotes the number of fusion genes per cell line. (b) Fusion gene formation in the ERBB2-amplicon region. Fusion partner genes
within and near the amplicon region are connected with black lines (both partners on chromosome 17), or location of the other partner is
indicated (partner gene on different chromosomes). Smoothed aCGH profiles (log2) for SK-BR-3 (blue) and BT-474 (red) indicate copy number
changes in reference to normal copy number (horizontal grey line). ERBB2, which is not fused (arrow), and chromosomal positions (bottom) are
indicated.
Edgren et al . Genome Biology 2011, 12:R6
/>Page 6 of 13
IKZF3 fusion in BT-474, led to the inhibition of cancer
cell growth. The VAPB-IKZF3 fusion gene is formed
through a t(17;20)(q12;q13) translocation and consists of
the promoter for VAMP (vesicle-asso ciated membrane
protein-associated protein B and C) and the carboxy-
terminal part of IKZF3,whichharborstwoZn-finger
domains. IKZF3 was only detected as a fusion transcript,
indicating activation of a quiescent gene by the fusion
event (Figure 3a-c). Knock-down of VAPB-IKZF3 caused
an 80% decrease in VAPB-IKZF3 expression (Figure 3d)
and led to statistically significant (P < 0.001 for both
siRNAs) cell growth inhibition in the BT-474 cells (Fig-
ure 3e). Two independent siRNAs targeting different
regions of the fusion gene gave rise to the same pheno-
type. Thus, in the absence of detectable wild-type IKZF3
expression, the siRNA phenotype is reflecting the down-
regulation of the fusion transcript (Figure 3d). This sug-
gests that the growth of the BT-474 cells is dependent
on the expression of VAPB-IKZF3.
Discussion
In this study, we describe the identification of 27 fusion
genes from breast cancer samples using paired-end
RNA-seq combined with a novel bioinformatic strategy.
This study therefore significantly increases the number
of validated expressed fusion genes reported in breast
cancer cells so far. This indicates the power of transcrip-
tom ic profiling by next-generation sequencing in that it
can rapidly identify expressed fusion genes directly from
cDN A, with a single lane of seque ncing provid ing suffi-
cient coverage. RNA-seq has been used before for fusion
gene detection in a few solid tumor types [19-21]. How-
ever, in previous studies, fusion gene detection has been
challenging because of the high rate of false positives
[17,22]. Our sequencing procedure, coupled with an effi-
cient bioinformatic pipeline, provides a cost-effective
and highly specific platform for fusion gene detection in
cancer, with a 95% success rate in validating the fusion
transcripts.
mRNA trans-splicing has been reported to occur in
human cells [15]. However, most of the fusion tran-
scripts identified here can be attributed to underlying
genetic alterations. In seven cases studied by FISH, a
genomic fusion event was validated, while thirteen
others were confirmed by genomic PCR, and the three
fusions in MCF-7 cells were previously validated at the
genomic level. The location of one of the fusion part-
ners at a genomic copy number transition in 23 out o f
27casesalsosupportstheconclusionthatgenomic
alterations underlie the fusion transcripts in the vast
majority of cases. This also suggests that the mechanism
contributing to the fusion formation is linked to the
underlying genomic DNA breaks. Fusions were asso-
ciated with both low-level copy number gains and losses
10
20
30
40
0
1
2
3
4
4
9
42
0000
49430000
4
9
44
0000
49450000
4
9
4
60000
49470000
4
9
4
80000
'3'5
BCAS4
coverage
acgh
chr20
5
10
15
20
25
0
1
2
3
4
38065000
38070000
38075000
3' 5'
0
coverage
acgh
chr20
GSDMB
0.2
0.4
0.6
0.8
1
1.2
0
0.5
1
1.5
2
2.5
47950000
47955000
'3'5
coverage
acgh
chr20
ENSG00000236127
1
2
3
4
5
6
−
3
−
1
0
1
3
34050000
34060000
34070000
34080000
34090000
'
3'5
4
4
C
EP250
coverage
acgh
chr20
Figure 5 Exclusiv e expression of the exons of the 3’ partner
genes taking part in the fusions. Exonic expression of CEP250 in
ZMYND8-CEP250 (upper), ENSG00000236127 in CSE1L-
ENSG00000236127 (second from top), GSDMB in TATDN1-GSDMB
(second from bottom) and BCAS4 in BCAS3-BCAS4 (lower) is
indicated by sequencing coverage (red). Copy number changes
measured by aCGH (black dots) in reference to normal copy
number (horizontal grey line) and fusion break points (vertical grey
line) are indicated. Chromosomal positions and transcript structures
are shown below the aCGH data. Transcript structures above and
below chromosome coordinates denote forward and reverse strand,
respectively.
Edgren et al . Genome Biology 2011, 12:R6
/>Page 7 of 13
(9 of 27) as well as with high-level amplifications (17 of
27), especially within and between amplicons at 17q,
20q and 8q. For instance, we identified five different
gene fusion events in which one or both partner genes
are located in the ERBB2-amplicon at 17q12 in the BT-
474 and SK-BR-3 cells (Figure 4b). Previous results have
highlighted the fact that DNA l evel gene fusions often
arise within high-level amplifications [23,24] but that a
majority of them are not expressed [14]. The detailed
characterization of the fusion gene events found here
suggests that this may not always be the case.
The in-frame fusion genes found in the breast cancer
cells included mostly fusions between protein coding
regions (15 of 27) and promoter translocation events (8
of 27). The promoter t ranslocations may fundamentally
change the regulation of the genes, and link different
oncogenic pathways. For example, promoter donating
genes of interest in this regard include RARA and
NOTCH1. Besides these two types of fusion, we also
observed two cases of fusions of protein coding regions
of the 5’ partner primarily to the 3’ UTR of the 3’ gene
(CSE1L-ENSG00000236127 and ANKHD1-PCDH1).
These are predicted to encode trunc ated versions of the
5’ proteins, with a new 3’ UTR that could result in
altered microRNA-mediated regulation of the gene.
Taken together, there are several lines of evidence
from this study suggesting that the fusion genes may be
functionally relevant.First,somefusionswereclearly
expressed higher than either or both of the wild-type
genes, suggesting that the fusion event was linked to the
deregulation and overexpression of the gene, and may
have been selected for. For example, the VAPB-IKZF3
and ZMYND8-CEP250 fus ion genes were expressed at
significantly higher levels than their 3’ partner genes
(Figure 3c, Figure 5).
Second, we identified fusions involving genes taking
part in oncogenic fusions in other cancers. ACACA,
RARA, NOTCH1 and NUP214 are known to form trans-
locations in various types of hematological malignancies
while many other fusion genes involve suspected onco-
genes, such as RPS6KB1 (RPS6KB1-TMEM49 and
RPS6KB1-SNF8) [25], GSDMB (TATDN1-GSDMB) [26]
and MCF2L (LAMP1-MCF2L) [27].
Third, a number of partners in gene f usions we
reported here have previously been observed in other
studies. For example, a NUP214-XKR3 translocation has
been reported in leukemia cell line K562 [21]. CYTH1
was found translocated to EIF3H in our s tudy, while
Stephens et a l. [14] identified the fusion CYTH1-
PRSAP1 in brea st cancer cell line HCC1599. ANKHD1
was in our study translocated to PCDH1,whileBerger
et al. [20] reported its fusion to C5orf32 in a melanoma
short
term culture.
Fourth, the knock-down studies by RNAi provided
evidence of a functional role for VAPB-IKZF3,afusion
gene formed in conjunction with the 20q13 (VAPB) and
the 17q12 a mplicons (IKZF3). The fusion between
VAPB and the hematopoietic transcription factor IKZF3
results in exclusive ‘ectopic’ expression of IKZF3 as a
fusion transcript under the VAPB promoter. The
decreased cell proliferation upon down-regulation of the
VAPB-IKZF3 fusion gene in BT-474 cells suggests that
this gene is necessary for the cancer cell growth and
survival. VAPB has previously been proposed to function
as an oncogene [28] while IKZF3 has been reported to
interact with Bcl-xL, and Ras in T-cells, resulting in the
inhibition of apoptosis [29,30]. IKZF3 is located at the
most common telomeric breakpoint of the ERBB2-
amplicon [31]. Interestingly, our preliminary analysis of
clinical breast cancers shows that IKZF3 is overex-
pressed in a small subset of both HER2-positive as well
as HER2-negative cancers, suggesting its expression may
be elevated independent of ERBB2 amplification [32]
(Additional file 7).
Conclusions
Here, we present a large number of previously unknown
gene fusions in breast cancer cells, whose identification
was facilitated by the development of an improved
bioinformatic procedur e for detecting gene fusions from
RNA-seq data. Our approach resulted in approximately
95% accuracy in classifying true fusion transcripts from
raw RNA-seq data. These data indicate how gene
fusions are much more prevalen t in epithelial cancers
than previously recognized and how they are often asso-
ciated with copy number breakpoints. The refore, some-
times deletions taking place in cancer may not be
selected for due to an inactivation of a tumor suppressor
gene in the region affected, but due to the generation of
fusion genes at the breakpoints [3]. Similarly, fusion
gene formation at the boundaries of the amplicons in
cancer may modify or enhance the oncogenic impact
caused by the increased copy number as demonstrated
here for the potential functional importance of the
VAPB-IKZF3 fusion gene. We present multiple lines of
evidence suggesting the potential functional importance
of the fusion genes, including the involvement of known
oncogenic partner genes, exclusive expression of the
partner genes as a fusion gene and RNAi-mediated
knock-down studies. Finally, even if some of the fusion
genes are not functionally critical or driver mutations,
their detection from clinical specimens by RNA-seq at
the cDNA level provides an attractiv e method to gener-
ate tumor-specific individual biomarkers for DNA based
monitoring of cancer burden from patients’ plasma
[33,34].
Edgren et al . Genome Biology 2011, 12:R6
/>Page 8 of 13
Materials and methods
Cell culture
BT-474, MCF-7, and SK-BR-3 cells were obtained from
American Type Culture Collection. KPL-4 was a kind
gift from Dr Junichi Kurebayashi, Department of Breast
and Thyroid Surgery, Kawasaki Medical School, Japan.
MCF-7, KPL-4 and BT-474 cells were maintained in
DMEM (Gibco, Invitrogen, NY, USA) supplemented
with 10% fetal bovine serum (Source BioScience, Life-
Sciences, Nottingham, UK), 2 mM (MCF-7, KPL-4) or
4 mM (BT-474) L-glutamine (Gibco) and penicillin/
streptomycin (Gibco). BT-474 cells were further supple-
mented with 1 mM sodium pyruvate and 0.01 mg/ml
bovine insulin (Gibco). SK-BR-3 cells were maintained
in McCoy’s 5A medium (Sigma-Aldrich, St. Louis, MO,
USA) with 10% fetal calf serum, 1.5 mM L-glutamine
and penicillin/streptomycin. All cells were cultured at
37°C under 5% CO
2
.
Sequencing library construction and paired-end RNA-
Total RNA from breast cancer cell lines (see above) was
isolated using TRIzol (Invitrogen, Carlsbad, CA, USA)
and subsequent phenol/chloroform extraction. The
FirstChoice human breast total RNA was purchased
from Applied Biosystems (Foster City, CA, USA). Mes-
senger RNA templates were then isolated with oligo-dT
Dynabea ds (Invitrogen ) according to the manufactu rer’s
instructions and fragmented to average fragment size of
200 nucleotides by incubation in fragmentation buffer
(Ambion, Austin, TX, USA) fo r 2 minutes at 70°C. We
then used 1 μgoftheresultingmRNAinafirststrand
cDNA synthesis reaction using random hexamer prim-
ing and Superscript II following the manufacturer’ s
instructions (Invitrogen). To synthesize double-stranded
cDNA, DNA/RNA templates were incubated with sec-
ond strand buffe r, dNTPs, RNaseH and DNA PolI (Invi-
trogen) at 16°C for 2.5 hours. cDNA was then purified
(Qiagen PCR purification kit, Qiagen, Hilden, Germany).
To ensure the proper fragment distri bution pattern and
to calculate template concentration, cDNA was analyzed
using Bioanalyzer DNA 1000 kit (Agilent Technologies,
Santa Clara, CA, USA). End repair of template 3’ and 5’
overhangs was performed using T4 DNA polymerase,
Klenow DNA polymerase and T4 PNK (New England
BioLabs, Beverly, MA, USA). Template and enzymes
were allowed to react in the presence of dNTPs and
ligase buffer supplemented with ATP (New England
BioLabs) at 20°C for 30 minutes, purified (Qiagen PCR
purification kit) and subjected to A-base addition
through incubation at 37°C for 30 minutes with Kleno w
3’ to 5’ exo-enzyme, Klenow buffer and dATP (New
England BioLabs). Following purification with a Qiagen
MinElute kit, paired-end adaptors were ligated onto the
templates with Ultrapur e DNA ligase (Enzymatics,
Beverly, MA, USA) or quick DNA ligase (New England
BioLabs) at 20°C for 15 minutes and purified as above.
Ligation efficiency was assessed with PCR amplification.
cDNA templates were then size selected through gel
purification and paired-end libraries created using Pfx
polymerase (Invitrogen) and subsequently purified and
their concentration calculated. The median size of the
MCF-7 and KPL-4 paired-end library was around 100
nucleotides, whereas for BT-474 and SK-BR-3, two
library preparations were done, with median inser t sizes
of 100 and 200 nucleotides, respectively. For the normal
breast, the median insert size of the sequencing library
was 200 nucleotides. The paired-end sequencing was
performed using the 1G Illumina Genome Analyzer 2X
(Illumina) according to the manufacturer’s instructions.
The following primers were used (an asterisk denotes
phosphorothiate modification): adapto r ligation,
SLX_PE_Adapter1_ds 5’[Phos]GATCGGAAGAGCGGT-
TCAGCAGGAATGCCGA*G, SLX_PE_Adapter1_us
5’A*CACTCTTTCCCTACACGACGCTCTTCCGATCT;
PCR library, SLX_P E_PCR_Primer1f 5’ A*ATGA-
TACGGCGA CCACCGAGATCTACACTCTTTCCCTA-
CACGACGCTCTTCCGATC*T, SLX_PE_PCR_Primer1r
5’ C*AAGCAGAAGACGGCATACGAGATCGGTCTC-
GGCATTCCTGCTGAACCGCTCTTCCGATC*T.
The raw sequencing data have been deposited in the
NCBI Sequence Read Archive [SRA:SRP003186].
Sequence alignment
Ensembl versions 55 (BT-474, MCF-7, KPL-4 and nor-
mal breast) and 56 (SK-BR-3), both utilizing version
NCBI37 of the human genome, were used for all short
read alignments. Throughout the paper, Ensembl ver-
sion 55 was used for all analyses relating to BT-474,
MCF-7, KPL-4 and normal breast, whereas version
56 was used for SK-BR-3. Short reads obtained from
Genome Analyzer II (Illumina) (FASTQ files:
s_*_*_sequence.txt) were trimmed from 56 bp to 50 bp.
Short reads aligning to human ribosomal DNA (18S,
28S, 5S, 5.8S) and complete repeating unit ribosomal
DNA were filtered out. Additionally, short reads map-
ping on contaminant sequences (for example, adaptor
sequences) were filter ed out. The rem aining short reads
were aligned against the human genome and the splice-
site junction sequences of each gene (here a splice-site
junction sequence is the sequence on the transcript
level where two consecutive exons are joined). The
mapped short reads were divided into three categories:
short reads that do not align in the genome; short reads
that align uniquely; and short reads that align to multi-
ple loci in the genome and splice-site junction
sequences for each gene. For alignment a maximum of
three mismatches are allowed and Bowtie software ver-
sion 0.11.3 [35] wa s used for short reads alignment.
Edgren et al . Genome Biology 2011, 12:R6
/>Page 9 of 13
Short reads that aligned uniquely and short reads that
did not align were compared again against all Ensembl
transcripts. Here the paired-end reads were used to find
the fusion gene candidates, that is, paired-end reads that
map on two transcripts from different genes.
Fusion gene identification
Uniquely aligning short reads were assigned to genes
based on the transcript of the gene to which they
aligned. A preliminary set of fusion genes was i dentified
by selecting all the gene-gene pairs for which there were
at least two (MCF-7, KPL-4, normal breast) or three
(BT-474, SK-BR-3) short read pairs such that one end
aligns to one of the genes and the other to the other. A
higher threshold f or BT-474 and SK-BR- 3 was used to
account for greater sequencing depth in these cell lines
and keep the proportion of false positive findings con-
stant from sample to sample. Paralogous gene-ge ne
pairs were identified based on paralog status in Ensembl.
Gene biotype was also obtained from Ensembl. Two
genes were defined as non-adjacent if t here was a third
gene, of any biotype, such that both its start a nd stop
positions lie between the two other genes. To identify
the exon-exon fusion junction, a database of artificial
splice-site junctions was built by generating all the
potential exon-exon combina tions between gene A-gene
B and B-A for each pair of candidate-fusion genes.
Short reads that did not align on either the genome or
the transcriptome were aligned against the junction
database in order to locate t he exact fusion point, that
is, between which exons the gene fusion takes place.
Junctions spanning short reads were required to align at
least10bptooneexon.Thisstepalsodefineswhich
gene is the 5’ fusion partner. A minimum of two junc-
tion-spanning short reads wererequired.Theinitialset
of 83 candidates were selected based on the number of
paired-end and junction spanning reads as well as eac h
gene taking part in only a few fusions per s ample. The
final 28 fusion gene candidates were prioritized for
laboratory validation based primarily on the number and
positionofuniqueshortreadalignmentstartpositions
across the fusion junction (Figure 1) and secondarily on
location at a copy number transition. O ne million oligo
Agilent aCGH data were combined with sequencing
data by drawing images of sequencing c overage and
copy number data along with the structure of each can-
didate gene. Parsing of alignments and other custom
analyses were done with in-house developed Python
tools. Fusion gene prioritization was done using custom
tools built using R [36] and Bioconductor [37].
Fusion gene characterization
Fusion gene frame was predicted by creating all possible
fusions between those Ensembl transcripts of both genes
tha t contain the fused exons. A fusion transcri pt is pre-
dicted to be in-frame if any of the transcript-transcript
fusions, or their potential splice variants, retain t he
same frame across the fusion junction. Expression of
fus ion genes and wild-typ e parts of the fused genes was
calculated as uniquely mapped reads per kilobase of
gene sequence per million mapped reads (RPKM).
Fusion gene expression was calculat ed from the number
of short reads aligning to the fusion junction. To deter-
mine if any of the fused genes has previously been
reported to take part in translocations, all 5’ and 3’
genes were compared against the Mitelman Database of
Chromosome Aberrations [38]. To determine if fused
genes have otherwise been mutated in cancer, all 5’ and
3’ genes were compared against the COSMIC database
version 45 [39] and the Cancer gene census [40]. Cover-
age for each of the fused genes was determined by cal-
culating how many times each nucleotide of the gene
was sequenced. Coverage plots were drawn using R [36]
and the GenomeGraphs [41] package in Bioconductor
[37]. Plots illustrating the discovered fusions and their
association to copy number changes were drawn using
the Circos software [42].
aCGH
aCGH was performed as described previously [43] fol-
lowing the protocol provided by Agilent Technologies
(version 6), including minor modifications. Briefly, geno-
mic DNA w as extracted using TRIzol (Invitrogen) and
purified by chloroform extraction and subsequent etha-
nol precipitation. Three micrograms of d igested sample
or reference DNA (female genomic DNA; Promega,
Madison, WI, USA) was labeled with Cy5-dUTP and
Cy3-dUTP, respectively, using Genomic DNA Enzymatic
Labeling Kit and hybridized onto SurePrint G3 Human
1M oligo CGH Microarrays (Agilent). To process the
data a laser confocal scanner and Feature Extraction
softwar e (Ag ilent) were used according to the manufac-
turer’s instructions. Data were analyzed with DNA Ana-
lytics software, version 4 (Agilent). Raw aCGH data have
been deposited in Gene Expression Omnibus [GEO:
GSE23949].
RT-PCR and quantitative RT-PCR
The predicted fusion genes were validated by RT-PCR
followed by Sanger sequencing. Fusion junction
sequences are listed in Additional file 8. For the RT-
PCR reactions 3 μg of total RNA was converted to first-
stranded cDNA with random hexamer primers using
the High-Capacity cDNA Reverse Transcription kit
(Applied Biosystems) according to the manufacturer’s
instructions. RT-PCR products were gel-purified (GE
Healthcare, Little Chalfont, UK) and cloned into pCRII-
TOPO cloning vector (Invitrogen). All clones were
Edgren et al . Genome Biology 2011, 12:R6
/>Page 10 of 13
confirmed by sequencing using an ABI Prism 3730×l
DNA Sequencer (Applied Biosystems). Quantitative RT-
PCR reactions were carried out on a LightCycler
®
480
(Roche Applied Science, Penzberg, Germany) using
DyNAmo SYBRGreen PCR kit (Finnzymes, Espoo, Fin-
land). Primers specific either for wild-type partner genes
or fusion genes were used in RT-PCR and quantitative
RT-PCR and are listed in Additional file 9. GAPDH was
used as internal reference gene. All experiments were
performed in triplicates.
Long-range genomic PCR
Genomic DNA was isolated and purified as described
above. Genomic DNA amplifications were performed
using Expand Long Range dNTP pack kit (Roche)
according to the manufacturer’s instr uctions . For each
fusion gene pair, the maximum size of intervening
intronic sequence was calculated and primers (Addi-
tional file 5) were placed such that the amplicon
encompassed the fusion junction. Primer sequences are
listed in Additional file 9.
FISH
Interphase FISH was performed for selected fusion
genes. The BAC probes were selected to lie as close as
possible on each side of the breakpoint. The BAC clones
were obtained from ImaGenes (Berlin, Germany) and
grown overnight in LB media supplemented with chlor-
amphenicol and DNA was isolated with Qiagen Plasmid
Maxi-kit. The probes flanking the breakpoint were
labeled differentially with green-dUTP (Abbott, Des
Plaines, IL, USA) and orange-dUTP (Abbott). Twenty
nanograms of each probe were used per hybridization.
Denaturation of probe and target DNA w as performed
for 5 minutes at 87°C, followed by hybridization in a
humidity chamber overnight at 47°C. The cover glasses
were then removed, and the slides were washed twice
in 4× SSPE for 10 minutes at 37°C and 47°C, and the
slides were dehydrated in graded alcohol, 10 minutes
in hexanol:isopropanol, 5 minutes in isopropanol
before rehydration in graded alcohol and 5 minutes in
0.1× phosphate-buffered saline. The slides were
mounted with antifade mounting medium containing
4’,6’-diamino-2-phenylindole (Vectashield
®
DAPI, Vec-
tor Laboratories, Burlingame, CA, USA) as a counter-
stain for the nuclei. Evaluation of fluorescence signals
was carried out in an epifluorescence microscope.
Selected cells were photographed in a Zeiss Axioplan 2
microscope equipped with an Axio Cam MRM CCD
camera. Image analysis was performed using Axio
Vision software. FISH probe identifiers are listed in
Additional file 10.
siRNA knock-down experiments
The double-stranded siRNA oligonucleotides were
obtained from Qiagen and Applied Biosystems. Plates
pre-printed with 4 μl of siRNA stock solutions were
diluted with 10 μl of transfection reagent-Opti-MEM
(Invitrogen), and an appropriate amount of cells (1,500
to 2,000 per well) were plated in 35 μl of media. KPL-4,
SK-BR-3 and BT-474 cells were reverse transfected
using Silentfect (B io-Rad, Hercules, CA, USA), Hiperfect
(Qiagen) and Dharmafect 1 (Thermo Scientific, Lafay-
ette, CO, USA), respectively. AllStars Negative Control
(Qiagen), AllStars cell death control (Qiagen) and
siRNA against PLK1 and KIF11 were used as controls in
all experiments. The final siRNA concentration was 13
nmol/L. For proliferation assays the total cell number
was assayed using the CellTiter-Glo Cell Viability Assay
(Promega) 72 hours after the transfection according to
the manufacturer’s instructions. The EnVision Multila-
bel Plate Reader (Perkin-Elmer, Waltham, MA, USA)
was used for signal quantification. Screening data were
normalized in a plate-wise manner using the B-score
method [44]. All gene-targeting siRNAs were screened
in three replicate wells per plate and screens were
repeated three times. For hit identification, all B-score
values for an siRNA against a specific cell line were
treated as a group and comp ared to the AllStars nega-
tive control siRNAs from the corresponding cell line
using the Mann-Whitney U-test. Bonferroni correction
was used to correct for multiple testing. siRNAs with a
P-value < 0.05 were considered hits.
To validate the hits from the BT-474 screens, cells
were reverse transfected as above with IKZF3 siRNA 1
(Hs_IKZF3_3, Qiagen) and IKZF3 siRNA 2
(Hs_ZNFN1A3_5, Qiagen) in 96-well plates using siR-
NAs and 10,000 cells per well. CellTiter-Gl o Cell Viabi-
lity Assay (Promega) was used as an endpoint measure
after 168 hours.
Additional material
Additional file 1: Table showing paired-end RNA-seq summary
statistics.
Additional file 2: Cell line specificity of the novel fusion genes. RT-
PCR validation of fusion genes discovered in BT-474 (left), SK-BR-3
(middle) and KPL-4 (right) with a panel of breast cancer cell lines and
normal breast tissue. GAPDH was used as the internal reference gene.
Additional file 3: Long-range genomic PCR on fusion genes.
Genomic PCR across the fusion junctions of selected gene fusions in BT-
474 (left), KPL-4 (middle) and SK-BR-3.
Additional file 4: FISH analysis of fusion genes. (a) Interphase FISH
showing amplification of STARD3 and DOK5 (left), VAPB and CYTH1
(middle) and RPS6KB1 and SNF8 (right) in BT-474 cells but not in control
cells. White arrows indicate fused genes. Coloring of the gene names
coincides with labeling of the BAC clones used. (b) Interphase FISH
Edgren et al . Genome Biology 2011, 12:R6
/>Page 11 of 13
showing amplified signals of BSG and NFIX (left) and NOTCH1 and
NUP214 (right) in KPL-4. Normal copy number of both genes is present
in control cells. (c) Interphase FISH analysis showing many copies of
CYTH1 and EIF3H (left) and TATDN1 and GSDMB (right) in SK-BR-3. In
contrast, only normal copy number of these genes is visible in control
cells.
Additional file 5: Combined maximum intron sizes.
Additional file 6: Genomic rearrangements in KPL-4 and MCF-7.
Circos plots representing chromosomal translocations in KPL-4 (bottom)
and MCF-7 (top). Chromosomes are drawn to scale around the rim of
the circle and data are plotted on these coordinates. Selected
chromosomes involved in the fusion events are shown in higher
magnification. Each intrachromosomal (red) and interchromosomal (blue)
fusion is indicated by an arc. Copy number measured by aCGH is plotted
in the inner circle where amplifications are shown in red and deletions
in green. N denotes the number of fusion genes per cell line.
Additional file 7: Expression of IKZF3 and ERBB2 in breast cancer.
Genesapiens.org plot showing a scatterplot comparing IKZF3 and ERBB2
expression in a set of 761 breast tumors profiled on Affymetrix gene
expression microarrays.
Additional file 8: Fusion junction sequences.
Additional file 9: Primer sequences used in the study.
Additional file 10: FISH probes used for validation.
Abbreviations
aCGH: array comparative genomic hybridization; BAC: bact erial artificial
chromosome; bp: base pair; DNA-seq: DNA-sequencing; FISH: fluorescence in
situ hybridization; RNAi: RNA interference; RNA-seq: RNA-sequencing; siRNA:
small interfering RNA; UTR: untranslated region.
Acknowledgements
The authors would like to thank Rami Mäkelä, Pekka Kohonen, Vidal Fey and
Pekka Ellonen for scientific and experimental input, Anna Lehto for excellent
technical contribution, and Sami Kilpinen, Kalle Ojala and Imre Västrik for
fruitful discussions. This work was supported by an Academy of Finland
Post-Doctoral Researcher Grant (SK), the Academy of Finland Center of
Excellence grant in Translational Genome-Scale Biology, the Sigrid Ju selius
Foundation and the Cancer Society of Finland.
Author details
1
Institute for Molecular Medicine Finland (FIMM), Tukholmankatu 8, Helsinki,
00290, Finland.
2
Medical Biotechnology, VTT Technical Research Center of
Finland and Turku Center for Biotechnology, Itäinen Pitkäkatu 4C, Turku,
20520, Finland.
3
Department of Genetics, Institute for Cancer Research, Oslo
University Hospital Radiumhospitalet, Ullernchausseen 70, Oslo, 0310,
Norway.
4
Institute of Clinical Medicine, University of Oslo, PO Box 1171
Blindern, Oslo, 0318, Norway.
Authors’ contributions
HE designed the study, and contributed the majority of data analysis and
writing of the manuscript. AM designed the study, and contributed the
sequencing and validation experiments as well as to manuscript writing. SK
designed the study, and contributed the sequencing and validation
experiments as well as to manuscript writing. DN contributed sequence
alignment. VH contributed siRNA screening and Protein Lysate MicroArray
analysis. KK contributed to data validation. IHR contributed FISH analysis. SN
contributed siRNA screening. MW contributed aCGH experiments. ALBD
supervised FISH analysis and data validation. OK supervised the entire
project and participated in manuscript writing and editing.
Competing interests
The authors declare that they have no competing interests.
Received: 11 July 2010 Revised: 5 October 2010
Accepted: 19 January 2011 Published: 19 January 2011
References
1. Rowley JD: Letter: A new consistent chromosomal abnormality in chronic
myelogenous leukaemia identified by quinacrine fluorescence and
Giemsa staining. Nature 1973, 243:290-293.
2. de Klein A, van Kessel AG, Grosveld G, Bartram CR, Hagemeijer A,
Bootsma D, Spurr NK, Heisterkamp N, Groffen J, Stephenson JR: A cellular
oncogene is translocated to the Philadelphia chromosome in chronic
myelocytic leukaemia. Nature 1982, 300:765-767.
3. Tomlins SA, Rhodes DR, Perner S, Dhanasekaran SM, Mehra R, Sun XW,
Varambally S, Cao X, Tchinda J, Kuefer R, Lee C, Montie JE, Shah RB,
Pienta KJ, Rubin MA, Chinnaiyan AM: Recurrent fusion of TMPRSS2 and
ETS transcription factor genes in prostate cancer. Science 2005,
310:644-648.
4. Soda M, Choi YL, Enomoto M, Takada S, Yamashita Y, Ishikawa S, Fujiwara S,
Watanabe H, Kurashina K, Hatanaka H, Bando M, Ohno S, Ishikawa Y,
Aburatani H, Niki T, Sohara Y, Sugiyama Y, Mano H: Identification of the
transforming EML4-ALK fusion gene in non-small-cell lung cancer. Nature
2007, 448:561-566.
5. Metzker ML: Sequencing technologies - the next generation. Nat Rev
Genet 2010, 11:31-46.
6. Hillier LW, Reinke V, Green P, Hirst M, Marra MA, Waterston RH: Massively
parallel sequencing of the polyadenylated transcriptome of C. elegans.
Genome Res 2009, 19:657-666.
7. Mortazavi A, Williams BA, McCue K, Schaeffer L, Wold B: Mapping and
quantifying mammalian transcriptomes by RNA-Seq. Nat Methods 2008,
5:621-628.
8. Nagalakshmi U, Wang Z, Waern K, Shou C, Raha D, Gerstein M, Snyder M:
The transcriptional landscape of the yeast genome defined by RNA
sequencing. Science 2008, 320:1344-1349.
9. Sultan M, Schulz MH, Richard H, Magen A, Klingenhoff A, Scherf M,
Seifert M, Borodina T, Soldatov A, Parkhomchuk D, Schmidt D, O’Keeffe S,
Haas S, Vingron M, Lehrach H, Yaspo ML: A global view of gene activity
and alternative splicing by deep sequencing of the human
transcriptome. Science 2008, 321:956-960.
10. Tang F, Barbacioru C, Wang Y, Nordman E, Lee C, Xu N, Wang X, Bodeau J,
Tuch BB, Siddiqui A, Lao K, Surani MA: mRNA-Seq whole-transcriptome
analysis of a single cell. Nat Methods 2009, 6:377-382.
11. Pan Q, Shai O, Lee LJ, Frey BJ, Blencowe BJ: Deep surveying of alternative
splicing complexity in the human transcriptome by high-throughput
sequencing. Nat Genet 2008, 40:1413-1415.
12. Lae M, Freneaux P, Sastre-Garau X, Chouchane O, Sigal-Zafrani B, Vincent-
Salomon A: Secretory breast carcinomas with ETV6-NTRK3 fusion gene
belong to the basal-like carcinoma spectrum. Mod Pathol 2009,
22:291-298.
13. Persson M, Andren Y, Mark J, Horlings HM, Persson F, Stenman G:
Recurrent fusion of MYB and NFIB transcription factor genes in
carcinomas of the breast and head and neck. Proc Natl Acad Sci USA
2009, 106:18740-18744.
14. Stephens PJ, McBride DJ, Lin ML, Varela I, Pleasance ED, Simpson JT,
Stebbings LA, Leroy C, Edkins S, Mudie LJ, Greenman CD, Jia M, Latimer C,
Teague
JW, Lau KW, Burton J, Quail MA, Swerdlow H, Churcher C,
Natrajan R, Sieuwerts AM, Martens JW, Silver DP, Langerod A, Russnes HE,
Foekens JA, Reis-Filho JS, van ‘t Veer L, Richardson AL, Borresen-Dale AL,
et al: Complex landscapes of somatic rearrangement in human breast
cancer genomes. Nature 2009, 462:1005-1010.
15. Li H, Wang J, Mor G, Sklar J: A neoplastic gene fusion mimics trans-
splicing of RNAs in normal human cells. Science 2008, 321:1357-1361.
16. Hyman E, Kauraniemi P, Hautaniemi S, Wolf M, Mousses S, Rozenblum E,
Ringner M, Sauter G, Monni O, Elkahloun A, Kallioniemi OP, Kallioniemi A:
Impact of DNA amplification on gene expression patterns in breast
cancer. Cancer Res 2002, 62:6240-6245.
17. Wang XS, Prensner JR, Chen G, Cao Q, Han B, Dhanasekaran SM, Ponnala R,
Cao X, Varambally S, Thomas DG, Giordano TJ, Beer DG, Palanisamy N,
Sartor MA, Omenn GS, Chinnaiyan AM: An integrative approach to reveal
driver gene fusions from paired-end sequencing data in cancer. Nat
Biotechnol 2009, 27:1005-1011.
18. Lee W, Jiang Z, Liu J, Haverty PM, Guan Y, Stinson J, Yue P, Zhang Y,
Pant KP, Bhatt D, Ha C, Johnson S, Kennemer MI, Mohan S, Nazarenko I,
Watanabe C, Sparks AB, Shames DS, Gentleman R, de Sauvage FJ, Stern H,
Pandita A, Ballinger DG, Drmanac R, Modrusan Z, Seshagiri S, Zhang Z: The
Edgren et al . Genome Biology 2011, 12:R6
/>Page 12 of 13
mutation spectrum revealed by paired genome sequences from a lung
cancer patient. Nature 2010, 465:473-477.
19. Palanisamy N, Ateeq B, Kalyana-Sundaram S, Pflueger D, Ramnarayanan K,
Shankar S, Han B, Cao Q, Cao X, Suleman K, Kumar-Sinha C,
Dhanasekaran SM, Chen YB, Esgueva R, Banerjee S, Lafargue CJ, Siddiqui J,
Demichelis F, Moeller P, Bismar TA, Kuefer R, Fullen DR, Johnson TM,
Greenson JK, Giordano TJ, Tan P, Tomlins SA, Varambally S, Rubin MA,
Maher CA, et al: Rearrangements of the RAF kinase pathway in prostate
cancer, gastric cancer and melanoma. Nat Med 2010, 16:793-798.
20. Berger MF, Levin JZ, Vijayendran K, Sivachenko A, Adiconis X, Maguire J,
Johnson LA, Robinson J, Verhaak RG, Sougnez C, Onofrio RC, Ziaugra L,
Cibulskis K, Laine E, Barretina J, Winckler W, Fisher DE, Getz G, Meyerson M,
Jaffe DB, Gabriel SB, Lander ES, Dummer R, Gnirke A, Nusbaum C,
Garraway LA: Integrative analysis of the melanoma transcriptome.
Genome Res 2010, 20:413-427.
21. Maher CA, Palanisamy N, Brenner JC, Cao X, Kalyana-Sundaram S, Luo S,
Khrebtukova I, Barrette TR, Grasso C, Yu J, Lonigro RJ, Schroth G, Kumar-
Sinha C, Chinnaiyan AM: Chimeric transcript discovery by paired-end
transcriptome sequencing. Proc Natl Acad Sci USA 2009, 106:12353-12358.
22. Shah SP, Morin RD, Khattra J, Prentice L, Pugh T, Burleigh A, Delaney A,
Gelmon K, Guliany R, Senz J, Steidl C, Holt RA, Jones S, Sun M, Leung G,
Moore R, Severson T, Taylor GA, Teschendorff AE, Tse K, Turashvili G,
Varhol R, Warren RL, Watson P, Zhao Y, Caldas C, Huntsman D, Hirst M,
Marra MA, Aparicio S: Mutational evolution in a lobular breast tumour
profiled at single nucleotide resolution. Nature 2009, 461:809-813.
23. Campbell PJ, Stephens PJ, Pleasance ED, O’Meara S, Li H, Santarius T,
Stebbings LA, Leroy C, Edkins S, Hardy C, Teague JW, Menzies A,
Goodhead I, Turner DJ, Clee CM, Quail MA, Cox A, Brown C, Durbin R,
Hurles ME, Edwards PA, Bignell GR, Stratton MR, Futreal PA: Identification
of somatically acquired rearrangements in cancer using genome-wide
massively parallel paired-end sequencing. Nat Genet 2008, 40:722-729.
24. Makela TP, Saksela K, Evan G, Alitalo K: A fusion protein formed by L-myc
and a novel gene in SCLC. EMBO J 1991, 10:1331-1335.
25. Haverty PM, Fridlyand J, Li L, Getz G, Beroukhim R, Lohr S, Wu TD, Cavet G,
Zhang Z, Chant J: High-resolution genomic and expression analyses of
copy number alterations in breast tumors. Genes Chromosomes Cancer
2008, 47:530-542.
26. Saeki N, Usui T, Aoyagi K, Kim DH, Sato M, Mabuchi T, Yanagihara K,
Ogawa K, Sakamoto H, Yoshida T, Sasaki H: Distinctive expression and
function of four GSDM family genes (GSDMA-D) in normal and
malignant upper gastrointestinal epithelium. Genes Chromosomes Cancer
2009, 48:261-271.
27. Liu Z, Kostenko EV, Mahon GM, Olabisi OO, Whitehead IP: Transformation
by the Rho-specific guanine nucleotide exchange factor Dbs requires
ROCK I-mediated phosphorylation of myosin light chain. J Biol Chem
2006, 281:16043-16051.
28. Jonsson G, Staaf J, Olsson E, Heidenblad M, Vallon-Christersson J,
Osoegawa K, de Jong P, Oredsson S, Ringner M, Hoglund M, Borg A: High-
resolution genomic profiles of breast cancer cell lines assessed by tiling
BAC array comparative genomic hybridization. Genes Chromosomes
Cancer 2007, 46:543-558.
29. Romero F, Martinez AC, Camonis J, Rebollo A: Aiolos transcription factor
controls cell death in T cells by regulating Bcl-2 expression and its
cellular localization. EMBO J 1999, 18
:3419-3430.
30. Rebollo A, Ayllon V, Fleischer A, Martinez CA, Zaballos A: The association of
Aiolos transcription factor and Bcl-xL is involved in the control of
apoptosis. J Immunol 2001, 167:6366-6373.
31. Sircoulomb F, Bekhouche I, Finetti P, Adelaide J, Ben Hamida A, Bonansea J,
Raynaud S, Innocenti C, Charafe-Jauffret E, Tarpin C, Ben Ayed F, Viens P,
Jacquemier J, Bertucci F, Birnbaum D, Chaffanet M: Genome profiling of
ERBB2-amplified breast cancers. BMC Cancer 10:539.
32. Kilpinen S, Autio R, Ojala K, Iljin K, Bucher E, Sara H, Pisto T, Saarela M,
Skotheim RI, Bjorkman M, Mpindi JP, Haapa-Paananen S, Vainio P, Edgren H,
Wolf M, Astola J, Nees M, Hautaniemi S, Kallioniemi O: Systematic
bioinformatic analysis of expression levels of 17,330 human genes
across 9,783 samples from 175 types of healthy and pathological
tissues. Genome Biol 2008, 9:R139.
33. McBride DJ, Orpana AK, Sotiriou C, Joensuu H, Stephens PJ, Mudie LJ,
Hamalainen E, Stebbings LA, Andersson LC, Flanagan AM, Durbecq V,
Ignatiadis M, Kallioniemi O, Heckman CA, Alitalo K, Edgren H, Futreal PA,
Stratton MR, Campbell PJ: Use of cancer-specific genomic rearrangements
to quantify disease burden in plasma from patients with solid tumors.
Genes Chromosomes Cancer 2010, 49:1062-1069.
34. Leary RJ, Kinde I, Diehl F, Schmidt K, Clouser C, Duncan C, Antipova A,
Lee C, McKernan K, De La Vega FM, Kinzler KW, Vogelstein B, Diaz LA Jr,
Velculescu VE: Development of personalized tumor biomarkers using
massively parallel sequencing. Sci Transl Med 2010, 2:20ra14.
35. Langmead B, Trapnell C, Pop M, Salzberg SL: Ultrafast and memory-
efficient alignment of short DNA sequences to the human genome.
Genome Biol 2009, 10:R25.
36. Team RDC: R: A Language and Environment for Statistical Computing Vienna,
Austria: R Foundation for Statistical Computing; 2010.
37. Gentleman RC, Carey VJ, Bates DM, Bolstad B, Dettling M, Dudoit S, Ellis B,
Gautier L, Ge Y, Gentry J, Hornik K, Hothorn T, Huber W, Iacus S, Irizarry R,
Leisch F, Li C, Maechler M, Rossini AJ, Sawitzki G, Smith C, Smyth G,
Tierney L, Yang JY, Zhang J: Bioconductor: open software development
for computational biology and bioinformatics. Genome Biol 2004, 5:R80.
38. Mitelman Database of Chromosome Aberrations and Gene Fusions in
Cancer. [ />39. Forbes SA, Bhamra G, Bamford S, Dawson E, Kok C, Clements J, Menzies A,
Teague JW, Futreal PA, Stratton MR: The Catalogue of Somatic Mutations
in Cancer (COSMIC). Curr Protoc Hum Genet 2008, Chapter 10:Unit 10 11, .
40. Futreal PA, Coin L, Marshall M, Down T, Hubbard T, Wooster R, Rahman N,
Stratton MR: A census of human cancer genes. Nat Rev Cancer 2004,
4:177-183.
41. Durinck S, Bullard J, Spellman PT, Dudoit S: GenomeGraphs: integrated
genomic data visualization with R. BMC Bioinformatics 2009, 10:2.
42. Krzywinski M, Schein J, Birol I, Connors J, Gascoyne R, Horsman D, Jones SJ,
Marra MA: Circos: an information aesthetic for comparative genomics.
Genome Res 2009, 19:1639-1645.
43. Iljin K, Wolf M, Edgren H, Gupta S, Kilpinen S, Skotheim RI, Peltola M, Smit F,
Verhaegh G, Schalken J, Nees M, Kallioniemi O: TMPRSS2 fusions with
oncogenic ETS factors in prostate cancer involve unbalanced genomic
rearrangements and are associated with HDAC1 and epigenetic
reprogramming. Cancer Res 2006, 66
:10242-10246.
44. Brideau C, Gunter B, Pikounis B, Liaw A: Improved statistical methods for
hit selection in high-throughput screening. J Biomol Screen 2003,
8:634-647.
doi:10.1186/gb-2011-12-1-r6
Cite this article as: Edgren et al.: Identification of fusion genes in breast
cancer by paired-end RNA-sequencing. Genome Biology 2011 12:R6.
Submit your next manuscript to BioMed Central
and take full advantage of:
• Convenient online submission
• Thorough peer review
• No space constraints or color figure charges
• Immediate publication on acceptance
• Inclusion in PubMed, CAS, Scopus and Google Scholar
• Research which is freely available for redistribution
Submit your manuscript at
www.biomedcentral.com/submit
Edgren et al . Genome Biology 2011, 12:R6
/>Page 13 of 13