SOIL ENGINEERING: TESTING, DESIGN, AND REMEDIATION phần 2 docx
Bạn đang xem bản rút gọn của tài liệu. Xem và tải ngay bản đầy đủ của tài liệu tại đây (3.23 MB, 27 trang )
©2000 CRC Press LLC
After accepting the foundation investigation assignment the geotechnical con-
sultant should draft a program of field investigation for the field engineer to follow.
The instruction should consist of the frequency and spacing of the test holes, the
depth of the test holes, the field test required, etc. The field engineer should use his
or her own judgment to determine whether the instruction should be modified. It is
important that the field engineer not leave the site until all the information is gathered.
The consultant cannot usually afford to investigate the site twice. Unlike some
government projects where cost overruns can be tolerated, the consulting business
is highly competitive; undue expense generally results in financial loss.
2.4.1 D
ISTURBED
S
AMPLES
Disturbed samples can be collected during the drilling process. Sometimes they can
be collected without interrupting the operation. Samples can be collected from the
auger cuttings at intervals. The field engineer should be sure that soils from different
strata will not become mixed during drilling. Samples collected must represent soils
from each different stratum. Disturbed samples can be stored in fruit jars. They
should be sealed to retain the in situ moisture content and properly labeled.
In test pit excavation, large samples will sometimes be required in order to fulfill
the laboratory testing requirements. Such samples should be at least 12
¥
12 in. in
size, wrapped in wax paper, and carefully transported to the laboratory. After it is
carefully trimmed to the desired size, such a sample can be considered as undisturbed.
Representative samples can usually be obtained by driving into the ground an
open-ended cylinder known as “Split Spoon.” Spoons with an inside diameter of
about 2 in. consist of 4 parts: a cutting shoe at the bottom; a barrel consisting of a
length of pipe split into one half; and a coupling at the top for connection to the
drill rod.
2.4.2 U
NDISTURBED
S
AMPLES
A very simple sampler consists of a section of thin-walled “Shelby” or seamless
steel tubing which is attached to an adapter, as shown in Figure 2.7. The adapter or
the sampler head contains a check valve and vents for the escape of air or water. A
sample can be obtained by pushing the sampler into the soil at the desired depth.
The operation must be performed carefully so as to experience minimum deforma-
tion. The principal advantages of the Shelby tube sampler are its simplicity and the
minimal disturbance of soil.
A modification in the design of the split spoon sampler allows the insertion of
brass thin-wall liners into the barrel. Four sections of brass liners (each 4 in. long) are
used. Such a device allows the sampling and penetration test at the same time. This
method was initiated in California by Woodward, Clyde and Associates and is known
as the “California” sampler. It has been adopted throughout the Western U.S.
Samples of rock are generally obtained by rotary core drilling. Diamond core
drilling is primarily in medium-hard to hard rock. Special diamond core barrels up
to 8 in. in diameter are occasionally used and still larger ones have been built.
©2000 CRC Press LLC
In China, during the foundation investigation of the world’s largest dam, the
Three Gorges Dam, a special coring machine was used. The cores were up to 42 in.
diameters and were taken at depths of about 200 ft deep, as shown in Figure 2.8.
Such large samples enable the geologist to study the formation and texture of the
foundation rock in detail.
FIGURE 2.7
Shelby Tubing Sampler (after Moore).
©2000 CRC Press LLC
FIGURE 2.8
Large diameter rock samples at the Three Gorges Dam, China.
©2000 CRC Press LLC
REFERENCES
R. Peck, W. Hanson, and T.H. Thornburn,
Foundation Engineering
, John Wiley & Sons, New
York, 1974.
K. Terzaghi, R. Peck and G. Mesri,
Soil Mechanics in Engineering Practice,
John Wiley-
Interscience Publication, John Wiley & Sons, New York, 1995.
U.S. Department of the Interior, Bureau of Reclamation,
Soil Manual,
Washington, D.C., 1974.
R. Whitlow,
Basic Soil Mechanics,
Longman Scientific & Technical, Burnt Mill, Harrow,
U.K., 1995.
0-8493-????-?/97/$0.00+$.50
© 1997 by CRC Press LLC
3
©2000 CRC Press LLC
Field Tests
CONTENTS
3.1 Field Tests for Foundation Design
3.1.1 Penetration Resistance Test
3.1.2 Pressuremeter Test
3.1.3 Cone Penetration Test
3.1.4 Plate Bearing Test
3.2 Field Tests for Hydraulic Structures
3.2.1 Open End Test
3.2.2 Packer Test
3.2.3 Vane Shear Test
References
Field observation includes various numbers of tests. For building structures, the most
commonly used tests involve the penetration resistance test, the drilling of test holes,
and the opening of test pits. For hydraulic structure investigation, tests such as the
permeability test, vane shear test, and others can be performed. Pavement and runway
tests rely more on samples from core cutters, the California bearing ratio test, and
others.
In recent years, unsaturated soils, including swelling and collapsing soils, have
received a great deal of attention from geotechnical engineers. The performances of
such soils are covered by specialized books and will be discussed only briefly in
the following chapters.
Consulting engineers pay more attention to field test data than laboratory test
results. Unfortunately, the engineer in charge cannot visit all sites, especially out-
of-town projects. He must rely on his field engineer to perform all the necessary
tests. All data collected from the field should be reviewed. All records should be
checked for accuracy — but bear in mind that such documents may be brought up
years later, when all the persons involved are no longer available.
3.1 FIELD TESTS FOR FOUNDATION DESIGN
Field investigation for foundation recommendations involves numerous tests. In situ
testing includes the core cutter test, sand replacement test, standard penetration test,
cone penetration test, vane shear test, plate bearing test, pressuremeter test, and
many others. It is obvious that for a certain project not all tests are necessary. For
shallow foundations, in situ testing is relatively easy, but for deep foundations such
as piles and piers, field tests are often expensive and not always reliable.
©2000 CRC Press LLC
3.1.1 P
ENETRATION
R
ESISTANCE
T
EST
Probably the oldest method of testing soil is the “Penetration Resistance Test.” In
performing the Penetration Resistance Test, the split spoon sampler used to take soil
samples is utilized. The split spoon is driven into the ground by means of a 140-lb
hammer falling a free height of 30 in. The number of blows
N
necessary to produce
a penetration of 12 in. is regarded as the penetration resistance. To avoid seating
errors, the blows for the first 6 in. of penetration are not taken into account; those
required to increase the penetration for 12 in. constitute the
N
value, also commonly
known as the “blow count.” The following should be considered in performing the
penetration test:
1.
Depth Factor
— The value of
N
in cohesionless soils is influenced to
some extent by the depth at which the test is made. This is because of
the greater confinement caused by the increasing overburden pressure. In
the design of spread footings on sand, a correction of penetration resis-
tance value is not explicitly required. In other problems, particularly those
concerned with the liquefaction of sand, however, a correction is necessary.
2.
Water Table
— When penetration is carried out below the water table in
fine sands or silty sands, the pore pressure tends to be reduced in the
vicinity of the sampler, resulting in a transient decrease in
N
value.
3.
Driving Condition
— The most significant factor affecting the penetra-
tion resistance value is the driving condition. It is essential that the driving
condition should not be abused. The standard penetration barrel should
not be packed by overdriving since, at this force, the soil acts against the
sides of the barrel and causes incorrect readings. An increase in blow
count by as much as 50% can sometimes be caused by a packed barrel.
4.
Cobble Effect
— The barrel will bounce when driving on cobbles; hence,
no useful value can be obtained. Sometimes, a small piece of gravel will
jam the barrel, thereby preventing the entrance of soil into the barrel, thus
substantially increasing the blow count.
5.
California Sampler
— Considerable economy can be achieved by com-
bining the penetration test with sampling as described under “undisturbed
sample.” Field tests have been conducted comparing the results of the
penetration resistance of the California sampler with those of standard
penetration tests. The tests indicate that the results are commensurable,
with the exception of very soft soil (
N
< 4) and very stiff or dense soil
(
N
> 30). By combining the penetration resistance test with sampling,
more tests can be made and undisturbed samples can be obtained without
resorting to the use of Shelby tubes.
With the exception of the area of saturated fine loose sands, the depth factor
and the water table elevation factor can be disregarded. The results of the standard
penetration test can usually be used for the direct correlation with the pertinent
physical properties of the soil, as shown in Table 3.1.
©2000 CRC Press LLC
The correlation for clay as indicated can be regarded as no more than a crude
approximation, but that for sands is reliable enough to permit the use of
N
-value in
foundation design. The use of
N
value below 4 and over 50 for design purposes is
not desirable, unless supplemented by other tests. Some elaborate pile-driving for-
mulae are based on field penetration resistance value. They should be used with
caution, as the error involved in
N
value can be more than any of the other variables.
When driving on hard bedrock or semi-hard bedrock such as shale, if the amount
of penetration is only a few inches instead of the full 12 in., it is customary to
multiply the value by a factor to obtain the required 12 in For instance, if after 30
blows the penetration is only two inches, it is assumed that the
N
value is 120. Such
an assumed value when used for the design of the bearing capacity of bedrock might
be in error. An alternative is the pressuremeter test as described below, which may
offer a better answer.
Some contracts call for a penetration test for every 5 ft and sampling at the same
interval or every change of soil stratum. This may not be necessary. The field engineer
should use his or her judgment to guide the frequency of sampling and avoid
unnecessary sampling so that the cost of investigation can be held to a minimum.
Samples in the upper 10 or 15 ft are important, as this is generally the bearing
stratum of shallow footings. Soil characteristics at this level also govern the slab-
on-grade construction and earth-retaining structures. Sampling and penetration tests
at lower depths become critical when a deep foundation system is required.
3.1.2 P
RESSUREMETER
T
EST
The pressuremeter test is a device developed by Menard in 1950 for the purpose of
measuring in situ strength and compressibility.
The probe is made up of a measuring cell, with a guard cell above and below,
enclosed in a rubber membrane. The membrane is inflated, using water under an
TABLE 3.1
Penetration Resistance and Soil Properties of the
Standard Penetration Test
Sands
(Fairly Reliable)
Clays
(Rather Reliable)
Number of blows Relative Number of blows
per ft,
N
Density per ft,
N
Consistency
Below 2 Very soft
0–4 Very loose 2–4 Soft
4–10 Loose 4–8 Medium
10–30 Medium 8–15 Stiff
30–50 Dense 15–30 Very stiff
Over 50 Very dense Over 30 Hard
(after Peck)
©2000 CRC Press LLC
applied carbon dioxide pressure. The pressure and volume readings are taken con-
tinuously. The two guard cells ensure that a purely radial pressure is set up on the
sides of the bore hole. A pressure/volume-change curve is then plotted, from which
shear strength and strain characteristics may be evaluated.
The pressuremeter test (Figures 3.1 to 3.3) can be used to evaluate the bearing
capacity of shale bedrock at the bottom of large-diameter deep caissons.
3.1.3 C
ONE
P
ENETRATION
T
EST
The cone penetration test (Figure 3.4) is a static penetration test in which the cone
is pushed rather than driven into the soil. The cone has an apex angle of 60° with
a base area of 10 cm
2
attached to the bottom of a rod and protected by a casing.
The cone is pushed by the rod at the rate of two cm/sec. The cone resistance is the
force required to advance the cone, divided by the base area. The arrangement is
known as the “Dutch Cone.”
When the tip incorporates a friction sleeve, the base has an area of 15 cm
2
. The
local side friction is then measured as the frictional resistance per unit area on the
friction sleeve.
The results of cone penetration tests appear to be most reliable for sand and silt
that are not completely saturated. The application of the cone penetration test on
stiff clay is limited.
3.1.4 P
LATE
B
EARING
T
EST
The object of the plate bearing test is to obtain a load/settlement curve (Figures 3.5
to 3.7). For soil with relatively high bearing capacity, the load required to complete
FIGURE 3.1
Drilling for pressuremeter test.
©2000 CRC Press LLC
the curve is often exceedingly high, and the cost of such testing is often unjustified.
However, under certain circumstances where other test procedures are difficult to
apply, such a test may be justified; for example, on weathered rocks, chalk, or hard-
core fills.
The plate bearing test assures the client that the geotechnical engineer has taken
the project seriously, and the recommendations presented are without errors. If the
client is willing to pay for such a test just for assurance that nothing will go wrong,
then the geotechnical engineer should be happy to comply with the client’s wish,
although the test results will not alter the recommendations in the report.
A pit is excavated to the required depth, the bottom leveled, and a steel plate
set firmly on the soil. A static load is then applied to the plate in a series of increments,
and the amount and rate of settlement measured. Loading is continued until the soil
under the plate yields. A number of tests will be required using different plate
diameters at different depths.
3.2 FIELD TESTS FOR HYDRAULIC STRUCTURES
In addition to the standard penetration resistance test and in-place density test for
hydraulic structures, such as dams and canals, the field permeability test and the
vane test are often performed. It is understood that for major dam projects, elaborate
testing should be performed before and during construction. Approximate values of
FIGURE 3.2
Pressuremeter test.
©2000 CRC Press LLC
permeability of individual strata penetrated by borings can be obtained by making
water tests in the holes.
3.2.1 O
PEN
E
ND
T
EST
The test is made in an open end cased bore hole. After the hole is cleaned to the
proper depth, the test is begun by adding water through a metering system to maintain
gravity flow at a constant head. A surging of the level within a few tenths of a foot
at a constant rate of flow for about 5 min is considered satisfactory. The permeability
is determined from the following relationships:
k = Q/5.5 r H
Where: k = permeability,
Q= constant rate of flow into the hole (gallons per minute),
r= internal radius of casing (feet), and
H= differential head of water (feet).
If it is necessary to apply pressure to the water entering the hole, the pressure
in the unit of head is added to the gravity head as shown in Figure 3.8.
FIGURE 3.3
Menard Pressuremeter
(after Whitlow).
©2000 CRC Press LLC
FIGURE 3.4
Cone penetrometers (after Sowers).
FIGURE 3.5
Arrangement for plate load test (after Peck).
©2000 CRC Press LLC
FIGURE 3.6
Results of standard load tests on loess deposit (after Peck).
FIGURE 3.7
Plate bearing test for the construction of runway.
©2000 CRC Press LLC
3.2.2 P
ACKER
T
EST
The packer test can be made both below and above the water table. It is commonly
used for pressure testing of bedrock using packers, but it can be used in unconsol-
idated materials where a top packer is placed just inside the casing. When the packer
is placed inside the casing, measures must be taken to properly seal the annular
space between the casing and the drill hole to prevent water under pressure from
escaping.
The permeability can be written as:
k = C Q/H (after
Soil Manual
)
where k is in feet per year, Q is in gallons per minute, and H is the head of water
in feet, acting on the test length. Measurement of the test length depends on the
location of the water table as shown in Figure 3.9. Values of C for
NX
size of casing
vary from 2800 for test length of 20 ft to 23,000 for test length of 1 ft.
The usual procedure is to drill the hole; remove the core barrel; set the packer;
make the test; remove the packer; drill the hole deeper; set the packer again to test
the newly drilled section; and repeat the test.
3.2.3 V
ANE
S
HEAR
T
EST
The vane shear test is used to measure the in situ undrained shear strength of silts
and clays of shallow water origin. Such tests are commonly associated with the field
testing of dams and canals.
A four-bladed vane is driven into the soil at the end of a rod and the vane then
rotated at a constant rate between 6 and 12°/min until the cylinder of soil contained
by the blades shears. The maximum torque required for this is recorded. The blade
FIGURE 3.8
Open-end field permeability tests (after
Soil Manual
).
©2000 CRC Press LLC
size varies from 75 mm wide
¥
150 mm long for weak soils, to 50
¥
100 mm for
stronger soils.
The vane rod and extension pieces are enclosed in a sleeve to prevent soil
adhesion during the application of the torque. Depending on the nature of the soil,
vane tests may be carried out down to depths of 100 to 250 ft (Figure 3.10).
FIGURE 3.9
The packer test (after
Soil Manual
).
©2000 CRC Press LLC
FIGURE 3.10
Inplace vane shear test apparatus (after
Soil Manual
).
©2000 CRC Press LLC
REFERENCES
R. Peck, W. Hanson, and T.H. Thornburn,
Foundation Engineering,
John Wiley & Sons, New
York, 1974.
G.B. Sowers and G.S. Sowers,
Introductory Soil Mechanics and Foundations,
Collier-
Macmillan, London, 1970.
U.S. Department of the Interior, Bureau of Reclamation,
Soil Manual,
Washington, D.C., 1974.
0-8493-????-?/97/$0.00+$.50
© 1997 by CRC Press LLC
4
©2000 CRC Press LLC
Classification and
Identification
CONTENTS
4.1 Field Identification and Classification
4.1.1 Unified Soil Classification System
4.1.2 Highway Soil Classification System
4.2 Identification and Description
4.2.1 Water Measurement
4.2.2 Laboratory Classification
4.2.3 Bedrock
4.2.4 Man-made Fill
4.2.5 Presentation
References
The object of soil classification is to divide the soil into groups so that all the soils
in a particular group have similar characteristics by which they may be identified.
The field engineer should be able to classify and identify the soil in the field,
but field classification has to be confirmed by laboratory testing. A qualified field
engineer or a technician should be able to identify the subsoil with a reasonable
degree of accuracy.
It appears that both the Unified Soil Classification System and the AASHTO
(American Association of State Highway and Transportation Officials) System are
obvious enough for all engineers to understand, yet for a field engineer to enter the
appropriate symbols in the drill log can sometimes be difficult. A field engineer has
to examine the soil as it comes out from the auger, locate the next bore hole, measure
the water, and sometimes help the driller; he has little time left to study the accuracy
of the log. It is up to the engineer in charge to discuss the project with the field
engineer, analyze the findings, and make the necessary changes before issuing the
final report to the client.
4.1 FIELD IDENTIFICATION AND CLASSIFICATION
The earliest soil classification system is the “Texture System.” This system is based
on soil grain size alone. It is still used in the agricultural field, though geotechnical
engineers have long abandoned the system. The FAA system initiated by the Federal
Aviation Administration was the first to be developed by the engineers. The only
systems in use by the geotechnical engineers at present are the AASHTO System
©2000 CRC Press LLC
and the Unified Soil Classification system. The latter has gradually replaced all
others.
4.1.1 U
NIFIED
S
OIL
C
LASSIFICATION
S
YSTEM
The system was adopted in 1952 by the Bureau of Reclamation and the Corps of
Engineers, with Professor A. Casagrande as consultant. Soils are categorized in
groups, each of which has distinct engineering properties. The criteria for classifi-
cation are
1. Percentage of gravel, sand, and fines in accordance with grain size
2. Shape of grain size curve for coarse grain soils
3. Plasticity and compressibility characteristics for fine grained soils and
organic soils. The letter symbols are as follows:
G Gravel and gravelly soils
S Sand and sandy soils
M Silt
C Clay
O Organic soils
Pt Peat
WWell graded
P Poorly graded
H High Plasticity
L Low Plasticity
In borderline cases, a combination of symbols is used. The Unified Soil Classi-
fication System is a milestone in soil mechanics.
For the use of the field engineer, the Bureau of Reclamation and the Corps of
Engineers have published “Field Identification Procedures” and guidelines so that
all field logs can be interpreted using the same language. The system was revised
in 1952, and is presented in Tables 4.1a, 4.1b, and 4.2.
TABLE 4.1a
Unified Classification System — Group Symbols for Gravelly Soils
Group
Symbol Criteria
GW Less than 5% passing No. 200 sieve; C
u
= D
60
/D
10
greater than or equal to 4;
C
c
= (D
30
)
2
/
(D
10
¥
D
60
) between 1 and 3
GP Less than 5% passing No. 200 sieve; not meeting both criteria for GW
GW-GM Percent passing No. 200 sieve is 5 to 12; meets the criteria for GW and GM
GW-GC Percent passing No 200 sieve is 5 to 12; meets the criteria for GW and GC
GP-GM Percent passing No 200 sieve is 5 to 12; meets the criteria for GP and GM
GP-GC Percent passing No. 200 sieve is 5 to 12; meets the criteria for GP and GC
©2000 CRC Press LLC
For proper classification according to the above tables, the following should be
noted:
1. Percent of gravel — that is, the fraction passing the 3-in. sieve and retained
on the No. 4 sieve
2. Percent of sand — that is, the fraction passing No. 4 sieve and retained
on the No. 200 sieve
3. Percent of silt and clay — that is, the fraction finer than the No. 200 sieve
TABLE 4.1b
Unified Classification System — Group Symbols for Sandy Soils
Group
Symbol Criteria
SW Less than 5% passing No. 200 sieve; C
u
= D
60/
D
10
greater than or equal to 6;
C
c
= (D
30)
2
/(D
10
¥
D
60
) between 1 and 3
SP Less than 5% passing No. 200 sieve; not meeting both criteria for SW
SM More than 12% passing No. 200 sieve; Atterberg’s limits plot below A-line or
plasticity index less than 4 (Figure 4.1)
SC More than 12% passing No. 200 sieve; Atterberg’s limits plot above A-line;
plasticity index greater than 7 (Figure 4.1)
SC-SM More than 12% passing No. 200 sieve; Atterberg’s limits fall in hatched area
marked CL-ML (Figure 4.1)
SW-SM Percent passing No. 200 sieve is 5 to 12; meets criteria for SW and SM
SW-SC Percent passing No. 200 sieve is 5 to 12; meets criteria for SW and SC
SP-SM Percent passing No. 200 sieve is 5 to 12; meets criteria for SP and SM
SP-SC Percent passing No. 200 sieve is 5 to 12; meet the criteria for SP and SC
(after Das)
TABLE 4.2
Unified Classification System — Group Symbols for Silty
and Clayey Soils
Group
Symbol Criteria
CL Inorganic: LL < 50; PL > 7; plots on or above A-line (Figure 4.1)
ML Inorganic: LL < 50; PL < 4; or plots below A-line (Figure 4.1)
OL Organic: (LL — oven dried)/(LL — not dried) < 0.75; LL < 50
CH Inorganic: LL more than 50; PL plots on or above A-line
MH Inorganic; LL more than 50; PL plots below A-line (Figure 4.1)
OH Organic; (LL — oven dried)/(LL — not dried) < 0.75; LL > 50
CL-ML Inorganic; plot in the hatched zone (Figure 4.1)
Pt Peat, muck, and other highly organic soils
(after Das)
©2000 CRC Press LLC
4. Uniformity coefficient (C
u
) and the coefficient of curvature (C
c
)
5. Liquid limit and plasticity index of the portion of soil passing the No. 40 sieve
The most commonly encountered granular soils are GC-GM, GP-GC, SP, SC,
SP-SC. For cohesive soils the CL,CH, and the CL-CH are most commonly observed
by consultants.
4.1.2 H
IGHWAY
S
OIL
C
LASSIFICATION
S
YSTEM
About 1928, the Bureau of Public Roads introduced a soil classification system still
widely used by highway engineers. All soils were divided into eight groups desig-
nated by the symbols A-1 through A-8. The soil best suited for the subgrade of a
highway is designated as A-1. The material is largely a well-graded sand and gravel,
but containing a small amount of binder. All other soils were grouped roughly in
decreasing order of stability. This system is shown in Table 4.3.
In the AASHTO System, the inorganic soils are classified in seven groups
corresponding A-1 through A-7. These in turn are divided into a total of 12 sub-
groups. Organic soils are classified as A-8. Any soil containing fine-grained material
is further identified by its group index; the higher the index, the less suitable the
soil. The group index is calculated from the formula
where F = percentage passing No. 200 sieve expressed as a whole number.
FIGURE 4.1
Plasticity Chart (after Das).
GI F LL F PI=-
()
+
()
-
()
[]
+-
()
-
()
35 0 2 0 005 40 0 01 15 10 .
©2000 CRC Press LLC
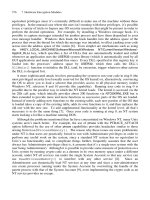
The system is complicated; consultants prefer to use the Unified System. How-
ever, the consultants should be familiar with the AASHTO System when the projects
involve the federal or the state government.
4.2 IDENTIFICATION AND DESCRIPTION
Accurate and precise description of the subsoil conditions in the field by the field
engineers is not easy. A freshman field engineer tends to over-log the subsoil strata
revealed in the bore hole. As the soil comes out of the auger, there are some
differences in each foot of the material. Consequently, the inexperienced engineer
tends to log the hole with such frequent changes of stratum that the draftsman has
a difficult time plotting the data. At the same time, drill logs without any descriptions
are often seen.
Logging of test holes is an art. It takes a great deal of practice and experience
before the field engineer or a technician is able to master such a skill. Bearing in
mind that subsoils are never uniform, the field engineer logs the holes for engineering
purposes, not for research. Inconsistency is to be expected. However, if the field log
fell into the hands of an attorney, the engineer can at once smell trouble. It is
sometimes better to destroy the field log after completion of the project.
4.2.1 W
ATER
M
EASUREMENT
Moisture content of soils as they are taken from the ground should be recorded.
They are generally designated as dry, moist, or wet. These terms are relative depend-
ing on the type of soil. For fairly clean sands, a moisture content of about 12% is
considered as wet, while for clay this moisture content is considered to be moist.
It is essential that the field engineer record the water level found in the bore
holes. In the case of sandy soils, when the augers are removed rapidly from the bore
hole, an upward hydraulic gradient is created in the sand beneath the drill hole.
Consequently, the sand may become “quick” and the relative density may be greatly
reduced. The penetration resistance value will accordingly be much lower than that
corresponding to the relative density of the undisturbed sand. Care is required to
ensure that the water level in the drill hole is always maintained at or slightly above
that corresponding to the piezometric level at the bottom of the hole.
The importance of water in geotechnical engineering will be discussed further
in later chapters.
4.2.2 L
ABORATORY
C
LASSIFICATION
Although most classification of soils can be performed in the field, the Unified Soil
Classification System has provided for precise delineation of the soil group by
gradation analyses and Atterberg limits tests in the laboratory.
Within the sand and gravel groupings, soils containing less than 5% finer than
the No. 200 sieve size are considered “clean.” A clean sand having both a coefficient
of uniformity greater than 4 and a coefficient of curvature between 1 and 3 is in the
SW group; otherwise, it is a poorly graded sand SP.
©2000 CRC Press LLC
TABLE 4.3
Classification of Highway Subgrade Material
General
classification
Granular materials
(35% or less of total sample passing No. 200)
Group
classification
A-1
A-2
A-1-a A-1-b A-3 A-2-4 A-2-5 A-2-6 A-2-7
Sieve analysis
(percent
passing)
No. 10 50 max.
No. 40 30 max. 50 max. 51 min.
No. 200 15 max. 25 max. 10 max. 35 max. 35 max. 35 max. 35 max.
Characteristics of
fraction passing
No. 40
Liquid limit 40 max. 41 min. 40 max. 41 min.
Plasticity index 6 max. NP 10 max. 10 max. 11 min. 11 min.
Usual types of
significant
constituent
materials
Stone fragments,
gravel, and sand
Fine sand Silty or clayey gravel and sand
General subgrade
rating
Excellent to good
General
classification
Silt-clay materials
(more than 35% of total sample passing No. 200)
A-7
A-7-5
a
Group classification A-4 A-5 A-6 A-7-6
b
Sieve analysis (percent passing)
No. 10
No. 40
No. 200 36 min. 36 min. 36 min. 36 min.
Characteristics of fraction
passing No. 40
Liquid limit 40 max. 41 min. 40 max. 41 min.
Plasticity index 10 max. 10 max. 11 min. 11 min.
Usual types of significant
constituent materials
Silty soils Clayey soils
General subgrade rating Fair to poor
a
For A-7-5,
PI
£
LL
– 30
b
For A-7-6,
PI
>
LL
– 30
(after Das)
©2000 CRC Press LLC
“Dirty” gravels or sands are those containing more than 12% fines, and they are
classified as either clayey or silty by results of their Atterberg limits tests as shown
in the plasticity chart.
If a soil is determined to be fine grained by using the grain size curve, it is
further classified into one of the six groups by plotting the results of Atterberg limits
tests on the plasticity chart. Fine-grained soils with PI greater than 7 and above the
“A” line (Figure 4.1) are CL or CH, depending on whether their liquid limits are
less than 50% or more than 50%, respectively.
Similarly, fine-grained soils with PI less than 4 or below the “A” line are ML
or MH, depending on whether their liquid limits are less than or more than 50%,
respectively. All geotechnical engineers are familiar with the plasticity chart and the
significance of the “A” line as shown in Figure 4.1.
The types of soil with which most geotechnical engineers are concerned are not
as complicated as presented in the chart. The following are observed:
1. For the coarse grain soil, it must be emphasized that in order to justify
the symbol SP or SW, the percentage of fines should be less than 5%;
otherwise, dual symbols should be used. Also, to justify the symbol SW
or GW, the gradation must fulfill the uniformity coefficients and coeffi-
cient of curvature requirements. Such soils are seldom encountered. Most,
if not all, foundation soils encountered in foundation design are of GP or
SP group.
2. For the fine-grained soils, those soils below the “A” line such as OH, MH,
and OL are seldom encountered. Peat soils, of course, are quite rare.
Engineers should direct their attention to the most commonly found soils
such as CL, ML, and CH. The differentiation between CL and ML is of
special importance.
3. Dual symbols should be used with care and only when necessary, espe-
cially in the course of visual classification. The use of CL-SC or CL-ML
is acceptable, but the use of CL-SP or CH-SM is inexcusable. Also, no
attempt should be made to use three symbols. The use of dual systems
indicates the engineer is doubtful of his classification, and the use of triple
symbols indicates that he has no idea what he is doing.
4. For stiff clays, it is possible to predict their behavior by visual examina-
tion. Very stiff clays with high plasticity generally exhibit swelling poten-
tial while the low density, calcareous clays with porous structure indicate
high settlement or collapsing characteristics.
4.2.3 B
EDROCK
The description of bedrock in geotechnical engineering is a little different from the
terms used by the geologist. However, the underlying meanings are the same. Shale
bedrock in the Rocky Mountain area is familiar to most consulting engineers. Besides
consistency and moisture content, the degree of cementation, the angle of dip, and
the stratification should be recorded.
©2000 CRC Press LLC
A guideline for describing the consistency of shale bedrock with respect to
penetration resistance is shown in Table 4.4.
In the east side of the Front Range area bedrock formations have been turned
up by the uplifting. This unique bedrock formation is noteworthy. The bedding planes
of the bedrock, instead of lying flat, dip steeply at an angle greater than 30° from
horizontal. The Colorado Geological Survey designated the area as the “Dipping
Bedrock Overlay District.” The geological cross-section is shown on Figure 4.2. The
effects of such formation are that the rock layers with distinctly different swelling
characteristics are found in close proximity to each other along or near the ground
surface in the form of thin zones. These zones respond differently to the increase
in moisture, with the more expansive claystone undergoing more swelling and
vertical uplift than the adjacent beds. The resulting effect is differential, often
destructive heave. A second effect of upturned bedding is the development of higher-
than-normal lateral swelling pressures. When exposed at or near the ground surface,
claystone bedrock is free of its burial confining pressures and will try to attain its
original thickness by pulling water into its structure and expanding.
Recently, the dipping claystone shale stratification in the Denver Front Range
area has received much attention as it had great effect on the performance of the
lightly loaded structures. Dipping claystone bedrock formation allows surface water
to enter the lower highly swelling soil. It also creates a very complicated and erratic
subsoil condition that may require a different approach in design.
Differentiation between claystone and sandstone should be easy, while claystone
and siltstone are sometimes difficult to identify. Color may not be important in
engineering, but it does offer assistance for identification. Siltstone in the Laramie,
Wyoming area is generally red. Denver blue shale derived its name from its dark
gray color, while chocolate brown claystone generally possesses high swelling
potential.
Interlayered shale bedrock consists of alternative layers of claystone. The rec-
ognition of such strata is important. Sometimes, the field engineer logs bedrock as
non-expansive sandstone and neglects to record the thin layer of highly expansive
claystone that turns out to be the key material in the foundation design.
TABLE 4.4
Pentetration Resistance and Consistency of Shale
Penetration Resistance
(blows/ft) Description
Less than 20 Clay (weathered claystone}
20–30 Firm
30–50 Medium hard
50–80 Hard
over 80 Very hard
(after Peck, Hanson, and Thornburn)
FIGURE 4.2
Geological cross-section showing dipping bedrock formation along the Denver Front Range area (after CGS).
©2000 CRC Press LLC