Báo cáo y học: "The role of codon selection in regulation of translation efficiency deduced from synthetic libraries" potx
Bạn đang xem bản rút gọn của tài liệu. Xem và tải ngay bản đầy đủ của tài liệu tại đây (464.33 KB, 10 trang )
RESEARC H Open Access
The role of codon selection in regulation of
translation efficiency deduced from synthetic
libraries
Sivan Navon, Yitzhak Pilpel
*
Abstract
Background: Translation efficiency is affected by a diversity of parameters, including secondary structure of the
transcript and its codon usage. Here we examine the effects of codon usage on translation efficiency by re-analysis
of previously constructed synthetic expression libraries in Escherichia coli.
Results: We define the region in a gene that takes the longest time to translate as the bottleneck. We found that
localization of the bottleneck at the beginning of a transcript promoted a hi gh level of expression, especially if the
computed dwell time of the ribosome within this region was sufficiently long. The location and translation time of
the bottleneck were not correlated with the cost of expression, approximated by the fitness of the host cell, yet
utilization of specific codons was. Particularly, enhanced usage of the codons UCA and CAU was correlated with
increased cost of production, potentially due to sequestration of their corresponding rare tRNAs.
Conclusions: The distribution of codons along the genes appears to affect translation efficiency, consistent with
analysis of natural genes. This study demonstrates how synthetic biology complements bioinformatics by providing
a set-up for well controlled experiments in biology.
Background
Understanding the mechanisms that control the effi-
ciency of protein translation is a major challenge for
proteomics, computational biology and biotechnology.
Efficient translation of proteins, either in their natural
biological context or in heterologous expression systems,
amounts to maximizing production, while minimizing
the costs of the process. Abundant genome sequence
datanowmakeitpossibletodeciphersequencedesign
elements that govern the efficiency of translation. The
codon adaptation index (CAI)[1]wasthefirstmeasure
to be introduced for gauging translation efficiency
directly from nucleotide sequences of genes. This mea-
sure quantifies the extent to which the codon bias of a
gene resembles that of highly expressed genes. The
tRNA adapt ation index (tAI) assesses the extent to
which the codons of a gene are biased towards the more
abundant tRNAs in the organism [2]. Despite several
simplifying assumptions, both tAI and CAI are good
measurements for predicting protein abundance from
sequence [3,4]. Perhaps the most critical simplification
of the two models is that they represent the translation
efficiency of an entire gene by a single number - the
average translation efficiency value over all its codons.
As such, both CAI and tAI ignore the order in which
codons of high and low translation efficiency appear in
the sequen ce. Thus, two genes may share the same
value of CAI o r tAI and yet the order of high and low
efficiency codons differs between them.
By analyzing dozens of genomes, we have recently
shown that the order of high and low efficiency codons
in biological sequences is under selection [5,6]. Specifi-
cally, examining such genomes revealed a clustering of
low efficiency codons at the beginning of ORFs, mainly
in the first approximately 50 codons. We termed this
design the ‘translation ramp’,or‘ ramp’ for short, which
might constitute a strategic early bottleneck in t he flow
of the ribosomes. Our model suggests that such ramps
attenuate the ribosomes at the beginning of genes, thus
allowing a jam-free flow of riboso mes beyond the ramp.
We have shown that this design is predominantly
* Correspondence:
Department of Molecular Genetics, Weizmann Institute of Science, PO Box
26, Rehovot, 76100, Israel
Navon and Pilpel Genome Biology 2011, 12:R12
/>© 2011 Navon and Pilpel; licensee BioMed Central Ltd. This is an open access article distributed under the terms of the Creative
Commons Attribution Lice nse http://(http://creativeco mmons.org/licenses/by/2.0), which permits unrestricted use, distribution, and
reproduction in any medium , provided the original work is properly cited.
obeyed by highly expressed genes [5,7], suggesting that
it might support efficient production. Investigating nat-
ural genes has two obvious advantages: their availability
in very high numbers, and the fact that they have been
subject to selection and optimization by evolution. Simi-
larly, using the totally asymmetrical simple exclusion
process (TASEP), it was theoretically shown that slow
codons can affect ribosome density and production rates
depending on initiation rate, termination rate, and the
rate of the slow codons and their distribution [8-12].
Yet, analysis of natural sequences also poses limita-
tions. Natural genes represent a wide variety but their
variability is uncontrolled and is influenced by con-
founding factors at many levels. For instance, even if
two genes share the same translation efficiency profile,
they may differ with respect to the strength of their pro-
moter, the un-translated regions, the secondary struc-
ture and the amino acid sequence, all factors that may
affect protein levels. Synthetic biology, which now offers
the ability to synthesize and express designed genes,
may complement the picture obtained from bioinfor-
matics analysis of natural genes. Although the number
of genes that can be synthesized is by orders of magni-
tude lower than the number of natural sequences, syn-
thetic genes enable us to modify one variable at a time
while keeping others constant. In several pioneering stu-
dies of this type, the nucleotide sequence of a single
gene was randomized while amino acid sequence was
kept constant. In particular, these studies generated
libraries of artificial variants of genes ’ nucleotide codi ng
sequences, while fixing other features, such as the un-
translation regions and promoters. Analysis of one such
library led to an important finding - that the stability of
the mRNA, especially in the 5’ region, is a main deter-
minant of protein abundance [13]. Those authors
further found that the CAI of a gene had no effect on
protein expression levels butthatitwasrathercorre-
lated with, and perhaps affected, the fitness of the host
cell.
Here we set to re-analyze the data from these libraries
[13,14]. We were motivated by the realization that, due
to their simplifying assumptions, the CAI and tAI do
not capture the full capacity of codon selection to affect
translation efficiency, particularly since these models
ignore codon order that is under tight selection [5,6].
We show that obeying the design we observed in nature,
namely localization of the bottleneck at the beginning of
the ORF sequence, indeed promotes higher levels of
expression. This was especia lly true if the predicted
dwell time of the ribosome at these bottleneck regions
was sufficiently long. On the other hand, the bottleneck
characteris tics did not affect the fitness of the host cell.
We did find, however, that the extent of utilization of
two particular codons (UCA and CAU) does correlate
negatively with a cell’s fitness, potentially due to seques-
tration of the corresponding rare tRNAs. The results
further demonstrate how correlative conclusions made
from observations of natural gene sequences can be
complemented by synthetic genes, allowing decoding of
the sequence features that govern the efficiency of trans-
lation and its costs.
Results and discussion
Translation efficiency
Looking for the effects of codon usage on translation
efficiency and whether the order of the codons is impor-
tant, we set out to re-analyze data from the three syn-
thetic libraries [13,14]. The ori ginal tAI value [2] is
defined for an entire gene based on all its codons as:
tAI w
gi
k
k
g
g
1
1
/
where l
g
is the length of the gene in codons and
w
i
k
is
the relative adaptiveness value of the codon defined by
the kth triplet in the gene.
Here we refer to the w
i
value of a single codon as the
codon’ s tAI. This measure is an approximation of the
codon’s translation speed, since a codon is assigned with
a high tAI if the v arious tRNAs that translate it are at
high abundance and have high affinity towards it.
Besides the tAI, there are other alternative approxima-
tions for the codon’s translation speed [8,15,16] (see dis-
cussion in Additional file 1). Note that all current
models have approximation as their basis, necessarily
introducing inaccuracies in analyses that are based on
them.
To investigate the effect of regions with less than opti-
mal codons, for each gene we defined the ‘bottleneck’ as
a region of a fixed number of codons, n, where the (har-
monic) mean of the codons’ tAI value is minimal (the
value of n is related to the distance between two conse-
cutive ribosomes on the mRNA (see Materials and
methods). Assuming the codon’s tAI value is an approx-
imation for the translation speed, then 1/tAI can be
regarded as the codon’s translation time and the bottle-
neck is the region with the longest average translation
time.
The bottleneck of each gene is characterized by two
parameters: the location of the bottleneck - that is,
number of codons from the ATG in w hich it occurs -
and the ‘strength’ of the bottleneck - the average time
to translate all the codons within it. To allow compari-
sons between the different genes and libraries below, we
refer to the relative, rather than absolute, form of these
variables - the relative location of the bottleneck is its
Navon and Pilpel Genome Biology 2011, 12:R12
/>Page 2 of 10
location divided by the length of the gene, and the rela-
tive strength is the strength divided by the average
strength (that is, the time it takes to translate the bottle-
neck regions divided by the total time of translation of
the mRNA, or 1/tAI of the entire gene).
We first analyzed 154 synthetic GFP genes in a library
constructed by K udla et al. [13]. All the synthetic GFP
variants had the same amino acid sequence but different
codon sequences. For these genes we calculated the bot-
tleneck parameters using a window of length n =21
codons. Note that there is uncertainty regarding the
exact value of this parameter (see Materials and meth-
ods); however, experimentation with other window sizes
in the range 14 <n < 30 did not affect results qualita-
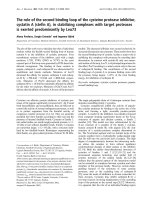
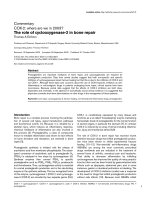
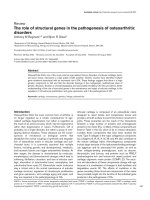
tively (not shown). Figure 1a shows the relative locati on
of the bottleneck of all GFP genes versus the protein
abundance of each translated gene (see Materials and
methods). The relative location is anti-correlated to the
protein abundance (Pearson correlation -0.43, P-value
3.4 × 10
-8
; Spearman correlation -0.46, P-value 2.8 × 10
-
9
), indicating that genes that have the bottleneck closer
to the ATG (designated here as the ‘ proximal bottle-
neck’ ) tend to have higher protein abundance levels
compared to genes whose bottleneck are located
towards the 3’ end of the gene (designated the ‘distal
bottleneck’).
As for the relative strength of the bottleneck, when
examining the entire library of 154 genes we found a
modest yet significant correlation with the protein abun-
dance (Pearson correlation 0.38, P-value 1.9 × 10
-6
;
Spearman correlation 0.31, P-value 1.2 × 10
-4
); that is,
genes with long dwell times of the ribosome in the bot-
tleneck regions tended to have higher expression levels.
However, as seen in Figure 1b, this correlation is mainly
contributed by genes that have a proximal bottleneck.
Focusin g on 86 of the genes with a proximal bottleneck
(located between relative positions 0.16 to 0.28) a signif-
icant positive correlation emerged between the relative
strength and the protein abundance (Pearson correlation
0.47, P-value 3.9 × 10
-6
; Spearman correlation 0.44, P-
value 2.1 × 10
-5
). From Figure 1a it is seen that there
are relatively few genes with a distal bottleneck that also
have a similar relative strength; therefore, the influence
of the relative strength on distal genes cannot be
deduced.
Summarizing the analysis of the GFP library, the dis-
tribution of the codons along t he transcript appears to
affect the final GFP levels in the cell. A region of less
efficient codons at the beginning of a transcript - for
example, a proximal bottleneck - seems to enable higher
protein levels. For genes with a proximal bottleneck it is
also beneficial to have a relatively long dwell time of the
ribosome, that is, a strong enough bottleneck. From this
library we were not able to learn about the significance
of the bottleneck strength in the case of genes with dis-
tal bottlenecks; however, other libraries with different
distributions of bottlenecks can shed light on the
question.
In another recent paper, by Welch et al. [14], two dif-
ferent proteins were synthesized: the DNA polymerase
of Bacillus phage and an antibody fragment (scFv). For
each protein there are approximately 40 different
0 0.2 0.4 0.6 0.8 1
0
2000
4000
6000
8000
10000
12000
14000
16000
Bottleneck relative location
protein abundance
1.2
1.3
1.4
1.5
1.6
1.7
Bottleneck relative strength
(
b
)(
a
)
1.2 1.3 1.4 1.5 1.6 1.7 1.
8
0
2000
4000
6000
8000
10000
12000
14000
16000
Bottleneck relative strength
protein abundance
relative location: 0.16-0.28
other
Figure 1 Protein abundance versus relative location and strength of the bottleneck in the GFP library. (a) All t he genes in the GFP
library. The x-axis is the relative location of the bottleneck in every gene; the y-axis is the per-cell protein abundance. The color of each dot is
the relative strength of the bottleneck in every gene. Eighty-six of the genes are located between the two black lines that correspond to
relatively early bottlenecks - that is, relative location between 0.16 and 0.28. (b) The correlation between the bottleneck relative strength and
per-cell protein abundance for all the genes in the GFP library. The 86 genes that have a relative location between 0.16 and 0.28 are plotted as
red squares, and the rest of the genes are plotted as grey circles.
Navon and Pilpel Genome Biology 2011, 12:R12
/>Page 3 of 10
sequences in which the amino acid was kept the same
while changing the codon sequence. Fo r both proteins,
the location of the bottleneck is quite far from the ATG
in most synthetic variants (relative distance of approxi-
mately 0.5 and higher; Figure S1 in Additional file 2),
excluding the possibility of examining the effect of the
proximal bottleneck on the expression of these two pro-
teins. Nonetheless, we could still compute the correla-
tion between the bottleneck’s parameters and protein
abundance. Although less significant than in the case of
the GFP library, both libraries showed an anti-correla-
tion between protein abundance levels and the relative
location of the bottleneck (Spearman correlation -0.34
(P-value 0.06) and -0.40 (P-value 0.03); Pearson correla-
tion -0.34 (P-value 0.06) and -0.16 (P-value 0.40) for the
scFv and the polymerase, respectively). Similar to the
GFP library, such negative correlation indicates that
proximal bottlenecks are often associated with higher
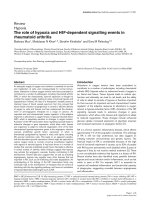
expression levels. As was done for the GFP library, we
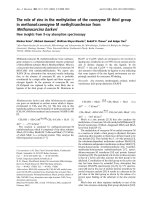
looked at the correlation between protein abundance
and the bottleneck relative strength (Figure 2) for speci-
fic locations, chosen based on Figure S1 in Additional
file 2 (for correlations see Table S1 in Additi onal file 1).
Interestingly, while in the case of the GFP library a
proximal bottleneck became more effective with
increased relative strength, in the cases of scFv and the
polymerase, which featured a distal bottleneck, the
strength actually showed the opposite correlation; that
is, genes with long dwell times in the bottleneck regions
showed lower protein abundance (Spearman correlation
-0.43 (P-value 0.02) and -0.67 (P-value 7.1 × 10
-5
) for all
genes of scFv and the polymerase, respectively). It is our
understandi ng that a proximal bottleneck can have ben-
eficial effects on protein production [ 5]. The bottleneck
can delay the translating ribosome, causing a ribosome
backlog (when in polysome), an d can also reduce the
density of the ribosome downstream. A proxi mal bottle-
neck mini mizes the number of jammed ribosom es, thus
reducing ribosome sequestering and collisions, two
potential causes for a decrease in protein production.
Assuming the bottleneck reduces the density of ribo-
somes downstream, a slower bottleneck (that is, a bot-
tleneck with increased relative strength) will reduce
even more downstream ribosome collisions, improving
protein production, as seen with the GFP library. On
the other hand, a distal bottleneck at the end of the
ORF causes a long backlog, with no beneficial effects on
expression levels. Since a bottleneck at the end of the
ORF seems to have mainly negative effects on the pro-
tein translation rate, reducing its relative strength is
beneficial, as seen in the case of the scFv and the
polymerase.
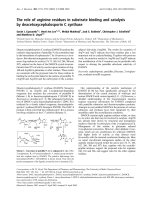
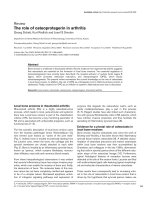
To further verify our assumption that the bottleneck
may have beneficial effects on protein abundance when
they are located at the beginning of a gene, we looked
at the distribution of locations of the b ottleneck in nat-
ural Esch erichia coli genes [Refseq : NC_ 012947] (Figure
3; Figure S2 in Additional file 2). Indeed, for most genes
with a bottleneck of high relative strength (higher than
1.3), the bottleneck region is located in the first quad-
rant of the transcript (relative location smaller than
0.25). For 41% of genes with a bottleneck of high rela-
tive strength, the bottleneck is located in the first quad-
rant (hyper-geometric significant enrichment P-value
(b)(a)
sc
F
v
P
o
l
ymerase
1.2 1.25 1.3 1.35 1.4 1.45 1.5 1.55 1.6
0
0.5
1
1.5
2
2.5
3
Bottleneck relative strength
protein abundance
relative location ~0.9
other
1.2 1.25 1.3 1.35 1.4 1.45 1.5 1.55 1.
6
0
0.5
1
1.5
2
2.5
3
Bottleneck relative strength
protein abundance
relative location ~0.5
relative location ~0.8
other
Figure 2 Protein abundance ver sus relative strength of the bott leneck for data from the scFv and polymera se libraries. (a) All the scFv
genes; (b) all the polymerase genes. In both panels the x-axis is the relative strength of the bottleneck, the y-axis the per-cell protein
abundance. Genes with bottlenecks at different relative locations are marked by different colors (see legend) to show the correlation between
relative strength and protein abundance for genes with the same bottleneck location.
Navon and Pilpel Genome Biology 2011, 12:R12
/>Page 4 of 10
6.2 × 10
-9
) and on ly 22% of these genes have the bottle-
neck located in the fourth quadrant, which is a signifi-
cant depletion (hyper-geometric P-value 1 × 10
-4
).
Examining highly expressed genes separately (see Mate-
rials and methods; Figure S2b in Additional file 2),
we also observe a depletion of a strong bottleneck in the
fourth quadrant (18% of the genes, hyper-geometric
P-value 0.02) and enrichment in the first quadrant (49%,
P-value 0.005). In contrast, a separate examination of
lowly expressed genes (Figure S2c Additional file 2)
reveals no significant depletion or enrichment (depletion
in the fourth quadrant 18% (P-value 0.39); enrichment
in the first quadrant 41% (P-value 0.15)).
Kudla et al. [13] showed that the folding energy of the
mRNA near the initiation site influences translation
rate. It was suggested that a weak secondary structure
enables the ribosome to bind more quickly to the
mRNA, thus enabling a faster translation rate. These
observations raised the possibility that the correlation
we observe between bottleneck location and protein
abundance in the GFP library is due to the confounding
effects of mRNA secondary structure stability. We thus
carried out correlation analysis to verify that the correla-
tions we found still hold even when examining gene sets
with similar mRNA folding energy. We calculated the
partial correlation between bottleneck parameters and
per-cell protein abundance while controlling for the
folding energy. Both the relative location correlation
(Pearson correlation -0.24, P-value 0.004; Spearman cor-
relation -0.27, P-value 9.5 × 10
-4
)andtherelative
strength at locations 0.16 to 0.28 (Figure 1) correlation
(Pearson correlation 0.3, P-value 0.006; Spearman corre-
lation, 0.24, P-value 0.024) remained significant even
after controlling for the folding energy, indicating that
bottleneck parameter correlations are significant on
their own. Therefore, although in the GFP library the
folding energy significantly affects the protein abun-
dance, bottleneck location and strength also contribute
to the changes in protein levels.
The cost of production
For efficient translation we are interested not only in the
levels of expressed protein from a gene but also in the
cost of expression. Considering the cost of production,
we looked at how introducing a new gene into the host
cell influenced cell fitness. The influence on fitness is, in
general,acombinationofthebenefittheproteinpro-
vides with the burden its production puts on the system.
However, assuming that the genes from the heterolo-
gous libraries discussed here do not contribute to the
fitness of the host cell, the fitness decline due to expres-
sion reflects only the pure cost of production.
Kudla et al. [13] showed that the measured optical
density (OD), assumed to b e proportional to the fitness
of the host cell, is highly correlated with the CAI.
Further analysis showed that the tAI is also correlated
with OD (Pearson correlation 0.51, P-value 2.4 × 10
-11
).
These two similar measures describe the entire tran-
script and not a particular region within it. In contrast,
we found that the bottleneck parameters that signifi-
cantly correlate with protein abundance are not corre-
lated with cell fitness. Thus, the factors that correlate
with fitness and those correlating with protein abun-
dance appear distinct in this library (Figure 4). It seems
that while specific regions of the transcript affect protein
abundance, the fitness is affected by the codon usage of
the entire transcript.
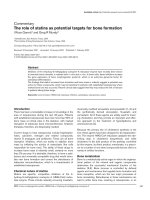
Trying to understand the source for the correlation
between the fitness a nd tAI or CAI, we examined the
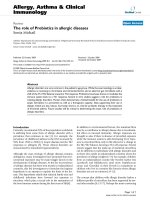
effect of individual codons on cell fitness. We analyzed
the correlation between the usage frequency of each
specific codon in the GFP sequence (number of copies
of the codon in the sequence) and the fitnes s of the cell
that was expressing that GFP variant (Figure 5). Inter-
estingly, the extent of usage of some codons is nega-
tively correlated with fitness, is positively correlated for
others, and for the rest is not correlated with fitness.
The cases of negativ e correlation may indicate a burden
on fitness due to using particular codons. In contrast,
since fitness can only decrease due to GFP expression,
cases of positive correlation between codon usage in a
gene and its host fitness likely reflect an artificial nega-
tive correlation of synonym codons; that is, the prefer-
ence for not using its alternative codons rather than a
preference for expressing the codon itself.
0 0.2 0.4 0.6 0.8 1
0
5
10
15
20
25
30
3
5
Bottleneck relative location
% of genes
all genes
top 500 genes
bottom 500 genes
Figure 3 Distribution of bottleneck relative locations for E. coli
genes. The distribution is shown for three groups of E. coli genes:
all genes (blue); highly expressed genes (green); and lowly
expressed genes (red). For all groups only genes longer than 100
codons are shown (this cutoff retains 90% of the E. coli genes). This
resulted in 442 highly expressed genes (out of the top 500) and 473
lowly expressed genes (out of the bottom 500).
Navon and Pilpel Genome Biology 2011, 12:R12
/>Page 5 of 10
Thus, focusing on t he codons that correlate negatively
with fitness, we detected three codons whose usage cor-
relates most significantly: CAU (Pearson correlation
-0.69, P-value < 10
-324
); AAU (Pearson correlation -0.68,
P-value < 10
-324
); and UCA (Pearson correlation -0.67,
P-value < 10
-324
) (Figure 5; Table S2 in Additional file
1). Further examination reveals inter-dependencies
between the usage of some of these codons; in particu-
lar, the f requ encies of CAU and AAU are highly c orre-
lated (r = 0.92, P-value 10
-64
) among themselves (the
reasons for internal correlation may have to do with
GFP construction methods; see Kudla et al. [13]). Using
partial correlation analysis b etween the usage of each
codon, we ide ntified UCA and CAU as the main codons
contributing to the decrease in the fitness (see Materials
and methods).
The number of occurrences of the UCA codon,
encoding ser ine , in a single gene varies between zero to
three appearances. This c odon is the rarest out of the
six serine codons in the E. coli genome [Refseq:
NC_012947], though it is not extremely rare (12.2% of
all serine codons, and 0.7% of all 61 codons in the ORFs
of the genome; Table S2 in Additional file 1). However,
in the transcriptome (that is, the genome, weighted by
the mRNA expression level from each gene; see Mater i-
als and methods) UCA is one of the rarest codons (8.7%
of all serine codons and 0.45% of all 61 codons). The
UCA codon is exclusively translated by the tRNA
UGA
[17]. The genome of E. coli has only one copy of this
tRNA gene and, reassuringly, it was shown that a short-
age of this tRNA decreases cell fitness [18]. The negative
correlation between the copy number of the UCA codon
and the fitness can thus imply that increased usage of
the UCA codon causes a shortage of the corresponding
tRNA, causing a decrease in fitness. Regarding codons
CAU and AAU, they are negatively correlated with fit-
ness (and with one another) yet we found no apparent
reason for this.
Shortage of tRNAs explains some of the correlations
between the usage of certain codons and fitness; how-
ever, it is not clear through which mechanism a short-
age of tRNAs affects the fitness. The extensiv e usage of
codons that correspond to rare tRNAs can affect the fit-
ness in at least one of two alternative ways: by ‘consum-
ing’ the tRNAs and sequestering them from
participating in the translation of other transcripts; or
through the unavaila bility of ribosomes that are delayed
for longer times while searching for rare tRNAs. A sim-
ple means to distinguish between these two alternative
options is to examine whether not only the number but
also the location of such rare codons affects fitness. In
particular, we expect that if the fitness-reducing effect
of the rare codons is the jamming of ribosomes, then
their utilization will be particularly harmful when
located distally, closer to the 3’ end of the transcript. In
contrast, if the fitness-reducing effect is predominantly
due to the consumption of rare tRNAs, then it is not
expected to show such location dependence. In reality,
we observed no corre lation with the location (Figure S3
in Additional file 2), suggesting that it is the consump-
tion of the rare tRNAs, in this case, that compromises
fitness.
correlation
r = 0.11
(p-val 0.17)
-0.0088
(0.92)
-0.1
(0.23)
0.51
(2.4e-011)
0.48
(8.7e-010)
0.62
(9e-018)
0.35
(1.1e-005)
-0.42
(6.8e-008)
0.057
(0.48)
0.06
(0.47)
0.67
(2.6e-020)
0.38
(1.9e-006)
-0.43
(3.4e-008)
-0.062
(0.45)
-0.024
(0.78)
OD
Fluorescence
Fluorescence/OD
-1
-0.5
0
0.5
1
Figure 4 Correlation between the GFP experimental measurement and transcr ipt calculated parameters. On the x-axis are different
parameters that can be calculated from the transcript: folding energy of the initiation site calculated in Kudla et al. [13], bottleneck parameters,
CAI and tAI. On the y-axis are the optical density (OD) measurement, protein abundance and per-cell protein abundance. The correlation value is
indicated by both the color of the box and the number. The correlation P-value is given in parentheses.
Navon and Pilpel Genome Biology 2011, 12:R12
/>Page 6 of 10
Conclusions
As shown, a proximal and strong bottleneck is corre-
lated with an increase in protein abundance. A proximal
bottleneck can reduce the number of jammed ribosomes
on a transcript. Therefore, it can reduce both the num-
ber of occupied ribosomes and the number of delayed
ribosomes. Delaying ribosomes on the mRNA might
increase their abortion rate, thus causing early termina-
tion of the translation [19], reducing protein levels. For
ribosomes to jam, a fast initiation rate is required. This
is usually the case in highly expressed genes, in cases of
heterologous gene expression, and in synthetic libraries
such as discussed here where high protein levels are
desired. Due to amino acid sequence constraints for
some genes, a naïve approach, using only optimal
codons, might result in an unintentional distal
bottleneck.
While the bottleneck parameters are correlated with
protein abundance, they are not correlated with fitness.
This suggests that while the occupation of more ribo-
somes sequesters them from the cell’s pool, for most
genes in the GFP libra ry it does not cause a shortage of
ribosomes, enabling the cell to continue translating
other transcripts. The decrease in fitness is correlated
with the increased usage of codons UCA and CAU, sug-
gesting a shortage of the complementary tRNAs.
Our results thus show that, along with mRNA stabi-
lity, codon choice does affect translation efficiency, and
that naïve averaged measures such as CAI and tAI do
not capture this regulatory capacity. The results also
-0.8
-0.6
-0.4
-0.2
0
0.2
0.4
0.6
0
.
8
Correlation
AAU (N)
AAC (N)
AAA (K)
AAG (K)
ACU (T)
ACC (T)
ACA (T)
ACG (T)
AGU (S)
AGC (S)
AGA (R)
AGG (R)
AUU (I)
AUC (I)
AUA (I)
AUG (M)
CAU (H)
CAC (H)
CAA (Q)
CAG (Q)
CCU (P)
CCC (P)
CCA (P)
CCG (P)
CGU (R)
CGC (R)
CGA (R)
CGG (R)
CUU (L)
CUC (L)
CUA (L)
CUG (L)
GAU (D)
GAC (D)
GAA (E)
GAG (E)
GCU (A)
GCC (A)
GCA (A)
GCG (A)
GGU (G)
GGC (G)
GGA (G)
GGG (G)
GUU (V)
GUC (V)
GUA (V)
GUG (V)
UAU (Y)
UAC (Y)
UAA (*)
UAG (*)
UCU (S)
UCC (S)
UCA (S)
UCG (S)
UGU (C)
UGC (C)
UGA (*)
UGG (W)
UUU (F)
UUC
(F)
UUA (L)
UUG (L)
significantly positive
significantly negative
non significant
C
o
d
on
Figure 5 Correlatio n between codon usage in a transcript and fitness. The ba r indica tes the Pearson correlat i on value between codon
frequency and OD. On the x-axis are listed all the codons in the format ‘codon (amino acid)’. A correlation was determined to be significant if
its P-value is below 0.05/61 (that is, alpha = 0.05 was corrected for the number of codons tested). Red bars represent codons for which there is
a significantly positive correlation between their appearance and the OD. Blue bars represent codons that have a significant negative correlation.
For codons with no significant correlation, grey squared bars are used. When no bar appears for a codon (for example AUG, UAA and so on) it
means that the usage of that specific codon was constant for all genes, thus resulting in no correlation value. For usage of each amino acid in
the GFP variant, see Table S3 in Additional file 1.
Navon and Pilpel Genome Biology 2011, 12:R12
/>Page 7 of 10
show that while codon choices do affect both translation
efficiency and cell fitness, different aspects of codon
selection affect differently the production ca pacity and
costs. One direct conclusion from our re sults relates to
the popular us age of ‘His-tags’, chains of histidine resi-
dues at carboxyl termini of genes in heterologous
expression systems [20]. When using carboxy-terminal
His-tags in bacterial expression systems it would be
advantageous to encode histidine with CAC rather than
with CAU for two reasons: first, be cause CAU appears
to correlate negatively with fitness; and second, in order
to avoid a bottleneck towards the end of the gene.
When trying to understand the cell system, one rea-
lizes its processes are regulated on many different levels.
As shown in this paper, synthetic gene libraries enabled
us to control for a significant portion of gene variability
and focus on the effects of regions with less than opti-
mal codons (the bottleneck). Identification of bottleneck
effects in synthetic genes thus completes Tuller et al.’ s
[5] bioinformatics wo rk that identified clustering of low
efficient codons at the beginning of ORFs of natural
genes. The results further demonstrate how correlat ive
conclusions made from observations of natural gene
sequences can be complemented by synthetic genes,
allowing decoding of the seque nce features governi ng
the efficiency of translation and it costs.
It is our belief that through carefully designed syn-
thetic libraries many other regulation processes can be
understood, thus completing the first step toward s
understanding the regulation process as a whole.
Materials and methods
Defining the bottleneck
The bottleneck is a region o n a gene where the harmo-
nic mean of its codons’ tAI values is minimal. For all
codons except CGA, the tAI values were calculated
using dos Reis et al.’ss-values[2];forcodonCGAthe
value 0.1333 was used. This codon is translated with
tRNA
ACG
; however, the s-value for this interaction is
very high, resulting in a very low tAI value. This tAI
value is smaller by at least an order of magnitude than
the smallest tAI value, causing all other codons to have
a relatively high tAI, disabling this analysis. Since CGA
is actually translated by tRNA
ACG
, we decided to change
the s-value of this interaction to a more reasonable
value, resulting in the above mentioned tAI value. Given
the tRNA repertoire of E. coli, this change affects only
the tAI value of codon CGA.
A codon tAI value is assumed to be proportional to
the speed of the codon’ s translation [5]; higher tAI
values correspond to high tRNA abundance and affinity,
thus faster translation. A harmonic mean of speeds is
simply an arithmetic mean of the corresponding times.
Hence, looking for the region with the minimum
harmoni c mean of speed is equivalent to looking for the
region that takes the longest time to translate.
For each region the harmonic mean of speed is:
n
tAI
c
cgion
1
Re
where n is the region size, and c is the set of all the
codons in the region (n codons).
To find the bottleneck, a sliding window of length n
over the gene was used. The harmonic mean was calcu-
lated for each window and the window with the mini-
mum value was identified. It should be noted that since
we are averaging the translation time in a window, an
incorrect window size might in some cases result in
incorrect identification of the bottleneck. For example, if
our estimated window size is too big, it m ight mask a
cluster of a few slowly translated codons, of a more rele-
vant size, that are surrounded by relatively rapidly trans-
lated codons. In most cases, however, the slow region is
significant enough and its identification is not too sensi-
tive to window size. Indeed, as mentioned in the R esult
and discussion section, our results did not change quali-
tatively for window sizes in the range 14 <n < 30.
The bottleneck window size (n)
Under a maximal density scenario (fast initiation rate),
the distance between two consecutive ribosomes will be
minimal. In this case, when two ribosomes are translating
the same mRNA simultaneously, the minimum possible
distance between the two tra nslated codons (one by each
of the ribosomes) is one ribosome size (H codons) (Fig-
ure S4 in Additi onal file 2). At any given moment during
the translation process, two adjacent ribosomes would
have translated exactly the same codons apart from the
last H codons - t he first of the two ribosomes has already
translated them, a nd the second i s just about to start
them. I f the time it took the first ribosome to finish
translating the nth codon, T(n,1), is longer than the time
it takes the second ribosome to translate the n-Hth
codon, T(n - H ,2), the second ribosome will ‘bump’ into
the first one. That is, if T(n,1) >T(n - H ,2), a traffic jam
will be created. T(n,1)can be found by summing the time
it takes the ribosome to assemble on the ATG (B)with
the time it takes to translate the n codons:
Tn B ti
i
n
(,) ()1
1
where t(i) is the time it takes to translate the ith
codon. The second ribosome gains access to the ATG
only when enough codons (minimum H) are cleared
after being translated by the first ribosome. As a result a
Navon and Pilpel Genome Biology 2011, 12:R12
/>Page 8 of 10
traffic jam will be created if Tw (k,H)>Tw (1,H)+B,
where Tw (k,H) is the time to translate H consecutive
codons starting from codon k:
Tw k H t i
ik
kH
(, ) ()
1
Therefore, the region of H codons with maximum
translation time
arg max ( , )
:kH
Tw k H
1mRNA length
deter-
mines whether and where a traffic jam will be created
(for a d etailed calculation, see page 2 of Additional file
1). Choosing n in our bottleneck equation to be equal
to H, it is easy to see that our bottleneck is related to
this maximum.
As can be seen from this analysis, the minimal dis-
tance between two ribosomes should determine our
window size. The footprint of the ribosome, which is
the actual protection of the ribosome from RNA degra-
dation, was determined quite accurately to be ten
codons [21]. Due to the structure of the ribosomes, we
assume that there should be some space between two
consecut ive 30S subunits. As a result, although only ten
codo ns are protected, the minimal distance between the
two ribosomes should be larger. Therefore, we chose to
adopt the average ribosome-to-ribosome distance mea-
sured by Brandt et al. [22]. They measured the mean
distance between the center of mass of two ribosomes
on actual bacter ial polysomes to be 21.6 nm [22], which
is about 21 codons (0.34 nm per base). In this paper, n
was set to be equal to H; that is n is set to 21 codons.
The bottleneck parameters
A bottleneck is characterized by two parameters: its
‘location’ and its ‘strength’.
The ‘location’ of the bottleneck is defined as the loca-
tion in the gene of the bottleneck’s first codon (k codons
from the ATG). The relative location of t he bottleneck
is defined as the location of the bottleneck divided b y
the number of possible windows; for example,
k
ln1
,
where k is the location of the bottleneck, l is the length
of the gene, and n is the window size.
The ‘strength’ of the bottleneck is defined as the arith-
metic average of 1/tAI values for the codons in the
region, for example,
11
ntAI
c
cgion
Re
(the inverse of the
harmonic mean). The rela tive strength of the bottleneck
is defined as the strength of t he bottleneck divided by
the average 1/tAI for the entire gene, for example,
11
11
1
ntAI
ltAI
c
c bottleneck
c
c
l
;wherel is the number of codons
in the gene (excluding the stop codon).
Per-cell protein abundance
To get an estimate f or protein expression per cell from
the GFP library data [13], we normalized the measured
protein abundance (measured by OD), which serves
here as a proxy for the population size, the OD. The
protein abundance levels for the data from Welch et al.
[14] were measured while keeping the OD constant.
Therefore, we can use this protein abundance as an
already normalized protein level per cell.
Highly and lowly expressed genes of E. coli
The E. coli mRNA levels were taken from Lu et al. [23].
Thehighlyexpressedgenesarethetop500genes,and
the lowly expressed genes are the bottom 500 genes
(genes with no mRNA recorded were ignored). How-
ever, for both groups only genes that are longer than
100 codons were used.
Finding the main anti-correlated codons
We used partial correlation to find the codons that con-
tribute the most to the d ecrease in cell fitness. The
highest contributors were filtered according to the fol-
lowing steps. First, find codons that have a negative cor-
relation to the OD (29 codons). We were looking for
codons that caused a decrease in the fitness; hence, only
anti-correlated codons. Second, for all codons left, we
calculated the partial correlation matrix M(i,j) = Partial
correlation (codon i,OD|codonj). Third, find the
minimum absolute value of the partial correlation for
each codon and rank the codons in a descending order
accordingly. This gives us the codons with a correlation
that cannot be explained by correlatio n to other codons
(see Table S4 in Additional file 1 for a list of all codons
with P-value < 0.1).
The codon at the top of the list is UCA, which is anti-
correlated to the OD and its correlation cannot be
explained by other codons. The second contributing
codon is CAU, which has the highest partial correlation
(-0.36, P-value 8.5 × 10
-6
) when controlling for the UCA
codon. This codon is also the second codon in the
ranked list. All other codons have a partial correlation <
0.2 with a P-value ≥ 0.04 when controlling with one of
the two codons (either UCA or CAU).
Calculating codon usage in the genome
ThegenomeforE. coli strain B21 (which was used by
Kudla et al. [13]) was downlo aded from the NCBI
([Refseq:NC_012947], 11 January 2010)]. For each codon
we counted its appearance in all the ORFs and normal-
ized by the total number of codons.
Calculating codon usage in the transcriptome
mRNA levels were taken from Lu et al. [23]. If a gene
did not have a measurement, it was assumed to have a
Navon and Pilpel Genome Biology 2011, 12:R12
/>Page 9 of 10
zero mRNA level. The measurements were done with E.
coli strain K12 MG1655; thus, the sequence used for the
calculation was different from that used for genome
codon usage. The sequence was downloaded from NCBI
([Refseq: NC_000913], 1 April 2010). The contribution
of each gene was calculated by multiplying the mRNA
level measurements for the gene by the codon usage of
the same gene. The contributions of all genes were
summed for each codon and then divided by the total
sum of all codons.
Additional material
Additional file 1: Supplementary methods. This file includes a
discussion regarding codon translation speed, additional tables not
included in the main text, and figure legends for the supplementary
figures in Additional file 2.
Additional file 2: Supplementary figures. Additional figures not
included in the main text.
Abbreviations
CAI: codon adaptation index; GFP: green fluorescence protein; OD: optical
density; ORF: open reading frame; tAI: tRNA adaptation index.
Acknowledgements
We thank the ‘Ideas’ program of the European Research Council (ERC), and
the Ben May Charitable Trust for grant support.
Authors’ contributions
SN carried out all analyses. SN and YP conceived the work, analyzed the
data and wrote the paper.
Received: 23 August 2010 Revised: 18 November 2010
Accepted: 1 February 2011 Published: 1 February 2011
References
1. Sharp PM, Li WH: The codon Adaptation Index - a measure of directional
synonymous codon usage bias, and its potential applications. Nucleic
Acids Res 1987, 15:1281-1295.
2. dos Reis M, Savva R, Wernisch L: Solving the riddle of codon usage
preferences: a test for translational selection. Nucleic Acids Res 2004,
32:5036-5044.
3. Man O, Pilpel Y: Differential translation efficiency of orthologous genes is
involved in phenotypic divergence of yeast species. Nat Genet 2007,
39:415-421.
4. Sharp PM, Li WH: An evolutionary perspective on synonymous codon
usage in unicellular organisms. J Mol Evol 1986, 24:28-38.
5. Tuller T, Carmi A, Vestsigian K, Navon S, Dorfan Y, Zaborske J, Pan T,
Dahan O, Furman I, Pilpel Y: An evolutionarily conserved mechanism for
controlling the efficiency of protein translation. Cell 2010, 141:344-354.
6. Clarke TFt, Clark PL: Increased incidence of rare codon clusters at 5 ’ and
3’ gene termini:implications for function. BMC Genomics 2010, 11:118.
7. Bulmer M: Codon usage and intragenic position. J Theor Biol 1988,
133:67-71.
8. Mitarai N, Sneppen K, Pedersen S: Ribosome collisions and translation
efficiency: optimization by codon usage and mRNA destabilization. J Mol
Biol 2008, 382:236-245.
9. Romano MC, Thiel M, Stansfield I, Grebogi C: Queueing phase transition:
theory of translation. Phys Rev Lett 2009, 102:198104-198300.
10. Greulich : Phase diagram and edge effects in the ASEP with bottlenecks.
Physica A Stat Theor Phys 2008, 387:1972.
11. Dong : Towards a model for protein production rates. J Stat Phys 2007,
128:21.
12. Shaw : Local inhomogeneity in asymmetric simple exclusion processes
with extended objects. J Phys A Mathematical General 2004, 37:2105.
13. Kudla G, Murray AW, Tollervey D, Plotkin JB: Coding-sequence
determinants of gene expression in Escherichia coli. Science 2009,
324:255-258.
14. Welch M, Govindarajan S, Ness JE, Villalobos A, Gurney A, Minshull J,
Gustafsson C: Design parameters to control synthetic gene expression in
Escherichia coli
. PLoS One 2009, 4:e7002.
15. Higgs PG, Ran W: Coevolution of codon usage and tRNA genes leads to
alternative stable states of biased codon usage. Mol Biol Evol 2008,
25:2279-2291.
16. Ran W, Higgs PG: The influence of anticodon-codon interactions and
modified bases on codon usage bias in bacteria. Mol Biol Evol 2010,
27:2129-2140.
17. Ishikura H, Yamada Y, Nishimura S: Structure of serine tRNA from
Escherichia coli. I. Purification of serine tRNA’s with different codon
responses. Biochim Biophys Acta 1971, 228:471-481.
18. Yamada Y, Matsugi J, Ishikura H: tRNA1Ser(G34) with the anticodon GGA
can recognize not only UCC and UCU codons but also UCA and UCG
codons. Biochim Biophys Acta 2003, 1626:75-82.
19. Li X, Hirano R, Tagami H, Aiba H: Protein tagging at rare codons is caused
by tmRNA action at the 3’ end of nonstop mRNA generated in response
to ribosome stalling. Rna 2006, 12:248-255.
20. Hengen P: Purification of His-Tag fusion proteins from Escherichia coli.
Trends Biochem Sci 1995, 20:285-286.
21. Ingolia NT, Ghaemmaghami S, Newman JR, Weissman JS: Genome-wide
analysis in vivo of translation with nucleotide resolution using ribosome
profiling. Science 2009, 324:218-223.
22. Brandt F, Etchells SA, Ortiz JO, Elcock AH, Hartl FU, Baumeister W: The
native 3D organization of bacterial polysomes. Cell 2009, 136:261-271.
23. Lu P, Vogel C, Wang R, Yao X, Marcotte EM: Absolute protein expression
profiling estimates the relative contributions of transcriptional and
translational regulation. Nat Biotechnol 2007, 25:117-124.
doi:10.1186/gb-2011-12-2-r12
Cite this article as: Navon and Pilpel: The role of codon selection in
regulation of translation efficiency deduced from synthetic libraries.
Genome Biology 2011 12:R12.
Submit your next manuscript to BioMed Central
and take full advantage of:
• Convenient online submission
• Thorough peer review
• No space constraints or color figure charges
• Immediate publication on acceptance
• Inclusion in PubMed, CAS, Scopus and Google Scholar
• Research which is freely available for redistribution
Submit your manuscript at
www.biomedcentral.com/submit
Navon and Pilpel Genome Biology 2011, 12:R12
/>Page 10 of 10