Báo cáo y học: "Improving RNA-Seq expression estimates by correcting for fragment bias" doc
Bạn đang xem bản rút gọn của tài liệu. Xem và tải ngay bản đầy đủ của tài liệu tại đây (1.11 MB, 14 trang )
MET H O D Open Access
Improving RNA-Seq expression estimates by
correcting for fragment bias
Adam Roberts
1
, Cole Trapnell
2,3
, Julie Donaghey
2
, John L Rinn
2,3
and Lior Pachter
1,4*
Abstract
The biochemistry of RNA-Seq library preparation results in cDNA fragments that are not uniformly distributed
within the transcripts they represent. This non-uniformity must be accounted for when estimating expression
levels, and we show how to perform the needed corrections using a likelihood based approach. We find
improvements in expression estimates as measured by correlation with independently performed qRT-PCR and
show that correction of bias leads to improved repli cability of results across libraries and sequencing technologies.
Background
RNA-Seq technology offers the possibility of a ccurately
measuring transcript abundances in a sample of RNA by
sequencing of double stranded cDNA [1]. Unfortunately,
current technological limitations of sequencers require
that the cDNA molecules represent only partial frag-
ments of the RNA being probed. The cDNA fragments
are obtained by a series of steps, often including reverse
transcription primed by random hexamers (RH), or by
oligo (dT). Most protocols also include a fragmentation
step, typically RNA hydrolysis or nebulization, or alter-
natively cDNA fragmentation by DNase I treatment or
sonication. Many sequencing technologies also require
constrained cDNA lengths, so a final gel cutting step for
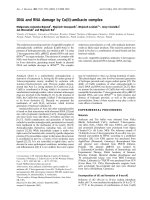
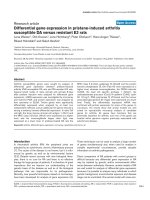
size selection may be included. Figure 1 shows how
some of these procedures are combined in a typical
experiment.
The randomness inherent in many of the preparation
steps for RNA-Seq leads to fragments whose starting
points (relative to the transcripts from which they were
sequenced) appear to be chosen approximately uni-
formly at random. This observation has been the basis
of assumptions underlying a number of RNA-Seq analy-
sis approaches that, in computer science terms, invert
the ‘ reduction’ of transcriptome estimation to DNA
sequencing [2-6]. However, recent careful analysis has
revealed both positional [7] and sequence-specific [8,9]
biases in sequenced fragments. Positional bias refers to a
local effect in which fragments are preferen tially located
towards e ither the beginning or end of transcripts.
Sequence-specific bias is a global effect where the
sequence surrounding the beginning or end of potential
fragments affects their likelihood o f being selected for
sequencing. These biases can affect expression estimates
[10], and it is therefore important to correct for them
during RNA-Seq analysis.
Although many biases can be traced back to specifics
of the preparation protocols (see Figure 2 and [8]), it is
currently not possible to predict fragment distributions
directlyfromaprotocol.Thisisduetomanyfactors,
including uncert ainty in the biochemistry of many steps
and the unknown shape and effect of RNA secondary
structure on certain procedures [10]. It is therefore
desirable to estimate the extent and nature of bias indir-
ectly by inferring it from the data (fragment alignments)
in an experiment. However, such inference is non-trivial
due to the fact that fragment abundances are propor-
tional to transcript abundances, so that the expression
levels of transcripts from which fragments originate
must be taken into account when estimating bias, as
Figure 2 demonstrates. At the same time, expression
estimates made without correcting for bias may lead to
the over- or under-representation of fragments. There-
fore the problems of bias estimation and expression esti-
mation are fundamentally linked, and must be solved
together. Likeli hood based approaches are well suited to
resolving this difficulty, as the bias and abund ance para-
meters can be estimated jointly by maximizing a likeli-
hood function for the data.
* Correspondence:
1
Department of Computer Science, 387 Soda Hall, UC Berkeley, Berkeley, CA
94720, USA
Full list of author information is available at the end of the article
Roberts et al. Genome Biology 2011, 12:R22
/>© 2011 Roberts et al.; licensee BioMed Central Ltd. This is a n open acce ss article distrib uted under the terms of the Creative Commons
Attribution License ( which permits unrestricted use, distribution, and reproduct ion in
any medium, provided the original work is properly cited.
1. fragmentation of RNA
2. random priming to make sscDNA
rst-strand synthesis)
3. construction of dscDNA
(second-strand synthesis)
4. size selection
5. sequencing
6. mapping
RNA molecules
RNA fragments
sscDNA
dscDNA
Gel cutout
RNA sequence
paired-end read
sense
anti-sens
e
short
long
Figure 1 Overview of a typical RNA-Seq experiment. RNA is initially fragmented (1) followed by first-strand synthesis priming (2), which
selects the 3’ fragment end (in transcript orientation), to make single stranded cDNA. Double stranded cDNA created during second-strand
synthesis (3), which selects the 5’ fragment end, is then size selected (4) resulting in fragments suitable for sequencing (5). Sequenced reads are
mapped to opposite strands of the genome (6), and in the case of known transcript or fragment strandedness, the read alignments reveal the 5’
and 3’ ends of the sequenced fragment (see Supplementary methods in Additional file 3). All arrows are directed 5’ to 3’ in transcript orientation.
Roberts et al. Genome Biology 2011, 12:R22
/>Page 2 of 14
Our main result is the development of a likelihood
based approach for simultaneous estim ation of bias para-
meters and expression levels using the likelihood frame-
work of [6]. This complements work of [8,10] where
corrections are developed based on anot her likelihood
model, and also extends their work by incorporating
simultaneous estimation and correction of positional
bias. We demonstrate that our method improves expres-
sion estimates in comparison with independently
obtained qRT-PCR on a benchmark dataset. Using the
same data, we also show that our method improves on
the approaches of [8,10]. RNA-Seq technology is chan-
ging rapidly, and this is e vident in the development of
numerous preparation p rotocols (for a recent review see
[11]) and increasingly longer read lengths from sequen-
cing machines [12]. When assessing the impact of bias
correction, we have therefore included both early RNA-
Seq data of the type that many laboratories might be pro-
ducing with older machines, as well as new er data that
reflects recent protocol choices and demonstrates the
improvements in sequencing technologies. This has
required us to make our methods robust to both single-
and paired-end reads, strand specific and non-specific
protocols, and a variety of priming and fragmentation
methods. One of our main findings is that bias correction
improves the correlation of expression estimates obtained
WebLogo 3.0
0.0
0.5
1.0
density
-10
T
C
G
A
T
C
A
G
T
C
A
G
T
C
G
A
C
T
G
A
-5
T
C
A
G
G
T
A
C
C
G
A
T
C
T
A
G
T
C
G
A
0
C
T
A
G
T
C
A
G
T
C
A
G
A
C
T
G
T
C
A
G
5
T
A
C
G
C
T
G
A
C
T
A
G
C
T
G
A
C
T
G
A
10
C
T
A
G
C
T
G
A
C
T
G
A
WebLogo 3.0
0.0
0.5
1.0
density
-10
G
C
T
A
G
C
T
A
C
G
T
A
C
G
T
A
G
C
T
A
-5
C
G
T
A
G
C
T
A
G
C
A
T
C
T
A
G
C
G
T
A
0
C
T
A
G
C
T
A
G
C
T
G
A
C
A
T
G
C
T
A
G
5
C
T
A
G
C
G
T
A
C
G
T
A
C
G
T
A
C
G
T
A
10
C
G
T
A
C
G
T
A
C
G
T
A
WebLogo 3.0
0.0
0.5
1.0
-10
A
G
C
T
G
A
C
T
G
A
C
T
G
A
C
T
G
A
C
T
-5
G
A
C
T
G
A
C
T
A
G
T
C
A
G
T
C
A
G
T
C
0
G
A
T
C
A
G
T
C
A
G
C
T
G
A
C
T
G
A
T
C
5
G
A
T
C
G
A
T
C
G
A
T
C
G
A
T
C
A
G
T
C
10
A
G
T
C
A
G
T
C
G
A
C
T
WebLogo 3.0
0.0
0.5
1.0
-10
G
C
A
T
G
C
A
T
G
C
A
T
G
C
A
T
G
C
A
T
-5
C
G
A
T
G
C
A
T
G
A
C
T
G
A
C
T
A
G
T
C
0
G
A
C
T
A
G
C
T
G
A
C
T
G
A
C
T
G
A
T
C
5
G
A
C
T
G
A
C
T
G
A
C
T
G
C
A
T
G
C
A
T
10
G
C
A
T
G
C
A
T
G
C
A
T
WebLogo 3.0
0.0
0.5
1.0
density
-10
C
G
T
A
C
G
T
A
C
G
T
A
C
G
T
A
C
G
T
A
-5
C
G
T
A
C
G
T
A
C
G
T
A
C
G
T
A
C
G
T
A
0
C
G
T
A
C
G
T
A
C
G
T
A
C
G
T
A
C
G
T
A
5
C
G
T
A
C
G
T
A
C
G
T
A
C
G
T
A
C
G
T
A
10
C
G
T
A
C
G
T
A
C
G
T
A
3'
f
ragment end5'
f
ragment end
(b)
(c)
(d)
(a)
WebLogo 3.0
0.0
0.5
1.0
-10
G
C
A
T
G
C
A
T
G
C
A
T
G
C
A
T
G
C
A
T
-5
G
C
A
T
G
C
A
T
G
C
A
T
G
C
A
T
G
C
A
T
0
G
C
A
T
G
C
A
T
G
C
A
T
G
C
A
T
G
C
A
T
5
G
C
A
T
G
C
A
T
G
C
A
T
G
C
A
T
G
C
A
T
10
G
C
A
T
G
C
A
T
G
C
A
T
Normalized Count
Expected
Offset from 5' fragment end
Offset from 3' fragment end
Ratio (bias weight)
-10 -5 0 5 10
-
-
-10 -5 0 5 10
-
-
-10 -5 0 5 10
-
-
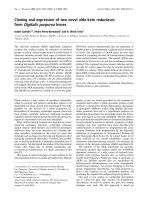
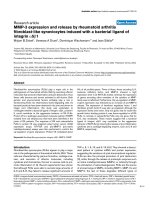
Figure 2 Nucleotide distribution surrounding fragment ends and calculation of bias weights. (a) Sequence logos showing the distribution
of nucleotides in a 23 bp window surrounding the ends of fragments from an experiment primed with ‘not not so random’ (NNSR) hexamers
[11]. The 3’ end sequences are complemented (but not reversed) to show the sequence of the primer during first-strand synthesis (see Figure 1).
The offset is calculated so that zero is the ‘first’ base of the end sequence and only non-negative values are internal to the fragment. Counts
were taken only from transcripts mapping to single-isoform genes. (b) Sequence logo showing normalized nucleotide frequencies after
reweighting by initial (not bias corrected) FPKM in order to account for differences in abundance. (c) The background distribution for the yeast
transcriptome, assuming uniform expression of all single-isoform genes. The difference in 5’ and 3’ distributions are due to the ends being
primed from opposite strands. Comparing (c) to (a) and (b) shows that while the bias is confounded with expression in (a), the abundance
normalization reveals the true bias to extend from 5 bp upstream to 5 bp downstream of the fragment end. Taking the ratio of the normalized
nucleotide frequencies (b) to the background (c) for the NNSR dataset gives bias weights (d), which further reveal that the bias is partially due
to selection for upstream sequences similar to the strand tags, namely TCCGATCTCT in first-strand synthesis (which selects the 5’ end) and
TCCGATCTGA in second-strand synthesis (which selects the 3’ end). Although the weights here are based on independent frequencies, we found
correlations among sites in the window and take these into account in our full model to produce more informative weights (see Supplementary
methods in Additional file 3). A similar figure to this for the standard Illumina Random Hexamer protocol and plots similar to (d) for all datasets
in the paper can be found in Figures S1 and S2 of Additional file 1 respectively.
Roberts et al. Genome Biology 2011, 12:R22
/>Page 3 of 14
from sequence data generated using different sample pre-
parations and different sequencing technologies.
Results and Discussion
Estimating fragment bias in existing protocols
Fragment counts in an RNA-Seq experiment are deter-
mined by two different phenomena: fragments originat-
ing from highly exp ressed transcripts will appear more
often in the data than those originating from lower-
expressed transcripts, and library preparations include
biases that may preferentially select some potential frag-
ments over others. By fragment bias we mean only the
over- or under-representation of fragments due to
sequence-specific or positional bias as discussed in the
Background. Because expression levels also affect frag-
ment abundances, it is necessary to jointly estimate
transcript abundances and bias parameters in order to
properly learn the bias directly from RNA-Seq data.
This issue is illustrated by example in Figure 2 where
the need for joint estimation of bias parameters and
expression values is evidenced by comparison of the
raw counts of bases at the starts/ends of fragments
(panel a) and the adjusted counts normalized by the
abundances of transcripts (panel b). The latter calcula-
tion is affected by the bias p arameters, so that joint
estimation is required. We expanded the likelihood fra-
mework described in [6] in order to perform such
parameter estimation (see Materials and methods),
resulting in ‘ learned’ bias weights (panel d Figure 2)
that were used to adjust expected fragment counts in
the computation of abundances using our likelihood
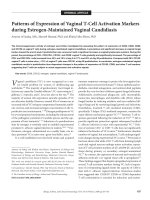
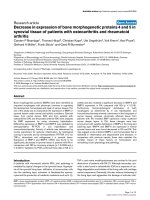
model. Figure 3 shows an example of how well these
bias estimates capture the over- and under-representa-
tions of reads at different positions of a transcript,
based on its sequence.
Validation by comparison to alternative expression assays
We emphasize that our goal was not to validate RNA-
Seq per se, but rather to show that bias correction
improves expression estimation. Therefore, in interpret-
ing the correlations throughout the paper, we focused
on improvements in correlation with bias correction
and not on the a bsolute value. In this regard, we report
most of our results as fr action discrepancy explained,
which we calculated by dividing the change in R
2
after
bias correction by the difference of the initial R
2
from 1
(a perfect correlation). Selected correlation plots can be
foundinFigureS3ofAdditionalfile1andallraw
expression data in Additional file 2. Furthermore, we
mention that we observed that correlation results were
sensitive to the extent of filtering of low abundance
fragments and we therefore attempted to eliminate fil-
tering in the experiments we performed (see Materials
and methods for more detail).
A major problem with valida ting RNA-Seq expression
estimates is that there is no clear ‘gold standard’ for
expression estimation. Comparison of RNA-Seq to
microarrays has suggested that the former technology is
more accurate than the latter [13]. We examined the
recently published NanoString nCounter g ene expres-
sion system [14], but noticed many unexplainable out-
liers and high variance betwe en technical replicates (see
Figure S4 of Additional file 1 and data in Additiona l file
2). Quantitative reverse transcription PCR (qRT-PCR)
has served as a benchmark in numerous studies but it is
not a perfect expression measurement assay [15], and it
is therefore a priori unclear which technology currently
produces the most accurate expression estimates. Never-
theless, at present we believe it to be the best measure
of expression aside from, perhaps, RNA-Seq itself. Due
to the previously demonstrated superiority of RNA-Seq
over microarrays, and the problems with NanoString,
we performed all our benchmarking with respect to
qRT-PCR.
We began by comparing the expression estimates on
the Microarray Quality Control (MAQC) Human Brain
Reference (HBR) dataset, which includes 907 transcripts
with uniquely mapping TaqMan qRT-PCR probes [16],
with RNA-Seq data from the same sample sequenced by
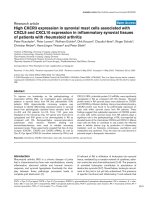
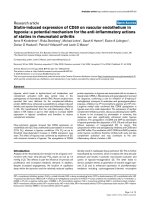
Illumina (SRA012427) [17] (Figure 4). We examined the
correlation of the Cufflinks output with the qRT-
PCR expression data and observed an increase of R
2
from 0.753 before correction to 0.807 after correction.
We examined the basis for change in correlation by
further investigating, for each transcript, whether its
expression estimate increased or decreased after bias
correction , and by how much. The arrows in Figure 4
show the direction and extent of expression change with
correction, and the overall fold-change distribution.
Many fragments show large changesinexpressionwith
a median absolute fold change of 1.5 (Figure 4b). To
establish the significance of the improvement in correla-
tion, we performed a permutation test where we chan-
ged the expression estimates of transcripts randomly
according to the fold change distribution in Figure 4b.
We obtained a P-value of 0.0007, meaning that the
improvement in R
2
our correction accomplishes is
high ly signi ficant. Together, these results show that bias
correction may dramatically affect expression estimates
via both increases and decreases of expression values,
and that these changes provide an overall improvement
in abundance estimates.
Comparison with previous methods
In [8], a method for bias correction is proposed that is
based on correcting read counts for transcripts accord-
ing to the bias learned for patterns at the start of reads
(normalized using sequences in the interior of reads).
Roberts et al. Genome Biology 2011, 12:R22
/>Page 4 of 14
This approach uses less information than our method,
as it is restricted to learning bias within the read
sequence, and cannot capture bias surrounding the start
site. Furthermore, count-based methods do not fully
exploit the information available in paired-end reads
which allow for t he determination of fragment length.
Fragment length can help in assigning ambiguously
mapped fragments to transcripts and our method takes
advantage of this. On the other hand, since read counts
have been promoted as an acceptable way to measure
abundance [18], we compared the method to ours using
the MAQC qRT-PCR data from the previous section.
Figure 5 shows the results of the method of [8], both
before and after bias correction (R
2
= 0.711 before and
R
2
= 0.715 after correction). To obtain these results we
used the software package Genominator[8], following
the guidelines in the documentation, with the exception
that bias was learned separately for ea ch chromosome,
as the software was not able to load an entire genome
into memory. More details are provided in the Materials
and methods section.
We also compared our approach to the mseq method
in [10]. We again used the MAQC H BR qRT-PCR dat a
and this time prepared the sequences and learned para-
meters for models following the suggested guidelines in
[10], that is we trained the parameters of a MART
model for bias by learning from the 100 most expressed
transcripts in the experiment, and then tested on the set
of 907 transcripts with uniquely mapping TaqMan
probes. In this case, we observed an uncorrecte d R
2
=
0.730 and corrected R
2
= 0.755. Note that the even
though the expression was again calculated using
Read countsBias weight
NM
_004684
Offset from start of transcript
Figure 3 Bias correction within transcripts. An example showing the effect of bias correction on the read counts for human transcript
NM_004684. The top panel shows raw read counts (number of 3’ ends of fragments at each location), and the bottom panel shows the
product of the bias parameters (total bias weight defined in the Supplementary methods in Additional file 3) at the same locations. We correctly
identify bias at different positions and can therefore correct for the non-uniformity. Note that the bias parameters were learned from the entire
dataset excluding reads mapped to this transcript in order to cross-validate our results. The RNA-Seq for the experiment was performed with the
NSR protocol [21], which is why 3’ counts were used instead of 5’.
Roberts et al. Genome Biology 2011, 12:R22
/>Page 5 of 14
counts, the initial correlation of mseq is better than that
of Genominator due to the fact that the implementa-
tion in [10] required us to remap the reads directly to
the transcript sequences, which is presumably more
accurate than relying on spliced mapping.
We suspect that the overall inferior results of both the
Genominator and mseq in comparison to Cuf-
flinks are due in part to the fact that the bias para-
meters cannot be learned from raw read counts, but
must be normalized by the expression values of the
transcripts from which the reads originate (Figure 2).
For example, in [10], bias parameters are learned from
what are estimated to be the most highly expressed
transcripts based on RPKM, but these are likely to al so
be the most positively biased transcripts, and are there-
fore not representative in terms of their sequence con-
tent.Wealsobelievethat,aswearguedin[6],itis
important to ac count for fragment lengths in estimating
expression, and read count based expression measures
do not use such information. Another issue affecting
Genominator is that instead of computing the
expected read count as is d one in Cufflinks and
mseq, the observed read counts are adjusted. This
means that in positions lacking read alignments, there is
no correction of bias. We believe this may partially
expl ain the improved performance of mseq in compari-
son to Genominator.
Technical replicates
A recurring worry with RNA-Seq has been that repeated
experiments, possibly based on different libraries or per-
formed in different laboratories, may be variable due to
experimental ‘noise’. We investigated these effects start-
ing with an e xploration of the co rrelation between
Normalized TaqMan expression
Log fold change
Cufflinks FPKMFrequency
(
a
)
(b)
Figure 4 Correlation between RNA-Seq and qRT-PCR. (a) Expression estimates before bias correction (tail of arrows) and after correction
(points of arrows) for the SRA012427 dataset compared to qRT-PCR values for the same transcripts. Red arrows show decrease in expression
after correction and blue an increase. Note that we have zoomed in on lower-expression transcripts (the majority) for clarity. (b) Distribution of
log-fold change in expression after bias correction.
Roberts et al. Genome Biology 2011, 12:R22
/>Page 6 of 14
technical replicates before and after bias correc tion. We
define technical replic ates to be the sequencing of two
different libraries that have been prepared using the
same protocol from a single sample. This differs slightly
from some previous uses; in particular, technical replica-
tionhasalsoreferredtotwosequencingexperiments
from the same library. Such replicates have already been
shown to exhibit very little variability [18,19].
We postulated that the differences between expression
estimates from two different librarie s should be reduced
after bias correction . We tested this hypothesis in a ser-
ies of analyses whose results are shown in Figure 6.
First, we examined libraries prepared in two different
experiments from the same MAQC Universal Human
Reference (UHR) sample. In the first experiment [20],
which we will refer to by its accession SRA008403, the
sample was sequenced from one library preparation. In
the second experiment [19], which we will refer to as
SRA010153, the sample was sequenced in four separate
library preparations. Although the same protocol was
used in all five replicates, the learned bias weights differ
somewhat between the data produced by the two labs
(see Figure S2 in Additional file 1).
Figure 6 shows how correlations of the replicates with
qRT-PCR and each other were affected by bias correc-
tion. Although the method does improve the pairwise
correlations between different library preparations
within SRA010153, the initial correlation is already so
high (average R
2
> 0.96) that we only show the average
pairwise correlations against qRT-PCR and the
SRA008403 dataset. The greater correlation among t he
SRA010153 replicates as compared to the correlation
between them and SRA008403 further indicates that
bias is more similar when the protocol is carried out by
thesamelab,presumablybythesameperson.Biascor-
rection clearly recovers much of the differences in quan-
tification between the replicat es introduced by sequence
and positional bias. Furthermore, as in the initial valida-
tion example, the correction brings both sets closer in
line with the qRT-PCR standard.
Library preparation methods
In Figure 7 we demonstrate our ability to correct bias spe-
cific to librari es prepared using different protocols. For
this experiment, we tried our method on several librari es
from a study comparing strand-specific protocols
(SRA020818) using the same yeast sample [11], as well as
a dataset generated using the ‘not so random’ (NSR) prim-
ing protocol on the human MAQC HBR sample [21]. We
compared all of these datasets with a standard Random
Hexamer ( RH) cont rol fo r the given sample. Note that
although the control (RH) and dUTP libraries have the
Genominator mse
q
Cufflinks
Corrected
Initial
R
2
0.5 0.6 0.7 0.8 0.9 1.
0
Figure 5 Comparison with previous methods.Acomparisonof
our method ( Cufflinks) with Genominator[8] and mseq[10].
The y-axis shows the R
2
value for the correlation between
uncorrected (green) and bias corrected (orange) RNA-Seq
expression estimates and qRT-PCR for the three methods.
Correlation plots for these data can be found in Figure S3 of
Additional file 1.
Sequence specific + positional
Sequence specific
Fraction explained discrepancy
0.0 0.1 0.2 0.3 0.4
SRA008403 SRA010153 SRA008403
vs. qPCR vs. qPCR vs. SRA01015
3
Figure 6 Variable technical replicates. Results of correlation tests
showing improvement after bias correction for technical replicates.
Fraction Explained Discrepancy was calculated by dividing the
change in R
2
after bias correction by the difference of the initial R
2
from one (a perfect correlation). Note that when two RNA-Seq
datasets are compared, the correction in the legend was applied to
both. The pairwise correlations of the four SRA010153 replicates
versus qRT-PCR and SRA008403, respectively, were averaged for the
figure. Even though the same RH priming protocol was used in
both labs, the bias differs slightly (see Figure S2 of Additional file 1)
between the preps, which is why our correction method was able
to improve the correlation.
Roberts et al. Genome Biology 2011, 12:R22
/>Page 7 of 14
same sequence bias (see Figure S2 in Additional file 1) and
near-perfe ct initial correlation (R
2
>0.99),theremaining
discrepancy is reduced by positional bias correction.
BecausetheNSRdatasetwassequencedfromthe
MAQC HBR sample, we were also able to compare it to
theqRT-PCRstandard.Wefoundthatourmethod
explained 33.5% of the discrepancy between an initial
estimation and qRT-PCR.
Sequencing platforms
Previous studies on bias in RNA-Seq have focused
on experiments performed with Illumina sequencers.
To investigate whether bias persists with other prep and
sequencing technologies, we examined bias in a SOLiD
experiment that sequenced b oth MAQC samples using
the standard whole transcriptome (WT) protocol. We
saw clear signs of both sequence-specific and positional
bias that differed from the other protocols we had
examined (see Figure S2 of Additional le 1).
We next compared the expression estimates for the
SOLiD dataset with one from Illumina (accession
SRA012427) before and after bias correction. In order to
illustrate that our improvement in correlation does not
come solely from correcting bias in the Illumina dataset,
we tested whether there was some improvement from
correcting o ne dataset at a time, as compared to
simultaneous correction for both platforms. We found
an increase of R
2
from 0.74 to 0.88 (Illumina correction)
and 0.85 (SOLiD correction) compared to 0.94 for both.
These results are summarized in Figure 8. While one
cannot draw general conclusions based on a single
experiment, we note that our approach to quantifying
bias should be useful in future studies that aim to quan-
titatively compare the bias among different sequencing
platforms.
Conclusions
Bias correction improves expression estimates
Our results confirm that bias correction improves
exp ression estimates and should be used to correct bias
introduced in library preparations and by sequencing
technologies. We note that there is great variability in
the extent of bias among protocols, and bias correction
can dramatically affect expression estimates even in pro-
tocols of choice (for example the dUTP protocol cur-
rently favored by the Broad Institute [11]).
Implications for differential expression
It is particularly important to consider bias correction in
the context of differential expression analysis. This can
refer to the comparison of expression levels among tran-
scripts in a single experiment (for example alternative
isoforms of a gene), to the agglomeration of data pro-
duced by different laboratories, or to the comparison of
expression among biological replicates.
We have shown that bias varies between library preps,
even when the same protocol is used. However, our
results indicate t hat this variance is much greater when
either different protocols or technologies are used.
Therefore, while bias correction can be expected to
show small improvements in the former case, it is cru-
cial in modern experiments that seek to combine and
compare output from multiple library preps using the
same or different protocols. For example, in the Droso-
phila modENCODE transcriptome experiment described
in [22], both SOLiD and Illumina libraries were used at
multiple time points during development. To estimate
the improvement that could have been gained in the
modENCODE experiment by using our correction, we
ran Cuffdiff (the differential expression analysis tool
packaged with Cufflinks) on the same samples used
above to compare bias in the Illumina and SOLiD tech-
nologies.Wefounda46%decreaseinthenumberof
differentially expressed transcripts output by Cuffdiff
when bias correction was enabled.
Choice of model
We have developed a bias correction procedure based
on a fragment model for RNA-Seq [6], in contrast with
the site model of [10]. We note that our choice is based
Sequence specific + positional
Sequence specific
Fraction explained discrepancy
0.0 0.1 0.2 0.3 0.4 0.5 0.
6
dUTP Illumina RNA NNSR NSR
li
g
ation li
g
ation
Figure 7 Variable library preparations. Results of correlation tests
showing improvement after bias correction of datasets generated
using different library prep methods, all of which are strand-specific.
The first four protocols are described in [11] and the final in [21]. All
datasets were compared against a control that was generated using
the standard Illumina RH protocol. The first four datasets used the
control from [11] with the same yeast sample. The last dataset (NSR)
was compared against the HBR dataset from SRA010153 since it is
also consists of single-end reads.
Roberts et al. Genome Biology 2011, 12:R22
/>Page 8 of 14
partly on the observation in [10] that even after bias
correction, variability in the counts of reads at individual
sites differ considerably from the variance estimate
obtained from the binomial model. Thus, it may be that
the model of [10] is not robust in multiple isoform
genes where few sites may distinguish isoforms. It is
likel y, however , that as R NA-Seq protocols improve and
are better understood, site models will be preferable due
to their improved resolution.
The choice of model has an important implication for
the impact of positional bias correction: In our fragment
model, positional bias correction without sequence-
specific correction does not affect relative expression
estimates. However, positional bias correction in
Figure 8 Bias in different sequence technologies. Results of correlation tests showing improvement after bias correction of datasets
generated using different sequencing technologies. The Illumina dataset is SRA012427 (x-axes) and the SOLiD data is SOLiD4_ HBR_PE_50x25 (y-
axes). Both used the same MAQC HBR sample. Red axes and lines denote uncorrected FPKM values and blue corrected, while purple regression
lines denote a comparison between corrected and uncorrected values. Both datasets are being corrected for different biases, which causes their
expression estimates to become more correlated. Note that the plot is zoomed in on the lower abundance transcripts for clarity but captures
over 98% of those in the experiment.
Roberts et al. Genome Biology 2011, 12:R22
/>Page 9 of 14
multiple isoform genes, or when coupled with sequence-
specific correction, can affect relative expression
estimates (Figure 9). Validation of the improvement in
expression estimates in multiple isoform genes when
taking positional bias into account is complicated by the
difficulty in selecting isoform specific primers, and is
beyond the scope of this paper. It is important to note
that in the site model, positional bias correction can
affect relative expression estimates even in single iso-
form genes because the location of fragments within
transcripts directly affects the likelihood function.
GC content and bias
Previous RNA-Seq investigations have revealed correla-
tions between expression levels and GC content, and cor-
rec tions have been proposed to ‘normalize ’ the data with
respect to this effect [23]. When e xamining the
sequence-specific bias profiles (see Figure S2 of Addi-
tional file 1) we noticed GC effects in the estimated para-
meters and so we investigated the relationship between
sequence-specific bias correction and GC content.
To make the comparison, we defined the bias of a
transcript to be the log fold change in effective length,
which is a direct measure of the extent of correction of
expression estimate in single isoform genes when incor-
porating bias correction.
Figure 10 shows the relationship between transcript
bias and GC content in two different experiments. In
panel a, an example from human RNA-Seq (SRA012427)
the correlation is very strong, and shows that GC correc-
tions may be proxies for sequence-specific bias correc-
tion. On the other hand, GC cont ent may not always be
an effective marker for bias, as shown in panel b from
yeast (SRA020818_RH).
1.0
0.5
Single isoform
Multiple isoforms
D
ens
i
ty
Log effective length fold change
Figure 9 Positional bias correction effect on expression.This
figure shows the effective length fold change due to positional bias
correction for the SRA012427 dataset. So that the parameters would
be consistent for all transcripts, we have limited the analysis to
transcripts with length greater than 2,433, which is the largest of the
5 length bins we use for measuring positional bias. As expected, all
single isoform genes are adjusted in the same way, whereas isoform
deconvolution is altered based on the difference in relative position
within a transcript for a read that maps to multiple isoforms.
Figure 10 Correlation of GC content with measured bias. Panel a shows an example from human and panel b from yeast. Since the log fold
change in effective length does not capture the full bias measurement for multiple isoform genes, the plots are limited to those with single
isoforms. GC content appears to be correlated with our sequence bias measurements in some datasets, but not in others. GC content alone is
not always a good proxy for fragment end bias.
Roberts et al. Genome Biology 2011, 12:R22
/>Page 10 of 14
We concluded that although normalization of expres-
sion values by GC content may be a simple way to
remove some bias, it may well be a p roxy for other
effects rather than of inherent significance.
Implementation
RNA-Seq data processing pipelines require multiple steps
that include read mapping, transcript assembly, expression
estimation and differential expression analysis. A difficulty
with analysis is that many of these steps are closely related,
and improvements in one area can be leveraged in another
only if properly integrated. We have shown that in the
case of bias correction, estimation of parameters together
with abundances can improve expression estimates, and
these can in turn affect differential expression ana lyses,
mapping probabilities, and even assemblies.
In order to maximize the benefits of bias correction
throughout the RNA-Seq analysis pipeline, we have
incorporated it into the Cuf flinks RNA-Seq analysis
suite [6], and have pre-configured the software for speci-
fic protocols so that users can reap the benefits of bias
correction for both stranded a nd unstranded protocols,
as well as single- and paired-end reads. The software is
freely available [24] and is distributed open source
under the Boost Software License, version 1.0.
Materials and methods
Parameter estimation and inference
Due to the added sensitivity in o ur model to the location
of fragment ends, we now rely on an empirical fragment
length distribution whenever possible, as opposed to the
Gaussian approximation in [6]. The fragment length distri-
bution is estimated in one of seve ral ways, depending on
what information is provided. If an annotation and paired-
end read mappings are given, fragment mappings to single
isoform genes are used to determine an empirical distribu-
tion. If no annotation is provi ded, but paired-end read
mappings are provided, sufficiently large (≥ 1,000 bp)
ranges are found where no fragments have spliced map-
pings. The mappings in these ranges are used to determine
an empirical distribution. If no paired-end fragments are
available or not enough are found in these ranges, we use
a truncated Gaussian where all lengths less than the mini-
mum read length in the dataset are set to zero probability
and the remaining distribution is renormalized. The mean
and standard deviation are set according to the distribu-
tion specified by the SRA entry, or to 200 and 80, respec-
tively, if the information is unavailable.
The likelihood in our model is a function of the rela-
tive transcript abundances (r), consisting of the abun-
dances for individual transcripts r
t
such that
t
∈
T
ρ
t
=
1
(here T denotes the set of all transcripts). In order to
simplify computations, we estimate the relative abun-
dances for overlapping sets of transcripts instead of
directly estimating the parameters r
t
. We d efine a locus
to be a genomic region containing a set of overlapping
transcripts (typically isoforms of a gene) and then write
the transcript abundance as r
t
= b
g
g
t
where b
g
is the
relative abunda nce of the locus g in which t is con-
tained, and is multiplied by a factor g
t
that determines
the proportion of each transcript within the locus. We
denote the set of all loci by G (for more details see the
Supplementary methods of [6]). Our updated likelihood
model, whose full derivation is given in the Supplemen-
tary methods in Additional file 3 is then given by:
L(ρ|F)=
⎛
⎝
g∈G
β
X
g
g
⎞
⎠
⎛
⎝
g∈G
⎛
⎝
f ∈F:f ∈g
t∈g
γ
t
· D(t, f) ·
b(t, e
5
(t, f ),e
3
(t, f ))
B(t, I
t
(f ))
⎞
⎠
⎞
⎠
where F is the set of fragments, X
g
is the number of
fragments with alignments to locus g, I
t
(f ) is the implied
length of a fragment f assuming it originated from a
transcript t (this is needed because only the ends of
fragments are sequenced), D(t , f ) is the probability of
observing a fragment of length I
t
( f ) at a known position
in a transcript, and the term
b(t, e
5
(t,
f
), e
3
(t,
f
))
B
(
t, I
t
(
f
))
is the
probability of selecting a fragment of a specific length
within a given transcript, based on the bias weights at
its 5’ and 3’ end points.
The bias weight b(t, i, j) factors as
b
s
5
(t , i) · b
s
3
(t , j) · b
p
5
(t , i) · b
p
3
(t , j
)
where i and j are the 5’
and 3’ endpoints, respectively, of a fragment mapped to
transcript t.The
b
s
5
and
b
s
3
weights measure sequence-
specific bias and are found by calculating the ratio of
the probability of the sequence surrounding the frag-
ment end under the biased model to the uniform (null)
model. Note that we model both ends separately due to
the differences in sequence selectivity between the prim-
ing steps during first- and second-strand synthesis. In
our method, these probabilities are actually learned
from the data using a variable length Markov model
[25] to capture dependencies between positions in the
sequence. Complete details are in the Supplementary
methods in Additional file 3.
The
b
p
5
and
b
p
3
weights measure the 5’ and 3’ positional
biases, respectively. In [7] it was shown that positional
effects depend on transcri pt length, so we modeled posi-
tional effects u sing 100 = 20 × 5 parameters, with 5 sets
of parameters for different transcript lengths (see Figure
S2 of Additional file 1). For each range of transcript
lengths, the length is divided into 20 wi ndows, each with
its own parameter that reflects the probability that the 5’
or 3’ end of a fragment lies there as opposed to elsewhere
on the transcript. The ratio of these probabilities under
the biased model to the uniform (null) model is repre-
sented by
b
p
5
and
b
p
3
, respectively.
Roberts et al. Genome Biology 2011, 12:R22
/>Page 11 of 14
The parameters that need to be estimated in the
likelihood function are the abundances r and the bias
parameters described above. We estimate the para-
meters using coordinate ascent. The model is linear in
the r parameters for fixed bias parameters, and we
maximize them as in [6]. For fixed r,thebiaspara-
meters can be maximized as described in the Supple-
mentary methods in Addition al file 3. Therefore, we
employ an iterative coordinate ascent procedure that,
in effect, jointly maximizes all parameters. We found,
however, that the gains in likelihood after the first
iteration do not justify the time requirements, and we
therefore limit all experiments to a single iteration. An
initial r
0
estimation with uniform bias weights seeds
the maximization of the b ias paramete rs. r is then
maximized using these bias parameters, and is used as
the final abundance estimate.
NanoString experiment
Cell culture/RNA prep and NanoString: Mouse embryo-
nic stem cells (V6.5) were co-cultured with irradiated
mouse embryonic broblasts as described in [26]. mESCs
were passaged once on gelatin alone before RNA extrac-
tion. Total RNA was extracted from mESCs using the
protocol specified in the RNeasy kit (Qiagen). 100 ng of
total RNA was hybridized for 17 hours with lincRNA
codeset in technical triplicate. The hybridized material
was loaded into the nCounter prep station followed by
quantification on the nCounter Digital Analyzer as out-
lined by NanoString Technologies in their Total RNA
Gene Expression nCounter protocol.
RNA-Seq data
All accession numbers refer to data available from the
short read archive (SRA) [27]. The SOLiD data was
downloaded from [28]. The NSR d ata was provided by
the authors of [21].
Mapping and annotation
To allow for consistent comparison across datasets, all
read mapping was carried out using TopHat 1.1.0 [29]
with supplied annotations and the –no-novel-juncs
option set, except for the SOLiD datasets, which were
only available in a pre-aligned form with mapping by
BioScope 1.2.1. All expression estimation and bias
correction were done using Cufflinks 0.9.3 with the
same annotation and reference sequence as TopHat.In
the case of strand-specific libraries, the correct
– library-type option was used as per the Cuf-
flinks manual. For the mouse dataset in the Nano-
String experiment, the RefSeq refGene annotation for
assemb ly NCBI37/mm9 was used, and was downloaded
from the UCSC Genome Browser. For all human data-
sets, the RefSeq refGene annotation for assembly
NCBI36/hg 18 [30] was used, and was downloaded from
the UCSC Genome Browser. The only filtering was to
remove non-chromosomal and ‘random’ contigs. After
quanti cation with Cufflinks, the subset of tran-
scripts with 1-to-1 mappings to the TaqMan qRT-PCR
probes were selected (as listed in the supplement to
[16]) to be used in the correlation tests. All yeast data-
sets used the Ensembl Saccharomyces cerevisiae annota-
tion, release 59, which was downloaded from the
Ensembl website [31]. Mitochondrial, non-coding, and
ribosomal RNA sites were masked in the annotation.
All remaining transcripts were used in our correlation
tests.
Comparison with previous methods
Genominator
We downloaded the Genominator package version
1.4.0 using Bioconductor. We then followed the instruc-
tors provided with the Genominator for ‘Working
with the ShortRead Package’. We used the same annota-
tionsasinourCufflinks experiment to define the
ranges and transcript lengths for the RPKM calculations.
We also used the same read mapping as was used for
Cufflinks. Due to memory limitations of the soft-
ware, we were forced to learn the weights separatel y for
each chromosome.
mseq
We downloaded the mseq package version 1.1 from the
Comprehensive R Archive Network (CRAN). Due to the
specific mseq input format requirements, we remapped
the reads using Bowtie version 0.12.5 [32] with the
– best option and default parameters otherwise. The
mapping was then converted to the ms eq input format
using a custom Python script we wrote and that is pro-
vided in Additional file 4. We followed the instructions
of [10] and trained the MART model with suggested
parameters on the top 100 expressed transcripts, which
we determined by computing the RPKM for every tran-
script. The UTR regions and an additional 100 bases on
the ends of transcripts were excluded from the training.
The surrounding sequence window was set to be 8
bases before and 12 bases after the first nucleotide in
the read, which matches the window of our variable
length Markov model and is where we observed bias for
the dataset. The resulting sequence preferences were
used to find the corrected RPKMs.
Statistical analysis
All correlation tests used least squares line ar regression,
as implemented in the R programming language. We
found the P-value in Section 2.2 by sampling (with repla-
cement) from the empirical dist ribution of fold changes
50,000 times for each transcript in order to generate
50,000 randomly adjusted sets of expression values.
Roberts et al. Genome Biology 2011, 12:R22
/>Page 12 of 14
Of these, only 35 showed correlations better than the
values that were corrected by our method (R
2
= 0.81).
Additional material
Additional file 1: Supplementary figures. Additional figures referred to
in the text.
Additional file 2: Raw expression data. Raw expression estimates used
in comparisons, including the NanoString expression measurements.
Additional file 3: Supplementary methods. More detail on the
likelihood model.
Additional file 4: Script for mseq format conversion. Python script
that converts standard SAM and FASTA input into the mseq input
format.
Abbreviations
bp: base pair; CRAN: Comprehensive R archive network; FPKM: Fragments
per kilobase per million reads sequenced; HBR: Human brain reference;
MAQC: Microarray quality control; NNSR: Not not so random (hexamer
priming); NSR: Not so random (hexamer priming); qRT-PCR: Quantitative
reverse transcription polymerase chain reaction; RH: Random hexamer
(priming); RPKM: Reads per kilobase per million reads sequenced; SRA: Short
read archive; UHR: Universal human reference; WT: whole transcriptome.
Acknowledgements
We thank Joshua Levin and Mitchell Guttman for their help with the
NanoString experiment. Anat Caspi was instrumental in helping us obtain
the SOLiD data. Adam Roberts was supported by an NSF graduate research
fellowship.
Author details
1
Department of Computer Science, 387 Soda Hall, UC Berkeley, Berkeley, CA
94720, USA.
2
Broad Institute, 7 Cambridge Center, Cambridge, MA 02142,
USA.
3
Department of Stem Cell and Regenerative Biology, 7 Divinity Avenue,
Harvard University, Cambridge, MA 02138, USA.
4
Departments of
Mathematics and Molecular & Cell Biology, 970 Evans Hall, UC Berkeley,
Berkeley, CA 94720, USA.
Authors’ contributions
AR, CT and LP developed the bias correction approach. AR implemented the
improvements to the Cufflinks software. JLR provided reagents and
guidance. JD performed the NanoString experiment. AR performed the
analysis. AR and LP wrote the paper. All authors read and approved the final
manuscript.
Received: 4 December 2010 Revised: 20 February 2011
Accepted: 16 March 2011 Published: 16 March 2011
References
1. Marguerat S, Bähler J: RNA-Seq: from technology to biology. Cellular and
Molecular Life Sciences 2010, 67:569-579.
2. Jiang H, Wong W: Statistical inferences for isoform expression in RNA-
Seq. Bioinformatics 2009, 25:1026-1032.
3. Li B, Ruotti V, Stewart R, Thomson J, Dewey C: RNA-Seq gene expression
estimation with read mapping uncertainty. Bioinformatics 2010,
26:493-500.
4. Nicolae M, Mangul S, Măndoiu I, Zelikovsky A: Estimation of alternative
splicing isoform frequencies from RNA-Seq data. Algorithms in
Bioinformatics 2010, 6293:202-214.
5. Paşaniuc B, Zaitlen N, Halperin E: Accurate estimation of expression levels
of homologous genes in RNA-seq experiments. In Research in
Computational Molecular Biology. Edited by: Berger B. Berlin/Heidelberg:
Springer; 2010:397-409, [Lecture Notes in Computer Science, vol 6044.].
6. Trapnell C, Williams B, Pertea G, Mortazavi AGK, van Baren M, Salzberg S,
Wold B, Pachter L: Transcript assembly and quantification by RNA-Seq
reveals unannotated transcripts and isoform switching during cell
differentiation. Nature Biotechnology 2010, 28:511-515.
7. Bohnert R, Rätsch G: rQuant.web: a tool for RNA-Seq-based transcript
quantitation. Nucleic Acids Research 2010, 38:W348-W351.
8. Hansen K, Brenner S, Dudoit S: Biases in Illumina transcriptome
sequencing caused by random hexamer priming. Nucleic Acids Research
2010, 38:1-7.
9. Srivastava S, Chen L: A two-parameter generalized Poisson model to
improve the analysis of RNA-seq data. Nucleic Acids Research 2010, 38:
e170.
10. Li J, Jiang H, Wong W: Modeling non-uniformity in short-read rates in
RNA-Seq data. Genome Biology 2010, 11:R50.
11. Levin J, Adiconis X, Yassour M, Thompson D, Guttman M, Berger M, Fan L,
Friedman N, Nusbaum C, Gnirke A, Regev A: Development and evaluation
of RNA-Seq methods. Genome Biology 2010, 11:P26.
12. Kircher M, Kelso J: High-throughput DNA sequencing - concepts and
limitations. BioEssays 2010, 32:524-536.
13. Bradford J, Hey Y, Yates T, Li Y, Pepper S, Miller C: A comparison of
massively parallel nucleotide sequencing with oligonucleotide
microarrays for global transcription profiling. BMC Genomics 2010, 11:282.
14. Geiss G, Bumgarner R, Birditt B, Dahl T, Dowidar N, Dunaway D, Fell H,
Ferree
S, George R, Grogan T, James J, Maysuria M, Mitton J, Oliveri P,
Osborn J, Peng T, Ratcliffe A, Webster P, Davidson E, Hood L, Dimitrov K:
Direct multiplexed measurement of gene expression with color-coded
probe pairs. Nature Biotechnology 2008, 26:317-325.
15. Fleige S, Pfaffl M: RNA integrity and the effect on the real time qRT-PCR
performance. Molecular Aspects of Medicine 2006, 27:126-139.
16. Shi L, Reid L, Jones W, Shippy R, Warrington J, Baker S, Collins P, de
Longueville F, Kawakasi E, Lee K, Luo Y, Sun Y, Willey J, Setterquist R,
Fischer G, Tong W, Dragan Y, Dix D, Frueh F, Goodsaid F, Herman D,
Jensen R, Johnson C, Lobenhofer E, Puri R, Schrf U, Thiery-Mieg J, Wang C,
Wilson M, Wolber P, et al: The MicroArray Quality Control (MAQC) project
shows inter- and intraplatform reproducibility of gene expression
measurements. Nature Biotechnology 2006, 24:1151-1161.
17. Au K, Jiang H, Lin L, Xing Y, Wong W: Detection of splice junctions from
paired-end RNA-Seq data by SpliceMap. Nucleic Acids Research 2010,
38:4570-4578.
18. Anders S, Hüber W: Differential expression analysis for sequence count
data. Genome Biology 2010, 11:R106.
19. Bullard J, Purdom E, Hansen K, Dudoit S: Evaluation of statistical methods
for normalization and differential expression in mRNA-Seq experiments.
BMC Bioinformatics 2010, 11:94.
20. Wang E, Sandberg R, Luo S, Khrebtukova I, Zhang L, Mayr C, Kingsmore S,
Schroth G, Burge C: Alternative isoform regulation in human tissue
transcriptomes. Nature 2008, 456:470-476.
21. Armour C, Castle J, Chen R, Babak T, Loerch P, Jackson S, Shah J, Dey J,
Rohl C, Johnson J, Raymond C: Digital transcriptome profiling using
selective hexamer priming for cDNA synthesis. Nature Methods 2009,
6:647-649.
22. Graveley B, Brooks A, Carlson J, Landolin J, Yang L, Artieri C, van Baren M,
Boley N, Booth B, Brown J, Cherbas L, Davis C, Dobin A, Li R, Lin W,
Malone J, Mattiuzzo N, Miller D, Sturgill D, Tuch B, Zaleski C, Zhang D,
Blanchette M, Dudoit S, Eads B, Green R, Hammonds A, Jiang L, Kapranov P,
Langton L, et al: The developmental transcriptome of Drosophila
melanogaster. Nature 20101, 471:473-479.
23. Pickrell J, Marioni J, Pai A, Degner J, Engelhardt B, Nkadori E, Veyrieras J,
Stephens M, Gilad Y, Pritchard J: Understanding mechanisms underlying
human gene expression variation with RNA sequencing. Nature 2010,
464:768-772.
24. Cufflinks software. [ />25. Bühlmann P, Wyner A: Variable length Markov chains. The Annals of
Statistics 1999, 2:480-513.
26. Guttman M, Garber M, Levin J, Donaghey J, Robinson J, Adiconis X, Fan L,
Koziol M, Gnirke A, Nusbaum C, Rinn J, Lander E, Regev A: Ab initio
reconstruction of cell type-specific transcriptomes in mouse reveals the
conserved multi-exonic structure of lincRNAs. Nature Biotechnology 2010,
28:503-510.
27. Short read archive.
[ />28. SOLiD
software and tools. [ />29. Trapnell C, Pachter L, Salzberg S: TopHat: discovering splice junctions with
RNA-Seq. Bioinformatics 2009, 25:1105-1111.
Roberts et al. Genome Biology 2011, 12:R22
/>Page 13 of 14
30. Pruitt K, Tatusova T, Klimke W, Maglott D: NCBI reference sequences:
current status, policy and new initiatives. Nucleic Acids Research 2008, 37:
D32-D36.
31. Flicek P, Amode MR, Barrell D, Beal K, Brent S, Chen Y, Clapham P, Coates G,
Fairley S, Fitzgerald S, Gordon L, Hendrix M, Hourlier T, Johnson N, Kähäri A,
Keefe D, Keenan S, Kinsella R, Kokocinski F, Kulesha E, Larsson P, Longen I,
McLaren W, Overduin B, Pritchard B, Riat HS, Rios D, Ritchie GRS, Ruffier M,
Schuster M, et al: Ensembl 2011. Nucleic Acids Research 2011, 39:
D800-D806.
32. Langmead B, Trapnell C, Pop M, Salzberg S: Ultrafast and memory-efficient
alignment of short DNA sequences to the human genome. Genome
Biology 2009, 10:R25.
doi:10.1186/gb-2011-12-3-r22
Cite this article as: Roberts et al.: Improving RNA-Seq expression
estimates by correcting for fragment bias. Genome Biology 2011 12:R22.
Submit your next manuscript to BioMed Central
and take full advantage of:
• Convenient online submission
• Thorough peer review
• No space constraints or color figure charges
• Immediate publication on acceptance
• Inclusion in PubMed, CAS, Scopus and Google Scholar
• Research which is freely available for redistribution
Submit your manuscript at
www.biomedcentral.com/submit
Roberts et al. Genome Biology 2011, 12:R22
/>Page 14 of 14