Báo cáo y học: "Genome-wide assessment of imprinted expression in human cells." potx
Bạn đang xem bản rút gọn của tài liệu. Xem và tải ngay bản đầy đủ của tài liệu tại đây (404.58 KB, 14 trang )
RESEARCH Open Access
Genome-wide assessment of imprinted
expression in human cells
Lisanne Morcos
1
, Bing Ge
1
, Vonda Koka
1
, Kevin CL Lam
1
, Dmitry K Pokholok
2
, Kevin L Gunderson
2
,
Alexandre Montpetit
1
, Dominique J Verlaan
1*
, Tomi Pastinen
1*
Abstract
Background: Parent-of-origin-dependent expression of alleles, imprinting, has been suggested to impact a
substantial proportion of mammalian genes. Its discov ery requires allele-specific detection of expressed transcripts,
but in some cases detected allelic expression bias has been interpreted as imprinting without demonstrating
compatible transmission patterns and excluding heritable variation. Therefore, we utilized a genome-wide tool
exploiting high density genotyping arrays in parallel measurements of genotypes in RNA and DNA to determine
allelic expression across the transcriptome in lymphoblastoid cell lines (LCLs) and skin fibroblasts derived from
families.
Results: We were able to validate 43% of imprinted genes with previous demonstration of compatible
transmission patterns in LCLs and fibroblasts. In contrast, we only validated 8% of genes suggested to be imprinted
in the literature, but without clear evidence of parent-of-origin-determined expression. We also detected five novel
imprinted genes and delineated regions of imprinted expression surrounding annotated imprinted genes. More
subtle parent-of-origin-dependent expression, or partial imprinting, could be verified in four genes. Despite higher
prevalence of monoallelic expression, immortalized LCLs showed consistent imprinting in fewer loci than primary
cells. Random monoallelic expression has previously been observed in LCLs and we show that random monoallelic
expression in LCLs can be partly explained by aberrant methylation in the genome.
Conclusions: Our results indicate that widespread parent-of-origin-dependent expression observed recently in
rodents is unlikely to be captured by assessment of human cells derived from adult tissues where genome-wide
assessment of both primary and immortalized cells yields few new imprinted loci.
Background
Most mammalian autosomal genes ar e thought to be
expressed co-dominantly from the two parental chromo-
somes. At some loci, the allele inherited from one par-
ent is suppressed through epigenetic mechanisms. This
monoallelic expression, referred to as imprinting, leads
to genetic vulnerability that can contribute to rare
monogenic syndromes, such as Angelman and Prader-
Willi syndromes [1]. Recent evidence suggests that com-
mon disease, such as basal-cell carcinoma and type 2
diabetes, c an also be impacted by paren t-of-origin-
specific allelic variants [2]. Classical imprinting of a
region is the result of expression of only one parental
allele, where the other allele is completely suppressed.
However,amoresubtleimprintingeffecthasbeen
recently reported where both alleles are differently
expressed and show this in a parent-of-origin-dependent
manner. This deviation of typical imprinting is called
partial imprinting [3].
Although there i s no global explanation for the role of
imprinting in mammalian development and physiology,
a parental conflict over the distribution of resources to
offspring theory has been hypothesized [4], and reviewed
in [5]. When maternal and paternal input in the off-
spring is unequal, a differing evolutionary pressure is
placed on the alleles inherited from one or the other
parent, where the maternally derived allele acts to
decrease maternal contribution to the fetus and the
paternally derived allele acts to increase maternal
* Correspondence: ; tomi.pastinen@mcgill.
ca
1
McGill University and Genome Quebec Innovation Centre, 740 Dr Penfield
Avenue, Montreal, Quebec, H3A 1A4, Canada
Full list of author information is available at the end of the article
Morcos et al. Genome Biology 2011, 12:R25
/>© 2011 Morcos et al.; licensee BioMed Central Ltd. This is an open access article distributed under the terms of the Creative Commons
Attribution License (http://cre ativecommons.org/licens es/by/2.0), which permits unrestricted use, distribution, and reproduction in
any medium, provided the original work is properly cited.
contribution [4]. Imprinted genes have been shown to
be very important in fetal, placental and brain develop-
ment, postnatal growth, behavior and metabolism [6].
However, since not all imprinted genes are involved in
development or growth and imprinting, they have likely
evolved more than once [7].
The debate around theories of imprinting parallels the
intense investigation of the mechanis ms that maintain
imprinting. Monoallelic expression can be achieved with
mechanisms such as CpG island methylation, histone
modifications, antisense transcript-associated silencing,
as well as by long-range chromatin effects [8]. However,
such allele-specific phenomena are not restricted to
imprinted genes [9] and not all of these mechanisms
can be found in every imprinted locus. Because of this,
studies looking at individual attributes of chro matin
structure without corre lation to gene expression may
not be efficient in uncovering imprinted genes [10].
Although there are several genomic parameters that
seem to distingui sh imprinted and non-imprinted genes
(smaller introns, repeat sequences), which have been
exploited in attempts to bioinformatically predict mam-
malian imprinted genes [11,12], these characteristi cs are
not found in all imprinted genes. A feature of these pre-
dictions is the generation of a large number of poten-
tially imprinted genes; for example, one study predicted
600 imprinted genes [13] while another predicted that
there may be over 2,000 imprinted genes [14]. Yet, few
of these bioinformatic predictions have been validated
[15], l eading many to believe that the numbers are lar-
gely inflated and that the number of imprinted genes
yet to be identified is small [9]. More conservative esti-
mates assume 100 to 200 imprinted genes in the human
genome [16].
So far, direct observation of mammalian imprinti ng in
living cells and tissues has been carried out most thor-
oughly in t he mouse genome using RNA-seq [17,18].
These studies employed the gold standard for recogniz-
ing imprinting in mice using the non-equivalence of
monoallelic expression in reciprocal mati ngs of inbred
strains but yi elded widely different esti mates of amounts
of imprinted genes in mouse embryonic brain. Using
three brain regions, up to 1,300 transcripts were
reported as imprinted [18], whereas a single brain region
studied for 5,000 genes observed only a handful of novel
imprinted genes beyond the more than 100 validated
earlier [17]. Criteria for calli ng imprinting allowed for
partial and inconsistent parent-of-origin-dependent
expression within transcripts and between individuals
and along with shown tissue specificity [18] may, in
part, explain the substantial discrepancy between the
two studies. The reciprocal mating approach used with
mice cannot be used with humans. Consequently,
demonstration of imprinting requires family-based tissue
samples as well as accurate methods to observe differen-
tial expression of parental alleles. An obvious limitation
to human studies is the access to multiple tissue types
where transmission patterns can be determined. This
leads to some genes being reported as imprinted with-
out clear demonstration of alleli c expression (AE) bias
[19] and/or parental bias [20-22]. Because of these lim-
itations, it is unclear what the extent of imprinting is in
humans. Currently, direct assessment of imprinting in
human tissues has yielded approximately 80 genes with
varying degrees of evidence for imprinting [23] and an
up to date catalogue is kept at the Catalogue of Parent
of Origin Effects [24]. Some of the imprinted genes have
been found to be tissu e- or developmental stage-specific
[7]. Given the limitations in sampling as well as measur-
ing differential expression of parental alleles comprehen-
sively, it is commonly assumed that the number could
be significantly higher.
In addition to imprinting, random monoallelic expres-
sion (RME) has been reported as a source of sequence-
independent AE [ 25]. When RME occurs at a given
locus, a range of expression ca n follow such that some
cells express only the maternal allele, some cells express
only the paternal allele and some cells express a co mbi-
nation of the two. This class of genes has been previously
reported in the odorant receptor genes as well as genes
encoding immunoglobulins, T-cell receptors, interleukins,
and natural killer cell receptors [26-30]. Historically,
RME was linked to a subset of genes involved in the
immune or nervous system. However, Gimelbra nt et al.
[25] assessed 3,939 genes in multiple clonal lymphoblast
cell lines (LCLs) and found that roughly 10% were mono-
allelically expressed and observed a large diversity in
RME genes. In their study, different cell clon es derived
from the same individual showed biallelic behavior at
most loci. Other studies have established links between
allele-specific DNA methylation and RME [31]. In an
earlier study of ours, we observed a n excess of high-
magnitude AE in immortalized lymphoblasts (LCL) com-
pared to primary cells (osteoblasts and fibroblasts) and
this correlated with the estimated levels of clonality [32].
It has been hypothesized that aberrant methylation
induced by lymphoblast immortaliz ation, prolonged cell
culture or multiple passag es may be a possible mechan-
ism for the observed AE [33]. In this study, we utilize a
genome-wide method [32] to determine strongly biased
AE in the transcriptome using family-based cell panels
from two cell types (lymphoblasts and primary fibro-
blasts). Using this method, we aim to uncover imprinting
in the human genome by determining parent-of-origin
transmission in multiple pedigrees as well as excluding
heritable variants that cause monoallelic expression
through population-based data obtained from these same
samples. To globally assess the relationship between
Morcos et al. Genome Biology 2011, 12:R25
/>Page 2 of 14
methylation and RME, we perturbed t he methylation
state in lymphoblasts using 5-azadeoxycytidin e (AZA), a
drug that causes hemi-demethylation, and monitored
changes in AE upon demethylation. The density of mea-
surements, inclusion of family- and population-based AE
from two cell types along with an investigation of methy-
lation impact on differential AE provides the most com-
prehensive survey of epigenetic cis-regulatory variation in
the human genome to date.
Results
Validated imprinting in lymphoblast cell lines and
fibroblasts
First, we assessed the level of evidence for non-overlapping
genes suggested to be imprinted (Catalogue of Parent o f
Origin Effects [24]), specifically looking for demonstration
of monoalleli c expr ession with parent-of-origin-specifi c
transmission in at least one pedigree. For genes with con-
sistent parent-of-origin transmission, our search yielded a
total of 44 imprinted genes. We were able to assess 73% of
the confirmed imprinted genes (32 of 44) in either lym-
phoblasts or fibroblasts (Table 1; Table S 1 in Additional
file 1), as 12 loci were uninformative in our analysis (Table
S2 in Additional file 1). The degree of allelic bias was
extracted from the Illumina 1M AE assay [GEO:
GSE26286] essentially as previously described [32].
To validate the allelic expression calls from the Illu-
mina 1M assay, we tested 15 SNPs from putative
imprinted loci in 63 sampl es using a normalized Sanger
sequencing-based validation assay [34]. One SNP gave
discrepant genotyping calls and was excluded from the
analysis, leaving 14 SNPs and 61 sample s for compari-
son (Table S3 in Additional file 1). The analysis shows a
concordant expression bias towards the expected allele
in all cases with Pearson correlation coefficient of r =
0.9657 (Additional file 2).
The parent-of- origin-dependent transmission of allelic
biases was confirmed in l ymphoblasts using a three-gen-
eration pedigree of Caucasian origin (CEPH family
1420) [32] along with newly generated AE profiles in a
Caucasian as well as a Yoruban parent-offspring trio.
We also used nine independent p arent-offspring fibro-
blast trios to confirm parental influence in AE. Of the
known imprinted genes that wer e assessed, 37.5% (12 of
32) showed monoallelic expression and clear parental
bias in either both tissues or in only one tissue if the
other could not be assessed (Figure 1a and Table 1).
Seven of these have been previously validated in LCLs
by in dependen t PCR-based AE measurements in a sec-
ond pedigree (CEPH family 1444) [32]. An additional
22% (7 of 32) showed predominan tly biallelic expression
(average fold-difference between alleles < 2-fold) in one
tissue with large magnitude AE and clear parental bias
in the other tissue (Figure 1b and Table 1). For these 19
imprinted genes, the average increased expression of the
overexpressed allele was 7.39-fold (2.94 to 11.84, 1
Table 1 Validated imprinted genes in the human genome
Location Gene Transcript Human Mouse Expressed allele LCL FB
6q24 PLAGL1
a
NM_001080952 I I P No Yes
7q21 SGCE NM_001099401 I I P Yes No
7q21 PEG10 NM_015068 I I P NA Yes
7q32 CPA4 NM_016352 I NR M No Yes
7q32 MEST NM_177524 I I P No Yes
7q32 COPG2 NM_012133 CD I P No Yes
7q32 KLF14 NM_138693 I I M NA Yes
11p15 H19 NR_002196 I I M No Yes
11p15 KCNQ1 NM_000218 I I M Yes NA
14q32 MEG3 NR_002766 I I M No Yes
15q11 MKRN3 NM_005664 I I P NA Yes
15q11 MAGEL2 NM_019066 I I P NA Yes
15q11 NDN NM_002487 I I P NA Yes
15q11 SNURF NM_005678 I I P Yes Yes
15q11 IPW NR_023915 I I P Yes Yes
16p13 ZNF597 NM_152457 I NR M Yes Yes
19q13 ZNF331 NM_001079906 I NR P Yes Yes
19q13 ZIM2 NM_015363 I I P No Yes
20q13 GNAS/GNASAS NR_002785 I I M Yes Yes
20q13 L3MBTL NM_032107 I NR P Yes Yes
a
Only PLAGL1 isoform 1 is found expressed and imprinted in the fibroblasts; isoforms 1 and 2 are biallelically expressed in the LCLs. CD, conflicting evidence as
defined by Morr ison et al. [19]; FB, fibroblast cell lines; I, imprinted genes with previously observed parent-of-origin-dependent expression bias; LCL, lymphoblast
cell lines; M, maternal; NA, not available (not expressed or non-informative in children); NR, not reported; P, paternal.
Morcos et al. Genome Biology 2011, 12:R25
/>Page 3 of 14
standard deviation (SD)). The remaining genes (13 of 32;
40%) all showed biallelic expression in all available mea-
surements (Table S1 in Additional file 1). Overall, out of
the 32 imprinted genes, we discovered that the AE
observed for the genes PRIM2, CPA4,andDLGAP2 in
LCLs was found to be associated with genotypes at loc al
SNPs, consistent with heritable rather than imprinted
allelic expression. Interestingly, the extreme AE
observed for the CPA4 gene, although heritable in LCLs,
is found t o be consistent with imprinting in the
fibroblasts.
Second, we looked for suggested imprinted genes
(Catalogue of Parent of Origin E ffects [24]), but with
inconsistent parent-of-origin transmission data in the
literature. Our search yielded 13 genes (marked ‘PD/CD’
in the tables), of which 69% (9 of 13) could be assessed.
Only the gene COPG2 was validated for imprinting i n
the fibroblasts (Table 1) bu t was found to heritable in
LCLs (data not shown). All of the remaining eight genes
were found to be biallelic in lymphoblasts and/or fibro-
blasts (Table S1 in Additional file 1) and the AE
observed for the genes ZNF215 and GABRG3 was found
to be heritable in both cell types (data not shown).
Novel imprinted genes and genomic regions
Using AE patterns observed for validated imprinted
genes, which showed a t least 2.9-fold difference in
expression (-1 SD for confirmed imprinted genes), we
sought eviden ce for imprin ting among annotated genes
and unannotated transcripts. We required that a t least
three consecutive SNPs showed an average deviation in
excess of a 2.9-fold threshold and were measured in at
least two children. Altogether, out of the 223,017 win-
dows measured in at least two children, 1,253 fulfilled
the cri teria in the three-generation LCL pedi gree, and of
the 234 ,837 windows measured in the fibroblasts, a total
of 549 were showing hig h AE. These candidate windows
fell into 254 distinct loci in LCLs and into 110 loci in
fibroblast s (Tables S5 and S6 in Additional file 3). S ix of
these loci in LCLs (spanning 8 genes) and 15 loci in
fibroblasts (spanning 19 genes) had earlier literature evi-
dence and were included in the assessment of known
loci ab ove. Our analysis revealed five i mprinted RefSeq
annotated genes not reported by other methods in
humans (Table 2, Figure 1c). The genes ZDBF2 and
SGK2 were found imprinted in LCLs, while the genes
NAT15, RTL1 and MEG8 were found imprinted in
fibroblasts. Three of these novel imprinted human genes
had previously been identified in mice (ZDBF2, RTL1,
MEG8) [35-37]. We note that in the fibroblasts, none o f
Trio 4
Trio 5 Trio 7
Trio 9
CEU 1463 YRI Y117
(a) GNAS
Fibroblasts
Lymphoblasts CEPH 1420
Trio 3
Trio 5 Trio 8
Trio 9
CEU 1463 YRI Y117
(b) PLAGL1
Fibroblasts
Lymphoblasts CEPH 1420
Trio 1
Trio 3 Trio 6
Trio 7
YRI Y117
(c) ZDBF2
Fibroblasts
Lymphoblasts CEPH 1420
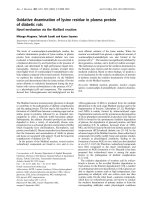
Figure 1 Examples of imprinted genes in Human genome.
(a) Imprinted genes in both lymphoblasts and fibroblasts: GNAS is
an example of an imprinted gene that has been previously
described in the literature and has been confirmed in our study as
well. (b) Imprinted genes in fibroblasts only: PLAGL1 is an example
of tissue-specific imprinting (isoform 1). (c) Novel imprinted genes:
ZDBF2 is an example of a novel imprinted gene. In each case, the
figure shows all of the informative pedigrees. For the trios, the
colors indicate the paternal allele (blue) and the maternal allele
(red). For the three-generation pedigree the colors indicate which
parental allele is inherited. The bars indicate which allele is
overexpressed as well as the degree of overexpression.
Morcos et al. Genome Biology 2011, 12:R25
/>Page 4 of 14
the regions overlapping RefSeq annotation and demon-
strating po tentially parent-of-origin-based transmission
showed positive population mapping data (n =15)
whereas 36% (4 out of 11) for LCLs showed links with
common variants in mapping data (Tables S 5 and S6 in
Additional file 3).
Since transcription was measured across the genome, we
were able to observe potentially imprinted expression of
ten unannotated intergenic regions (Table 3; Additio nal
file 4). Four of these ten regions showed strong evidence
for imprinting wh ile the remaining six were found to be
consistent with heritable AE. In some cases (n =3)the
imprinting regions spanned two to three genes and mea-
sured between 73,150 and 1,569,064 bases (Figure 2).
We also commonly encountered imprinted transcription
of SNPs outside the boundaries of annotated imprinted
genes. For example, 10 of the 20 RefSeq genes showing
strong evidence of imprinting continued this strong
imprinted expression outside of the annotated gene
boundary. Surprisingly, seven of these ten cases showed
imprinted expression 5 kb a way from the transcript,
suggesting that they may represent independent tran-
scriptional units or unannotated isoforms of the
imprinted genes.
Partial imprinting
We have previously shown that immortalized LCLs
demonstrate an excess of monoallelic expression,
putatively due to rare RME events detectable in these
lines [32]. To avoid such biases, we looked for moderate
magnitude AE (2- to 2.9 fold av erage difference among
all informative heterozygotes) in loci where at least two
of the children of the nine fibroblast trios were hetero-
zygous t o uncover partial imprinting. To avoid redun-
dancy, we excluded AE at boundaries of classically
imprinted regions (as defined in the above sections).
Out of the 234,837 windows measured, we id entified 46
loci that showed this degree of allelic bias. Of these, 30
coul d be determined to be consistent with heritable AE,
mappable to local polymorphisms; in 80% of cases (24
of 30) the mapped polymorphism was transmitted in a
Mendelian fashion (the remaining 6 were not informa-
tive for transmission o f the putative regulatory variant).
The remaining 16 RefSeq genes did not show associa-
tion w ith common SNPs and were further investigated
for change of relatively overexpressed haplotype with
transmission (indicative of non-genetic effect) and par-
ental bias in pedigrees. Four of the 16 showed strong
evidence for partial imprinting, with the father’ sallele
being preferentially expressed (TRAPPC9, ADAM 23,
CHD7, TTPA; Additional file 4).
Mechanisms for random allelic expression
In o rder to assess the basis of extreme non-imprinted,
non-heritable AE observed in lymphoblasts, three LCLs
were treated with the demethylating agent AZA and
Table 2 Novel imprinted genes found in lymphoblasts and/or fibroblasts
LCL FB
Location Gene Mouse Expressed allele Number of ITs AE (average magnitude) Number of ITs AE (average magnitude)
2q33 ZDBF2 I P 9 12.06 NA NA
16p13 NAT15 NR M NA NA 3 6.95
20q13 SGK2 NR P 9 8.9 NA NA
14q32 RTL1 I P NA NA 4 12.34
14q32 MEG8 I M NA NA 8 10.66
AE, allelic expression; FB, fibroblast cell lines; I, imprinted genes with previously observed parent-of-origin-dependent expression bias; IT, informative transmissi on;
LCL, lymphoblast cell lines; M, maternal; NA, not available; NR, not reported; P, paternal.
Table 3 Novel candidate imprinted intergenic regions in lymphoblasts and fibroblasts
Chromosome Start End LCL AE (average magnitude) FB AE (average magnitude) Heritable AE
1 210509341 210524037 4.23 NI Yes
1 72584492 72610078 NI 2.94 Yes
2 187422507 187893532 NI 2.68 No
7 26113744 26137739 4.36 NI Yes
12 9514883 9649634 4.24 NI Yes
14
a
100425763 100608884 NI 8.58 No
15
b
22786809 22902119 10.18 7.55 No
16 54019260 54035547 8.54 NI Yes
16 3355563 3366918 NI 2.78 No
17 41604896 41620711 NI 5.87 Yes
a
Downstream of MEG3 and RTL1.
b
Within SNRPN/SNURF region. AE, allelic expression; FB, fibroblast; LCL, lymphoblast cell line; NI, not informative.
Morcos et al. Genome Biology 2011, 12:R25
/>Page 5 of 14
chr14: 100000000 100100000 100200000 100300000 100400000 100500000 100600000
UCSC Genes
WDR25
BEGAIN
BEGAIN
BC132991 DLK1
FP504
hCG_25025
CR593817
DJ027026
AK021542
DJ442754
CS266678
CS548440
CS266684
DJ442751
DJ442756
DJ442737
CS548468
DJ087804
DJ442752
AK094562
BC148240
AE fold
10 _
0
Maternal
Paternal
SNORD cluster
_
chr15: 22000000 22500000 23000000 23500000 24000000 24500000
UCSC Genes
MKRN3
MKRN3
MKRN3
MAGEL2
NDN
AK124131 AK058147
BC034815
C15orf2
SNRPN
SNRPN
SNURF
SNRPN
SNRPN
SNURF
AF319524
HBT8
DKFZp686M12165
AY362862
C15orf49
IPW
IPW
AF400490
PAR1
AF400491
AF400492
AY362864
AF400493
AY362865
AF400497
AF400498
AF400499
HBII-52-24
AF400501
HBII-52-27
HBII-52-28
AF400501
HBII-52-45
AF400500
HBII-52-46
UBE3A
UBE3A
AX747189
ATP10A
ATP10C
BC038777
GABRB3
GABRB3
GABRA5
AK124673
GABRG3
10 _
0 _
Maternal
Paternal
AE fold
SNORD cluster
chr16: 3350000 3400000 3450000 3500000
UCSC Genes
OR2C1 ZNF434
ZNF434
ZNF434
ZNF174
ZNF174
ZNF597
NAT15
NAT15
UNQ2771
NAT15
NAT15
C16orf90
KIAA0643
CLUAP1
CLUAP1
BC141902
NLRC3
FLJ00180
10 _
0
_
Maternal
Paternal
AE fold
(
a
)
(b)
(c)
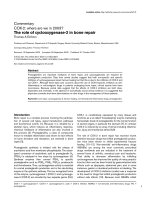
Figure 2 Examples of imprinted genomic regions in fibroblasts. (a) Paternally expressed imprinted region on chr14 covering numerous
non-RefSeq genes found downstream of the paternally imprinted DLK1 gene (was not informative in our samples). This region has been
previously identified in mice and sheep. (b) Extension of imprinting with paternal expression downstream of the SNRPN/SNURF loci
encompassing multiple non-RefSeq genes. (c) Maternally expressed imprinted gene ZNF597 with upstream imprinted isoform-specific NAT15.
Morcos et al. Genome Biology 2011, 12:R25
/>Page 6 of 14
were observed for changes in AE upon treatment. The
three c ell lines were selected based on our earlier data
indicating high levels of clonality in these particular cell
lines [32] based on extreme deviation from random
X-inactivation. Using 5 μMAZAfor3days,we
observed a significant decrease in AE in 20% of loci that
showed at least a two-fold difference in AE at baseline
(defined as an allelic change of at least 1.25-fold, the
95th percentile of allelic fold change among untreated
biological controls). Only one of the imprinted loci
showed a change in AE upon treatment (GNAS). Simi-
larly, loci where the AE could be mapped to common
SNPs [32] were underrepresented: 23% (7 of 30) of AE
traits affected by treatment mapped to SNPs (Table 4),
whereas 35% (17 of 48) of loci without significant treat-
ment effect on AE showed association with local SNPs
(Table 5). These observati ons suggest that the de methy-
lation alters the expression of randomly silenced genes
in lymphoblasts. We studied this further by observing
concordance of AE for identical-by-descent (IBD) sib-
lings in a three-generation pedigr ee (CEPH 1420). We
rea soned that if demethylation primarily affects random
allelic silencing, then loci demonstrating treatment-
specific effects would also more likely show random or
IBD-independent AE since heritable or imprinted loci
should demonstrate consistent AE. IBD siblings were
considered concordant for AE if both had the same
allele overexpressed and showed over 1.5-fold difference
between allel es. They were considered discordant if one
siblingshowed1.5-foldoverexpressionandtheother
sibling was either biallelic or overexpressed the other
allele. The IBD sibling analysis showed discordant AE in
30% of transmissions for loci affected by treatment but
only in 1% of loci not altered by treatment (P-value =
0.00308; Table 6). This suggests that RME, w hich is
detectable in lymphoblasts due to their reduced mosai-
cism [32], may be partly explained by aberrant methyla-
tion in the genome and this effect ca n be partially
reversed by demethylation treatment. To confirm these
results, an independent cell line was treated with 10 μM
of AZA for 5 and 10 days. At th e 10-day time-point, 61
of 155 allelically expressed loci (more than a two-fold
difference in untreated) showed a 50% decrease in mag-
nitude of AE upon treatment and no loci showed an
Table 4 Genes affected by AZA treatment
19099 19141
Gene Transcript Location Untreated Treated Untreated Treated IBD Mapped to polymorphism
PCTK3 NM_212502 chr1:203742262-203768466 2.54 1.42 2.74 1.24 Yes
CR1L NM_175710 chr1:205886352-205961039 2.21 1.38 2.20 1.49 Yes
KCNK1 NM_002245 chr1:231822688-231871795 1.78 1.11 4.69 2.59 NI Yes
- chr4:79778447-79803457 2.47 1.78 2.1 1.27 NA Yes
- chr5:173100613-173139917 2.33 1.27 2.08 1.15 Yes
- chr5:9599989-9600708 3.02 1.58 1.47 1.06 Yes
- chr6:139658229-139733915 3.16 2.36 3.53 2.53 Yes Yes
- chr6:80016628-80042343 3.16 2.36 2.71 1.25 NA
CALN1 NM_001017440 chr7:71159735-71207121 1.51 1.05 5.76 1.76 NA
- chr11:3036678-3063235 4.64 2.94 4.63 3.18 Yes Yes
SYT9 NM_175733 chr11:7376868-7440901 2.09 1.31 3.48 2.15 Yes Yes
VWA5A NM_001130142 chr11:123521934-123522703 2.02 1.37 2.12 1.37 Yes
P2RX7 NM_002562 chr12:120055848-120087505 2.23 1.08 1.81 1.24 Yes
COL4A2 NM_001846 chr13:109958305-109963202 3.25 1.5 2.58 1.84 Yes
PRKCH NM_006255 chr14:60959560-61030659 2.17 1.64 1.92 1.43 Yes
DNAJA4 NM_00130182 chr15:76345564-76360674 2.15 1.58 8.56 5.77 Yes
- chr15:94684325-94711444 3.11 2.13 5.45 3.28 Yes
GAS7 NM_001130831 chr17:10022884-10022981 4.24 2.21 2.13 1.44 Yes Yes
- chr17:14190861-14192673 2.37 1.68 2.34 1.60 NI Yes
C20orf194 NM_001009984 chr20:3179134-3334482 3.47 2.08 1.92 1.45 Yes
- chr20:46050433-46119516 2.22 1.54 2.48 1.65 NA
- chr20:46358273-46404570 2.06 1.27 3.15 1.59 NA Yes
GNAS NR_002875 chr20:56848505-56882141 6.46 4.14 3.62 2.06 Yes
TMPRSS3 NM_024022 chr21:42665938-42688945 1.47 1.04 4.19 1.43 Yes
- chr22:28762403-28805154 1.43 1.03 4.25 2.23 Yes
OSBP2 NM_030758 chr22:29598129-29633708 2.41 1.84 2.86 1.71 NI
IBD, identical-by-descent; NA, not available; NI, not informative.
Morcos et al. Genome Biology 2011, 12:R25
/>Page 7 of 14
Table 5 Genes not affected by treatment
19099 19141
Gene Transcript Location Untreated Treated Untreated Treated IBD Mapped to polymorphism
MARK1 NM_018650 chr1:218867493-218900613 6.38 6.26 Yes
DISC1 NM_001012957 chr1:229837731-230086433 4.64 4.85 Yes Yes
CYP27A1 NM_000784 chr2:219372907-219379842 3.84 2.54 1.25 1.62 NI
THNSL2 NM_018271 chr2:88252911-88265923 2.43 3.37 Yes Yes
PTPRG NM_002841 chr3:62165281-62250653 4.02 3.09 3.65 5.10 NI
UPK1B NM_006952 chr3:120375223-120399317 4.12 3.68 1.23 1.33 NI
FAM53A NM_001013622 chr4:1654935-1655009 1.93 2.04 2.30 2.13 Yes
EVC NM_153717 chr4:5767823-5801057 1.68 1.78 3.47 3.11 Yes
- chr4:6698225-6722860 3.9 3.99 Yes Yes
- chr4:107011829-107032181 4.34 4.27 NI
- chr4:142529192-142768065 5.11 5.47 Yes Yes
ANKH NM_054027 chr5:14801236-14922709 1.42 1.35 7.59 8.63 Yes Yes
- chr5:82347320-82386566 2.1 2.23 Yes Yes
- chr6:654765-656792 3.18 3.13 NA
MOXD1 NM_015529 chr6:132659162-132759924 2.02 2.08 3.07 3.03 Yes Yes
- chr8:511306-580861 3.54 2.76 2.33 2.79 Yes Yes
- chr9:5296824-5301171 3.83 3.91 Yes
DEC1 NM_017418 chr9:117025707-117204395 2.22 2.18 Yes Yes
DIP2C NM_014974 chr10:363048-477973 3.56 2.48 1.25 1.73 Yes
FRMD4A NM_018027 chr10:13817200-14106528 3.93 4.13 NA
- chr11:6879025-6898447 2.81 2.20 1.63 2.15 Yes Yes
- chr11:70187425-70240934 2.73 2.13 1.52 1.83 NI
- chr13:18766583-18804422 3.50 3.03 3.52 4.30 Yes Yes
WDR51B NM_172240 chr12:88415605-88431297 2.18 2.27 2.66 2.62 Yes Yes
- chr14:24047434-24096337 2.44 2.01 4.27 5.26 NI
PAX9 NM_006194 chr14:36198687-36216226 1.98 1.51 2.06 2.63 Yes
- chr14:69730226-69746414 5.76 5.81 NA
DPF3 NM_012074 chr14:72343297-72429399 1.83 2.39 3.30 2.29 Yes
WARS NM_173701 chr14:99906106-99911812 2.49 2.41 Yes Yes
- chr15:22775434-22933834 11.24 9.95 7.06 8.26 Yes
- chr15:28921438-28971039 11.73 7.79 2.13 2.70 Yes Yes
SV2B NM_014848 chr15:89614733-89637888 2.88 2.74 NI
- chr16:53974720-54069307 5.38 2.88 1.10 1.64 Yes Yes
- chr16:83152950-83155553 3.52 3.6 NA
SLC13A5 NM_177550 chr17:6531791-6555012 3.75 3.89 NA
- chr17:34566422-34580691 2.65 2.28 1.56 1.78 NA
PITPNC1 NM_181671 chr17:63031387-63046267 3.08 2.46 1.59 1.83 Yes
DSC3 NM_024423 chr18:26824546-26875293 1.88 2.21 4.83 3.67 Yes Yes
KATNAL2 NM_031303 chr18:42780796-42812910 1.97 1.83 2.41 2.60 NI
- chr19:40008284-40033757 6.05 5.53 4.29 4.95 NI
SIGLEC5 NM_003830 chr19:56807457-56823545 1.45 1.24 3.84 5.51 NI
- chr19:58776466-58798723 3.02 3.32 Yes
- chr22:22567862-22619365 1.12 1.03 8.09 10.02 Yes Yes
LDOC1L NM_032287 chr22:43268050-43270537 1.46 1.75 3.74 2.97 Yes
IBD, identical-by-descent; NA, not available; NI, not informative.
Table 6 Allelic expression observed in identical-by-descent siblings
Condition Number of loci Concordant AE in independent IBD pairs Discordant AE in independent IBD pairs
AE altered by AZA 26 32 14
AE not altered by AZA 48 67 7
AE, allelic expr ession; AZA, 5-azadeoxycytidine; IBD, identical-by-descent.
Morcos et al. Genome Biology 2011, 12:R25
/>Page 8 of 14
opposite effect (that is, there was a 50% increase in AE
upon treatment). Of the loci strongly affected by the
treatment, 95% (58 of 61) showed consistent time
dependency of treatment (at 5 days the magnitude
change in AE was less marked). The directionality and
time dependence of the treatment suggest that changes
in A E were specific to AZA treatment. To further verify
that demethylation was occurring, we incubated frag-
mented DNA with His-MBD2b, a methyl binding pro-
tein that has a high affinity for CpG methylated DNA.
We then removed the non-tagged DNA, leaving only
methylated fragments. Comparing the signal intensities
(XY raw signals from 1M Illumina BeadChip) in DNA
between the treated and untreated samples after the
methyl binding protein affinity assay shows that, for
sites where XY raw signal significantly differs (> 1 SD
difference) between treated and untreated samples, the
direction of effect is predominantly towards a decrease
of signal intensities in treated cells, suggesting that AZA
treatment did in fact reduce global methylation in LCLs.
Discussion
Our work demonstrates that many allelic expression
events previously suggested to be caused by imprinting
failed to validate in two human cell types, which allowed
the detection of 59% of imprinted genes with stronger
apriorievidence of parental expression bias and only
8% of imprinted genes with conflicting evidence of par-
ental expression bias. These numbers sugge st that cau-
tion is needed when experimentally assessing imprinting
in the human genome. We note that while the tran-
scriptome coverage is high (approximately 50% of
RefSeq genes per tissue) using our methods, a limitation
to the allelic expression mapping using primary tran-
scripts is non-strand specificity; therefore, if antisense
imprinting or imprinting of intragenic transcripts is
common, we would underestimate the prevalence of
imprinting. On the ot her hand, assessment of not com-
monly analyzed unannotated regions revealed few addi-
tional targets with potential imprinting. In addition to
unannotated regions, our study included five-fold higher
coverage for annotated genes than a previous allele-spe-
cific expression study [9] carried out in cells of lym-
phoid origin. Consequently, the coverage for validated
imprinted genes was over fi ve-fold higher for t he LCLs
in our study. Pollard et al. [9] assayed AE in 2,625 genes
and only three of these were previously known to be
imprinted.
In summary, we validated 20 genes out of the 41
genes w e were able to assess for imprinting. Six genes
were found imprinted in both LCLs and fib roblasts
( SNURF, IPW, ZNF597, ZNF331, GNAS/GNASAS and
L3MBTL). Most of the validated genes were found to be
tissue-specific: SGCE and KCNQ1 were imprinted only
in the LCLs while the other genes were imprinted only
in the fibroblasts. Interestingly, 90% of the previously
identified imprinted genes (18 o f 20) validated in this
studywereimprintedintheprimaryfibroblastsas
opposed to only 40% for the immortalized LCLs (8 of
20). For five of these genes we also found that the AE
observed in the LCLs is m ediated by heritable rather
than epigenetic mechanisms (PRIM2, CPA4, DLGAP2,
ZNF215 and GABRG3). Given the fact that CPA4 is
found to be heritable in LCLs but imprinted in fibro-
blasts, further study of the two cell lines could help
identify some of the factors involved in the mechanism
of imprinting. Interestingly, another study found that
CPA4 was imprinted in many fetal tissues but not in the
fetal brain using pyrosequencing [38].
Several of the genes that were previously reported as
imprinted (with consistent parent-of-o rigin transmission)
were not confirmed in our study. In line with the litera-
ture, many of these are thought to be tissue-specific. For
example, the gene KCNK9 is clearl y impri nted but it is
only highly expressed in the central nervous system and
the cerebellum [39] and, as expected, shows no imprint-
ing in LCLs and fibroblasts. The same thing can be said
for the genes PHLDA2 and OSBPL5, which are imprinted
in the placenta [40,41], and the genes UBE3A and
GRB10, which are imprinted in the brain [42,43]. Based
on the fact that we were able to validate 59% of the genes
as having consistent parent-of-origin transmission
compared to 8% validated as not having consistent
parent-of-origin transmission, genes with inconsistent
parent-of-origin transmission are more likely to be false
positives.
Our data show conclusive evidence of imprin ting for a
few additional RefSeq genes (NAT15 and SGK2)aswell
as for three genes previously found imprinted in mice
but not validated in humans (ZDBF2, RTL1 and MEG8)
(Table 2). The NAT15 and SGK2 genes both lie adjacent
to previously confirmed imprinted genes: ZNF597 and
L3MBTL, respectively.
Our genome-wide analysis of unannotated regions
revealed evidence of imprinting for four additional
regions (Figure 2), all of which were identified in the
fibroblasts. Three of these regions span multiple genes.
In addition, we discovered four new genes with m oder-
ate imprinting (TRAPPC9,
ADAM23, CHD7 and
TT
PA), all of which showed paternal expression. The
observation o f partial imprinting for TRAPPC9 is nota-
ble and should be studied in brain since this gene has
recently been shown to be mutated in autosomal
recessive mental retardation [44-46]. Consequently, if
imprinting or partial imprinting can be replicated in
human brain, paternally transmitted loss-of-function
mutations could be enriched among individuals with
intellectual disability.
Morcos et al. Genome Biology 2011, 12:R25
/>Page 9 of 14
This is the first genome-wide survey of imprinting
using human primary cells. The use of human fibro-
blasts to uncover new imprinted genes and regions and
to validate known imprinted genes was more efficient
than the use of LCLs. Putatively, the epigenetic altera-
tions upon immortalization and prolonged cell culture
observed earlier [47] in LCLs can disrupt imprinted
gene expression. To further study the true extent of
imprinting, tissue-dependen t expression of primary cells
retrievable from blood (distinct cellular lineages com-
pared to fibroblasts) should be pursued [48]. The overall
coverage of suggested and established imprinted genes
should represent adequate tissue sampling. We note
that our ability to observe imprinting in approximately
50% of known imprinted genes in the current study is
not substantially lower than that reported by Gregg
et al. [18] when studying multiple regions in developing
mouse brain, where 47 of 72 of known and measured
imprinted genes showed parent-of-origin-dependent
expression. In contrast to this latter study and despit e
our high transcriptome coverage, we d id not find wide-
spread evidence of unknown classical ly imprinted genes
or eve n partial imprinting in annotated or unannotated
regions. One potential explanation for the difference in
uncovering novel imprinted genes between our study
and the study by Gregg et al. is that we required consis-
tent parent-of-origin-dependent expression across a
genomic region (three independent SNPs required) and
most of the novel imprinting candidates observed in
mice did not show consistent evidence across a tran-
scriptional unit [18].
While the LCLs p rovide a less powerful cell sy stem to
study imprinting compared to primary fibroblasts, they
offer the possibility to look for determinants of non-
heritable all elic expression since the cells hav e reduced
mosaicism and show an excess of extreme allelic expres-
sion compared to primary cells [32]. Gimelbrant and
colleagues [25] have shown in individually derived LCL
clones that the extent of RME could be substantial, but
the mechanisms involved in random a llelic silencing
have not been previously pursued on a genome-w ide
scale. Here w e show directly that reversible methylation
is one of the mechanisms involv ed in RME using a
demethylating agent in two different sets of samples.
We also suggest that the mechanisms un derlying transi-
ent methylation-mediated allelic silencing are not pri-
marily involved in imprinting or heritable allelic
expression since such loci were relatively underrepre-
sented among loci showing allelic expression changes
upon demethylation.
Conclusions
In our comprehensive genome-wide search for imprint-
ing and non-heritable allelic expression in human we
found relatively few new imprinted genes, at least in
LCLs and fibroblasts. Our results also suggest that the
false-positive rate among suggested imprinted genes
without direct parent-of-origin expression is h igh. This
is likely, in part, due to the high prevalence of heritable
allelic expression we observed in many candidate
regions in our survey as well as technical issues in
measuring allelic expression in human samples using
single-point assessment. The existence of widespread
parent-of-origin-dependent allelic expression observed
recently in mouse studies [18] was not directly
addressed in our assessment as we required multiple
consistent measurements across transcripts. Overall, this
could point to less than 100 classically imprinted genes
(accounting for some tissue specificity) in the human
genome. To extend the human catalogue where imprint-
ing is directly observed as we show here, we suggest that
other primary cells retrievable by non-invasive means
(allowing analyses in pedigrees) will likely be needed.
Materials and methods
Imprinted gene search
Genes were selected from the imprinting catalogue
maintained at the Catalogue of Parent of Origin Effects
(University of Otago). Imprinted genes were categor-
ized as having either consistent (44 genes selected) or
inconsistent parent-of-origin transmission (13 genes
selected).
Samples and cell culture
For the lymphoblast samples, a three-generat ion pedi-
gree of Caucasian origin (CEPH family 1420) [32] along
with newly generated AE profiles in a Caucasian (1463)
as well as a Yoruban (Y117) parent-offspring trio were
used. In addition, nine independent parent-offspring
fibroblast trios to confirm parental influence in AE were
utilized. Seven of the loci showing parent-of-origin
effects in LCLs had previously been validated by inde-
pendent AE measurements in a second pedigree (1444)
[32]. All LCLs were obtained from Coriell (Camden, NJ,
USA) and fibroblast cell lines were also obta ined from
Coriell and the McGill Cellbank (Montreal, QC,
Canada). Details of the cell lines used can be found in
Table S4 in Additional file 1. This study was approved
by the local ethics committee (McGill University IRB).
The HapMap immortalized LCLs were grown in T75
flasks in 1X RPMI 1640 Media (Invitrogen, Burlington,
ON, Canada), with 2 mM L-glutamine, 15% fetal bovine
serum and 1% (penicillin/streptomycin) at 37 °C with 5%
CO
2
. Fibroblasts primary cell lines were grown i n med-
ium containing a-MEM (SigmaAldrich, Oakville, ON,
Canada) supplemented with 2 mmol/l L-glutamine,
100 U/ml penicillin, 100 mg/ml streptomycin, and 10%
fetal bovine serum (SigmaAldrich) at 37°C with 5% CO
2
.
Morcos et al. Genome Biology 2011, 12:R25
/>Page 10 of 14
At 70 to 80% confluence, the cells were harvested and
stored at -70°C until RNA and DNA extraction.
RNA and DNA extraction and cDNA synthesis
Total RNA was extracted from cell l ysates resuspended
in 600 ml RLT lysis buffer using the RNeasy Mini Kit
(Qiagen, Ontario , Canada). High RNA quality w as
confirmed for all samples using the Agilent 2100 Bio-
Analyzer (Agilent Technologies, Mississauga, ON,
Canada) and the concentrations w ere determined using
Nanodrop ND-1000 (NanoDrop Technologies, Wilming-
ton, DE, USA). A cDNA synthesis protocol was applied
on the heteronuclear DNA, and allowed the measure-
ment of unspliced primary transcripts. Approximately
150 mg of total RNA was isolated, treated with 6 U
DNase I and poly(A). The RNA was then enriched using
the MicroPoly(A)Purist protocol (Ambion Inc., Streets-
ville, ON, Canada). The first- and second-strand cDNA
synthesis was carried out on 1 μgpoly(A)-enriched
RNA using random hexamers and second strand cDNA
synthesis was performed using the Superscript Double-
Stranded cDNA Synthesis Kit (Invitrogen). DNA was
extracted from cell lysates resuspended in 200 ml phos-
phate-buffered saline using the GenElute DNA Miniprep
Kit (SigmaAldrich). Concentrations were determined
using the Quant-iT PicoGreen kit (Invitrogen).
Allelic expression analysis on Human1M or
Human1M-Duo beadchips
Approximately 200 ng of genomic DNA and a 50 to
300 ng double-stranded cDNA sample were used for the
parallel genotyping and AE analysis on the Illumina Infi-
nium Human1M or Human1M-Duo SNP bead microar-
ray as previously described [32] . The parallel assessment
of gDNA and cDNA heterozygote ratios was carried out
essentially as described earlier [32], but signal intensity
normalization at heterozygous sites followed a slightly
modified approach. For the AE analysis, we utilized the
Xraw and Yraw signal intensities and since the variances
in the two channels were not the same (that is, it is a
function of total intensity from both channels), a nor-
malization of the variation was performed to allow com-
parison between gDNA and cDNA allele ratios. In this
study, only the b ratio was normalized (Xraw/(Xraw +
Yraw)) from heterozygous SNPs with a total intensity
(Xraw + Yraw) hig her than the threshold value of 1,000.
The s catter plot of t he b rati o against the logarithm 10
scaled total intensity fits well with polynomial regression
model (quadratic regression model). This model shows a
better fit than the linear regression model that we
employed earlier for normalization [32], which works
well in higher intensity parts but poor in lower intensity
parts in many sample s. The normalization proc ess can
be briefly summarized into the following steps: step 1,
the b ratio is calculated along with total intensity in
log10 scale for all heterozygous SNPs; step 2, all data
points with greater than 1,000 in total intensity are
divided into 50 intensity bins; step 3, a fitted curve from
the median b ratio in each bin is computed using a
polynomial regression model (quadratic regression) y =
b1x + b2 × 2 + a, where y is the expected b ratio from
the cur ve and × is the log10 scaled total intensity; step
4, from the fitted curve, the expected b ratio based on
total intensity is calculated; step 5, the final normalized
b ratio equals (bobs - bexpected + 0.5). Following nor-
malization, all medi an b ratio values in all intensity bins
should b e close, if not equal, to 0.5. Phasing of the gen-
otypes in the trios were done using Beagle [49] and in
the three-generation pedigree by Merlin [50].
Validation of imprinted genes and genomic regions
Geneswereconsideredtobeimprintediftheyhad
extreme AE with an average of more than 2.9-fold dif-
ference (1 SD calculated from genome-wide population
data) between the two alleles as well as observatio n of
transmission of AE that is consistent with paternal or
maternal imprinting.
For novel imprinted genes and g enomic regions, at
least t hree consecutives SNPs needed to show extreme
AE (> 2.9-fold) for them to be included in the analysis.
For partial imprinted genes and regions, AE levels were
required to fall within 2- to 2.9-fold average difference
among all informative heterozygotes. Windows were cal-
culated using a previously published method [32].
Validation of the Illumina Array was performed by
measuring AE with normalized Sanger sequencing in
LCL and fibroblast samples heterozygous for specific
SNPs. Paired genomic DNA and cDNA from the sam-
ples were amplified for a specific SNP, verified by
agarose gel electrophoresis and sequenced with ABI
Big Dye chemistry and capillary electrophoresis on an
ABI 3730 sequencer (Applied Biosystems, Foster City,
CA, USA). The relative allelic expression levels for
each SNP were assessed with the Peak-Picker software
[34] and allele ratios below 0.1 or above 10 were
assigned a value of 0.1 or 10, respectively, as they
represent monoallelic expression (indistinguishable
from ho mozygous site s). Similarly, estimated allele
ratios below 0.1 or above 10 from the Illumina 1M
assay were also assigned these values as they do not
significantly differ from the homozygote ratios in
BeadChip genotyping.
Heritability
Variants showing extreme AE were assessed for herit-
ability of the AE using population mapping data for the
same cell type and for transmission compatible with
Mendelian inheritance in the pedigrees.
Morcos et al. Genome Biology 2011, 12:R25
/>Page 11 of 14
Demethylation treatment
Two lymphoblast cell lines (19099 and 19141) were
treated with three concentrations (1, 5 and 10 μM) of
the demethylating drug AZA every 24 hours for 3 days.
For t hese treatment groups, the viability was 73%, 69%
and 68%, respectively. We chose to use a concentration
of 5 μM for treatment studies in these two cell lines.
A th ird LCL (12892) was treated with 10 M AZA for 5
and 10 days. Total RNA was collected and prepared for
genome-wide AE analysis at each time point and in
untreated controls as described above.
To confirm demethylation, we also collected DNA in
untreated and treated states from 12892.We combined the
5- and 10-day treatment groups as there was insufficient
DNA for the 10-day group alone. We fragmented 10 μgof
DNA by mixing it with TE buffer and nebulization buffer
placed in a nebulizer cup. Forty-five psi of nitrogen was
passed through the nebulizer cup for 1 minute in order to
fragment the DNA. The DNA was then purified using a
Qiagen MiniElute PCR Purification kit (Qiagen). Qiagen’s
buffer PBI was added and it was passed through a spin col-
umn, then PE was passed through the column, then buffer
EB to elute the DNA. Next was an AMPure bead purifica-
tion step in order to isolate the appropriate size fragments
required (over 1,000 bp). Buffer EB and AMPure beads
were added to the DNA. Then the beads were collected
using a magnetic particle concentrator, washed with etha-
nol and finally the DNA was eluted from the beads using
buffer EB.
A methyl collector version B1 (Active Motif, Carlsbad,
CA, USA) was used to isolate methylated CpG islands
from fragmented gen omic DNA according to the manu-
facturer’ s protocol in order to verify demethylation of
the DNA upon AZA treatment. In the first step, 1 μgof
DNA was mixed with His-MBD2b protein, along with
the binding buffer provided and magnetic beads to cap-
ture the protein-DNA complex. Next, the beads were
collected by the magnetic particle concentrator, the
beads were washed with more binding buffer, and finally
the beads were collected again and the supernata nt dis-
carded. Lastly, the methylated fragments were recovered
by incubating the solution with the provided elution
buffer.
Transmission analyses
Transmission patterns from parent to offspring for AE
loci were assessed in the above-mentioned families (two
LCL C EPH families, one LCL Caucasian trio, one LCL
Yoruba trio and nine fibroblasts trios). Patterns consis-
tent with imprinting were observed when the overex-
pressed allele always came from the same parent
regardless of which allele was associated with overex-
pression in the parent.
Population mapping data
Mapping of heritable AE traits in CEU LCLs has been pre-
viously reported by us [ 32]. For the fibroblasts, a similar
approach for population mapping was employed, using 64
unrelated primary fibroblasts from parent-offspring tri os
(most of the children were only analyzed for genotypes in
DNA in order to phase the parental allelic expression
data). These parental samples were phenotypically normal
donors of Caucasian origin. The genome-wide mapping of
AE in primary fibroblasts will be reported separately.
Additional material
Additional file 1: Tables S1, S2, S3, and S4. Tables of loci not
imprinted, uninformative loci or of loci used in the validation as well as a
description of LCL and fibroblast samples.
Additional file 2: Figure S1. Figure demonstrating the correlation of AE
between normalized Sanger sequencing and the Illumina array.
Additional file 3: Tables S5 and S6. Candidate windows in LCLs and
fibroblasts showing high allelic expression.
Additional file 4: Figure S2. Figure demonstrating four loci showing
imprinted expression.
Abbreviations
AE: allelic expression; AZA: 5-azadeoxycytidine; IBD: identical-by-descent; LCL,
lymphoblast cell line; RME: random monoallelic expression; SD: standard
deviation; SNP: single-nucleotide polymorphism.
Acknowledgements
This work is supported by Genome Quebec and Genome Canada. TP holds
a Canada Research Chair (Tier 2) in Human Genomics. DJV and LM are
supported by the Canadian Institutes of Health Research (CIHR).
Author details
1
McGill University and Genome Quebec Innovation Centre, 740 Dr Penfield
Avenue, Montreal, Quebec, H3A 1A4, Canada.
2
Illumina Inc., 9885 Towne
Centre Drive, San Diego, CA 92121, USA.
Authors’ contributions
TP conceived research; DKP, LM, DJV and TP designed experiments; LM, VK,
KCLL, AM and DJV conducted experiments; BG, DKP, and TP designed
computational and analytical methods; BG, LM, DJV, KLG and TP analyzed
data; TP, LM and DJV drafted the manuscript and all authors contributed to
final manuscript writing and its revision.
Competing interests
The authors declare that they have no competing interests.
Received: 8 October 2010 Revised: 21 January 2011
Accepted: 21 March 2011 Published: 21 March 2011
References
1. Jiang YH, Bressler J, Beaud AL: Epigenetics and human disease. Annu Rev
Genomics Hum Genet 2004, 5:479-510.
2. Kong A, Steinthorsdottir V, Masson G, Thorleifsson G, Sulem P,
Besenbacher S, Jonasdottir A, Sigurdsson A, Kristinsson KT, Jonasdottir A,
Frigge ML, Gylfason A, Olason PI, Gudjonsson SA, Sverrisson S, Stacey SN,
Sigurgeirsson B, Benediktsdottir KR, Sigurdsson H, Jonsson T,
Benediktsson R, Olafsson JH, Johannsson OT, Hreidarsson AB, Sigurdsson G,
DIAGRAM Consortium, Ferguson-Smith AC, Gudbjartsson DF,
Thorsteinsdottir U, Stefansson K: Parental origin of sequence variants
associated with complex diseases. Nature 2009, 462:868-874.
Morcos et al. Genome Biology 2011, 12:R25
/>Page 12 of 14
3. Wolf JB, Cheverud JM, Roseman C, Hager R: Genome-wide analysis reveals
a complex pattern of genomic imprinting in mice. PLoS Genet 2008, 4:
e1000091.
4. Wood AJ, Oakey RJ: Genomic imprinting in mammals: emerging themes
and established theories. PLoS Genet 2006, 2:e147.
5. Frost JM, Moore GE: The importance of imprinting in the human
placenta. PLoS Genet 2010, 6:e1001015.
6. Tycko B, Morison IM: Physiological functions of imprinted genes. J Cell
Physiol 2002, 192:245-258.
7. Hore TA, Rapkins RW, Graves JA: Construction and evolution of imprinted
loci in mammals. Trends Genet 2007, 23:440-448.
8. Kerkel K, Spadola A, Yuan E, Kosek J, Jiang L, Hod E, Li K, Murty VV,
Schupf N, Vilain E, Morris M, Haghighi F, Tycko B: Genomic surveys by
methylation-sensitive SNP analysis identify sequence-dependent allele-
specific DNA methylation. Nat Genet 2008, 40:904-908.
9. Pollard KS, Serre D, Wang X, Tao H, Grundberg E, Hudson TJ, Clark AG,
Frazer K: A genome-wide approach to identifying novel-imprinted genes.
Hum Genet 2008, 122:625-634.
10. Lewis A, Mitsuya K, Umlauf D, Smith P, Dean W, Walter J, Higgins M, Feil R,
Reik W: Imprinting on distal chromosome 7 in the placenta involves
repressive histone methylation independent of DNA methylation. Nat
Genet 2004, 36:1291-1295.
11. Luedi PP, Dietrich FS, Weidman JR, Bosko JM, Jirtle RL, Hartemink AJ:
Computational and experimental identification of novel human
imprinted genes. Genome Res 2007, 17:1723-1730.
12. Sha K: A mechanistic view of genomic imprinting. Annu Rev Genomics
Hum Genet 2008, 9:197-216.
13. Luedi PP, Hartemink AJ, Jirtle RL: Genome-wide prediction of imprinted
murine genes. Genome Res 2005, 15:875-884.
14. Nikaido I, Saito C, Mizuno Y, Meguro M, Bono H, Kadomura M, Kono T,
Morris GA, Lyons PA, Oshimura M, Hayashizaki Y, Okazaki Y, RIKEN GER
Group; GSL Members: Discovery of imprinted transcripts in the mouse
transcriptome using large-scale expression profiling. Genome Res 2003,
13:1402-1409.
15. Daelemans C, Ritchie ME, Smits G, Abu-Amero S, Sudbery IM, Forrest MS,
Campino S, Clark TG, Stanier P, Kwiatkowski D, Deloukas P, Dermitzakis ET,
Tavaré S, Moore GE, Dunham I: High-throughput analysis of candidate
imprinted genes and allele-specific gene expression in the human term
placenta. BMC Genet 2010, 11:25.
16. Ruf N, Dunzinger U, Brinckmann A, Haaf T, Nurnberg P, Zechner U:
Expression profiling of uniparental mouse embryos is inefficient in
identifying novel imprinted genes. Genomics 2006, 87:509-519.
17.
Wang X, Sun Q, McGrath SD, Mardis ER, Soloway PD, Clark AG:
Transcriptome-wide identification of novel imprinted genes in neonatal
mouse brain. PLoS One 2008, 3:e3839.
18. Gregg C, Zhang J, Weissbourd B, Luo S, Schroth GP, Haig D, Dulac C: High-
resolution analysis of parent-of-origin allelic expression in the mouse
brain. Science 2010, 329:643-648.
19. Kanber D, Berulava T, Ammerpohl O, Mitter D, Richter J, Siebert R,
Horsthemke B, Lohmann D, Buiting K: The human retinoblastoma gene is
imprinted. PLoS Genet 2009, 5:e1000790.
20. Monk D, Wagschal A, Arnaud P, Muller PS, Parker-Katiraee L, Bourc’his D,
Scherer SW, Feil R, Stanier P, Moore GE: Comparative analysis of human
chromosome 7q21 and mouse proximal chromosome 6 reveals a
placental-specific imprinted gene, TFPI2/Tfpi2, which requires EHMT2
and EED for allelic-silencing. Genome Res 2008, 18:1270-1281.
21. Yu Y, Xu F, Peng H, Fang X, Zhao S, Li Y, Cuevas B, Kuo WL, Gray JW,
Siciliano M, Mills GB, Bast RC Jr: NOEY2 (ARHI), an imprinted putative
tumor suppressor gene in ovarian and breast carcinomas. Proc Natl Acad
Sci USA 1999, 96:214-219.
22. Okita C, Meguro M, Hoshiya H, Haruta M, Sakamoto YK, Oshimura M: A new
imprinted cluster on the human chromosome 7q21-q31, identified by
human-mouse monochromosomal hybrids. Genomics 2003, 81:556-559.
23. Morison IM, Ramsay JP, Spencer HG: A census of mammalian imprinting.
Trends Genet 2005, 21:457-465.
24. Morison IM, Reeve AE: A catalogue of imprinted genes and parent-of-
origin effects in humans and animals. Hum Mol Genet 1998, 7:1599-1609.
25. Gimelbrant A, Hutchinson JN, Thompson BR, Chess A: Widespread
monoallelic expression on human autosomes. Science 2007,
318:1136-1140.
26. Pernis B, Chiappino G, Kelus AS, Gell PG: Cellular localization of
immunoglobulins with different allotypic specificities in rabbit lymphoid
tissues. J Exp Med 1965, 122:853-876.
27. Chess A, Simon I, Cedar H, Axel R: Allelic inactivation regulates olfactory
receptor gene expression. Cell 1994, 78:823-834.
28. Rajewsky K: Clonal selection and learning in the antibody system. Nature
1996, 381:751-758.
29. Hollander GA, Zuklys S, Morel C, Mizoguchi E, Mobisson K, Simpson S,
Terhorst C, Wishart W, Golan DE, Bhan AK, Burakoff SJ: Monoallelic
expression of the interleukin-2 locus. Science 1998, 279:2118-2121.
30. Gimelbrant AA, Ensminger AW, Qi P, Zucker J, Chess A: Monoallelic
expression
and asynchronous replication of p120 catenin in mouse and
human cells. J Biol Chem 2005, 280:1354-1359.
31. Rouhi A, Gagnier L, Takei F, Mager DL: Evidence for epigenetic
maintenance of Ly49a monoallelic gene expression. J Immunol 2006,
176:2991-2999.
32. Ge B, Pokholok DK, Kwan T, Grundberg E, Morcos L, Verlaan DJ, Le J,
Koka V, Lam KC, Gagne V, D ias J, Hoberman R, Montpetit A, Joly MM,
Harvey EJ, Sinnett D, Beaulieu P, Hamon R, Graziani A, Dewar K,
Harmsen E, M ajewski J, Göring HH, Naumova AK, Blanchette M,
Gunderson KL, Pastinen T: Global patterns of cis v ariation in human
cells revealed by high-density allelic expression analysis. Nat Genet
2009, 41:1216-1222.
33. Grafodatskaya D, Choufani S, Ferreira JC, Butcher DT, Lou Y, Zhao C,
Scherer SW, Weksberg R: EBV transformation and cell culturing
destabilizes DNA methylation in human lymphoblastoid cell lines.
Genomics 2010, 95:73-83.
34. Ge B, Gurd S, Gaudin T, Dore C, Lepage P, Harmsen E, Hudson TJ,
Pastinen T: Survey of allelic expression using EST mining. Genome Res
2005, 15:1584-1591.
35. Kobayashi H, Yamada K, Morita S, Hiura H, Fukuda A, Kagami M, Ogata T,
Hata K, Sotomaru Y, Kono T: Identification of the mouse paternally
expressed imprinted gene Zdbf2 on chromosome 1 and its imprinted
human homolog ZDBF2 on chromosome 2. Genomics 2009, 93:461-472.
36. Cavaille J, Seitz H, Paulsen M, Ferguson-Smith AC, Bachellerie JP:
Identification of tandemly-repeated C/D snoRNA genes at the imprinted
human 14q32 domain reminiscent of those at the Prader-Willi/
Angelman syndrome region. Hum Mol Genet 2002, 11:1527-1538.
37. Seitz H, Youngson N, Lin SP, Dalbert S, Paulsen M, Bachellerie JP, Ferguson-
Smith AC, Cavaille J: Imprinted microRNA genes transcribed antisense to
a reciprocally imprinted retrotransposon-like gene. Nat Genet 2003,
34:261-262.
38. Bentley L, Nakabayashi K, Monk D, Beechey C, Peters J, Birjandi Z, Khayat FE,
Patel M, Preece MA, Stanier P, Scherer SW, Moore GE: The imprinted
region on human chromosome 7q32 extends to the carboxypeptidase A
gene cluster: an imprinted candidate for Silver-Russell syndrome. J Med
Genet 2003, 40:249-256.
39. Barel O, Shalev SA, Ofir R, Cohen A, Zlotogora J, Shorer Z, Mazor G, Finer G,
Khateeb S, Zilberberg N, Birk OS: Maternally inherited Birk Barel mental
retardation dysmorphism syndrome caused by a mutation in the
genomically imprinted potassium channel KCNK9. Am J Hum Genet 2008,
83:193-199.
40. Qian N, Frank D, O ’Keefe D, Dao D, Zhao L, Yuan L, Wang Q, Keating M,
Walsh C, Tycko B: The IPL gene on chromosome 11p15.5 is imprinted in
humans and mice and is similar to TDAG51, implicated in Fas
expression and apoptosis. Hum Mol Genet 1997, 6:2021-2029.
41. Higashimoto K, Soejima H, Yatsuki H, Joh K, Uchiyama M, Obata Y, Ono R,
Wang Y, Xin Z, Zhu X, Masuko S, Ishino F, Hatada I, Jinno Y, Iwasaka T,
Katsuki T, Mukai T: Characterization and imprinting status of OBPH1/
Obph1 gene: implications for an extended imprinting domain in human
and mouse. Genomics 2002, 80:575-584.
42. Rougeulle C, Glatt H, Lalande M: The Angelman syndrome candidate
gene, UBE3A/E6-AP, is imprinted in brain. Nat Genet
1997, 17:14-15.
43.
McCann JA, Zheng H, Islam A, Goodyer CG, Polychronakos C: Evidence
against GRB10 as the gene responsible for Silver-Russell syndrome.
Biochem Biophys Res Commun 2001, 286:943-948.
44. Mochida GH, Mahajnah M, Hill AD, Basel-Vanagaite L, Gleason D, Hill RS,
Bodell A, Crosier M, Straussberg R, Walsh CA: A truncating mutation of
TRAPPC9 is associated with autosomal-recessive intellectual disability
and postnatal microcephaly. Am J Hum Genet 2009, 85:897-902.
Morcos et al. Genome Biology 2011, 12:R25
/>Page 13 of 14
45. Mir A, Kaufman L, Noor A, Motazacker MM, Jamil T, Azam M, Kahrizi K,
Rafiq MA, Weksberg R, Nasr T, Naeem F, Tzschach A, Kuss AW, Ishak GE,
Doherty D, Ropers HH, Barkovich AJ, Najmabadi H, Ayub M, Vincent JB:
Identification of mutations in TRAPPC9, which encodes the NIK- and IKK-
beta-binding protein, in nonsyndromic autosomal-recessive mental
retardation. Am J Hum Genet 2009, 85:909-915.
46. Philippe O, Rio M, Carioux A, Plaza JM, Guigue P, Molinari F, Boddaert N,
Bole-Feysot C, Nitschke P, Smahi A, Munnich A, Colleaux L: Combination of
linkage mapping and microarray-expression analysis identifies NF-
kappaB signaling defect as a cause of autosomal-recessive mental
retardation. Am J Hum Genet 2009, 85:903-908.
47. Hannula K, Lipsanen-Nyman M, Scherer SW, Holmberg C, Hoglund P, Kere J:
Maternal and paternal chromosomes 7 show differential methylation of
many genes in lymphoblast DNA. Genomics 2001, 73:1-9.
48. Frost JM, Monk D, Stojilkovic-Mikic T, Woodfine K, Chitty LS, Murrell A,
Stanier P, Moore GE: Evaluation of allelic expression of imprinted genes
in adult human blood. PLoS One 2010, 5:e13556.
49. Browning SR, Browning BL: Rapid and accurate haplotype phasing and
missing-data inference for whole-genome association studies by use of
localized haplotype clustering. Am J Hum Genet 2007, 81:1084-1097.
50. Abecasis GR, Cherny SS, Cookson WO, Cardon LR: Merlin –rapid analysis of
dense genetic maps using sparse gene flow trees. Nat Genet 2002,
30:97-101.
doi:10.1186/gb-2011-12-3-r25
Cite this article as: Morcos et al.: Genome-wide assessment of imprinted
expression in human cells. Genome Biology 2011 12:R25.
Submit your next manuscript to BioMed Central
and take full advantage of:
• Convenient online submission
• Thorough peer review
• No space constraints or color figure charges
• Immediate publication on acceptance
• Inclusion in PubMed, CAS, Scopus and Google Scholar
• Research which is freely available for redistribution
Submit your manuscript at
www.biomedcentral.com/submit
Morcos et al. Genome Biology 2011, 12:R25
/>Page 14 of 14