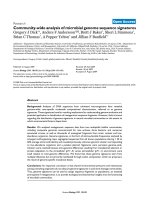
Báo cáo y học: "Community transcriptomics reveals universal patterns of protein sequence conservation in natural microbial communities" pdf
Bạn đang xem bản rút gọn của tài liệu. Xem và tải ngay bản đầy đủ của tài liệu tại đây (1.43 MB, 24 trang )
RESEARCH Open Access
Community transcriptomics reveals universal
patterns of protein sequence conservation in
natural microbial communities
Frank J Stewart
1
, Adrian K Sharma
2
, Jessica A Bryant
2
, John M Eppley
2
and Edward F DeLong
2*
Abstract
Background: Combined metagenomic and metatranscriptomic datasets make it possible to stu dy the molecular
evolution of diverse microbial species recovered from their native habitats. The link between gene expression level
and sequence conservation was examined using shotgun pyrosequencing of microbial community DNA and RNA
from diverse marine environments, and from forest soil.
Results: Across all samples, expressed genes with transcripts in the RNA sample were significantly more conserved
than non-exp ressed gene sets relative to best matches in reference databases. This discrepancy, observed for many
diverse individual genomes and across entire communities, coincided with a shift in amino acid usage between
these gene fractions. Expressed genes trended toward GC-enriched amino acids, consistent with a hypothesis of
higher levels of functional constraint in this gene pool. Highly expressed genes were significantly more likely to fall
within an orthologous gene set shared between closely related taxa (core genes). However, non-core genes, when
expressed above the level of detection, were, on average, significantly more highly expressed than core genes
based on transcript abundance normalized to gene abundance. Finally, expressed genes showed broad similarities
in function across samples, being relatively enriched in genes of energy metabolism and underrepresented by
genes of cell growth.
Conclusions: These patterns support the hypothesis, predicated on studies of model organisms, that gene
expression level is a primary correlate of evolutionary rate across diverse microbial taxa from natural environments.
Despite their complexity, meta-omic datasets can reveal broad evolutionary patterns across taxonomically,
functionally, and environmentally diverse communities.
Background
Variation in the rate and pattern of amino acid substitu-
tion is a fundamental property of protein evolution.
Understanding t his variation is intrinsic to core topics
in evolutionary analysi s, including phylogen etic recon-
struction, quantification of selection pressure, and iden-
tification of proteins criti cal to cellular funct ion [1,2]. A
diverse range of factors has been postulated to affect the
rate of sequence evolution within individual genomes,
including mutation and recomb ination rate [3], genetic
contributions to fit ness (that is, gene essentiality) [4],
timing of replication [5], number of protein-protein
interactio ns [6-8], and gene expression level [ 9]. Among
these, gene expre ssion level has emerged as the stron-
gest predictor of evolutionary rate across diverse taxa,
with highly expressed genes experiencing high sequence
conservation [9-14]. However, these studies have focused
on model organisms or small numbers of target species.
The links be tween gene expression and broader evolu-
tionary properties, including evolutionary rate, and the
mechanistic basis for these relationships remain poorly
described for the vast majority of organisms, notably
non-model taxa from diverse natural communities.
Deep-coverage sequencing of microbial community
DNA and RNA (metagenomes and me tatranscript omes)
provides an unprecedented opportunity to explore
protein-coding genes across diverse organisms from
* Correspondence:
2
Department of Civil and Environmental Engineering, Massachusetts Institute
of Technology, Parsons Laboratory 48, 15 Vassar Street, Cambridge, MA
02139, USA
Full list of author information is available at the end of the article
Stewart et al. Genome Biology 2011, 12:R26
/>© 2011 Stewart et al.; licensee BioMed Central Ltd. This is an open access article distributed under the terms of the Creative Commons
Attribution Lice nse ( which permits unrestricted use, distribution, and reproduction in
any medium, provided the original work is properl y cited.
natural populations. Such studies have yielded valuable
insight into the genetic potential and functional activity of
natural communities [15-19], but thus far have been
applied only sparingly to questions of evolution. Further-
more, only a subset of studies present coupled DNA-RNA
datasets for comparison [17,19-21]. When analyzed in tan-
dem, coupled DNA-RNA datasets facilitate categorization
of the relative transcription levels of different gene cate-
gories, potentially revealing properties of sequence evolu-
tion driven in part by expression level variation. However,
it remains uncertain whether broad evolutionary correlates
of gene expression, potentially including sequence conser-
vation, would even be detectable in community-level sam-
ples, which contain sequences from potentially thousands
of widely divergent taxa. Here, we compare microbial
metagenomic and metatranscriptomic datasets from mar-
ine and terrestrial habitats to explore fundamental proper-
ties of sequence evolution in the expressed gene set.
Specifically, we use coupled microbial (Bacteria and
Archaea) metagenomic and metatranscriptomic datasets
to explore the hypothes is that highly expressed genes are
more conserved than minimally expressed genes. In lieu
of conservation estimates based on alignments of ortho-
logous genes, which are not feasible using fragmentary
shotgun data containing tens of thousands of genes,
sequence conservation was estimated based on amino
acid identity relative to top matches in a reference data-
base. Our results indicate a strong inverse relationship
between evolutionary rate and gene expression level in
natural microbial communities, measured here by proxy
using transcript abundance. Furthermore, these r esults
demonstrate broad consistencies in protein-coding gene
expression, amino acid u sage, and metabolic function
across ecologically and taxonomically diverse microor-
ganisms from different environments. This study illus-
trates the utility of environmental meta-omic datasets for
informing t heoretical pred ictions based (largely) on
model organisms in controlled laboratory settings.
Results and discussion
Expressed genes evolve slowly
The relationship between gene expression (transcript
abundance) and sequence conservation was examined
for protein-coding genes in coupled metagenome and
metatranscriptome datasets generated by shotgun pyro-
sequencing of microbial community DNA and RNA,
respectively. These datasets represent varied environ-
ments, including the oligotrophic water column from
two subtropi cal open ocean sites in the Bermuda Atlan-
tic Ti me Series (BATS) and Hawaii Ocean Time Series
(HOT) projects, the oxygen minimum zone (OMZ)
formed in the nutrient-rich coastal upwelling zone off
northern Chile, and the surface soil layer from a North
American temperate forest (Tables 1 and 2). Prior
studies have experimentally validated the metatranscrip-
tomic protocols used here (RNA amplification, cDNA
synthesis, pyrosequencing; see Materials and methods),
confirming that estimates of r elative transcript abun-
dance inferred from pyrosequencing accurately parallel
measurements based on q uantitative PCR [15,17,19].
Here, amino acid identity relative to a top match refer-
ence sequence identified by BLASTX against the
National Center for Biotechnology Information non-
redundant protein database (NCBI-nr) is used to esti-
mate sequence conservation.
In all the samples, amino acid identities, averaged
across all genes per dataset, were significantly higher for
RNA-derived sequences (metatranscriptomes) compared
to DNA-derived sequences (metagenomes), with an aver-
age difference of 8.9% between paired datasets (range, 4.4
to 14.7%; P < 0.001, t-test; Table 2 ). Further analysis of a
representative sample (OMZ, 50 m) showed that RNA
identities remained consistently elevated across a gradi-
ent of high-scoring segment pair (HSP) alignment lengths
(Figure 1). This pattern suggests that the DNA-RNA dif-
ference was not driven by the (on average) shorter read
lengths in the RNA transcript pool (length data not
shown), which could have imposed selec tion for reads
with higher identity in order to meet the bit score cutoff
(see Materials and methods). This pattern was not
observed in the highest alignment length bin (>100
amino acids), likely due to the small number of genes
(n = 53) detected among the RNA reads falling into this
category (for example, 0. 4% of those in the 40 to 50
amino acid bin; see error bars in Figure 1).
To further rule out that the DNA-RNA discrepancy
was due to methodological differe nces in DNA- and
RNA-derived samples (f or example, e rror rate variation
due to differential sample processing; see Materials and
methods), we examined amino acid identities in
expressed and non-expressed genes derived from the
DNA dataset only. Hereafter, we operationally define
‘non-expressed’ genesasthosedetectedonlyintheDNA
datasets, whereas ‘expressed’ genes are those detected in
both the DNA and RNA datasets (gene counts per fr ac-
tion are provided in Table 3). Across all datasets, mean
identities for DNA-derived non-expressed genes were
significantly l ower (mean difference, 10.6%; range, 3.7 to
19.4%; P <0.001,t-test; Table 2) than those of DNA-
derived expressed genes, whose values were similar t o
those of RNA transcripts that matched expressed genes
(Table 2). This trend was consistent a cross all samples
(Table 2) and independent of the database used for iden-
tifying reads, as comparisons against the Kyoto Encyclo-
pedia of Genes and Genomes (KEGG) and Global Ocean
Sampling (GOS) protein databases for a representative
sample (OMZ, 50 m) revealed a similar RNA-DNA
incongruity (Table 4). Furthermore, this pattern was
Stewart et al. Genome Biology 2011, 12:R26
/>Page 2 of 24
unchanged when ribosomal proteins were excluded from
the datasets (Table 4), as has been done previously to
avoid bias due to the high expression and conservation of
theseproteins[14].Thesedataconfirmasignificantly
higher level of sequence conservation i n expressed versus
non-expressed genes, broadly defined based on the pre-
sence or absence of transcripts.
Given the differences observed between expressed and
non-expressed categories, a positi ve correlation between
conservation and the relative level of gene expression
may also be anticipated [9]. Here, per-gene expression
level was measured as the ratio of gene transcript abun-
dance in the RNA relative to gene abundance in the
DNA, with abundance normalized to dataset size. Corre-
lations between amino acid identity and expression ratio
were not observed in any of the samples when all genes
representing all taxa were combined (r
2
=0to0.02;see
Figure 2 for a representative dataset). This pattern sug-
gests that for a substantial portion of the metatranscri p-
tome, transcriptional activity cannot be used as a
predictor of evolutionary rate. This is likely due in part
to the difficulty of accurately estimating expression
ratios for low frequency genes, which constitute the
majority of the metatranscriptome at the sequencing
depths used in this study [22,23]. However, across all
samples, mean amino acid identity consistently
increased with expression ratio when genes were binned
into broad categor ies: all genes, top 10%, top 1%, and
top 0.1% most highly expressed (Figur e 3). These data
indicat e that while transcript abundance is a poor quan-
titative indicator of sequence conservation on a gene-by-
gene basis in community datasets, the most highly
expressed genes are, on average, more highly conserved
than those expressed at lower levels.
Genome-level corroboration
It is possible that differences in the relative representation
of genes in the BLAST databases may cause the incongru-
ity in sequence conservation between expressed and non-
expressed genes. Specifically, if expressed genes are more
abundant in the database (which may be likely i f these
genes are also more abundant in nature), an expressed
gene sampled from t he environment will have a higher
likelihood of finding a close match in the database, relative
to a non-expressed gene. We therefore examined the dis-
crepancy between expressed and non-expressed gene sets
Table 1 Read counts and accession numbers of pyrosequencing datasets
Sequences
a
Site Depth (m) Data Total Non-rRNA
b
Coding
c
Accession
OMZ 50 DNA 393,403 340,117 204,953 SRX025906
RNA 379,333 117,760 42,327 SRX025907
85 DNA 595,662 567,772 341,350 SRX025908
RNA 184,386 69,200 16,960 SRX025909
110 DNA 403,227 380,057 215,217 SRX025910
RNA 557,762 268,093 81,492 SRX025911
200 DNA 516,426 485,044 274,463 SRX025912
RNA 441,273 149,699 39,218 SRX025913
BATS 216 20 DNA 357,882 343,370 223,563 SRX008032
RNA 511,525 334,507 124,832 SRX016882
50 DNA 464,652 423,258 244,638 SRX008033
RNA 365,838 263,811 91,489 SRX016883
100 DNA 525,606 498,222 305,260 SRX008035
RNA 519,951 334,037 129,369 SRX016884
HOT 186 25 DNA 623,559 596,902 331,347 SRX007372
RNA 561,821 252,586 113,664 SRX016893
75 DNA 995,747 654,106 363,459 SRX007369
RNA 557,718 199,416 55,545 SRX016897, SRX016896
110 DNA 473,166 458,260 237,759 SRX007370
RNA 398,436 135,452 34,644 This study, SRA028811
500 DNA 673,674 972,967 540,042 SRX007371
RNA 479,661 83,795 38,913 This study, sra028811
Soil Surface DNA 1,439,445 1,392,745 976,899 This study, sra028811
RNA 1,188,352 985,305 445,479 This study, sra028811
a
Generated on a Roche 454 GS FLX instrument.
b
All non-rRNA reads; duplicate reads (reads sharing 100% nucleotide identity and length) excluded.
c
Reads
matching (bit score >50) protein-coding genes in the NCBI-nr database. BATS, Bermuda Atlantic Time Series; HOT, Hawaii Ocean Time Series; OMZ, oxygen
minimum zone; rRNA, ribosomal RNA.
Stewart et al. Genome Biology 2011, 12:R26
/>Page 3 of 24
only for DNA reads whose top hits match the same refer-
ence genome. Under a null hypothesis of uniform evolu-
tionary rates across a genome, all genes in a sample whose
closest relative is the same reference genome should exhi-
bit uniform divergence from the reference.
The link between expression level and sequence con-
servation was observed at the level of individual genomes.
Figur e 4 (left panel) shows the discrepancy in amino acid
identity between expressed versus non-expressed genes
that match the top five most abundant reference taxa
(whole genomes) in each sample. In all genomes , exclud-
ing Bradyrhizobium jap onicum from the soil sample, the
mean amino acid identity of expressed genes was signifi-
cantly greater than that of non-expressed genes (P <
0.001, t-test). These taxon-specific patterns argue against
an overall bias due to varying levels of gene representa-
tion in the database. Rather, assuming that the sequences
that match the expressed and non-expressed gene frac-
tions of a given reference genome are indeed present in
the same genome in the sampled environment (an
ass umption that might be unwarranted if t hese two gene
fractions experience varying rates of recombination or
horizontal transfer among divergent taxa - see below),
these results suggest that differential conservation levels,
and not sampling artifacts, are driving the overall discre-
pancy between expressed and non-expressed genes.
Core genes are overrepresented in the expressed gene
fraction
Our data confirm an inverse relationship between expres-
sion level and evolutionary rate in natural microbial com-
munities. However, it remains unclear to what extent
gene expression level depends on a gene’ sfunctional
importance to organism fitness (that is, e ssentiality) ver-
sus other potential explanations, such as ‘ translational
accuracy or robustness’ [24]. It has been argued that
orthologous genes retained across divergent taxa (‘ core’
genes) may mediate basic cellular functions and that
such genes are more likely to be more essential than
non-core (taxon-specific) genes [25-27]. Here, we
Table 2 Mean percentage amino acid identity of 454 reads matching database reference genes (NCBI-nr) shared
between and unique to DNA and RNA samples
Percentage identity to reference genes present in
a
Depth (m) Data DNA+RNA
b
DNA only
c
RNA only All
d
OMZ 50 DNA 71.0 59.8 NA 60.8
RNA 73.8 NA 72.2 72.7
85 DNA 67.3 59.5 NA 59.8
RNA 68.4 NA 67.9 68.1
110 DNA 65.7 58.7 NA 59.7
RNA 68.5 NA 71.1 70.2
200 DNA 64.3 58.5 NA 59.1
RNA 67.0 NA 65.9 66.4
BATS 216 20 DNA 72.5 59.5 NA 62.7
RNA 75.6 NA 71.6 72.9
50 DNA 76.4 61.5 NA 64.4
RNA 78.3 NA 71.2 74.1
100 DNA 76.8 60.5 NA 63.9
RNA 78.6 NA 71.6 74.8
HOT 186 25 DNA 75.3 63.7 NA 65.7
RNA 76.4 NA 69.1 72.0
75 DNA 77.3 64.1 NA 65.6
RNA 77.5 NA 69.1 72.9
110 DNA 80.0 60.7 NA 62.4
RNA 81.3 NA 73.0 77.1
500 DNA 63.1 59.4 NA 59.6
RNA 64.0 NA 66.0 65.0
Soil Surface DNA 58.9 55.0 NA 56.1
RNA 59.8 NA 61.1 60.5
a
Mean percentage identity across all genes (unique accession numbers) identified via BLASTX against NCBI-nr (HSP alignment regions only; bit score cutoff = 50).
b
Genes present in both DNA and RNA datasets, that is, ‘expressed’ genes.
c
Genes present only in the DNA dataset, that is, ‘non-expressed’ genes.
d
Genes shared
between datasets (in DNA + RNA) plus genes unique to a dataset. BATS, Bermuda Atlantic Time Series; BLAST, Basic Local Alignment Search Tool; HOT, Hawaii
Ocean Time Series; HSP, high-scoring segment pair; NA, not applicable; NCBI-nr, National Center for Biotechnology Information non-redundant protein database;
OMZ, oxygen minimum zone; rRNA, ribosomal RNA.
Stewart et al. Genome Biology 2011, 12:R26
/>Page 4 of 24
calculated the proportiona l representation of expressed
and non-expressed genes in the core genome, determined
separately for each of the top five most abundant organ-
isms in each of the samples (18 taxa total). Each taxon’s
core genome is composed of a relative orthologous gene
set determined from comparison to a closely related sis-
ter taxon (or taxa; Table 5). The exact number of genes
within each core set would likely vary if different sister
taxa were used for comparison [28]. Here, the proportion
of each genome that fell within the core set varied widely,
from 17 to 80% (Table 5), reflecting natural var iation and
variation in the availability of whole genomes from differ-
ent taxonomic groups.
Expressed genes were significantly more likely to fall
within a core gene set shared across taxa. Figure 4 (right
panel) shows the difference in core genome representa-
tion (percentage of genes within core set) between
expressed and non-expressed gene fractions for each
reference organism. In 52 of the 60 comparisons (87%),
the percentage of expressed genes falling within the core
set was greater than that for the non-expressed gene
fraction; of these differences, 38 (73%) were significant
(P < 0.0009, chi-square). In some taxa, such as Prochlor-
ococcus marinus str. NATL2A, core genome representa-
tion was over 30% greater among expressed genes
relative to non-expressed genes. In contrast, for the
HOT 500 m dataset, expresse d genes were not enriched
in core genes, which we speculate may be due to the
activity of the microbial community at this depth (see
Conclusions s ection below). Overall, however, the data
support the broad trend that highly expressed genes are
more likely to belong to an orthologous set shared
across multiple taxa.
The differential representation of core genes within
expressed and non-expressed genes may influence the
relative sequence conservation levels of these two gene
fractions. Gene acquisition from external sources (for
example, homologous recombination, horizontal gene
transfer (HGT)) is an important source of genetic varia-
tion in bacteria [29]. A conserved core genome is tradi-
tionally thought to undergo lower rates of recombination
and HGT relative to more flexible genomic regions (for
example, genomic islands) [30], though the horizontal
trans fer of core genes may also be co mmon in some taxa
[31]. A central limitation to shotgun sequenci ng datasets
is that dispar ate sequences cannot be definitively linked
to the s ame genome, making it challenging to evaluate
the relative contributions of HGT, homologous recombi-
nation, and mutation to sequence divergence. Conse-
quently, it is possible that the higher levels of sequence
divergence observed in the non-expressed gene set a re
due in part to enhanced rates of HGT among the non-
core genes that predominate in this gene set.
Surprisingly, within the expressed gene fraction, non-
coregenesweremorehighlyexpressedthancoregenes.
Among the datasets representing the five most abundant
taxa per sample (n = 60, as above), 80% showed higher
expression levels (expression ratio) of non-core genes rela-
tive to core genes (Figure 5). Averaged across all of these
taxa, the expression ratio was 34% higher in non-core
genes relative to core genes (2.5 versus 1.9; n = 13,324 and
Table 3 Unique reference genes shared between and
unique to DNA and RNA datasets
Reference genes present in
a
Depth (m) DNA+RNA
b
DNA only
c
RNA only
OMZ 50 11,374 113,747 21,445
85 5801 172,055 6766
110 17,843 109,924 31,697
200 12,688 126,574 17,408
BATS 216 20 29,841 90,866 60,287
50 26,954 110,131 38,145
100 31,416 119,795 36,871
HOT 186 25 28,459 135,390 44,243
75 18,098 142,892 21,800
110 12,148 125,882 12,315
500 14,345 248,534 13,573
Soil Surface 104,453 283,180 107,475
a
Number of unique NCBI-nr reference genes (accession numbers) identified as
top matches to query reads via BLASTX (bit score > 50); in instances when a
read matched multiple genes with equal bit scores, all genes were counted.
b
Genes present in both DNA and RNA datasets, that is, ‘ expressed’ genes.
c
Genes present only in the DNA dat aset, that is, ‘non-expressed’ genes. BATS,
Bermuda Atlantic Time Series; BLAST, Basic Local Alignment Search Tool; HOT,
Hawaii Ocean Time Series; NCBI-nr, National Center for Biotechnology
Information non-redundant protein database; OMZ, oxygen minimum zone.
0
10
20
30
40
50
60
70
80
40-50 51-60 61-70 71-80 81-90 91-100 >100
Alignment length (amino acid)
% Amino acid identity
OMZ 50 m sample
Figure 1 Discrepancies in DNA (blue) and RNA (red) amino acid
identities over variable high-scoring segment pair alignment
lengths. Reads were binned by HSP alignment length, with
identities averaged across all genes identified per bin. Error bars are
95% confidence intervals.
Stewart et al. Genome Biology 2011, 12:R26
/>Page 5 of 24
30,096, respectively; P < 0.00001). This pattern seemingly
conflicts with studies based on cultured organisms. For
example, a prior comparative survey of 17 bacterial pro-
teomes showed a relative enrichment of peptides repre-
sentingproteinsencodedwithinthecoregenome[28].
Also, essential proteins necessary for organism survival
have been shown to be expressed at higher abundances
than nonessential proteins in cultures of both Escherichia
coli [32] and Pseudomonas aeruginosa [33]. This observa-
tion indirectly links core genome representation and gene
expression, as essential orthologs have been shown to be
more broadly represented among diverse taxonomic
groups than nonessential genes [34]. Our data, represent-
ing diverse taxa from the natural environment, raise the
hypothesis that core genes are more likely to be expressed
(above the level of detection at the sequencing depths
used here). However, non-core genes, when expressed, are
more likely to be expressed at higher levels. The high
expression of non-core genes, also observed previously for
Prochlorococcus [19], may reflect the importance of taxon-
specific genes for adaptation to individual niches in a het-
erogenous environment [30].
Functional patterns in expressed gene sets
The degree to which expressed gene sets share functional
similarity across microbial communities from diverse
habitats is unclear. Hewson et al. [16] observed shared
functional gene content among metatranscriptome sam-
ples taken from the same depth zone (upper photic layer)
at eight sites in the open ocean. Also, the four OMZ
metatranscriptome datasets analyzed in this study have
been shown to cluster separately from the corresponding
metagenome datasets based on functional category abun-
dances, suggesting similar expressed gene content across
depths [35]. However, this clustering was likely influenced
in part by variation in per-gene sequence abundance
(evenness) between the metagenomes and metatranscrip-
tome, and did not explicitly compare expressed and non-
expressed gene fractions. Here, we explored functional
differences between expressed and non-expressed genes
(as defined above) within metagenome (DNA) samples,
for which the rel ative read copy number per gene is
Table 4 Mean percentage amino acid identity of OMZ 50-m reads with top matches to distinct reference databases
(GOS, KEGG, NCBI-nr) and with ribosomal proteins removed
Percentage identity to reference genes present in
b
Database
a
Data DNA+RNA
c
DNA only
d
RNA only All
e
All data
GOS DNA 89.3 82.1 NA 82.8
GOS RNA 90.8 NA 87.5 89.3
KEGG DNA 67.8 58.3 NA 59.7
KEGG RNA 71.0 NA 69.4 69.6
NR DNA 71.0 59.8 NA 60.8
NR RNA 73.8 NA 72.2 72.7
Without ribosomal proteins
f
NR DNA 70.7 59.6 NA 60.6
NR RNA 73.6 NA 71.9 72.5
a
BLAST database against which reads were compared.
b
Mean percentage identity across all genes identified via BLASTX against NCBI-nr (HSP alignment regions
only; bit score cutoff = 50).
c
Genes present in both DNA and RNA datasets, that is, ‘expressed’ genes.
d
Genes present onl y in the DNA dataset, that is, ‘non-
expressed’ genes.
e
Genes shared between datasets (in DNA + RNA) plus genes unique to a dataset.
f
Ribosome-associated proteins removed manu ally from
datasets. BATS, Bermuda Atlantic Time Series; BLAST, Basic Local Alignment Search Tool; GOS, Global Ocean Sampling; HOT, Hawaii Ocean Time Series; HSP, high-
scoring segment pair; KEGG, Kyoto Encyclopedia of Genes and Genomes; NA, not applicable; NR, National Center for Biotechnology Information non-redundant
protein database (NCBI-nr); OMZ, oxygen minimum zone.
y = 1.5389Ln(x) + 71.846
10
100
1000
0.01 0.1 1 10 100 1000
y = 7.2772Ln(x) + 62.017
R
2
= 0.0835
10
100
1000
1 10 100 1000
R
2
= 0.0132
All data
Top 10% most highly expressed genes
Percent amino acid identity
Expression ratio (RNA/DNA)
BAT
S
20 m
Figure 2 Percentage amino acid identity as a function of
expression level in the Bermuda Atlantic Time Series 20 m
sample. Per gene expression level is measured as a ratio -
(Transcript abundance in RNA sample)/(Gene abundance in the
DNA sample) - with abundance normalized to dataset size. Per gene
percentage amino acid identity is averaged over all reads with top
BLASTX matches to that gene.
Stewart et al. Genome Biology 2011, 12:R26
/>Page 6 of 24
more uniform than for metatranscriptome samples. To
do so, the proportional abundance of KEGG gene cate-
gories and f unctional pathways was examined for five
samples representing contrasting environments: the oxy-
cline and lower photic zone of the coastal OMZ (50 m),
the suboxic, mesopelagic core of the OMZ (200 m), the
upper photic zone in the oligotrophic North Pacific
(HOT 25 m), the deep, mesopelagic zone (HOT 500 m),
and the soil from Harvard Forest.
Hierarchical clustering based on correlations in gene
category and functional pathway abundances indicated
clear divisions among datasets. Not surprisingly, both
the expressed and no n-expressed fractions from the soil
sample grouped apart from the ocean samples,
58 62 66 70 74 78 82 86 90 94 98
All genes
Top 10%
Top 1%
Top 0.1
%
OMZ 50m
OMZ 85m
OMZ 110m
OMZ 200m
BATS 50m
BATS 100m
BATS 20m
HOT 25m
HOT 75m
HOT 110m
HOT 500m
SOIL
Mean percent amino acid identity
Figure 3 Sequence conservation increases with mRNA expression ratio. Genes are binned by rank expression ratio: all genes, top 10%, 1%,
and 0.1% most highly expressed. Amino acid sequence identity is averaged across all DNA reads per gene (HSP alignment regions only), and
then across all genes per bin. Error bars are 95% confidence intervals.
Stewart et al. Genome Biology 2011, 12:R26
/>Page 7 of 24
highlighting functional differences between ocean and
soil communities (Figures 6 and 7). Among the four
ocean metagenomes, expressed gene sets clustered
together to the exclusion of the non-expressed gen es
from the same samples (Figure 6). Indeed, shifts in func-
tional gene usage between expressed and non-expressed
fractions were broadly similar across all samples (Figures
8 and 9). Instances in which all five samples showed the
same direction of change (increase or decrease) in
KEGG gene category abundance occurred in 14 of the
25 functional categories shown in Figure 8 (marked by
open stars), significantly higher (nine times) than ran-
dom expectations if ignoring potential covariance
between categories (P < 0.0002, chi-square). Notably,
across all five samples, the expressed gene set was sig-
nificantl y enriched in genes i nvolved in energy a nd
nucleotide metabolism, transcription, and protein fold-
ing, sorti ng, and degradation (Figure 8). In contrast, the
024681012
-20 -10 0 10 20 30 4
0
Ca. Pelagibacter sp. HTCC7211
Ca. Pelagibacter ubique HTCC1062
Nitrosopumilus maritimus
Prochlorococcus marinus CCMP1375
Ca. Pelagibacter ubique HTCC1002
Ca. Pelagibacter sp. HTCC7211
Nitrosopumilus maritimus
Ca. Pelagibacter ubique HTCC1062
Ca. Pelagibacter ubique HTCC1002
uncultured SUP05 cluster bacterium
Ca. Pelagibacter sp. HTCC7211
Ca. Pelagibacter ubique HTCC1002
Nitrosopumilus maritimus
Ca. Pelagibacter ubique HTCC1062
uncultured SUP05 cluster bacterium
Ca. Pelagibacter sp. HTCC7211
Ca. Pelagibacter ubique HTCC1062
Ca. Kuenenia stuttgartiensis
Ca. Pelagibacter ubique HTCC1002
uncultured SUP05 cluster bacterium
Ca. Pelagibacter sp. HTCC7211
Ca. Pelagibacter ubique HTCC1062
Ca. Pelagibacter ubique HTCC1002
alpha Proteobacterium HIMB114
Prochlorococcus marinus str. AS9601
Ca. Pelagibacter sp. HTCC7211
Prochlorococcus marinus str. AS9601
Prochlorococcus marinus str. MIT 9301
Ca. Pelagibacter ubique HTCC1062
Prochlorococcus marinus str. MIT 9312
Ca. Pelagibacter sp. HTCC7211
Ca. Pelagibacter ubique HTCC1062
Ca. Pelagibacter ubique HTCC1002
Prochlorococcus marinus str. MIT 9301
Prochlorococcus marinus str. NATL2A
Ca. Pelagibacter sp. HTCC7211
Prochlorococcus marinus str. AS9601
Prochlorococcus marinus str. MIT 9301
Prochlorococcus marinus str. MIT 9312
Ca. Pelagibacter ubique HTCC1062
Ca. Pelagibacter sp. HTCC7211
Prochlorococcus marinus str. AS9601
Prochlorococcus marinus str. MIT 9301
Prochlorococcus marinus str. MIT 9312
Ca. Pelagibacter ubique HTCC1062
Ca. Pelagibacter sp. HTCC7211
Prochlorococcus marinus str. NATL2A
Prochlorococcus marinus str. NATL1A
Ca. Pelagibacter ubique HTCC1062
Ca. Pelagibacter ubique HTCC1002
Ca. Pelagibacter sp. HTCC7211
Ca. Pelagibacter ubique HTCC1062
Ca. Pelagibacter ubique HTCC1002
Nitrosopumilus maritimus
alpha Proteobacterium HIMB114
Solibacter usitatus Ellin6076
Ca. Koribacter versatilis Ellin345
Acidobacterium capsulatum ATCC 51196
Bradyrhizobium_japonicum_USDA_110
bacterium Ellin514
Mean % identity Core genome representation
Differences: expressed minus non-expressed genes
OMZ 50m
OMZ 85m
OMZ 110m
OMZ 200m
BATS 50m
BATS 100m
BATS 20m
HOT 25m
HOT 75m
HOT 110m
HOT 500m
*
*
*
*
*
*
*
*
*
*
*
*
*
*
*
*
*
*
*
*
*
*
*
SOIL
Figure 4 Expressed and non-expressed genes differ in amino acid identity (left) and core genome representation (right). Data are from
DNA sequence sets and include the five most abundant taxa per sample, with taxon abundance determined by the proportion of total reads
with top matches to protein-coding genes in each genome (BLASTX of all DNA reads against NCBI-nr). ‘Core genome representation’ is
calculated as the percentage of each gene set (that is, expressed or non-expressed genes) falling within the core genome of each taxon, as
defined in the text. All differences (left and right panels) are significant (P < 0.001), unless marked with an asterisk.
Stewart et al. Genome Biology 2011, 12:R26
/>Page 8 of 24
non-expressed gene set was enriched in genes mediating
lipid metabolism and glycan biosynthesis and metabo-
lism; in all ocean samples but no t the soil sample, DNA
replication and repair was also significantly overrepre-
sented among non-expressed genes (P < 0.0004, chi-
square). At the finer resolution provided at the KEGG
pathway level, genes involved in oxidative phosphoryla-
tion, chaper ones and protein folding catalysis, transla-
tion factors, and photosynthesis were consistently and
significantly (P < 0.0001, chi-square) overrepresented
among expressed genes in al l samples, whereas genes of
peptidoglyca n biosynthesis, mismatch repair, and amino
sugar and nucleotide sugar metabolism were proportion-
ally more abundant in the non-expressed fraction
(Figure9).Thesedataindicate broad similarities in
functional gene expression across diverse microbial
communities, with expresse d gene pool s biased towards
tasks of energy metabolism and protein synthesis but
relatively underrepresented by genes of cell growth (for
example, lipid metabolism, DNA replication).
Database-independent analysis
Our characterization of relative evolutionary rates in
expressed versus non-expressed genes is based on
sequence divergence relative to closest relatives in the
sequence database (NCBI-nr). It is unclear to what
extent this same trend may be detected within clusters
of related sequences within our samples, i ndependent of
comparison to an external reference database. We there-
fore examined variability in amino acid divergence
within clusters of expressed and non-expressed protein-
coding sequences for five representative samples, includ-
ing shallow and deep depths from the OMZ and HOT
oceanic sites, and the surface soil sample (Table 6).
Mean identity per cluster was consistently higher for
DNA sequences in non-expressed clusters compared to
DNA sequences from expressed clusters (mean difference
5.3%; Table 6). This pattern is opposite to that observed
in comparisons of sequences to external reference data-
bases (above). However, we argue that this inverse pat-
tern is indeed consistent with our hypothesis that
expressed genes are more likely to be part of a core set
shared across taxa (Figure 4). If this hypothesis is true,
then the DNA-only cluster set (non-expressed genes) will
be relatively enriched in non-core genes, including those
present in only one taxon/genome and lacking any
known homologs (for example, orphans) [36,37]. In
environmental sequence sets, if these sequences appear
multiple times, they are more likely to be identical, or
nearly so, because they come from a single taxon popula-
tion and therefore cluster only with themselves (homo-
logs from other taxa are by definition absent and will not
fall into the cluster).
In contrast, if expressed genes are more lik ely to fall
within the core genome, clusters containing both
DNA- and RNA-derived sequences (that is, expressed
sequences) will be relatively enriched in homologs that
occur across m ultiple divergent taxa. By definition,
therefore, DNA+RNA clusters will be relatively
enriched in se quences differing at both the population
Table 5 Proportion of reference taxon genes shared with sister taxon (that is, core gene set)
Taxon
a
Number of CDS
b
Sister taxon
c
Percentage of core
d
Alpha Proteobacterium HIMB114 1,425 Pelagibacter ubique HTCC1062 63
Ca. Kuenenia stuttgartiensis 4,787 Planctomyces limnophilus DSM 3776 17
Nitrosopumilus maritimus 1,796 Cenarchaeum symbiosium 49
Ca. Pelagibacter sp. HTCC7211 1,447 Pelagibacter ubique HTCC1062 75
Ca. Pelagibacter ubique HTCC1002 1,423 Pelagibacter sp. HTCC7211 80
Ca. Pelagibacter ubique HTCC1062 1,354 Pelagibacter sp. HTCC7211 80
Prochlorococcus marinus AS9601 1,920 All Pro. strains 68
Prochlorococcus marinus CCMP1375 1,883 All Pro. strains 69
Prochlorococcus marinus MIT 9312 1,810 All Pro. strains 72
Prochlorococcus marinus MIT9301 1,906 All Pro. strains 67
Prochlorococcus marinus NATL1A 2,193 All Pro. strains 59
Prochlorococcus marinus NATL2A 2,162 All Pro. strains 59
Uncultured SUP05 cluster bacterium 1,456 Ca. Ruthia magnifica 52
Solibacter usitatus Ellin6076 7,826 Acidobacterium capsulatum ATCC 51196 22
Ca. Koribacter versatilis Ellin345 4,777 Acidobacterium capsulatum ATCC 51196 36
Acidobacterium capsulatum ATCC 51196 3,377 Solibacter usitatus Ellin6076 51
Bradyrhizobium japonicum USDA 110 8,317 Bradyrhizobium sp. BTAi1 49
Bacterium Ellin514 6,510 Verrucomicrobium spinosum DSM 4136 24
a
Representative taxon at high abundance in each sample.
b
Number of CDS is the number of protein-coding genes in the sequenced reference genome of each
taxon.
c
Sister taxon used for identification of core genome (see main text).
d
Percentage of core is the percen tage of protein-coding genes in each taxon that are
shared with the sister taxon. CDS, coding sequence.
Stewart et al. Genome Biology 2011, 12:R26
/>Page 9 of 24
level and at higher taxonomic levels (for example, ‘spe-
cies’ ), while DNA-only clusters will be enriched in
sequences differing only at the population level. Given
this explanation, we would predict that DNA+RNA
clusters (with RNA sequences excluded) are larger
than DNA-only clusters and that the DNA-only cluster
set as a whole is enriched in high identity clusters.
Indeed, DNA+RNA clusters are, on average, approxi-
mately 20 to 33% larger than DNA-only clusters (RNA
sequences not included in counts) and DNA-only clus-
ter sets, notably those of the OMZ samples, are
enriched in clusters with identities greater than 98%
(Figure 10). These data indicate that expressed gene
clusters recruit a larger and more diverse set of
sequences, consistent with the hypothesis that
expressed genes are more likely to represent core
genes shared across taxa. More generally, the contrast
between this self-clustering approach and the BLAST-
Ca. Pelagibacter sp. HTCC7211
Ca. Pelagibacter ubique HTCC1062
Nitrosopumilus maritimus
Prochlorococcus marinus CCMP1375
Ca. Pelagibacter ubique HTCC1002
Ca. Pelagibacter sp. HTCC7211
Nitrosopumilus maritimus
Ca. Pelagibacter ubique HTCC1062
Ca. Pelagibacter ubique HTCC1002
uncultured SUP05 cluster bacterium
Ca. Pelagibacter sp. HTCC7211
Ca. Pelagibacter ubique HTCC1002
Nitrosopumilus maritimus
Ca. Pelagibacter ubique HTCC1062
uncultured SUP05 cluster bacterium
Ca. Pelagibacter sp. HTCC7211
Ca. Pelagibacter ubique HTCC1062
Ca. Kuenenia stuttgartiensis
Ca. Pelagibacter ubique HTCC1002
uncultured SUP05 cluster bacterium
Ca. Pelagibacter sp. HTCC7211
Ca. Pelagibacter ubique HTCC1062
Ca. Pelagibacter ubique HTCC1002
alpha Proteobacterium HIMB114
Prochlorococcus marinus str. AS9601
Ca. Pelagibacter sp. HTCC7211
Prochlorococcus marinus str. AS9601
Prochlorococcus marinus str. MIT 9301
Ca. Pelagibacter ubique HTCC1062
Prochlorococcus marinus str. MIT 9312
Ca. Pelagibacter sp. HTCC7211
Ca. Pelagibacter ubique HTCC1062
Ca. Pelagibacter ubique HTCC1002
Prochlorococcus marinus str. MIT 9301
Prochlorococcus marinus str. NATL2A
Ca. Pelagibacter sp. HTCC7211
Prochlorococcus marinus str. AS9601
Prochlorococcus marinus str. MIT 9301
Prochlorococcus marinus str. MIT 9312
Ca. Pelagibacter ubique HTCC1062
Ca. Pelagibacter sp. HTCC7211
Prochlorococcus marinus str. AS9601
Prochlorococcus marinus str. MIT 9301
Prochlorococcus marinus str. MIT 9312
Ca. Pelagibacter ubique HTCC1062
Ca. Pelagibacter sp. HTCC7211
Prochlorococcus marinus str. NATL2A
Prochlorococcus marinus str. NATL1A
Ca. Pelagibacter ubique HTCC1062
Ca. Pelagibacter ubique HTCC1002
Ca. Pelagibacter sp. HTCC7211
Ca. Pelagibacter ubique HTCC1062
Ca. Pelagibacter ubique HTCC1002
Nitrosopumilus maritimus
alpha Proteobacterium HIMB114
Solibacter usitatus Ellin6076
Ca. Koribacter versatilis Ellin345
Acidobacterium capsulatum ATCC 51196
Bradyrhizobium_japonicum_USDA_110
bacterium Ellin514
0 5 10 15 2
0
Core genes
Non-core genes
OMZ 50m
OMZ 85m
OMZ 110m
OMZ 200m
BATS 50m
BATS 100m
BATS 20m
HOT 25m
HOT 75m
HOT 110m
HOT 500m
SOIL
Mean expression ratio (RNA
/
DNA)
*
*
*
Figure 5 Mean expression level of core and non-core genes across the five most abundant taxa per sample. Per gene expression level is
measured as a ratio - (Transcript abundance in RNA sample)/(Gene abundance in the DNA sample) - with abundance normalized to dataset size.
‘Core’ genes are determined individually for each taxon based on orthology with a closely related sister taxon, as described in the main text.
Asterisks mark taxa for which expression ratios differed significantly between core and non-core genes (P < 0.001, t-test).
Stewart et al. Genome Biology 2011, 12:R26
/>Page 10 of 24
based comparisons (above)demonstrateshowdiver-
gence measurements taken relative to an external top
match r eference can differ from those relative to a top
match internal reference from the same dataset, with
the latter m ore likely t o involve comparisons between
highly related sequences from the same strains/
populations.
GC content and amino acid usage differ between
expressed and non-expressed genes
The discrepancy in sequence conservation between
expressed and non-expressed genes coincided with dif-
ferences in nucleotide composition and amino acid
usage between these two sequence pools. GC content
was substantially higher in the soil compared to the
ocean samples (approximately 20 t o 25% enrichment)
and consistent between the DNA and RNA pools (Table
7). In contrast, across all 11 ocean samples, RNA-
derived protein-coding sequences were significantly ele-
vated in GC relative to those from the DNA (mean
RNA-DNA difference, 6%; Table 7), suggesting a broad
shift towards GC enrichment in the expressed gene
pool. Surprisingly, however, DNA sequences corre-
sponding to expressed genes consistently had a lower
GC content tha n DNA reads matching non-expressed
genes (mean difference, 1.9%). These data suggest that
the DNA versus-RNA discrepancy in GC content may
be driven by a subset of transcripts in the RNA pool,
likely those at high abundance. Indeed, analysis of the
RNA reads from one sample (OMZ 50 m) showed a
progressive increase in GC content w ith transcr ipt
abundance (when tr anscripts are sub divided into four
categories (top 10%, 1%, 0.1% 0.01%) b ased on the rank
abundance of the genes they encode (data not shown).
Consistent with the GC pattern, amino acid usage of
protein-coding se quences differed significantly between
the DNA and RNA samples (Table 8, Figures 11, 12, 13,
and 14). Notably, with the exception of three ocean
samples (HOT 500 m, OMZ 110 m and 200 m) and the
outlying soil sample, RNA datasets from diverse regions
and depths grouped separately from DNA samples when
clustered based on amino acid frequencies (Figure 12),
suggesting a global distinction between the meta ge-
nomic and metatranscriptomic amino acid sequence
pools in marine microbial communities. Indeed, of 240
comparisons of amino acid proportions in DNA versus
RNA datasets (12 DNA/RNA samples × 20 amino
acids ), 227 (95%) involved a significant change in amino
acid frequency, with 114 involving an increase and 113
involving a decrease in frequency f rom DNA to RNA
OMZ 50m
OMZ 200m
HOT 500m
HOT 25m
OMZ 50m
OMZ 200m
HOT 500m
HOT 25m
Soil
Soil
0
.84 0.88 0.92 0.96 1.0
Pearson correlation
OMZ 50m
HOT 25m
OMZ 200
m
HOT 500m
OMZ 50m
OMZ 200
m
HOT 500m
HOT 25m
Soil
Soil
0.84 0.88 0.92 0.96 1.0
Pearson correlation
KEGG gene categories
(n = 38)
KEGG metabolic pathways
(n = 313 )
Figure 6 Clustering of samples based on gene function. Samples are hierarchically clustered based on the proportional abundance of KEGG
gene categories and metabolic pathways in expressed (DNA+RNA; red) and non-expressed (DNA-only; blue) gene fractions in the DNA data
from five representative samples.
Stewart et al. Genome Biology 2011, 12:R26
/>Page 11 of 24
(P < 0.0002, chi-square; Table 8, Figure 13). (The high
proportion of significant changes is due to the large
sample sizes in the analysis.) On average, alanine, gly-
cine, and tryptophan (high GC content) underwent the
largest proport ional increases from DNA to RNA, while
lysine, isoleucine, and asparagine (low GC content) all
decreased substantially in frequency. These shifts were
largely consistent among ocean samples, but clearly dis-
tinct from the pattern observed in soil, where several
amino acids changed in frequency in the direction oppo-
site to that in the ocean samples.
Non-expressed
Expressed
%
O
f total hits to KE
GG
k2 categories (DNA data)
0 4 8 12 16 04812
OMZ 50m OMZ 200m
Amino acid metabolism
Carbohydrate metabolism
Energy metabolism
Replication and repair
Membrane transport
Nucleotide metabolism
Translation
Lipid metabolism
Metabolism of cofactors and vitamins
Xenobiotics biodegradation and metabolism
Metabolism of other amino acids
Folding, sorting and degradation
Enzyme families
Metabolism of terpenoids and polyketides
Transcription
Signal transduction
Glycan biosynthesis and metabolism
Neurodegenerative diseases
Biosynthesis of other secondary metabolites
Cell growth and death
Cell motility
Transport and catabolism
Endocrine system
Environmental adaptation
Metabolic diseases
HOT 25m HOT 500m
Soil
Figure 7 Relative abundance of KEGG k2 functional categories (25 most abundant) across nr-reference genes identified in five
representative DNA datasets. Reference genes detected among the DNA reads were classified as unique to the DNA dataset (non-expressed)
or shared between the DNA and RNA datasets (expressed).
Stewart et al. Genome Biology 2011, 12:R26
/>Page 12 of 24
Among the ocean datasets, DNA-RNA shifts in amino
acid frequency were strongly related to amino acid GC
content (Figure 11a; see Materials and methods). Amino
acids with an intermediate GC content (0.5) constituted
equivalent fractions, 40% and 36%, of the total number
of amino acid frequency increases and decreases, respec-
tively. Strikingly, amino acids with GC content below 0.5
were significantly less abundant in the RNA, being
involved in 61% of all decre asing DNA-RNA amino acid
frequency changes. In contrast, frequency increases were
dominated by amino acids enriched in GC: 50% of
increases involved amino acids with GC greater than
0.5, significantly higher than the representatio n of these
amino acids in changes involving a decrease (3%).
A similar, but less dramatic, shift in amino acid usage is
observed when the DNA reads were binned into
expressed and non-expressed gene sets (Figure 11b). In
general, the magnitude of the proportional shift in
amino acid usage decreases with depth in the water col-
umn (Figure 14). This pattern may reflect an overall
decrease in microbial activity with depth, such that the
transcriptome, less weighted by highly expressed and
highly conserved genes, more closely resembles the
metagenome as activity declines. Together, these results
suggest a significant shift towards GC-rich amino acids
in the expressed gene pool.
Amino acid metabolism
Carbohydrate metabolism
Energy metabolism
Replication and repair
Membrane transport
Nucleotide metabolism
Translation
Lipid metabolism
Metabolism of cofactors and vitamins
Xenobiotics biodegradation and metabolism
Metabolism of other amino acids
Folding, sorting and degradation
Enzyme families
Metabolism of terpenoids and polyketides
Transcription
Signal transduction
Glycan biosynthesis and metabolism
Neurodegenerative diseases
Biosynthesis of other secondary metabolites
Cell growth and death
Cell motility
Transport and catabolism
Endocrine system
Environmental adaptation
Metabolic diseases
-6 -4 -2 0 2 4 6
% Proportional change (expressed minus non-expressed)
OMZ 50m
OMZ 200m
HOT 25m
HOT 500m
Soil
Figure 8 Proportional change in KEGG category abundance between exp ressed and non-expressed gene fractions. Data are shown for
DNA datasets from five representative samples. Unfilled stars mark KEGG k2 categories in which the direction of change was consistent across
all five samples. Small filled stars mark categories that did not differ significantly in relative abundance between expressed and non-expressed
gene fractions (P > 0.05, chi-square). Only the 25 most abundant KEGG categories are shown.
Stewart et al. Genome Biology 2011, 12:R26
/>Page 13 of 24
HOT 25m
OMZ 50m
OMZ 200
m
HOT 500m
Soil
03020 RNA polymerase [PATH:ko03020]
00194 Photosynthesis proteins [BR:ko00194]
00195 Photosynthesis [PATH:ko00195]
00190 Oxidative phosphorylation [PATH:ko00190
]
00061 Fatty acid biosynthesis [PATH:ko00061]
02035 Bacterial motility proteins [BR:ko02035]
00860 Porphyrin and chlorophyll metabolism [PATH:ko00860]
00290 Valine, leucine and isoleucine biosynthesis [PATH:ko00290]
00240 Pyrimidine metabolism [PATH:ko00240]
00250 Alanine, aspartate and glutamate metabolism [PATH:ko00250]
00620 Pyruvate metabolism [PATH:ko00620]
00630 Glyoxylate and dicarboxylate metabolism [PATH:ko00630]
05010 Alzheimer's disease [PATH:ko05010]
01004 Lipid biosynthesis proteins [BR:ko01004]
00260 Glycine, serine and threonine metabolism [PATH:ko00260]
00720 Reductive carboxylate cycle (CO2 fixation) [PATH:ko00720]
00640 Propanoate metabolism [PATH:ko00640]
03036 Chromosome [BR:ko03036]
04112 Cell cycle - Caulobacter [PATH:ko04112]
00270 Cysteine and methionine metabolism [PATH:ko00270]
00910 Nitrogen metabolism [PATH:ko00910]
02020 Two-component system [PATH:ko02020]
00450 Selenoamino acid metabolism [PATH:ko00450]
00380 Tryptophan metabolism [PATH:ko00380]
00550 Peptidoglycan biosynthesis [PATH:ko00550]
03010 Ribosome [PATH:ko03010]
03011 Ribosome [BR:ko03011]
03070 Bacterial secretion system [PATH:ko03070]
03060 Protein export [PATH:ko03060]
03012 Translation factors [BR:ko03012]
02044 Secretion system [BR:ko02044]
00710 Carbon fixation in photosynthetic organisms [PATH:ko00710]
00230 Purine metabolism [PATH:ko00230]
00480 Glutathione metabolism [PATH:ko00480]
00970 Aminoacyl-tRNA biosynthesis [PATH:ko00970]
03032 DNA replication proteins [BR:ko03032]
00400 Phenylalanine, tyrosine and tryptophan biosynthesis [PATH:ko00400]
03030 DNA replication [PATH:ko03030]
00900 Terpenoid backbone biosynthesis [PATH:ko00900]
03420 Nucleotide excision repair [PATH:ko03420]
00760 Nicotinate and nicotinamide metabolism [PATH:ko00760]
03400 DNA repair and recombination proteins [BR:ko03400]
03430 Mismatch repair [PATH:ko03430]
00300 Lysine biosynthesis [PATH:ko00300]
00010 Glycolysis / Gluconeogenesis [PATH:ko00010]
03440 Homologous recombination [PATH:ko03440]
01002 Peptidases [BR:ko01002]
03410 Base excision repair [PATH:ko03410]
00360 Phenylalanine metabolism [PATH:ko00360]
00500 Starch and sucrose metabolism [PATH:ko00500]
02022 Two-component system [BR:ko02022]
00030 Pentose phosphate pathway [PATH:ko00030]
00520 Amino sugar and nucleotide sugar metabolism [PATH:ko00520]
03018 RNA degradation [PATH:ko03018]
00920 Sulfur metabolism [PATH:ko00920]
03110 Chaperones and folding catalysts [BR:ko03110]
00680 Methane metabolism [PATH:ko00680]
00350 Tyrosine metabolism [PATH:ko00350]
00903 Limonene and pinene degradation [PATH:ko00903]
00561 Glycerolipid metabolism [PATH:ko00561]
00051 Fructose and mannose metabolism [PATH:ko00051]
00330 Arginine and proline metabolism [PATH:ko00330]
00770 Pantothenate and CoA biosynthesis [PATH:ko00770]
00410 beta-Alanine metabolism [PATH:ko00410]
00340 Histidine metabolism [PATH:ko00340]
02010 ABC transporters [PATH:ko02010]
02000 Transporters [BR:ko02000]
00310 Lysine degradation [PATH:ko00310]
00071 Fatty acid metabolism [PATH:ko00071]
00650 Butanoate metabolism [PATH:ko00650]
00632 Benzoate degradation via CoA ligation [PATH:ko00632]
00660 C5-Branched dibasic acid metabolism [PATH:ko00660]
00020 Citrate cycle (TCA cycle) [PATH:ko00020]
00280 Valine, leucine and isoleucine degradation [PATH:ko00280]
00670 One carbon pool by folate [PATH:ko00670]
* *
*
*
*
* *
* *
*
*
*
* *
*
*
* * *
* *
*
* *
* * *
* * *
*
*
* * *
* * *
* *
*
*
*
* * *
*
*
*
* *
*
* * * *
*
*
*
*
* *
*
* *
*
* * *
* * *
* *
* *
* *
* *
* * *
* *
*
*
* *
*
Figure 9 Heat map showing the proportion increase (green) or decrease (red) of KEGG k3 functional pathway abundance between
expressed and non-expressed gene fractions in DNA data from five representative samples. Colored gene names mark KEGG pathways in
which the direction of change was consistent across all five samples. All differences (abundance in expressed fraction versus abundance in non-
expressed fraction) are significant (P < 0.0001, chi-square), unless marked with an asterisk. Only the 75 most abundant KEGG k3 pathways are
shown. Genes are grouped by hierarchical clustering of Pearson correlation coefficients for each pairwise dataset comparison.
Stewart et al. Genome Biology 2011, 12:R26
/>Page 14 of 24
Prior studies describe a relationship among gene
expression level, sequence conservation, an d amino acid
usage [38-42]. Specifically, significant enrichment i n
GC- rich amino acids among high ly expressed genes has
been demonstrated for individual bacterial taxa, includ-
ing Prochlorococcus [38,39]. GC richness in expressed
genes is potentially driven by a combination of factors,
including selection against metabolically costly amino
acids (for example, AT-enriched phenylalanine and tyro-
sine) [40], or selection against AT-richness in highly
expressed genes. Alternatively, this pattern may stem
from an overall enhanced c onservation level in highly
expressed genes [12]. Assuming an underlying GC-to-
AT mutational bias, which may be a universal trend in
bacteria [41,42], selectively constrained genes are pre-
dicted to retai n a GC-rich signature relative to less-con-
strained genes. Therefore, the proportional increase in
GC-enriched amino acids in expressed genes compared
to non-expressed genes in this study is consistent with
our observation of enhanced sequence conservation in
the expressed community gene pool, and confirms a
fundamental distinction in amino acid usage related to
gene expression level.
Conclusions
Microbial metagen omes and metatranscriptomes are
amalgams of thousands of taxonomically and function-
ally dive rse microorganisms, each of which experiences
unique evolutionary pressures. Such complexity might
be expected to preclude th e detection of bulk evolution-
ary signals in meta-omic data. Here, we s how broad
trends in protein coding sequence conservation that
transcend variation in both taxonomic composition and
habitat type.
Specifically, we confirm that the hypothesized positive
relationship between gene expression level and sequence
conservation, which has been well established for indivi-
dual taxa under e xperimental conditions [11], is a uni-
versal trend across diverse microbial communities in
both marine and terrestrial environments. Detecting this
trend required binning genes into b road categories
(expressed versus non-expressed) based on the detection
of transcripts, which depended, in part, on the depth of
sequencing per sample. De eper sequencing would reveal
a greater proportion of the expressed gene pool and
potentially lead to more accurate measurements of
expression level for low frequency genes [22,23]. How-
ever, the tremendous taxonomic diversity inherent in
microbial communities, as well as the temporal hetero-
geneity of the environment in which these communities
exist, likely confounds any attempt to predict protein
conservation based on transcript abundance on a gene-
by-gene basis using meta-omic data. Nonetheless, the
broad discrepancy in sequence conservation between
expressed and non-expressed gene fractions is signifi-
cant, operates consistently across diverse taxa (Figure 4),
and confirms that expression level is a primary determi-
nant of evolutionary rate in naturally o ccurring
microorganisms.
The mechanism linking evolutionary rates and expres-
sion level is still debated. Sequence conservation in highly
expressed proteins has been hypothesized to be driven by
selection acting to minimize the costs of protein misfold-
ing, which should increase in tandem with expression
level (protein copy number per cell) [14], though the
harmful effects of misfolding have been brought into
question [43]. This selection for ‘translational robustness/
accuracy’ is predicted to be largely decoupled from a pro-
tein’ s functional importance [13,14,24]. Here, using
mRNA abundance as a proxy for expression level, our
results demonstrate broad commonalities in expressed
gene content a cross communities in widely differe nt
habitats (ocean versus soil). These data indicate a trend
toward genes of protein synthesis and energy metabo lism
inthemoreactivelyexpressedgenefractionandtoward
gene s of cell replication and growth in the less expressed
fraction. Additionally, this finding, in the context of our
results demonstrating enhanced sequence conservation
among expressed genes, indirectly suggests that the
expression-conservation relationship may partially be
constrained by protein function. However, these data
cannot be used to justify this conclusion, since both gene
Table 6 Counts and mean percentage identity of amino acid sequence clusters for four representative samples
Cluster counts
a
Mean percentage identity
d
Sample Total Singleton DNA+RNA
b
DNA only
c
RNA only
c
DNA+RNA DNA only
OMZ 50 m 213,683 180,311 1804 26,505 5063 77.0 85.2
OMZ 200 m 257,388 209,564 2712 40,401 4711 79.4 83.7
HOT 75 m 353,573 297,850 5681 44,163 5879 80.3 82.9
HOT 500 m 500,413 425,524 4677 66,151 4061 73.7 79.7
Soil 1,277,816 1,046,744 29,980 141,158 59,934 72.6 87.5
a
CD-HIT clustering parameters: sequence identity 55% over local aligned region, with a length difference cutoff of 90%, and clustering to the most similar cluster
(g = 1).
b
Clusters containing both DNA- and RNA-derived sequences.
c
Clusters containing only DNA- or RNA-derived sequences.
d
Mean amino acid identity
(relative to the cluster reference sequence) across all DNA sequences per cluster. BATS, Bermuda Atlantic Time Series; HOT, Hawaii Ocean Time Series; OMZ,
oxygen minimum zone.
Stewart et al. Genome Biology 2011, 12:R26
/>Page 15 of 24
expression level and functional importance may indepen-
dently co-vary with protein evolution rates, as has been
demonstrated for isolates of Pseudomonas aeruginosa
[33]. Though characterizing the mechanism linking gene
expression level and evolutionary rate is beyond the
scope of this study, metatranscriptomic data may inform
future studies exploring the relative effect of protein
function on sequence conservation.
We show that the expressed gene set, compared to the
non-expressed set, is more likely to contain genes that
belong to an orthologous core genome shared across
closely related sister ta xa. This pattern was broadly con-
sistent across the marine samples and the soil sample.
Interestingly, the overrepresentation of expressed genes
within the core set was not observed in the HOT 500 m
sample (Figure 4), which w e hypothesize may be related
to an overall decline of metabolic activity at deeper
depths within the water column. Microbial transcrip-
tomes can vary significantly in response to the growth
phase o f the organism [44-46]. In less actively growing
85.2% OMZ 50m
83.7% OMZ 200m
82.9% HOT 75m
79.7% HOT 500m
DNA-only clusters
DNA-only clusters
DNA+RNA clusters
2.5 OMZ 50m
3.0 OMZ 50m
2.6 OMZ 200m
3.1 OMZ 200m
2.5 HOT 75m
3.0 HOT 75m
2.5 HOT 500m
3.3 HOT 500m
0
5
10
15
20
25
30
35
40
45
0
10
20
30
40
50
60
70
2.5 Soil
2.9 Soil
72.6% Soil
77.0% OMZ 50m
79.4% OMZ 200m
80.3% HOT 75m
73.7% HOT 500m
DNA+RNA clusters
86.5% Soil
99 97 95 93 91 89 87 85 83 81
Mean %ID per cluster
234567891
0
Sequences per cluster
Percentage of total clusters Percentage of total clusters
(a)
(b)
Figure 10 Database-independent cluster statistics. (a) Size and (b) percentage identity of clusters containing amino acid sequences present
only in DNA datasets or in both DNA + RNA datasets from five representative samples. Cluster sizes are based on counts of only the DNA-
derived sequences within each cluster type. Numbers in legends indicate mean cluster size (a) and mean amino acid identity (b). Amino acid
sequences were clustered above a threshold identity of 55%.
Stewart et al. Genome Biology 2011, 12:R26
/>Page 16 of 24
comm unities (for example, stationary phase), expressi on
level might be more uniform across the genome (that is,
background expression), with both core and non-core
genes having a relatively equa l probability of detection.
In contrast, in act ively gr owing communities, the
distribution of transcripts might become dominated by a
subset of highly expressed genes (for example, genes
mediating energy metabolism, membrane transport), as
we have observed in other samples. If such genes fall
within the core genome, core genome representation in
the expressed gene set would be predicted to be greater
in more active communities.
Our datasets highlight similarities in gene expression
and s equence evolution across very different microbial
habitats, but differ markedly in other attributes. Notably,
the soil community was a clear outlier with respect to
functional gene content (Figures 6, 7, and 9) and amino
acid usage (Figures 12 and 13), likely due to the distinct
community composition o f this habitat (Figure 4). How-
ever, given our analysis of a single soil metatranscrip-
tome, and the use of different RNA extraction kits for
soil versus marine samples (see Materials and methods),
we urge caution when comparing microbial community
composition bet ween soil and marine datasets. A more
comprehensive comparison of taxonomy and functional
gene expression would involve extended metatranscrip-
tome sampling across multiple soil types (and locations),
as well as optimization of RNAextractionprotocolsto
ensure unbiased lysis of all microorganisms. Such an
analysis was not the focus of this study . However, the
inclusion o f the soil sample confirmed a positive rela-
tionship between expression level and sequence conser-
vation at both the genome and community levels
Table 7 GC percentages (averaged over all reads) in open
reading frames identified using Metagene
DNA reads RNA reads
Site Depth (m) All
a
DNA only
b
DNA+RNA
c
All
a
OMZ 50 37.6 38.2 36.0 42.8
85 38.2 38.4 36.7 44.9
110 41.1 42.6 38.1 42.8
200 40.9 41.9 38.6 45.6
BATS 216 20 34.5 35.4 33.8 42.8
50 35.2 36.4 33.9 40.3
100 33.7 34.7 32.9 37.8
HOT 186 25 35.5 36.0 34.8 44.0
75 34.9 35.2 34.4 41.4
110 36.0 36.4 35.0 40.0
500 43.2 43.1 43.5 50.6
Soil Surface 62.7 63.1 62.5 62.6
a
All reads identified as ‘protein-cod ing’ via significant BLASTX matches to
NCBI-nr (bit-score > 50), with GC content then estimated for Metagene-called
open reading frames within this read set.
b
Reads matching g enes detected
only in the DNA data.
c
Reads matching genes detected in both the DNA and
RNA data. BATS, Bermuda Atlantic Time Series; BLAST, Basic Local Alignment
Search Tool; GC, guanine-cytosine; HOT, Hawaii Ocean Time Series; HSP, high-
scoring segment pair; NCBI-nr, National Center for Biotechnology Information
non-redundant protein database; OMZ, oxygen minimum zone.
Table 8 Proportional change
a
in amino acid usage in RNA datasets compared to DNA datasets
Amino acid OMZ BATS 216 HOTS 186
GC
b
50 m 85 m 110 m 200 m 20 m 50 m 100 m 25 m 75 m 110 m 500 m Soil
Ala 0.83 31.5 30.2 21.8 20.1 35.5 27.6 28.0 45.4 44.2 26.2 26.8 5.5
Gly 0.83 26.8 24.7 17.8 16.4 18.7 16.1 16.7 19.0 23.4 14.4 -10.2 0.0
Pro 0.83 11.0 11.7 3.3 7.4 13.1 6.6 8.7 10.1 2.4 4.0 6.8 5.1
Arg 0.72 -3.3 -3.2 -11.7 1.8 23.2 14.2 9.7 11.9 0.9 4.1 -6.7 1.3
Trp 0.67 34.0 49.5 27.0 21.2 12.2 9.2 11.9 18.2 25.7 17.1 -9.3 16.3
Cys 0.50 -0.5 -5.1 -6.9 2.1 -2.6 -6.6 -9.5 -10.3 -8.9 -11.8 17.5 3.9
Asp 0.50 3.3 5.6 0.9 8.0 3.0 -0.8 -0.2 -0.1 0.4 -2.0 -2.9 -3.6
Glu 0.50 -7.0 -11.1 -2.4 2.8 0.7 -1.2 -1.0 -6.6 -8.9 -5.6 -21.7 -9.0
His 0.50 -4.1 -5.4 -7.8 -0.6 4.1 -1.4 -3.4 9.7 0.9 -4.5 -28.3 2.9
Gln 0.50 -1.3 1.3 -2.9 2.5 9.3 6.4 6.8 9.3 3.8 4.2 -10.8 -2.7
Ser 0.50 -5.4 -2.8 -3.4 -2.9 -8.5 -7.4 -5.2 -7.6 -6.3 -2.0 6.4 4.1
Thr 0.50 14.9 17.8 11.3 7.5 7.9 10.0 10.7 14.2 14.6 9.8 -17.4 1.3
Val 0.50 17.7 18.8 12.2 11.5 16.0 15.0 13.2 18.1 20.2 11.4 7.5 -4.1
Leu 0.39 -9.7 -11.0 -10.4 -8.1 -6.6 -6.7 -5.3 -7.2 -6.9 -2.2 7.8 4.4
Met 0.33 14.2 20.0 7.6 6.6 13.0 14.5 6.1 17.5 20.3 5.3 -0.5 -1.6
Phe 0.17 -10.5 -9.1 -6.9 -10.2 -15.9 -11.3 -9.6 -8.4 -5.8 -1.6 -3.6 4.3
Lys 0.17 -22.3 -28.6 -9.5 -17.8 -13.7 -8.4 -6.6 -25.1 -23.4 -11.5 15.9 -26.3
Asn 0.17 -23.6 -20.5 -14.8 -18.0 -25.1 -20.2 -19.2 -24.9 -23.0 -17.4 13.6 0.9
Tyr 0.17 -8.4 -6.7 -5.3 -4.8 -15.2 -9.3 -11.0 -1.9 -5.6 -7.7 25.7 5.4
Ile 0.11 -19.3 -21.8 -11.8 -18.2 -22.5 -18.2 -18.5 -23.0 -20.6 -17.5 -3.7 0.4
a
((Proportion in RNA) - (Proportion in DNA))/(Proportion in DNA) × 100.
b
GC content = (Number of guanine or cytosine bases among synonymous codons)/
(Number of total bases among synonymous codons). BATS, Bermuda Atlantic Time Series; HOT, Hawaii Ocean Time Series; OMZ, oxygen minimum zone.
Stewart et al. Genome Biology 2011, 12:R26
/>Page 17 of 24
% Of total changes (increase or decrease)
% Of total changes (increase or decrease)
DNA versus RNA reads
(a)
(b)
0
5
10
15
20
25
30
35
40
45
0.11 0.17 0.33 0.39 0.5 0.67 0.72 0.83
0
5
10
15
20
25
30
35
40
45
0.11 0.17 0.33 0.39 0.5 0.67 0.72 0.83
Amino acid GC content
Amino acid
GC
content
DNA reads - expressed versus non-expressed gene
s
Increase
Decrease
Figure 11 Amino aci d usage changes based on GC content of synonymous codons in ocean communities. (a,b) Charts include only
those amino acids whose frequency significantly increased (blue) or decreased (red) in the RNA relative to the corresponding DNA reads (a) or
in the expressed genes relative to the non-expressed genes in the DNA reads only (b). Significant increases/decreases are categorized based on
the GC content (x-axis) of the amino acid, where GC content = (Number of GC bases among synonymous codons)/(Number of total bases
among synonymous codons). Data from all 11 DNA/RNA ocean samples are pooled; these charts exclude the soil data, in which GC enrichment
in the RNA was not observed.
Stewart et al. Genome Biology 2011, 12:R26
/>Page 18 of 24
(Figures 3 and 4), as well as an overrepresentation
of core genes within the highly expressed gene set
(Figure 4). Though it is possible that such patterns may
not be observed in other sample types, or following di f-
ferent extraction protocols, our results provide strong
evidence for universal features of protein-coding gene
evolution in natural microbial communities.
The composition of metatranscriptomic and metage-
nomic sequence datasets depends not only on intrinsic
biological factors (for example, community composition,
metabolic state) but also on the physic al and chemical
environment at the time of sampling. Further more,
interpretation of the resulting data can vary based on
the analytical m ethod (for example, database-dependent
versus -independent analyses, as shown here) and on
the availability and biases of the reference sequences to
which the data are compared. Here, we attempt t o rule
out p otential database artifacts by analyses at both the
community and genome level. In so doing, our results
suggest that environmental meta-omic datasets, despite
their inherent complexity, can inform theoretical evolu-
tionary predictions and reveal universal trends across
ecologically and phylogenetically diverse microbial
communities.
Materials and methods
We examined protein-coding sequences in coupled
microbial metagenomes and metatranscriptomes from
multiple depths at three distinct oceanographic sites and
from surface soil in a temperate forest (Table 1). Ocean
datasets (excluding the HOT 110 m RNA sample, which
was sequenced in this st udy) were generated in prior stu-
dies using the Roche 454 Genome Sequencer with FLX
series chemistry and extracted from public database s (see
Table 1 for accession numbers). Sequences from the soil
sample were generated in this study (detailed below) and
areavailableintheNCBISequenceReadArchiveunder
accession [SRA028811].
Soil
Soil
OMZ 50m
OMZ 85m
BATS 20m
BATS 100
m
HOT 25m
HOT 75m
BATS 50m
HOT 110m
HOT 500m
OMZ 110m
OMZ 200m
BATS 20m
BATS 50m
BATS 100
m
HOT 110m
OMZ 50m
OMZ 110m
OMZ 200m
OMZ 85m
HOT 25m
HOT 75m
HOT 500m
P
ea
r
so
n
co
rr
e
l
a
ti
o
n
0.84 0.88 0.92 0.96 1.0
0.80
Figure 12 Relatedness of DNA (blue) and RNA (red) datasets as determined by amino acid proportions. Dendrograms are based on
hierarchical clustering of Pearson correlation coefficients for each pairwise comparison of amino acid proportions.
Stewart et al. Genome Biology 2011, 12:R26
/>Page 19 of 24
trp 0.67
gly 0.83
val 0.50
thr 0.50
met 0.33
pro 0.83
asp 0.50
cys 0.50
ala 0.83
his 0.50
gln 0.50
arg 0.72
tyr 0.17
ser 0.50
phe 0.17
glu 0.50
leu 0.39
lys 0.17
ile 0.11
asn 0.17
OMZ 110m
OMZ 200m
OMZ 50m
OMZ 85m
HOTS 500m
BATS 20m
BATS 50m
BATS 100m
HOTS 25m
HOTS 75m
HOTS 110m
Soil
Pearson correlation
1.0
0.3
0.4
0.5
0.6
0.7
0.8
0.9
Figure 13 Clustering of sample datasets based on proportional amino acid change.Heatmapsshowtherelativemagnitudesofthe
proportional change (from DNA to RNA) in each sample set. Red = increase, green = decrease, black = zero. Dendrograms are based on
hierarchical clustering of Pearson correlation coefficients for each pairwise dataset comparison. Numbers beside amino acid names indicate GC
content, calculated as: (Number of GC bases among synonymous codons)/(Number of total bases among synonymous codons).
Stewart et al. Genome Biology 2011, 12:R26
/>Page 20 of 24
Soil sample collection and DNA/RNA isolation
Soil was collected from within a transition hardwood-
white pine/hemlock forest in the Prospect Hill Tract of
Harvard Forest (Massachusetts, USA; 42.54 N 72.18 W;
elevation, 385 m) on 27 September 2010. Two cores
were taken from 1 to 10 cm below the leaf horizon
using a 10 mm diameter soil corer. These cores were
homogenized, placed into 50 ml Falcon tubes, flash fro-
zen in liquid nitrogen, and transported to the lab on dry
ice. Visible pieces of plant material were removed from
soil subsamples with sterile forceps. During plant
removal, the subsamples were placed on a sterile sur-
face, laid within a bed of dry ice. Total microbial DNA
and RNA were then extracted from these subsamples
using PowerSoil Total RNA and DNA isolation kits
(MoBio, Carlsbad, CA, USA), according to the manufac-
turer’s protocol. This extraction protocol differs from
the method used to generate the marine datasets, which
employed t he mirVana™ miRNA Isolation kit (Ambion,
Austin, TX, USA) for RNA isolation [17,19,23,35]. It is
possible that these kits may lyse d ifferent microbial taxa
at varying efficiencies. As this possibility has not been
assessed, we urge caution when comparing the composi-
tions of soil and marine communities based on meta-
transcriptome data, though this was not the focus of our
study. Total DNA was quantified and used directly for
pyrosequencing. Total RNA was further processed, as
described below.
rRNA subtraction, RNA amplification and cDNA synthesis
Total RNA was amplified and prepared for pyrosequencing
using established protocols. Briefly, the proportion of ribo-
somal RNA transcripts (bacterial and archaeal 16S and 23S
rRNA and eukaryotic 18S and 28S rRNA) in total soil RNA
was reduced via a published subtractive hybridization pro-
tocol using sample-specific rRNA prob es [23]. Following
rRNA subtraction, total RNA was amplified as described
previously using a modification of the MessageAmp™ II-
Bacteria kit (Ambion) [17,19]. Briefly, total RNA was polya-
denylated and converted to double-stranded cDNA via
reverse transcription. cDNA was then transcribed in vitro
(37°C, 12 to 14 h) to produce microgram quantities of sin-
gle-stranded antisense RNA. The amplified p roducts
(approximately 5 to 10 μg aliquot) were converted back to
double-stranded cDNA u sing the SuperScript
®
III First-
Strand Synthesis System (Invitrogen, Carlsbad, CA, USA)
for first-strand synthesis (random hexamer priming), and
the SuperScript™ Double-Stranded cDNA synthesis kit
(Invitrogen) for second-strand synthesis. cDNA was then
purified (QIAquick PCR purification kit, Qiagen, Valencia,
CA, USA), digested with BpmI (37°C, 3 h) to remove poly
(A) tails, and used directly for pyrosequencing.
Pyrosequencing
Soil DNA and cDNA were purified for sequencing via
the Agencourt
®
AMPure
®
kit (Beckman Coulter Geno-
mics, Danvers, MA, USA) and used for the generation
20 30 40 14 18 22 26 5 1015200 5 10 15 6121810 14 18 10 30 5
0
Proportional change in amino acid frequency (DNA to RNA)
ala gly met pro thr val trp
50
85
110
200
20
50
100
25
75
110
500
OMZ
BATS
HOTS
(m)
Figure 14 Proportional changes in amino acid usage decrease with depth. Data include the seven amino acids with the greatest
proportional increase from DNA to RNA. Proportional change = ((Amino acid proportion in RNA) - (Amino acid proportion in DNA))/(Amino acid
proportion in DNA) × 100.
Stewart et al. Genome Biology 2011, 12:R26
/>Page 21 of 24
of single-stranded DNA libraries and emulsion PCR
according to established protocols (454 Life Sciences,
Roche, Branford, CT, USA). Clonally amplified library
fragments were sequenced with full plate r uns on a
Roche Genome Sequencer FLX instrument using Tita-
nium chemistry. Pyrosequencing datasets generated dur-
ing thi s study have been deposited in the NCBI
Sequence Read Archive under accession numbers listed
in Table 1.
Data analysis
Homology searches
Pyrosequencing reads matching ribosomal RNA genes
were identified in cDNA and DNA datasets by
BLASTN searches against a custom database of pro-
karyotic and eukaryotic small and large subunit rRNA
sequences (5S, 16S, 18S, 23S and 28S rRNA) taken
from microbial genomes and the ARB S ILVA LSU and
SSU databases [47]. Reads matching rRNA with bit
scores >50 were identified and removed from further
analysis. Replicate sequences sharing 100% nuc leotide
similarity and length, which may represent artifacts
generated by the pyrosequencing protocol [23,48],
were identified among non-rRNA sequences using the
open-source program CD-HIT [49] and removed from
each dataset. Non-replicate, non-rRNA sequences were
characterized by BLASTX searches again st NCBI-nr,
KEGG, and assembled protein sequences taken from
the GOS database. Protein-coding sequences were
identified as the top reference (database) gene(s)
matching each read above a bit score of 50. When
reads matched multiple genes with equal bit score,
each matching gene was considered a top hit, with its
representation scaled proportionate to the number of
genes sharing the same bit score.
Amino acid identities, relative taxon abundance, and
expression ratio
Local amino acid identities were recovered from within
the top HSP for each sequence having a significant
match (bit score >50) to a reference gene in the nr data-
base; gaps were not included in identity calculations.
Identities of multiple reads matching the same reference
gene were averaged to obtain per gene identities, and
these values were then averaged acros s all reference
genes per dataset. Relative taxon abundance per sample
was determined as the number of sequence reads
matching the same reference taxon as a top hit in
BLASTX searches of NCBI-nr. The relative transcrip-
tional activity (expression leve l) per expressed gene was
normalized to account f or variations in gene abundance
in the DNA pool, as calculated by the expression ratio:
(RNA reads per gene/Total RNA r eads matching NCBI-
nr)/(DNA reads per gene/Total DNA reads matching
NCBI-nr)
Core genome
The proportional representation of expressed and non-
expressed genes in the orthologou s gene set shared
between taxa was determined separately for the top five
most abundant organisms in each of the samples. The
core gen ome of Prochlorococcus sp., which was common
in our samples, was defined as those genes present
across all 12 of the sequenced Prochlorococcus strains,
based on the analysis of [50]. For all other taxa, a core
gene set was more broadly defined by reciprocal
BLASTP searches against a closely related sister taxon
(bit score cutoff = 50). Sister taxa used for core genome
identification, and the number of genes shared between
taxa, are listed in Table 5.
Hierarchical clustering
Average-linkage clustering was pe rformed in Cluster 3.0
using Pearson coefficients (centered) derived from pair-
wise correlations of KEGG functional category abun-
dances (Figures 6 and 9), amino acid proportions
(Figure 12), or proportional changes in amino acid
usage ( Figure 13). KEGG category clustering was based
on expressed and non-expressed gene sets within the
DNA data only, as defined i n the main text based on
matches to nr reference proteins. Abundance per KEGG
category was calculated as the total number of reads per
category as a proportion of total reads matching the
KEGG hierarchy at either the category (Figure 8) or
pathway level (Figure 9).
Database-independent cluster analysis
Sequence divergence was determined for clusters of
related sequences within pooled DNA + RNA datasets. To
avoid spurious clustering of non-coding regions (for exam-
ple, small RNAs (sRNAs)), amino acid sequences present
in the DNA and RNA reads (those with significant
matches to the nr database) were identified using the ab
initio gene-finding program Metagene [51]. (Comparisons
of amino acid sequences determined from Metagene and
sequences determined from BLAST HSP regions produced
nearly identical results.) Sequences derived from DNA and
RNA reads were pooled and cl ustered using the program
CD-HIT [49] applying a low sequence ident ity threshold
(55%) over the aligned region. Resulting clusters contained
RNA-derived sequences only, DNA-derived sequences
only, or both DNA- and RNA-derived sequences. For all
clusters containing DNA-derived sequences only (non-
expressed) or DNA + RNA-derived (expressed) sequences,
the divergence between each DNA-derived sequence and
the reference (longest) sequence per cluster was calculated
along the length of the aligned region. These values were
averaged to estimate divergence per cluster. Clusters con-
taining only one sequence (singletons) and clusters in
which the reference sequence was the only DNA sequence
were excluded from further analysis. For clusters in which
the reference sequence was RNA-derived, but that
Stewart et al. Genome Biology 2011, 12:R26
/>Page 22 of 24
contained only one DNA sequence, the percentage iden-
tity of the sole DNA sequence was recorded. Divergence
per cluster was then averaged for all expressed an d non-
expressed sequence/gene clusters.
Amino acid usage
We compared amino acid usage between DNA and
RNA datasets and DNA datasets p arsed i nto expressed
versus non-e xpressed gene categories as above. Specifi-
cally, for each dataset, reads matching nr proteins (see
above for BLASTX descriptions) were examined to
assess amino acid usage and GC content, using two
approaches. First, amino acids were counted across all
HSPs in alignments between sequence reads and their
closest match in the nr database. Second, amino acids
were counted across open reading frames that were
identified using Metagene [51]. These two methods
returned nearly identical results; we therefore restrict
our discussion to the Metagene data. Amino acids were
then categorized based on GC content, where GC con-
tent was measured by the relative proportion of Gs and
Cs among the synonymous codons for each amino acid
(for example, alanine has four synonymous codons; 1 0
of the 12 total bases (0. 83) representing these codons
are either a G or C).
Proportional changes in amino acid usage, KEGG gene
category and pathway abundances, and core genome
representation in expressed and non-expressed gene
fractions were compared usingchi-squaretests.Mean
amino acid identities and expression ratios were com-
pared using standard two-tailed t-tests. Significance was
determined at alpha <0.05 following Bonferroni correc-
tions for multiple comparisons.
Abbreviations
BATS: Bermuda Atlantic Time Series; GOS: Global Ocean Sampling; HGT:
horizontal gene transfer; HOT: Hawaii Ocean Time Series; HSP: high-scoring
segment pair; KEGG: Kyoto Encyclopedia of Genes and Genomes; NCBI-nr:
National Center for Biotechnology Information non-redundant protein
database; OMZ: oxygen minimum zone.
Acknowledgements
We thank Rachel Barry for her tireless work in preparing samples for
pyrosequencing, and Anne Pringle and Christopher Sthultz for providing the
Harvard Forest soil sample. Generous support for this study came from the
Gordon and Betty Moore Foundation (EFD), the National Science foundation
(NSF), and a gift from the Agouron Institute (EFD). This work is a
contribution of the Center for Microbial Oceanography: Research and
Education (C-MORE).
Author details
1
School of Biology, Georgia Institute of Technology, Ford ES&T Building, Rm
1242, 311 Ferst Drive, Atlanta, GA 30332, USA.
2
Department of Civil and
Environmental Engineering, Massachusetts Institute of Technology, Parsons
Laboratory 48, 15 Vassar Street, Cambridge, MA 02139, USA.
Authors’ contributions
EFD and FJS conceived of the study. FJS carried out the computational
analyses of pyrosequencing data and drafted the manuscript. JME
participated in the computational sequence and statistical analysis, provided
important coding support, and helped revise the manuscript. JAB helped
design the study, provided critical analytical and data acquisition support,
and helped revise the manuscript. AKS participated in data acquisition and
computational sequence analysis and helped revise the manuscript. EFD
coordinated the overall goals of the study, directed the analytical work, and
helped to draft the manuscript. All authors read and approved the final
manuscript.
Competing interests
The authors declare that they have no competing interests.
Received: 5 January 2011 Revised: 28 February 2011
Accepted: 22 March 2011 Published: 22 March 2011
References
1. Nei M: Selectionism and neutralism in molecular evolution. Mol Biol Evol
2005, 22:2318-2342.
2. Yang ZH: Among-site rate variation and its impact on phylogenetic
analyses. Trends Ecol Evol 1996, 11:367-372.
3. Betancourt AJ, Presgraves DC: Linkage limits the power of natural
selection in Drosophila. Proc Natl Acad Sci USA 2002, 99:13616-13620.
4. Hirsh AE, Fraser HB: Protein dispensability and rate of evolution. Nature
2001, 411:1046-1049.
5. Flynn KM, Vohr SH, Hatcher PJ, Cooper VS: Evolutionary rates and gene
dispensability associate with replication timing in the archaeon
Sulfolobus islandicus. Genome Biol Evol 2010, 2:859-869.
6. Fraser HB, Hirsh AE, Steinmetz LM, Scharfe C, Feldman MW: Evolutionary
rate in the protein interaction network. Science 2002, 296:750-752.
7. Fraser HB, Hirsh AE: Evolutionary rate depends on number of protein-
protein interactions independently of gene expression level. BMC Evol
Biol 2004, 4:13.
8. Dickerson RE: The structures of cytochrome c and the rates of molecular
evolution. J Mol Evol 1971, 1:26-45.
9. Rocha EPC, Danchin A: An analysis of determinants of amino acids
substitution rates in bacterial proteins. Mol Biol Evol 2004, 21:108-116.
10. Sharp PM: Determinants of DNA sequence divergence between
Escherichia coli and Salmonella typhimurium: codon usage, map position,
and concerted evolution. J Mol Evol 1991, 33:23-33.
11. Pal C, Papp B, Lercher MJ: An integrated view of protein evolution. Nat
Rev Genet 2006, 7:337-348.
12. Herbeck JT, Wall DP, Wernegreen JJ: Gene expression level influences
amino acid usage, but not codon usage, in the tsetse fly endosymbiont
Wigglesworthia. Microbiol 2003, 149:2585-2596.
13. Drummond DA, Wilke CO: Mistranslation-induced protein misfolding as a
dominant constraint on coding-sequence evolution. Cell 2008,
134:341-352.
14. Drummond DA, Bloom JD, Adami C, Wilke CO, Arnold FH: Why highly
expressed proteins evolve slowly. Proc
Natl Acad Sci USA 2005,
102:14338-14343.
15. Poretsky RS, Hewson I, Sun SL, Allen AE, Zehr JP, Moran MA: Comparative
day/night metatranscriptomic analysis of microbial communities in the
North Pacific subtropical gyre. Environ Microbiol 2009, 11:1358-1375.
16. Hewson I, Poretsky RS, Tripp HJ, Montoya JP, Zehr JP: Spatial patterns and
light-driven variation of microbial population gene expression in surface
waters of the oligotrophic open ocean. Environ Microbiol 2010,
12:1940-1956.
17. Shi YM, Tyson GW, DeLong EF: Metatranscriptomics reveals unique
microbial small RNAs in the ocean’s water column. Nature 2009,
459:266-269.
18. McCarren J, Becker JW, Repeta DJ, Shi YM, Young CR, Malmstrom RR,
Chisholm SW, DeLong EF: Microbial community transcriptomes reveal
microbes and metabolic pathways associated with dissolved organic
matter turnover in the sea. Proc Natl Acad Sci USA 2010, 107:16420-16427.
19. Frias-Lopez J, Shi Y, Tyson GW, Coleman ML, Schuster SC, Chisholm SW,
DeLong EF: Microbial community gene expression in ocean surface
waters. Proc Natl Acad Sci USA 2008, 105:3805-3810.
20. Urich T, Lanzen A, Qi J, Huson DH, Schleper C, Schuster SC: Simultaneous
assessment of soil microbial community structure and function through
analysis of the meta-transcriptome. PLoS ONE 2008, 3:e2527.
21. Gilbert JA, Field D, Huang Y, Edwards R, Li WZ, Gilna P, Joint I: Detection of
large numbers of novel sequences in the metatranscriptomes of
complex marine microbial communities. PLoS ONE 2008, 3:e3042.
Stewart et al. Genome Biology 2011, 12:R26
/>Page 23 of 24
22. Gifford SM, Sharma S, Rinta-Kanto JM, Moran MA: Quantitative analysis of
a deeply sequenced marine microbial metatranscriptome. ISME J 2011,
5:461-472.
23. Stewart FJ, Ottesen EA, DeLong EF: Development and quantitative
analyses of a universal rRNA-subtraction protocol for microbial
metatranscriptomics. ISME J 2010, 4:896-907.
24. Drummond DA, Raval A, Wilke CO: A single determinant dominates the
rate of yeast protein evolution. Mol Biol Evol 2006, 23:327-337.
25. Jordan IK, Rogozin IB, Wolf YI, Koonin EV: Microevolutionary genomics of
bacteria. Theor Popul Biol 2002, 61:435-447.
26. Decottignies A, Sanchez-Perez I, Nurse P: Schizosaccharomyces pombe
essential genes: a pilot study. Genome Res 2003, 13:399-406.
27. Mata J, Bahler J: Correlations between gene expression and gene
conservation in fission yeast. Genome Res 2003, 13:2686-2690.
28. Callister SJ, Mccue LA, Turse JE, Monroe ME, Auberry KJ, Smith RD,
Adkins JN, Lipton MS: Comparative bacterial proteomics: analysis of the
core genome concept. PLoS ONE 2008, 3:e1542.
29. Ochman H, Lawrence JG, Groisman EA: Lateral gene transfer and the
nature of bacterial innovation. Nature 2000, 405:299-304.
30. Coleman ML, Sullivan MB, Martiny AC, Steglich C, Barry K, DeLong EF,
Chisholm SW: Genomic islands and the ecology and evolution of
Prochlorococcus. Science 2006, 311:1768-1770.
31. Nicolas P, Bessieres P, Ehrlich SD, Maguin E, van de Guchte M: Extensive
horizontal transfer of core genome genes between two Lactobacillus
species found in the gastrointestinal tract. BMC Evol Biol 2007, 7:141.
32. Taniguchi Y, Choi PJ, Li GW, Chen HY, Babu M, Hearn J, Emili A, Xie XS:
Quantifying E. coli proteome and transcriptome with single-molecule
sensitivity in single cells. Science 2010, 329:533-538.
33. Dotsch A, Klawonn F, Jarek M, Scharfe M, Blocker H, Haussler S:
Evolutionary conservation of essential and highly expressed genes in
Pseudomonas aeruginosa. BMC Genomics 2010, 11:234.
34. Jordan IK, Rogozin IB, Wolf YI, Koonin EV: Essential genes are more
evolutionarily conserved than are nonessential genes in bacteria.
Genome Res 2002, 12:962-968.
35. Stewart FJ, Ulloa O, DeLong EF: Microbial metatranscriptomics in a
permanent marine oxygen minimum zone. Environ Microbiol 2011.
36. Oliver SG: From DNA sequence to biological function. Nature 1996,
379:597-600.
37. Daubin V, Ochman H: Bacterial genomes as new gene homes: the
genealogy of ORFans in E. coli. Genome Res 2004, 14:1036-1042.
38. Palacios C, Wernegreen JJ: A strong effect of AT mutational bias on
amino acid usage in Buchnera is mitigated at high-expression genes.
Mol Biol Evol 2002, 19:1575-1584.
39. Banerjee T, Ghosh TC: Gene expression level shapes the amino acid
usages in Prochlorococcus marinus MED4. J Biomol Struct Dyn 2006,
23:547-553.
40. Akashi H, Gojobori T: Metabolic efficiency and amino acid composition in
the proteomes of Escherichia coli and Bacillus subtilis. Proc Natl Acad Sci
USA 2002, 99:3695-3700.
41. Lind PA, Andersson DI: Whole-genome mutational biases in bacteria. Proc
Natl Acad Sci USA 2008, 105:17878-17883.
42. Hershberg R, Petrov DA: Evidence that mutation is universally biased
towards AT in bacteria. PLoS Genet 2010, 6:e1001115.
43. Plata G, Gottesman ME, Vitkup D: The rate of the molecular clock and the
cost of gratuitous protein synthesis. Genome Biol 2010, 11:R98.
44. Peplinski K, Ehrenreich A, Doring C, Bomeke M, Reinecke F, Hutmacher C,
Steinbuchel A: Genome-wide transcriptome analyses of the ‘Knallgas’
bacterium Ralstonia eutropha H16 with regard to polyhydroxyalkanoate
metabolism. Microbiology 2010, 156:2136-2152.
45. Chaussee MA, Dmitriev AV, Callegari EA, Chaussee MS: Growth phase-
associated changes in the transcriptome and proteome of Streptococcus
pyogenes. Arch Microbiol 2008, 189:27-41.
46. Waite RD, Papakonstantinopoulou A, Littler E, Curtis MA: Transcriptome
analysis of Pseudomonas aeruginosa growth: comparison of gene
expression in planktonic cultures and developing and mature biofilms.
J Bacteriol 2005, 187
:6571-6576.
47. Pruesse E, Quast C, Knittel K, Fuchs BM, Ludwig WG, Peplies J, Glockner FO:
SILVA: a comprehensive online resource for quality checked and aligned
ribosomal RNA sequence data compatible with ARB. Nucleic Acids Res
2007, 35:7188-7196.
48. Gomez-Alvarez V, Teal TK, Schmidt TM: Systematic artifacts in
metagenomes from complex microbial communities. ISME J 2009,
3:1314-1317.
49. Li WZ, Godzik A: Cd-hit: a fast program for clustering and comparing
large sets of protein or nucleotide sequences. Bioinformatics 2006,
22:1658-1659.
50. Kettler GC, Martiny AC, Huang K, Zucker J, Coleman ML, Rodrigue S, Chen F,
Lapidus A, Ferriera S, Johnson J, Steglich C, Church GM, Richardson P,
Chisholm SW: Patterns and implications of gene gain and loss in the
evolution of Prochlorococcus. PLoS Genet 2007, 3:e231.
51. Noguchi H, Park J, Takagi T: MetaGene: prokaryotic gene finding from
environmental genome shotgun sequences. Nucleic Acids Res 2006,
34:5623-5630.
doi:10.1186/gb-2011-12-3-r26
Cite this article as: Stewart et al.: Community transcriptomics reveals
universal patterns of protein sequence conservation in natural microbial
communities. Genome Biology 2011 12:R26.
Submit your next manuscript to BioMed Central
and take full advantage of:
• Convenient online submission
• Thorough peer review
• No space constraints or color figure charges
• Immediate publication on acceptance
• Inclusion in PubMed, CAS, Scopus and Google Scholar
• Research which is freely available for redistribution
Submit your manuscript at
www.biomedcentral.com/submit
Stewart et al. Genome Biology 2011, 12:R26
/>Page 24 of 24