Báo cáo y học: "A genome-wide view of mutation rate co-variation using multivariate analyses" potx
Bạn đang xem bản rút gọn của tài liệu. Xem và tải ngay bản đầy đủ của tài liệu tại đây (663.23 KB, 18 trang )
RESEARCH Open Access
A genome-wide view of mutation rate
co-variation using multivariate analyses
Guruprasad Ananda
1,2
, Francesca Chiaromonte
1,3*†
and Kateryna D Makova
1,4*†
Abstract
Background: While the abundance of available sequenced genomes has led to many studies of regional
heterogeneity in mutation rates, the co-variation among rates of different mutation types remains largely
unexplored, hindering a deeper understanding of mutagenesis and genome dynamics. Here, utilizing primate and
rodent genomic alignments, we apply two multivariate analysis techniques (principal components and canonical
correlations) to investigate the structure of rate co-variation for four mutation types and simultaneously explore the
associations with multiple genomic features at different genomic scales and phylogenetic distances.
Results: We observe a consistent, largely linear co-variation among rates of nucleotide substitutions, small
insertions and small deletions, with some non-linear associations detected among these rates on chromosome X
and near autosomal telomeres. This co-variation appears to be shaped by a common set of genomic features,
some previously investigated and some novel to this study (nuclear lamina binding sites, methylated non-CpG sites
and nucleosome-free regions). Strong non-linear relationships are also dete cted among genomic features near the
centromeres of large chromosomes. Microsatellite mutability co-varies with other mutation rates at finer scales, but
not at 1 Mb, and shows varying degrees of association with genomic features at different scales.
Conclusions: Our results allow us to speculate about the role of different molecular mechanisms, such as
replication, recombination, repair and local chromatin environment, in mutagenesis. The software tools developed
for our analyses are available through Galaxy, an open-source genomics portal, to facilitate the use of multivariate
techniques in future large-scale genomics studies.
Background
Deciphering the mechanisms of mutagenesis is central
to our understanding of evolution and critical for stu-
dies of human genetic diseases. The availability of a
multitude of sequenced genomes and their alignment s
provides an opportunity to study mutations on a gen-
ome-wide scale in many species, including humans.
There is now substantial evidence for within-genome
variation in mutation rates; in particular, regional varia-
tion in nucleotide substitution rates, insertio n and dele-
tion (indel) rates, and microsatellite mutability have
been documented across the human genome [1-10].
However, notwithstanding the attention it has received
in the literature, the causative mechanisms underlying
regional mutation rate v ariation remain elusive. Bio-
chemical processes, including replication and recombi-
nation, have been suggested as poten tial contributors to
mutation rate variation. For instance, replication likely
determines the differences in nucleotide substitution
rates among chromosomal types - nucleotide substitu-
tion rates are highest on chromosome Y, intermediate
on autosomes, and lowest on chromosome X (for exam-
ple, [10,11]), consistent with the relative number of
germline cell divisions and thus DNA replication rounds
for each of these chromosome types [12,13]. Local male
recombination rate has been shown to be a significant
determinant of regional nucleotide substitution rate var-
iation [10], supp orting the potential mutagenic nature of
recombination and/or biased gene conversion [1,6,10].
Rates of small deletions have been found t o be asso-
ciated with replication-related genomic features, and
rates of small inserti ons with recombination-related fea-
tures [8]. Finally, the role of replication slippage in
* Correspondence: ;
† Contributed equally
1
Center for Medical Genomics, Penn State University, University Park, PA
16802, USA
Full list of author information is available at the end of the article
Ananda et al. Genome Biology 2011, 12:R27
/>© 2011 Ananda et al.; licensee BioMed Central Ltd. This is an open access article distribu ted un der the terms of the Creative Commons
Attribution License ( which permits unrestricted use, distribution, and reproduction in
any medium, pro vided the original work is properly cited.
determining variation in mutability among microsatellite
loci has been recently corroborated [9]. Other factors -
for example, the p redominance of aberrant DNA repair
mechanisms like non-hom ologous end-joining at subte-
lomeric regions [14], and yet unexplored mutagenic
mechanisms potentially acting at telomeres [10] - might
influence regional variation in mutation rates as well.
Genome-wide information on three additional geno-
mic features has recently become available. Nuclear
lamina binding regions are thought to represent a
repressive chromatin environment and are concentrated
in the proximity of centromeres [ 15]; their impact on
local mutation rates has not been investigated to date.
An abundance of methylated sites at non-CpG DNA
locations in human embryonic stem cells was revealed
by a recent study [16], suggesting alternative roles for
DNA methylation in CpG and non-CpG co ntexts.
Although the function of methylation in generating
mutations at CpG locations has been extensively
researc hed [2,6,8-10], no study to date has looked at the
potential impact of the non-CpG methylome on the
genome and its mutagenesis; in particular, methylated
non-CpG cytosines may also elevate mutation rates.
Finally, recent predictions of the density of nucleosome-
free regions based on MNase digestion [17] can be used
to understand the influence of local chromatin structure
on mutation rates. Assessing the contribution of these
three novel genomic features to mutation rate variation
is of obvious and immediate interest.
In addition to varying regionally, rates of different
mutations frequently co-vary with each other. Co-varia-
tion was observed between rates of nucleotide substitu-
tions (estimated at ancestr al repeats and four-fold
degenerate sites), large deletions and insertions of trans-
posable elements [2]. In a s eparate study, co-variation
was observed between rates of nucleotide substitutions
and both small insertions and small deletions [8]. What
causes regional co-variation in the rates of different
mutation types? While explanations based on selection
have been considered [18], they are not satisfactory
bec ause mutation rates also co-vary in presumably neu-
trally evolving portions of the genome [2]. Shared local
genomic landscapes might be responsible for the co-var-
iation of these rates and, on a purely mechanistic basis,
one mutation type might be physically associated with
another one (for example, indel-induced nucleotide sub-
stitutions) [19], causing the corresponding rates to co-
vary. However, these hypotheses have never been exten-
sively explored. Notably, while a number of studies have
documented regio nal variation and co-variation of rates
of mutations of several types, they have mostly relied on
correlation and univariate regression analyses, which
relate mutation rates only in a pair-wise fashion, and
attempt to explain their variation (as a function of
genomic features) one at a time [2,3,5,8-10,18,20-22]. A
better understanding of the structure and causes of
mutation rate co-variation, which is crucial for studies
of mutagenesis, can be achieved only through more
sophisticated data analysis approaches.
Thisisexactlywhatwepursuedinthecurrentstudy,
where we jointly investigated m ultiple mutation rates
alongside several plausible explanato ry genomic features,
shedding light on the interplay between mutagenesis and
the genomic landscape in which it occurs. In more detail,
we used multivariate analysis techniques to characterize
the co-variation structure of four rates (nucleotide substi-
tutions, insertions, deletions, and microsatellite repeat
number alterations) and explore their joint relationship
with several genomic landscape variables. First, we
applied principal compo nent analysis (PCA) to mutation
rates computed along the genome. Next, we linked rates
to genomic l andscape variables using canonical correla-
tion analysis (CCA). Finally, we applied n on-linear ver-
sions of these multivariate techniques, kernel-PCA
(kPCA) and kernel-CCA (k-CCA), to investigate the pre-
sence of non-linear associations. We conducted our ana-
lyses on two mutually exclusive neutral subgenomes -
one repetitive (ancestral repeats (ARs)) an d one unique
(non-coding non-repetitive (NCNR) sequences), and
three genomic scales (1-Mb, 0.5-Mb, a nd 0.1-Mb) using
human-orangutan comparisons, and repeated them for
two additional phylogenetic distances using human-
macaque and mou se-rat compa risons, to und erstand if
and how th e structure of m utation rate co-variation and
the contribution of various genomic features may differ
among them.
Importantly, we have made the suit e of software tools
implemented for this research publicly available, with
the aim of improving reproducibility and facilitating
future studies of mutation rates and other genome-wide
data. We integrated our software into a modular tool set
in Galaxy [23], a free and easy-to-use web-based geno-
mics portal that has already established a substantial
community of users.
Results
To investigate co-variation in rates of nucleotide substi-
tutions, small insertions, small deletions, and microsatel-
lite repeat number alterations, we identified all such
mutations in the human-orangutan alignments, using
macaque as an outgroup to distinguish insertions from
deletions. Our rationale for using human-orangutan
comparisons is that, since their divergence is greater
than that of human and chimpa nzee, it is expected to
be less affected by biases due to ancestral polymorph-
isms [24]. We limited our analysis to human-specific
mutations occurring after the human-orangutan split in
two supposedly neutrally evolving subgenomes; ARs [2]
Ananda et al. Genome Biology 2011, 12:R27
/>Page 2 of 18
and NCNR sequences [11]. These have been successfully
used for evaluating neutral variation in other studies
[2,8,10,11,25-27]. Human-specific mutations were cho-
sen because of the high quality of the human genome
sequence and its annotation. The AR subgenome con-
sisted of all transposable elements that were inserted in
the human genome prior to the human-macaque diver-
gence (thus excluding L1PA1-A7, L1HS, and AluY). The
NCNR subgenome was constructed by excluding genes
and 5-kb flanking regions around them (thus removing
known coding and regulatory elements), other computa-
tionally predicted and/or experimentally validated func-
tional elements (see Materials and methods), and all
repeats identified by RepeatMasker [28] (excluding
mononucleotide microsatellites). This minimizes poten-
tial effects of selection and avoids overlap with the AR
subgenome.
Next, the human genome was broken into 1-Mb
windows, which has been proposed as the natural var-
iation scale for both mammalian nucleotide substitu-
tion and indel rates [8,25]. For each 1-Mb window,
restricting attention to the AR (and separately NCNR)
portion of the window, we computed rates of nucleo-
tide substitutions, small (≤ 30-bp) insertions, small (≤
30-bp) deletions and mononucleotide microsatellite
repeat number alterations (Table 1; see Materials and
methods). Moreover, for each 1-Mb window we aggre-
gated genomic features to be used as predictors (Table
2; see Materials and methods). Relationships among
mutation rates, and bet ween mutation rates and geno-
mic features, were explored using multivariate analysis
techniques, including PCA, CCA, and non-linear ver-
sions of both methods. All computations were per-
formed using a suite of tools developed in Galaxy (see
Materials and methods).
To verify whethe r our findings were consistent over
different genomic scales and phylogenetic distances, we
produced and analyzed analogous data for the NCNR
subgenome considering 0.5-Mb and 0.1-Mb genomic
windows, as well as human-macaque alignments (here
insertions and deletions were distinguished using mar-
moset as the outgroup) and mouse-rat alignments (here
we studied mouse-specific mutations and distinguished
insertions and deletions using guinea pig as the
outgroup). Below, we focus on AR and NCNR subge-
nome result s obtained with 1-Mb windows and human-
orangutan alignments. Findings for, and comparisons
with, other genomic scales/phylogenetic distances ana-
lyzed for the NCNR subgenome are provided in the
next-to-last subsection of the Results, the Discussion,
and in Additional file 1.
Mutation rate co-variation
PCA was used to characterize co-variation among the
four mutation rates in terms of orthogonal components,
each representing a linear combination of the rates.
PCA was run on the correlation matrix (that is, after
standardizing the rates) and resulted in two significant
components (eigenvalues greater than 1) [29], which
accounted for approx imately three-quarters of the total
variance (Table S1 in Additional file 1). Loadings (eigen-
vectors), which capture the correlation between each
principal component and the rates, were then used to
interpret the co-variation structure. Results were large ly
similar between the AR and NCNR subgenomes (Figure
1).
The first principal component suggested that the
strongest co-variation in the genome occurs among
insertion, deletion and substitution rates. Insertion and
deletion rates exhibited large and concordant loadin gs
for this component in both subgenomes (Figure 1; Table
S2 in Additional file 1), indicating a strong positive asso-
ciation between these two mutation rates. Substitution
rate also had a large loading for the firs t principal com-
ponent in both subgenomes, indicating its association
with indel rates.
Microsatellite mutability, which was absent from the
first principal component, was the only strong loading
in the second principal component in both subgenomes
(Figure 1; Table S2 in Additional file 1), suggesting that
the variation in this rate is largely orthogonal to the
others, and thus that the genomic forces driving micro-
satellite mutability might be distinct f rom those driving
indel and substitution rates (see below). Interestingly, a
marked negative correlation was observ ed between sub-
stitution rates and the number of orthologous microsa-
tellites per 1-Mb window ( Figure S1 in Additional file
1). Thus, microsatellite mutability and microsatellite
Table 1 Mutation rates investigated in the present study
Type Measurement Alignment used
Insertion rate Insertions/bp Human-orangutan-macaque
Deletion rate Deletions/bp Human-orangutan-macaque
Nucleotide substitution rate Substitutions/bp Human-orangutan
Mononucleotide microsatellite mutability Mutability/bp Human-orangutan
Mutation rates, which are used as input to PCA and as response set in CCA, are listed, along with the measurement unit and alignments used for their
estimation.
Ananda et al. Genome Biology 2011, 12:R27
/>Page 3 of 18
birth/death rates appear to have different dynamics in
the genome.
Non-linear relationship between certain mutation
types (for example, substitutions and insertions [8]) have
been observed by pair-wise comparisons in earlier
studies. Investigating non-linear associations (for exam-
ple, one rate first increasing but then decreasing as
another increases; one rate exhibiting more than propor-
tional growth as another increases; one rate ‘leveling off’
in its growth as another increases) is of interes t because
Table 2 Genomic features investigated in the present study
Feature Measurement (per Mb) Source
GC content Percentage of G and C bases ’GC Percent’ track from the UCSC Genome Browser
CpG islands Count ’CpG island’ track from the UCSC Genome Browser
Non-CG methyl-cytosines Count [16]
LINE Count ’RepeatMasker’ track from the UCSC Genome Browser
SINE Count ’RepeatMasker’ track from the UCSC Genome Browser
Nuclear lamina Number of LaminB1 interaction sites with positive
intensity
’NKI LaminB1’ track from the UCSC Genome Browser
Telomere Distance in bp ’Gap’ track from the UCSC Genome Browser
Female recombination rate (1 Mb) Centimorgan (cM) ’Recomb rate’ track from the UCSC Genome Browser
Male recombination rate (1 Mb) Centimorgan (cM) ’Recomb rate’ track from the UCSC Genome Browser
Recombination rate (0.5 Mb and 0.1
Mb)
Centimorgan (cM) [82]
SNP Count ’SNPs 129’ track from the UCSC Genome Browser
Replication timing Time through S-phase [33]
Nucleosome-free regions Coverage [17]
Coding exons Coverage ’UCSC Genes’ track from the UCSC Genome Browser
Conserved elements Coverage ’28-way most conserved’ track from the UCSC Genome
Browser
Genomic features, used as predictors in CCA, are listed along with their measurement unit and source. LINE, long interspersed repetitive elements; SINE, short
interspersed repetitive element.
−0.05 0.00 0.05
−0.05 0.00 0.05
AR P
C
A components (1−Mb; human−orangutan)
Component 1
Component 2
.
.
.
.
.
.
.
.
.
.
.
.
.
.
.
.
.
.
.
.
.
.
.
.
.
.
.
.
.
.
.
.
.
.
.
.
.
.
.
.
.
.
.
.
.
.
.
.
.
.
.
.
.
.
.
.
.
.
.
.
.
.
.
.
.
.
.
.
.
.
.
.
.
.
.
.
.
.
.
.
.
.
.
.
.
.
.
.
.
.
.
.
.
.
.
.
.
.
.
.
.
.
.
.
.
.
.
.
.
.
.
.
.
.
.
.
.
.
.
.
.
.
.
.
.
.
.
.
.
.
.
.
.
.
.
.
.
.
.
.
.
.
.
.
.
.
.
.
.
.
.
.
.
.
.
.
.
.
.
.
.
.
.
.
.
.
.
.
.
.
.
.
.
.
.
.
.
.
.
.
.
.
.
.
.
.
.
.
.
.
.
.
.
.
.
.
.
.
.
.
.
.
.
.
.
.
.
.
.
.
.
.
.
.
.
.
.
.
.
.
.
.
.
.
.
.
.
.
.
.
.
.
.
.
.
.
.
.
.
.
.
.
.
.
.
.
.
.
.
.
.
.
.
.
.
.
.
.
.
.
.
.
.
.
.
.
.
.
.
.
.
.
.
.
.
.
.
.
.
.
.
.
.
.
.
.
.
.
.
.
.
.
.
.
.
.
.
.
.
.
.
.
.
.
.
.
.
.
.
.
.
.
.
.
.
.
.
.
.
.
.
.
.
.
.
.
.
.
.
.
.
.
.
.
.
.
.
.
.
.
.
.
.
.
.
.
.
.
.
.
.
.
.
.
.
.
.
.
.
.
.
.
.
.
.
.
.
.
.
.
.
.
.
.
.
.
.
.
.
.
.
.
.
.
.
.
.
.
.
.
.
.
.
.
.
.
.
.
.
.
.
.
.
.
.
.
.
.
.
.
.
.
.
.
.
.
.
.
.
.
.
.
.
.
.
.
.
.
.
.
.
.
.
.
.
.
.
.
.
.
.
.
.
.
.
.
.
.
.
.
.
.
.
.
.
.
.
.
.
.
.
.
.
.
.
.
.
.
.
.
.
.
.
.
.
.
.
.
.
.
.
.
.
.
.
.
.
.
.
.
.
.
.
.
.
.
.
.
.
.
.
.
.
.
.
.
.
.
.
.
.
.
.
.
.
.
.
.
.
.
.
.
.
.
.
.
.
.
.
.
.
.
.
.
.
.
.
.
.
.
.
.
.
.
.
.
.
.
.
.
.
.
.
.
.
.
.
.
.
.
.
.
.
.
.
.
.
.
.
.
.
.
.
.
.
.
.
.
.
.
.
.
.
.
.
.
.
.
.
.
.
.
.
.
.
.
.
.
.
.
.
.
.
.
.
.
.
.
.
.
.
.
.
.
.
.
.
.
.
.
.
.
.
.
.
.
.
.
.
.
.
.
.
.
.
.
.
.
.
.
.
.
.
.
.
.
.
.
.
.
.
.
.
.
.
.
.
.
.
.
.
.
.
.
.
.
.
.
.
.
.
.
.
.
.
.
.
.
.
.
.
.
.
.
.
.
.
.
.
.
.
.
.
.
.
.
.
.
.
.
.
.
.
.
.
.
.
.
.
.
.
.
.
.
.
.
.
.
.
.
.
.
.
.
.
.
.
.
.
.
.
.
.
.
.
.
.
.
.
.
.
.
.
.
.
.
.
.
.
.
.
.
.
.
.
.
.
.
.
.
.
.
.
.
.
.
.
.
.
.
.
.
.
.
.
.
.
.
.
.
.
.
.
.
.
.
.
.
.
.
.
.
.
.
.
.
.
.
.
.
.
.
.
.
.
.
.
.
.
.
.
.
.
.
.
.
.
.
.
.
.
.
.
.
.
.
.
.
.
.
.
.
.
.
.
.
.
.
.
.
.
.
.
.
.
.
.
.
.
.
.
.
.
.
.
.
.
.
.
.
.
.
.
.
.
.
.
.
.
.
.
.
.
.
.
.
.
.
.
.
.
.
.
.
.
.
.
.
.
.
.
.
.
.
.
.
.
.
.
.
.
.
.
.
.
.
.
.
.
.
.
.
.
.
.
.
.
.
.
.
.
.
.
.
.
.
.
.
.
.
.
.
.
.
.
.
.
.
.
.
.
.
.
.
.
.
.
.
.
.
.
.
.
.
.
.
.
.
.
.
.
.
.
.
.
.
.
.
.
.
.
.
.
.
.
.
.
.
.
.
.
.
.
.
.
.
.
.
.
.
.
.
.
.
.
.
.
.
.
.
.
.
.
.
.
.
.
.
.
.
.
.
.
.
.
.
.
.
.
.
.
.
.
.
.
.
.
.
.
.
.
.
.
.
.
.
.
.
.
.
.
.
.
.
.
.
.
.
.
.
.
.
.
.
.
.
.
.
.
.
.
.
.
.
.
.
.
.
.
.
.
.
.
.
.
.
.
.
.
.
.
.
.
.
.
.
.
.
.
.
.
.
.
.
.
.
.
.
.
.
.
.
.
.
.
.
.
.
.
.
.
.
.
.
.
.
.
.
.
.
.
.
.
.
.
.
.
.
.
.
.
.
.
.
.
.
.
.
.
.
.
.
.
.
.
.
.
.
.
.
.
.
.
.
.
.
.
.
.
.
.
.
.
.
.
.
.
.
.
.
.
.
.
.
.
.
.
.
.
.
.
.
.
.
.
.
.
.
.
.
.
.
.
.
.
.
.
.
.
.
.
.
.
.
.
.
.
.
.
.
.
.
.
.
.
.
.
.
.
.
.
.
.
.
.
.
.
.
.
.
.
.
.
.
.
.
.
.
.
.
.
.
.
.
.
.
.
.
.
.
.
.
.
.
.
.
.
.
.
.
.
.
.
.
.
.
.
.
.
.
.
.
.
.
.
.
.
.
.
.
.
.
.
.
.
.
.
.
.
.
.
.
.
.
.
.
.
.
.
.
.
.
.
.
.
.
.
.
.
.
.
.
.
.
.
.
.
.
.
.
.
.
.
.
.
.
.
.
.
.
.
.
.
.
.
.
.
.
.
.
.
.
.
.
.
.
.
.
.
.
.
.
.
.
.
.
.
.
.
.
.
.
.
.
.
.
.
.
.
.
.
.
.
.
.
.
.
.
.
.
.
.
.
.
.
.
.
.
.
.
.
.
.
.
.
.
.
.
.
.
.
.
.
.
.
.
.
.
.
.
.
.
.
.
.
.
.
.
.
.
.
.
.
.
.
.
.
.
.
.
.
.
.
.
.
.
.
.
.
.
.
.
.
.
.
.
.
.
.
.
.
.
.
.
.
.
.
.
.
.
.
.
.
.
.
.
.
.
.
.
.
.
.
.
.
.
.
.
.
.
.
.
.
.
.
.
.
.
.
.
.
.
.
.
.
.
.
.
.
.
.
.
.
.
.
.
.
.
.
.
.
.
.
.
.
.
.
.
.
.
.
.
.
.
.
.
.
.
.
.
.
.
.
.
.
.
.
.
.
.
.
.
.
.
.
.
.
.
.
.
.
.
.
.
.
.
.
.
.
.
.
.
.
.
.
.
.
.
.
.
.
.
.
.
.
.
.
.
.
.
.
.
.
.
.
.
.
.
.
.
.
.
.
.
.
.
.
.
.
.
.
.
.
.
.
.
.
.
.
.
.
.
.
.
.
.
.
.
.
.
.
.
.
.
.
.
.
.
.
.
.
.
.
.
.
.
.
.
.
.
.
.
.
.
.
.
.
.
.
.
.
.
.
.
.
.
.
.
.
.
.
.
.
.
.
.
.
.
.
.
.
.
.
.
.
.
.
.
.
.
.
.
.
.
.
.
.
.
.
.
.
.
.
.
.
.
.
.
.
.
.
.
.
.
.
.
.
.
.
.
.
.
.
.
.
.
.
.
.
.
.
.
.
.
.
.
.
.
.
.
.
.
.
.
.
.
.
.
.
.
.
.
.
.
.
.
.
.
.
.
.
.
.
.
.
.
.
.
.
.
.
.
.
.
.
.
.
.
.
.
.
.
.
.
.
.
.
.
.
.
.
.
.
.
.
.
.
.
.
.
.
.
.
.
.
.
.
.
.
.
.
.
.
.
.
.
.
.
.
.
.
.
.
.
.
.
.
.
.
.
.
.
.
.
.
.
.
.
.
.
.
.
.
.
.
.
.
.
.
.
.
.
.
.
.
.
.
.
.
.
.
.
.
.
.
.
.
.
.
.
.
.
.
.
.
.
.
.
.
.
.
.
.
.
.
.
.
.
.
.
.
.
.
.
.
.
.
.
.
.
.
.
.
.
.
.
.
.
.
.
.
.
.
.
.
.
.
.
.
.
.
.
.
.
.
.
.
.
.
.
.
.
.
.
.
.
.
.
.
.
.
.
.
.
.
.
.
.
.
.
.
.
.
.
.
.
.
.
.
.
.
.
.
.
.
.
.
.
.
.
.
.
.
.
.
.
.
.
.
.
.
.
.
.
.
.
.
.
.
.
.
.
.
.
.
.
.
.
.
.
.
.
.
.
.
.
.
.
.
.
.
.
.
.
.
.
.
.
.
.
.
.
.
.
.
.
.
.
.
.
.
.
.
.
.
−40 −20 0 20 40
−40 −20 0 20 40
INS
DEL
SUB
MS
0.00 0.05
−0.05 0.00 0.05
N
C
NR P
C
A components (1−Mb; human−orangutan)
Component 1
Component 2
.
.
.
.
.
.
.
.
.
.
.
.
.
.
.
.
.
.
.
.
.
.
.
.
.
.
.
.
.
.
.
.
.
.
.
.
.
.
.
.
.
.
.
.
.
.
.
.
.
.
.
.
.
.
.
.
.
.
.
.
.
.
.
.
.
.
.
.
.
.
.
.
.
.
.
.
.
.
.
.
.
.
.
.
.
.
.
.
.
.
.
.
.
.
.
.
.
.
.
.
.
.
.
.
.
.
.
.
.
.
.
.
.
.
.
.
.
.
.
.
.
.
.
.
.
.
.
.
.
.
.
.
.
.
.
.
.
.
.
.
.
.
.
.
.
.
.
.
.
.
.
.
.
.
.
.
.
.
.
.
.
.
.
.
.
.
.
.
.
.
.
.
.
.
.
.
.
.
.
.
.
.
.
.
.
.
.
.
.
.
.
.
.
.
.
.
.
.
.
.
.
.
.
.
.
.
.
.
.
.
.
.
.
.
.
.
.
.
.
.
.
.
.
.
.
.
.
.
.
.
.
.
.
.
.
.
.
.
.
.
.
.
.
.
.
.
.
.
.
.
.
.
.
.
.
.
.
.
.
.
.
.
.
.
.
.
.
.
.
.
.
.
.
.
.
.
.
.
.
.
.
.
.
.
.
.
.
.
.
.
.
.
.
.
.
.
.
.
.
.
.
.
.
.
.
.
.
.
.
.
.
.
.
.
.
.
.
.
.
.
.
.
.
.
.
.
.
.
.
.
.
.
.
.
.
.
.
.
.
.
.
.
.
.
.
.
.
.
.
.
.
.
.
.
.
.
.
.
.
.
.
.
.
.
.
.
.
.
.
.
.
.
.
.
.
.
.
.
.
.
.
.
.
.
.
.
.
.
.
.
.
.
.
.
.
.
.
.
.
.
.
.
.
.
.
.
.
.
.
.
.
.
.
.
.
.
.
.
.
.
.
.
.
.
.
.
.
.
.
.
.
.
.
.
.
.
.
.
.
.
.
.
.
.
.
.
.
.
.
.
.
.
.
.
.
.
.
.
.
.
.
.
.
.
.
.
.
.
.
.
.
.
.
.
.
.
.
.
.
.
.
.
.
.
.
.
.
.
.
.
.
.
.
.
.
.
.
.
.
.
.
.
.
.
.
.
.
.
.
.
.
.
.
.
.
.
.
.
.
.
.
.
.
.
.
.
.
.
.
.
.
.
.
.
.
.
.
.
.
.
.
.
.
.
.
.
.
.
.
.
.
.
.
.
.
.
.
.
.
.
.
.
.
.
.
.
.
.
.
.
.
.
.
.
.
.
.
.
.
.
.
.
.
.
.
.
.
.
.
.
.
.
.
.
.
.
.
.
.
.
.
.
.
.
.
.
.
.
.
.
.
.
.
.
.
.
.
.
.
.
.
.
.
.
.
.
.
.
.
.
.
.
.
.
.
.
.
.
.
.
.
.
.
.
.
.
.
.
.
.
.
.
.
.
.
.
.
.
.
.
.
.
.
.
.
.
.
.
.
.
.
.
.
.
.
.
.
.
.
.
.
.
.
.
.
.
.
.
.
.
.
.
.
.
.
.
.
.
.
.
.
.
.
.
.
.
.
.
.
.
.
.
.
.
.
.
.
.
.
.
.
.
.
.
.
.
.
.
.
.
.
.
.
.
.
.
.
.
.
.
.
.
.
.
.
.
.
.
.
.
.
.
.
.
.
.
.
.
.
.
.
.
.
.
.
.
.
.
.
.
.
.
.
.
.
.
.
.
.
.
.
.
.
.
.
.
.
.
.
.
.
.
.
.
.
.
.
.
.
.
.
.
.
.
.
.
.
.
.
.
.
.
.
.
.
.
.
.
.
.
.
.
.
.
.
.
.
.
.
.
.
.
.
.
.
.
.
.
.
.
.
.
.
.
.
.
.
.
.
.
.
.
.
.
.
.
.
.
.
.
.
.
.
.
.
.
.
.
.
.
.
.
.
.
.
.
.
.
.
.
.
.
.
.
.
.
.
.
.
.
.
.
.
.
.
.
.
.
.
.
.
.
.
.
.
.
.
.
.
.
.
.
.
.
.
.
.
.
.
.
.
.
.
.
.
.
.
.
.
.
.
.
.
.
.
.
.
.
.
.
.
.
.
.
.
.
.
.
.
.
.
.
.
.
.
.
.
.
.
.
.
.
.
.
.
.
.
.
.
.
.
.
.
.
.
.
.
.
.
.
.
.
.
.
.
.
.
.
.
.
.
.
.
.
.
.
.
.
.
.
.
.
.
.
.
.
.
.
.
.
.
.
.
.
.
.
.
.
.
.
.
.
.
.
.
.
.
.
.
.
.
.
.
.
.
.
.
.
.
.
.
.
.
.
.
.
.
.
.
.
.
.
.
.
.
.
.
.
.
.
.
.
.
.
.
.
.
.
.
.
.
.
.
.
.
.
.
.
.
.
.
.
.
.
.
.
.
.
.
.
.
.
.
.
.
.
.
.
.
.
.
.
.
.
.
.
.
.
.
.
.
.
.
.
.
.
.
.
.
.
.
.
.
.
.
.
.
.
.
.
.
.
.
.
.
.
.
.
.
.
.
.
.
.
.
.
.
.
.
.
.
.
.
.
.
.
.
.
.
.
.
.
.
.
.
.
.
.
.
.
.
.
.
.
.
.
.
.
.
.
.
.
.
.
.
.
.
.
.
.
.
.
.
.
.
.
.
.
.
.
.
.
.
.
.
.
.
.
.
.
.
.
.
.
.
.
.
.
.
.
.
.
.
.
.
.
.
.
.
.
.
.
.
.
.
.
.
.
.
.
.
.
.
.
.
.
.
.
.
.
.
.
.
.
.
.
.
.
.
.
.
.
.
.
.
.
.
.
.
.
.
.
.
.
.
.
.
.
.
.
.
.
.
.
.
.
.
.
.
.
.
.
.
.
.
.
.
.
.
.
.
.
.
.
.
.
.
.
.
.
.
.
.
.
.
.
.
.
.
.
.
.
.
.
.
.
.
.
.
.
.
.
.
.
.
.
.
.
.
.
.
.
.
.
.
.
.
.
.
.
.
.
.
.
.
.
.
.
.
.
.
.
.
.
.
.
.
.
.
.
.
.
.
.
.
.
.
.
.
.
.
.
.
.
.
.
.
.
.
.
.
.
.
.
.
.
.
.
.
.
.
.
.
.
.
.
.
.
.
.
.
.
.
.
.
.
.
.
.
.
.
.
.
.
.
.
.
.
.
.
.
.
.
.
.
.
.
.
.
.
.
.
.
.
.
.
.
.
.
.
.
.
.
.
.
.
.
.
.
.
.
.
.
.
.
.
.
.
.
.
.
.
.
.
.
.
.
.
.
.
.
.
.
.
.
.
.
.
.
.
.
.
.
.
.
.
.
.
.
.
.
.
.
.
.
.
.
.
.
.
.
.
.
.
.
.
.
.
.
.
.
.
.
.
.
.
.
.
.
.
.
.
.
.
.
.
.
.
.
.
.
.
.
.
.
.
.
.
.
.
.
.
.
.
.
.
.
.
.
.
.
.
.
.
.
.
.
.
.
.
.
.
.
.
.
.
.
.
.
.
.
.
.
.
.
.
.
.
.
.
.
.
.
.
.
.
.
.
.
.
.
.
.
.
.
.
.
.
.
.
.
.
.
.
.
.
.
.
.
.
.
.
.
.
.
.
.
.
.
.
.
.
.
.
.
.
.
.
.
.
.
.
.
.
.
.
.
.
.
.
.
.
.
.
.
.
.
.
.
.
.
.
.
.
.
.
.
.
.
.
.
.
.
.
.
.
.
.
.
.
.
.
.
.
.
.
.
.
.
.
.
.
.
.
.
.
.
.
.
.
.
.
.
.
.
.
.
.
.
.
.
.
.
.
.
.
.
.
.
.
.
.
.
.
.
.
.
.
.
.
.
.
.
.
.
.
.
.
.
.
.
.
.
.
.
.
.
.
.
.
.
.
.
.
.
.
.
.
.
.
.
.
.
.
.
.
.
.
.
.
.
.
.
.
.
.
.
.
.
.
.
.
.
.
.
.
.
.
.
.
.
.
.
.
.
.
.
.
.
.
.
.
.
.
.
.
.
.
.
.
.
.
.
.
.
.
.
.
.
.
.
.
.
.
.
.
.
.
.
.
.
.
.
.
.
.
.
.
.
.
.
.
.
.
.
.
.
.
.
.
.
.
.
.
.
.
.
.
.
.
.
.
.
.
.
.
.
.
.
.
.
.
.
.
.
.
.
.
.
.
.
.
.
.
.
.
.
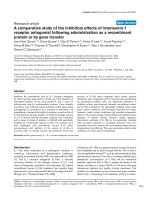
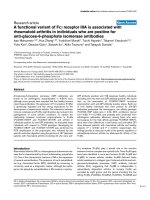
.
.
.
.
.
.
.
.
.
.
.
.
.
.
.
.
.
.
.
.
.
.
.
.
.
.
.
.
.
.
.
.
.
.
.
.
.
.
.
.
.
.
.
.
.
.
.
.
.
.
.
.
.
.
.
.
.
.
.
.
.
.
.
.
.
.
.
.
−40 −20 0 20 40
−4
0
−2
00
2
0
4
0
INS
DEL
SUB
MS
−0.05
Figure 1 Biplots of the first two PCA components for our four mutation rates, as obtained from the AR and NCNR subgenomes along
the human-orangutan branch for 1-Mb windows. Black dots represent projected observations (that is, projected windows). The vectors
labeled INS, DEL, SUB, and MS depict loadings for insertion rate, deletion rate, substitution rate, and mononucleotide microsatellite mutability,
respectively. See Tables S1 and S2 in Additional file 1 for summary statistics.
Ananda et al. Genome Biology 2011, 12:R27
/>Page 4 of 18
they can be suggestive of connections and constraints
linking different mutation types. However, questions
concerning the strength of such non-linearities, espe-
cially when considered as a multiple (as opposed to
pair-wise) phenomenon, and whether they tend to occur
in particular genomic locations or con texts, have never
been addressed directly. To investigate the existence of
non-linear associations among multiple mutation rates,
we applied kPCA, a variant of PCA that utilizes kernel
mapping (see Materials and methods) to compute prin-
cipal components in a high dimensional space non-line-
arly related to the original space [30]. While results
(Figures S2 and S3 in Additional file 1) were similar to
the PCA results described above (with the first principal
component dominated by insertion, deletion, and substi-
tution rates, and the second dominated by microsatellite
mutability), the scores produced by linear PCA and
kPCA for 1-Mb windows, although associated, were not
in complete agreement (Figure S4 in Additional file 1).
Comparing linear and non-linear PCA scores provides a
means to identify genomic regions where neutral muta-
tion rates are co-varying differently from the rest of the
genome. We regressed the strongest ‘non-linear signal’
(scores from the first kernel princ ipal component) onto
the ‘linear signals’ that emerged as significant in the
data (scores from the first and second principal compo-
nents; Table S3 in Additional file 1). The R
2
value was
76%, implying that, for the most part, the non-linear sig-
nal could be recapitulated by the linear signals. The
windows where the non-linear signal was poorly recapi-
tulated by the linear signals were identified as outliers of
the regression (see Materials and methods), and a vast
majority of them were found to be located either on
chromosome X (55% for AR, 64% for NCNR sequen ces)
or at subtelomeric regions of autosomes (Figure 2A;
58% and 45% of autosomal windows in AR and NCNR
sequences, respectively, were located within ≤15% of the
chromosomal length from the telomeres; see also Fig-
ures S5A and S6A in Additional file 1).
Mutation rate co-variation and genomic landscape
Linking mutation rates and their co-variation to the
genomic landscape is crucial for understanding its
effects on mutagenesis and thus drawing inferences on
potential causal mechanisms. To achieve this, we
employed CCA. This is a multivariate technique that,
given two sets of variables (for example, responses and
predictors) , extracts pairs of components (each compris-
ing a linear combination in the response space, and a
linear combination in the predictor space) that are
maximally correlated to one another - like PCA, subse-
quent pairs have orthogonal response components, and
orthogonal predictor components [31]. This provides a
wayofsimultaneouslyassociatingmultiplemutation
rates (responses, Table 1) to multiple genomic features
(predictors, Table 2).
We used the four mutation rates introduced above as
our response set, and formed a predictor set that
included genomic features shown to associate with
mutation rates in previous studies (GC content, recom-
bination rates, number of CpG islands, proximity to tel-
omere, replication timing, number of long interspersed
repetitive elements (LINEs), number of short inter-
spersed repetitive element (SINEs), density of SNPs,
density of coding exons and density of conserved ele-
ments) [2,5,6,8-10], as well as features not formerly con-
sidered (number of nuclear lamina binding sites,
abundance of non-CG methyl-cytosines, and density of
nucleosome-free regions; Table 2). Some of these geno-
mic features are correlated (for example, GC content
and replication timing [32,33]), and one can investigate
their co-variation structure through PCA as was done
for the mutation rates (PCA results for genomic features
are reported in Figure S7 and Tables S4 and S5 in Addi-
tional file 1). However, our focus here is not on identify-
ing leading components of the local variation in
genomic landscape, but rather leading components of its
effects on mutation rates - to this e nd, extracting CCA
components is more effective and easier to interpret
than correlating principal components extracted sepa-
rately for mutation rates and genomic features.
CCA yielded four canonical component pairs in the
NCN R subgenome and four in the AR subgenom e. The
correlations observed for these pairs were 0.6955,
0.5043, 0.3906 and 0.1043 for the NCNR subgenome,
and 0.7338, 0.5336, 0.3287 and 0.0534 for the AR subge-
nome. Based on P-values from Rao’sFApproximation
test [34] (see Materials and methods), all four NCNR
pairs and the first three AR pairs were significant (P-
values < 2.2e-16, < 2.2e-16, < 2.2e-16, and 0.0116 for
NCNR, and < 2e-16, < 2e-16, < 2e-16, and 0.7637 for
AR; Table S6 in Additional file 1). Remarkably, the first
three AR and NCNR response components described
very similar patterns (although differing in order; see
below). Loadings, which capture the correlations
between canonical components belonging to each pair
and the rates (in the response space) or the genomic
features (in the predictor space), were then used for
interpretation.
The first AR response component and the second
NCNR response component were very similar to one
another (and similar to the first principal component);
they showed strong and concordant loadings for inser-
tion rates, deletion rates and substitu tion rates (Figure
3). Thus, these components render a direction of strong
co-variation for indel and substitution rates. The corre-
sponding predictor components in both subgenomes
showed strong loadings for GC content, number of CpG
Ananda et al. Genome Biology 2011, 12:R27
/>Page 5 of 18
islands, non-CpG methylated sites, SINEs and density of
coding exons (all displaying a positive association with
the responses), as well as number of nuclear lamina
binding sites and density of nucleosome-free regions
(both negatively a ssociated with the responses). There-
fore, the first A R and second NCNR canonical compo-
nent pairs suggest that nucleosome-free regions with
many nuclear lamina binding sites, low GC content,
fewer SINEs and fewer coding exons are less prone to
insertion s, deletions and nucleotide substitutions (Figure
3). Male recombination rate (positively associated with
the responses), as well as distance from telomere and
density of conserved elements (both negatively asso-
ciated with the responses) appear alongside all of the
above-mentioned genomic features as strong contribu-
tors to the second NCNR predictor component.
ThesecondARresponsecomponentandthefirst
NCNR response component were similar to one another,
and both had dominant nucleotide substitution rate load-
ings (Figure 3). Thus, these components render a direc-
tion of strong nucleotide substitution rate variation. The
corresponding predictor components in both subge-
nomes had strong positive loadings for recomb ination
rates, and strong negative loadings for distance to telo-
mere. The predictor component in the NCNR subge-
nome also had a strong positive loading for GC content.
The third AR and NCNR response components showed
strong loadings for deletion rates (Figure 3). In addition,
the NCNR component also displayed a strong loading for
insertion rates. Thus, these components render a direc-
tion of deletion rate variation in both subgenomes, addi-
tionally depicting a negative co-variation between indel
rates in the NCNR subgenome. In both subgenomes, the
corresponding predictor component had negative load-
ings for GC content, female recombination rate, SINE
counts, and density of conserved elements. Additionally,
−
−
−
−
−
−
−
−
−
−
−
−
−
−
−
−
−
−
−
−
−
−
−
−
−
−
−
−
−
−
−
−
−
−
−
−
−
−
−
−
−
−
−
−
−
−
−
−
−
−
−
−
−
−
−
−
−
−
−
−
−
−
−
−
−
−
−
−
−
−
−
−
−
−
−
−
−
−
−
−
−
−
−
−
−
−
−
−
−
−
−
−
−
−
−
−
−
−
−
−
−
−
−
−
−
−
−
−
−
−
−
−
−
−
−
−
−
−
−
−
−
−
−
−
−
−
−
−
−
−
−
−
−
−
−
−
−
−
−
−
−
−
−
−
−
−
−
−
−
−
−
−
−
−
−
−
−
−
−
−
−
−
−
−
−
−
−
−
(a) Mapping PCA signals on the genome
Chromosome
Position along the chromosome
−
−
−
−
−
−
−
−
−
−
−
−
−
−
−
−
−
−
−
−
−
−
−
−
−
−
−
−
−
−
−
−
−
−
−
−
−
−
−
−
−
−
−
−
−
−
−
−
−
−
−
−
−
−
−
−
−
−
−
−
−
−
−
−
−
−
−
−
−
−
−
−
−
−
−
−
−
−
−
−
−
−
−
−
−
−
−
−
−
−
−
−
−
−
−
−
−
−
−
−
−
−
−
−
−
−
−
−
−
−
−
−
−
−
−
−
−
−
−
−
−
−
−
−
−
−
−
−
−
−
−
−
−
−
−
−
−
−
−
−
−
−
−
−
−
−
−
−
−
−
−
−
−
−
−
−
−
−
−
−
−
−
−
−
−
−
−
−
−
−
−
−
−
−
−
−
−
−
−
−
−
−
−
−
−
−
−
−
−
−
−
−
−
−
−
−
−
−
−
−
−
−
−
−
−
−
−
−
−
−
−
−
−
−
−
−
−
−
−
−
−
−
−
−
−
−
−
−
−
−
−
−
−
−
−
−
−
−
−
−
−
−
−
−
−
−
−
−
−
−
−
−
−
−
−
−
−
−
−
−
−
−
−
−
−
−
−
−
−
−
−
−
−
−
−
−
−
−
−
−
−
−
−
−
−
−
−
−
−
−
−
−
−
−
−
−
−
−
−
−
−
−
−
−
−
−
−
−
−
−
−
−
−
−
−
−
−
−
−
−
−
−
−
−
−
−
−
−
−
−
−
−
−
−
−
−
−
−
−
−
−
−
−
−
−
−
−
−
−
−
−
−
−
−
−
−
−
−
−
−
−
−
−
−
−
−
−
−
−
−
−
−
−
−
−
−
−
−
−
−
−
−
−
−
−
−
−
−
−
−
−
−
−
−
−
−
−
−
−
−
−
−
−
−
−
−
−
−
−
−
−
−
−
−
−
−
−
−
−
−
−
−
−
−
−
−
−
−
−
−
−
−
−
−
−
−
−
−
−
−
−
−
−
−
−
−
−
−
−
−
−
−
−
−
−
−
−
−
−
−
−
−
−
−
−
−
−
−
−
−
−
−
−
−
−
−
−
−
−
−
−
−
−
−
−
−
−
−
−
−
−
−
−
−
−
−
−
−
−
−
−
−
−
−
−
−
−
−
−
−
−
−
−
−
−
−
−
−
−
−
−
−
−
−
−
−
−
−
−
−
−
−
−
−
−
−
−
−
−
−
−
−
−
−
−
−
−
−
−
−
−
−
−
−
−
−
−
−
−
−
−
−
−
−
−
−
−
−
−
−
−
−
−
−
−
−
−
−
−
−
−
−
−
−
−
−
−
−
−
−
−
−
−
−
−
−
−
−
−
−
−
−
−
−
−
−
−
−
−
−
−
−
−
−
−
−
−
−
−
−
−
−
−
−
−
−
−
−
−
−
−
−
−
−
−
−
−
−
−
−
−
−
−
−
−
−
−
−
−
−
−
−
−
−
−
−
−
−
−
−
−
−
−
−
−
−
−
−
−
−
−
−
−
−
−
−
−
−
−
−
−
−
−
−
−
−
−
−
−
−
−
−
−
−
−
−
−
−
−
−
−
−
−
−
−
−
−
−
−
−
−
−
−
−
−
−
−
−
−
−
−
−
−
−
−
−
−
−
−
−
−
−
−
−
−
−
−
−
−
−
−
−
−
−
−
−
−
−
−
−
−
−
−
−
−
−
−
−
−
−
−
−
−
−
−
−
−
−
−
−
−
−
−
−
−
−
−
−
−
−
−
−
−
−
−
−
−
−
−
−
−
−
−
−
−
−
−
−
−
−
−
−
−
−
−
−
−
−
−
−
−
−
−
−
−
−
−
−
−
−
−
−
−
−
−
−
−
−
−
−
−
−
−
−
−
−
−
−
−
−
−
−
−
−
−
−
−
−
−
−
−
−
−
−
−
−
−
−
−
−
−
−
−
−
−
−
−
−
−
−
−
−
−
−
−
−
−
−
−
−
−
−
−
−
−
−
−
−
−
−
−
−
−
−
−
−
−
−
−
−
−
−
−
−
−
−
−
−
−
−
−
−
−
−
−
−
−
−
−
−
−
−
−
−
−
−
−
−
−
−
−
−
−
−
−
−
−
−
−
−
−
−
−
−
−
−
−
−
−
−
−
−
−
−
−
−
−
−
−
−
−
−
−
−
−
−
−
−
−
−
−
−
−
−
−
−
−
−
−
−
−
−
−
−
−
−
−
−
−
−
−
−
−
−
−
−
−
−
−
−
−
−
−
−
−
−
−
−
−
−
−
−
−
−
−
−
−
−
−
−
−
−
−
−
−
−
−
−
−
−
−
−
−
−
−
−
−
−
−
−
−
−
−
−
−
−
−
−
−
−
−
−
−
−
−
−
−
−
−
−
−
−
−
−
−
−
−
−
−
−
−
−
−
−
−
−
−
−
−
−
−
−
−
−
−
−
−
−
−
−
−
−
−
−
−
−
−
−
−
−
−
−
−
−
−
−
−
−
−
−
−
−
−
−
−
−
−
−
−
−
−
−
−
−
−
−
−
−
−
−
−
−
−
−
−
−
−
−
−
−
−
−
−
−
−
−
−
−
−
−
−
−
−
−
−
−
−
−
−
−
−
−
−
−
−
−
−
−
−
−
−
−
−
−
−
−
−
−
−
−
−
−
−
−
−
−
−
−
−
−
−
−
−
−
−
−
−
−
−
−
−
−
−
−
−
−
−
−
−
−
−
−
−
−
−
−
−
−
−
−
−
−
−
−
−
−
−
−
−
−
−
−
−
−
−
−
−
−
−
−
−
−
−
−
−
−
−
−
−
−
−
−
−
−
−
−
−
−
−
−
−
−
−
−
−
−
−
−
−
−
−
−
−
−
−
−
−
−
−
−
−
−
−
−
−
−
−
−
−
−
−
−
−
−
−
−
−
−
−
−
−
−
−
−
−
−
−
−
−
−
−
−
−
−
−
−
−
−
−
−
−
−
−
−
−
−
−
−
−
−
−
−
−
−
−
−
−
−
−
−
−
−
−
−
−
−
−
−
−
−
−
−
−
−
−
−
−
−
−
−
−
−
−
−
−
−
−
−
−
−
−
−
−
−
−
−
−
−
−
−
−
−
−
−
−
−
−
−
−
−
−
−
−
−
−
−
−
−
−
−
−
−
−
−
−
−
−
−
−
−
−
−
−
−
−
−
−
−
−
−
−
−
−
−
−
−
−
−
−
−
−
−
−
−
−
−
−
−
−
−
−
−
−
−
−
−
−
−
−
−
−
−
−
−
−
−
−
−
−
−
−
−
−
−
−
−
−
−
−
−
−
−
−
−
−
−
−
−
−
−
−
−
−
−
−
−
−
−
−
−
−
−
−
−
−
−
−
−
−
−
−
−
−
−
−
−
−
−
−
−
−
−
−
−
−
−
−
−
−
−
−
−
−
−
−
−
−
−
−
−
−
−
−
−
−
−
−
−
−
−
−
−
−
−
−
−
−
−
−
−
−
−
−
−
−
−
−
−
−
−
−
−
−
−
−
−
−
−
−
−
−
−
−
−
−
−
−
−
−
−
−
−
−
−
−
−
−
−
−
−
−
−
−
−
−
−
−
−
−
−
−
−
−
−
−
−
−
−
−
−
−
−
−
−
−
−
−
−
−
−
−
−
−
−
−
−
−
−
−
−
−
−
−
−
−
−
−
−
−
−
−
−
−
−
−
−
−
−
−
−
−
−
−
−
−
−
−
−
−
−
−
−
−
−
−
−
−
−
−
−
−
−
−
−
−
−
−
−
−
−
−
−
−
−
−
−
−
−
−
−
−
−
−
−
−
−
−
−
−
−
−
−
−
−
−
−
−
−
−
−
−
−
−
−
−
−
−
−
−
−
−
−
−
−
−
−
−
−
−
−
−
−
12345678910111213141516171819202122X
0 5e+07 1e+08 1.5e+08 2e+08 2.5e+08
−
Window type
Linearity in PCA
Non−linearity in PCA
Centromere
−
−
−
−
−
−
−
−
−
−
−
−
−
−
−
−
−
−
−
−
−
−
−
−
−
−
−
−
−
−
−
−
−
−
−
−
−
−
−
−
−
−
−
−
−
−
−
−
−
−
−
−
−
−
−
−
−
−
−
−
−
−
−
−
−
−
−
−
−
−
−
−
−
−
−
−
−
−
−
−
−
−
−
−
−
−
−
−
−
−
−
−
−
−
−
−
−
−
−
−
−
−
−
−
−
−
−
−
−
−
−
−
−
−
−
−
−
−
−
−
−
−
−
−
−
−
−
−
−
−
−
−
−
−
−
−
−
−
−
−
−
−
−
−
−
−
−
−
−
−
−
−
−
−
−
−
−
−
−
−
−
−
−
−
−
−
−
(b) Mapping CCA response−space signals on the genom
e
Chromosome
Position along the chromosome
−
−
−
−
−
−
−
−
−
−
−
−
−
−
−
−
−
−
−
−
−
−
−
−
−
−
−
−
−
−
−
−
−
−
−
−
−
−
−
−
−
−
−
−
−
−
−
−
−
−
−
−
−
−
−
−
−
−
−
−
−
−
−
−
−
−
−
−
−
−
−
−
−
−
−
−
−
−
−
−
−
−
−
−
−
−
−
−
−
−
−
−
−
−
−
−
−
−
−
−
−
−
−
−
−
−
−
−
−
−
−
−
−
−
−
−
−
−
−
−
−
−
−
−
−
−
−
−
−
−
−
−
−
−
−
−
−
−
−
−
−
−
−
−
−
−
−
−
−
−
−
−
−
−
−
−
−
−
−
−
−
−
−
−
−
−
−
−
−
−
−
−
−
−
−
−
−
−
−
−
−
−
−
−
−
−
−
−
−
−
−
−
−
−
−
−
−
−
−
−
−
−
−
−
−
−
−
−
−
−
−
−
−
−
−
−
−
−
−
−
−
−
−
−
−
−
−
−
−
−
−
−
−
−
−
−
−
−
−
−
−
−
−
−
−
−
−
−
−
−
−
−
−
−
−
−
−
−
−
−
−
−
−
−
−
−
−
−
−
−
−
−
−
−
−
−
−
−
−
−
−
−
−
−
−
−
−
−
−
−
−
−
−
−
−
−
−
−
−
−
−
−
−
−
−
−
−
−
−
−
−
−
−
−
−
−
−
−
−
−
−
−
−
−
−
−
−
−
−
−
−
−
−
−
−
−
−
−
−
−
−
−
−
−
−
−
−
−
−
−
−
−
−
−
−
−
−
−
−
−
−
−
−
−
−
−
−
−
−
−
−
−
−
−
−
−
−
−
−
−
−
−
−
−
−
−
−
−
−
−
−
−
−
−
−
−
−
−
−
−
−
−
−
−
−
−
−
−
−
−
−
−
−
−
−
−
−
−
−
−
−
−
−
−
−
−
−
−
−
−
−
−
−
−
−
−
−
−
−
−
−
−
−
−
−
−
−
−
−
−
−
−
−
−
−
−
−
−
−
−
−
−
−
−
−
−
−
−
−
−
−
−
−
−
−
−
−
−
−
−
−
−
−
−
−
−
−
−
−
−
−
−
−
−
−
−
−
−
−
−
−
−
−
−
−
−
−
−
−
−
−
−
−
−
−
−
−
−
−
−
−
−
−
−
−
−
−
−
−
−
−
−
−
−
−
−
−
−
−
−
−
−
−
−
−
−
−
−
−
−
−
−
−
−
−
−
−
−
−
−
−
−
−
−
−
−
−
−
−
−
−
−
−
−
−
−
−
−
−
−
−
−
−
−
−
−
−
−
−
−
−
−
−
−
−
−
−
−
−
−
−
−
−
−
−
−
−
−
−
−
−
−
−
−
−
−
−
−
−
−
−
−
−
−
−
−
−
−
−
−
−
−
−
−
−
−
−
−
−
−
−
−
−
−
−
−
−
−
−
−
−
−
−
−
−
−
−
−
−
−
−
−
−
−
−
−
−
−
−
−
−
−
−
−
−
−
−
−
−
−
−
−
−
−
−
−
−
−
−
−
−
−
−
−
−
−
−
−
−
−
−
−
−
−
−
−
−
−
−
−
−
−
−
−
−
−
−
−
−
−
−
−
−
−
−
−
−
−
−
−
−
−
−
−
−
−
−
−
−
−
−
−
−
−
−
−
−
−
−
−
−
−
−
−
−
−
−
−
−
−
−
−
−
−
−
−
−
−
−
−
−
−
−
−
−
−
−
−
−
−
−
−
−
−
−
−
−
−
−
−
−
−
−
−
−
−
−
−
−
−
−
−
−
−
−
−
−
−
−
−
−
−
−
−
−
−
−
−
−
−
−
−
−
−
−
−
−
−
−
−
−
−
−
−
−
−
−
−
−
−
−
−
−
−
−
−
−
−
−
−
−
−
−
−
−
−
−
−
−
−
−
−
−
−
−
−
−
−
−
−
−
−
−
−
−
−
−
−
−
−
−
−
−
−
−
−
−
−
−
−
−
−
−
−
−
−
−
−
−
−
−
−
−
−
−
−
−
−
−
−
−
−
−
−
−
−
−
−
−
−
−
−
−
−
−
−
−
−
−
−
−
−
−
−
−
−
−
−
−
−
−
−
−
−
−
−
−
−
−
−
−
−
−
−
−
−
−
−
−
−
−
−
−
−
−
−
−
−
−
−
−
−
−
−
−
−
−
−
−
−
−
−
−
−
−
−
−
−
−
−
−
−
−
−
−
−
−
−
−
−
−
−
−
−
−
−
−
−
−
−
−
−
−
−
−
−
−
−
−
−
−
−
−
−
−
−
−
−
−
−
−
−
−
−
−
−
−
−
−
−
−
−
−
−
−
−
−
−
−
−
−
−
−
−
−
−
−
−
−
−
−
−
−
−
−
−
−
−
−
−
−
−
−
−
−
−
−
−
−
−
−
−
−
−
−
−
−
−
−
−
−
−
−
−
−
−
−
−
−
−
−
−
−
−
−
−
−
−
−
−
−
−
−
−
−
−
−
−
−
−
−
−
−
−
−
−
−
−
−
−
−
−
−
−
−
−
−
−
−
−
−
−
−
−
−
−
−
−
−
−
−
−
−
−
−
−
−
−
−
−
−
−
−
−
−
−
−
−
−
−
−
−
−
−
−
−
−
−
−
−
−
−
−
−
−
−
−
−
−
−
−
−
−
−
−
−
−
−
−
−
−
−
−
−
−
−
−
−
−
−
−
−
−
−
−
−
−
−
−
−
−
−
−
−
−
−
−
−
−
−
−
−
−
−
−
−
−
−
−
−
−
−
−
−
−
−
−
−
−
−
−
−
−
−
−
−
−
−
−
−
−
−
−
−
−
−
−
−
−
−
−
−
−
−
−
−
−
−
−
−
−
−
−
−
−
−
−
−
−
−
−
−
−
−
−
−
−
−
−
−
−
−
−
−
−
−
−
−
−
−
−
−
−
−
−
−
−
−
−
−
−
−
−
−
−
−
−
−
−
−
−
−
−
−
−
−
−
−
−
−
−
−
−
−
−
−
−
−
−
−
−
−
−
−
−
−
−
−
−
−
−
−
−
−
−
−
−
−
−
−
−
−
−
−
−
−
−
−
−
−
−
−
−
−
−
−
−
−
−
−
−
−
−
−
−
−
−
−
−
−
−
−
−
−
−
−
−
−
−
−
−
−
−
−
−
−
−
−
−
−
−
−
−
−
−
−
−
−
−
−
−
−
−
−
−
−
−
−
−
−
−
−
−
−
−
−
−
−
−
−
−
−
−
−
−
−
−
−
−
−
−
−
−
−
−
−
−
−
−
−
−
−
−
−
−
−
−
−
−
−
−
−
−
−
−
−
−
−
−
−
−
−
−
−
−
−
−
−
−
−
−
−
−
−
−
−
−
−
−
−
−
−
−
−
−
−
−
−
−
−
−
−
−
−
−
−
−
−
−
−
−
−
−
−
−
−
−
−
−
−
−
−
−
−
−
−
−
−
−
−
−
−
−
−
−
−
−
−
−
−
−
−
−
−
−
−
−
−
−
−
−
−
−
−
−
−
−
−
−
−
−
−
−
−
−
−
−
−
−
−
−
−
−
−
−
−
−
−
−
−
−
−
−
−
−
−
−
−
−
−
−
−
−
−
−
−
−
−
−
−
−
−
−
−
−
−
−
−
−
−
−
−
−
−
−
−
−
−
−
−
−
−
−
−
−
−
−
−
−
−
−
−
−
−
−
−
−
−
−
−
−
−
−
−
−
−
−
−
−
−
−
−
−
−
−
−
−
−
−
−
−
−
−
−
−
−
−
−
−
−
−
−
−
−
−
−
−
−
−
−
−
−
−
−
−
−
−
−
−
−
−
−
−
−
−
−
−
−
−
−
12345678910111213141516171819202122X
0 5e+07 1e+08 1.5e+08 2e+08 2.5e+08
−
Window type
Linearity in CCA Responses
Non−linearity in CCA Responses
Centromere
−
−
−
−
−
−
−
−
−
−
−
−
−
−
−
−
−
−
−
−
−
−
−
−
−
−
−
−
−
−
−
−
−
−
−
−
−
−
−
−
−
−
−
−
−
−
−
−
−
−
−
−
−
−
−
−
−
−
−
−
−
−
−
−
−
−
−
−
−
−
−
−
−
−
−
−
−
−
−
−
−
−
−
−
−
−
−
−
−
−
−
−
−
−
−
−
−
−
−
−
−
−
−
−
−
−
−
−
−
−
−
−
−
−
−
−
−
−
−
−
−
−
−
−
−
−
−
−
−
−
−
−
−
−
−
(c) Mapping CCA predictor−space signals on the genome
C
hr
o
m
oso
m
e
Position along the chromosome
−
−
−
−
−
−
−
−
−
−
−
−
−
−
−
−
−
−
−
−
−
−
−
−
−
−
−
−
−
−
−
−
−
−
−
−
−
−
−
−
−
−
−
−
−
−
−
−
−
−
−
−
−
−
−
−
−
−
−
−
−
−
−
−
−
−
−
−
−
−
−
−
−
−
−
−
−
−
−
−
−
−
−
−
−
−
−
−
−
−
−
−
−
−
−
−
−
−
−
−
−
−
−
−
−
−
−
−
−
−
−
−
−
−
−
−
−
−
−
−
−
−
−
−
−
−
−
−
−
−
−
−
−
−
−
−
−
−
−
−
−
−
−
−
−
−
−
−
−
−
−
−
−
−
−
−
−
−
−
−
−
−
−
−
−
−
−
−
−
−
−
−
−
−
−
−
−
−
−
−
−
−
−
−
−
−
−
−
−
−
−
−
−
−
−
−
−
−
−
−
−
−
−
−
−
−
−
−
−
−
−
−
−
−
−
−
−
−
−
−
−
−
−
−
−
−
−
−
−
−
−
−
−
−
−
−
−
−
−
−
−
−
−
−
−
−
−
−
−
−
−
−
−
−
−
−
−
−
−
−
−
−
−
−
−
−
−
−
−
−
−
−
−
−
−
−
−
−
−
−
−
−
−
−
−
−
−
−
−
−
−
−
−
−
−
−
−
−
−
−
−
−
−
−
−
−
−
−
−
−
−
−
−
−
−
−
−
−
−
−
−
−
−
−
−
−
−
−
−
−
−
−
−
−
−
−
−
−
−
−
−
−
−
−
−
−
−
−
−
−
−
−
−
−
−
−
−
−
−
−
−
−
−
−
−
−
−
−
−
−
−
−
−
−
−
−
−
−
−
−
−
−
−
−
−
−
−
−
−
−
−
−
−
−
−
−
−
−
−
−
−
−
−
−
−
−
−
−
−
−
−
−
−
−
−
−
−
−
−
−
−
−
−
−
−
−
−
−
−
−
−
−
−
−
−
−
−
−
−
−
−
−
−
−
−
−
−
−
−
−
−
−
−
−
−
−
−
−
−
−
−
−
−
−
−
−
−
−
−
−
−
−
−
−
−
−
−
−
−
−
−
−
−
−
−
−
−
−
−
−
−
−
−
−
−
−
−
−
−
−
−
−
−
−
−
−
−
−
−
−
−
−
−
−
−
−
−
−
−
−
−
−
−
−
−
−
−
−
−
−
−
−
−
−
−
−
−
−
−
−
−
−
−
−
−
−
−
−
−
−
−
−
−
−
−
−
−
−
−
−
−
−
−
−
−
−
−
−
−
−
−
−
−
−
−
−
−
−
−
−
−
−
−
−
−
−
−
−
−
−
−
−
−
−
−
−
−
−
−
−
−
−
−
−
−
−
−
−
−
−
−
−
−
−
−
−
−
−
−
−
−
−
−
−
−
−
−
−
−
−
−
−
−
−
−
−
−
−
−
−
−
−
−
−
−
−
−
−
−
−
−
−
−
−
−
−
−
−
−
−
−
−
−
−
−
−
−
−
−
−
−
−
−
−
−
−
−
−
−
−
−
−
−
−
−
−
−
−
−
−
−
−
−
−
−
−
−
−
−
−
−
−
−
−
−
−
−
−
−
−
−
−
−
−
−
−
−
−
−
−
−
−
−
−
−
−
−
−
−
−
−
−
−
−
−
−
−
−
−
−
−
−
−
−
−
−
−
−
−
−
−
−
−
−
−
−
−
−
−
−
−
−
−
−
−
−
−
−
−
−
−
−
−
−
−
−
−
−
−
−
−
−
−
−
−
−
−
−
−
−
−
−
−
−
−
−
−
−
−
−
−
−
−
−
−
−
−
−
−
−
−
−
−
−
−
−
−
−
−
−
−
−
−
−
−
−
−
−
−
−
−
−
−
−
−
−
−
−
−
−
−
−
−
−
−
−
−
−
−
−
−
−
−
−
−
−
−
−
−
−
−
−
−
−
−
−
−
−
−
−
−
−
−
−
−
−
−
−
−
−
−
−
−
−
−
−
−
−
−
−
−
−
−
−
−
−
−
−
−
−
−
−
−
−
−
−
−
−
−
−
−
−
−
−
−
−
−
−
−
−
−
−
−
−
−
−
−
−
−
−
−
−
−
−
−
−
−
−
−
−
−
−
−
−
−
−
−
−
−
−
−
−
−
−
−
−
−
−
−
−
−
−
−
−
−
−
−
−
−
−
−
−
−
−
−
−
−
−
−
−
−
−
−
−
−
−
−
−
−
−
−
−
−
−
−
−
−
−
−
−
−
−
−
−
−
−
−
−
−
−
−
−
−
−
−
−
−
−
−
−
−
−
−
−
−
−
−
−
−
−
−
−
−
−
−
−
−
−
−
−
−
−
−
−
−
−
−
−
−
−
−
−
−
−
−
−
−
−
−
−
−
−
−
−
−
−
−
−
−
−
−
−
−
−
−
−
−
−
−
−
−
−
−
−
−
−
−
−
−
−
−
−
−
−
−
−
−
−
−
−
−
−
−
−
−
−
−
−
−
−
−
−
−
−
−
−
−
−
−
−
−
−
−
−
−
−
−
−
−
−
−
−
−
−
−
−
−
−
−
−
−
−
−
−
−
−
−
−
−
−
−
−
−
−
−
−
−
−
−
−
−
−
−
−
−
−
−
−
−
−
−
−
−
−
−
−
−
−
−
−
−
−
−
−
−
−
−
−
−
−
−
−
−
−
−
−
−
−
−
−
−
−
−
−
−
−
−
−
−
−
−
−
−
−
−
−
−
−
−
−
−
−
−
−
−
−
−
−
−
−
−
−
−
−
−
−
−
−
−
−
−
−
−
−
−
−
−
−
−
−
−
−
−
−
−
−
−
−
−
−
−
−
−
−
−
−
−
−
−
−
−
−
−
−
−
−
−
−
−
−
−
−
−
−
−
−
−
−
−
−
−
−
−
−
−
−
−
−
−
−
−
−
−
−
−
−
−
−
−
−
−
−
−
−
−
−
−
−
−
−
−
−
−
−
−
−
−
−
−
−
−
−
−
−
−
−
−
−
−
−
−
−
−
−
−
−
−
−
−
−
−
−
−
−
−
−
−
−
−
−
−
−
−
−
−
−
−
−
−
−
−
−
−
−
−
−
−
−
−
−
−
−
−
−
−
−
−
−
−
−
−
−
−
−
−
−
−
−
−
−
−
−
−
−
−
−
−
−
−
−
−
−
−
−
−
−
−
−
−
−
−
−
−
−
−
−
−
−
−
−
−
−
−
−
−
−
−
−
−
−
−
−
−
−
−
−
−
−
−
−
−
−
−
−
−
−
−
−
−
−
−
−
−
−
−
−
−
−
−
−
−
−
−
−
−
−
−
−
−
−
−
−
−
−
−
−
−
−
−
−
−
−
−
−
−
−
−
−
−
−
−
−
−
−
−
−
−
−
−
−
−
−
−
−
−
−
−
−
−
−
−
−
−
−
−
−
−
−
−
−
−
−
−
−
−
−
−
−
−
−
−
−
−
−
−
−
−
−
−
−
−
−
−
−
−
−
−
−
−
−
−
−
−
−
−
−
−
−
−
−
−
−
−
−
−
−
−
−
−
−
−
−
−
−
−
−
−
−
−
−
−
−
−
−
−
−
−
−
−
−
−
−
−
−
−
−
−
−
−
−
−
−
−
−
−
−
−
−
−
−
−
−
−
−
−
−
−
−
−
−
−
−
−
−
−
−
−
−
−
−
−
−
−
−
−
−
−
−
−
−
−
−
−
−
−
−
−
−
−
−
−
−
−
−
−
−
−
−
−
−
−
−
−
−
−
−
−
−
−
12345678910111213141516171819202122X
0 5e+07 1e+08 1.5e+08 2e+08 2.5e+08
−
Window type
Linearity in CCA Predictors
Non−linearity in CCA Predictors
Centromere
Figure 2 Genome-wide locations of window s driving non-l inear signals in the data. (a-c) Black circles denote windows without marked
non-linearity. Green and blue circles denote windows displaying mutation rate non-linearity in PCA (a) and CCA in the response space (b). Red
circles denote windows displaying genomic feature non-linearity in CCA in the predictor space (c). Yellow triangles represent the location of the
centromeres on each of the chromosomes.
Ananda et al. Genome Biology 2011, 12:R27
/>Page 6 of 18
in the NCNR subgenome, the third predictor component
had sizeable positive loadings for density of nucleosome-
free regions, and negative loadings for density of c oding
exons.
Finally, although not significant in the AR subgenome,
the fourth response components in both the AR and
NCNR subgenomes had dominant microsatellite mut-
ability loadings (Figure 3). Thus, these compo nents ren-
der a direction of strong microsatellite mutation rate
variation. The marginal correlations between these and
the correspo nding predictor components (0.104 and still
significant in N CNR, 0.053 and non-significant in AR),
and the smaller number of predictors with sizeable load-
ings, confirm a lesser role of genome landscape features
in explaining microsatellite mutability [9]. Nevertheless,
it is important to note a positive association between
microsatellite mutability and the density of CpG islands,
and a negative association between microsatellite mut-
ability and counts of methylated non-CpG sites.
Non-linear relationships between mutation rates and
genomic landscape variables have been noted in previous
studies, and usually investigated through pair-wise
comparisons (for example, biphasic effect of GC content
on substi tution rates [10]). Investigating non -linear asso-
ciations between mutations and genomic context can
provide crucial insights into mut agenesis mechanism.
Here, we are interested in detecting and interpreting
non-linear signals linking multiple mutation rates to mul-
tiple g enomic features, and on locating these signa ls
along the genome. We applied kCCA, a variant of CCA
that uses kernel mapping to compute canonical compo-
nents in high dimensional spaces non-linearly related to
response and predictor spaces [35]. Plotting linear CCA
and kCCA scores against one another (Figure S8 in Addi-
tional file 1) suggested non-line arity in the association of
mutation rates to the genomic landscape, comprising a
small non-li nearity in mutation rates, and a more notice-
able one in genomic features. To further exp lore this, we
regressed the strongest ‘non-linear signals’ in response
and predictor space (scores from the first kernel CCA
response and predictor components) onto significant ‘lin-
ear signals’ (scores from significant linear CCA response
and predictor components; Table S7 in Additional file 1).
For the response space (mutation rates), the dominant
Predictors (X) Responses (Y)
GC
CpG
nCGm
LINE
SINE
NLp
telo
fRec
m
Rec
SNPd
RepT
nucFree
cExon
mostCons
ins
del
sub
msMut
AR CV−1
Predictors (X) Responses (Y)
GC
CpG
nCGm
LINE
SINE
NLp
telo
fRec
mRec
SNPd
RepT
nucFree
cExon
mostCons
ins
del
sub
msMut
AR CV−2
Predictors (X) Responses (Y)
GC
CpG
nCGm
LINE
SINE
NLp
telo
fRec
mRec
SNPd
RepT
nucFree
cExon
mostCons
ins
del
sub
msMut
AR CV−3
Predictors (X) Responses (Y)
GC
CpG
nCGm
LINE
SINE
NLp
telo
fRec
m
Rec
SNPd
RepT
nucFree
cExon
mostCons
ins
del
sub
msMut
NCNR CV−1
Predictors (X) Responses (Y)
GC
CpG
nCGm
LINE
SINE
NLp
telo
fRec
mRec
SNPd
RepT
nucFree
cExon
mostCons
ins
del
sub
msMut
NCNR CV−2
Predictors (X) Responses (Y)
GC
CpG
nCGm
LINE
SINE
NLp
telo
fRec
mRec
SNPd
RepT
nucFree
cExon
mostCons
ins
del
sub
msMut
NCNR CV−3
Predictors (X) Responses (Y)
GC
CpG
nCGm
LINE
SINE
NLp
telo
fRec
mRec
SNPd
RepT
nucFree
cExon
mostCons
ins
del
su
b
msMut
NCNR CV−4
Figure 3 Helioplots for CCA performed on the AR and NCNR sub-genomes along the human-orangutan branch for 1-Mb windows. The
labels on the plots are as follows: CV, canonical variate; GC, GC content; CpG, number of CpG islands; nCGm, number of non-CpG methyl-
cytosines; LINE, number of LINE elements; SINE, number of SINE elements; NLp, number of nuclear lamina associated regions; telo, distance to
the telomere; fRec and mRec, female and male recombination rates; SNPd, SNP density; RepT, replication time; nucFree, density of nucleosome-
free regions; cExon, coverage by coding exons; mostCons, coverage by most conserved elements. Red bars indicate positive loadings, and blue
bars negative loadings. See Table S6 in Additional file 1 for summary statistics.
Ananda et al. Genome Biology 2011, 12:R27
/>Page 7 of 18
non-linear signal was almost entirely recapitulated by the
significant linear signals (R
2
higher than 99% for both AR
and NCNR sequences). However , for the predic tor space
(genomic features), significant linear signals could
account for merely 1% of the variance of the dominant
non-linear signal. Thus, when considering signals asso-
ciating mutation rates and genomic landscape features,
non-linearities displayed by the latter are much stronger
than those displayed by the former.
We again used outliers from the regressions to iden-
tify genomic locations ‘driving’ non-linearity in mutation
rates and genomic features - that is, windows for which
non-linear signals were poorly recapitulated by linear
ones (see Materials and methods). In the case of the
responses, non-linearity was minimal (R
2
above 99%;
Table S7 in Additional file 1), but, interestingly, results
paralleled those obtained with PCA signals. The major-
ity of outlying loci were on chromosome X (64% for AR
- Figure S5B in Additional file 1; 52% for NCNR
sequences - Figure S6B in Additional file 1) or near
autosomal telomeres (Figure 2B; 42% and 62% of auto-
somal windows in AR and NCNR sequences, respec-
tively, were located within a distance ≤10% of the
chromosomal length from the telomeres; see also Fig-
ures S5B and S6B in Additional file 1). These are
regions of the genome where mutation rates are sizably
lower (chromosome X) or higher (telomeres) than auto-
somal averages. In the case of the genomic features, the
non-linearity was very marked (R
2
of merely 1%; Table
S7 in Additional file 1), and a vast majority of the loci
driving this strong non-linearity were concentra ted
around the centromeres of large chromosomes (Figure
2C; 49% and 51% of such windows in AR and NCNR
sequences, respectively, were within a distance of ≤15%
of the chromosomal length from the centromere; see
also Figures S5C and 6C in Additional file 1).
Consistency across genomic scales and phylogenetic
distances
To verify whether our findings could be reproduced
over different genomic scales and phylogenetic dis-
tances, in addition to the 1-Mb windows and human-
orangutan comparison investigated above, we repea ted
our analyses considering 0.5-Mb and 0.1-Mb genomic
windows as well as human-macaque and mouse-rat
comparisons. Interestingly, the mutation rate co-varia-
tion structure remained largely consistent across all
three genomic scales and all three phylogenetic dis-
tances (Figure 1; Figures S9 to S17 in Additional file
1). Nevertheless, we did observe some differences. For
instance, while microsatellite mutability varied ortho-
gonally to i ndel and substitution rate s at the 1-Mb
scale, a co-variation (at best moderate) linking micro-
satellite mutability to the three rates was shown by
PCA at smaller scales (0.5 Mb and 0.1 Mb). CCA
results also captured this co-variation, with SINE
counts and GC content being the major contributors
(both negative; Figures S13 to S16 in Additional file 1).
Considering multiple window sizes also provided
insights into the scale at which various genomic fea-
tures affect the structure of mutation rate co-variation.
For instance, replication timing, SNP density and den-
sity of nucleosome-free regions become significant pre-
dictors of microsatellite mutability at smaller scales
(Figures S13 to S17 in Additional file 1). These asso-
ciations are noted here for the first time, as previous
studies only considered microsatellite mutability at
scales of 1 Mb or larger [9]. Further, the association of
mutation rates with genomic features showed some
differences between the rodent branch and the two
primate branches (Figure S17 in Additional file 1). For
instance, the effect of recombination on mutation rates
was found to be substantial in the primate compari-
sons, and barely marginal in the rodent comparison.
Such differences are expected given the fact that pri-
mates and rodents are known to differ in both geno-
mic landscape characteristics and mutation rates [36].
Toolset in Galaxy
Comparative genomic studies like ours often process
enormous amounts of s equence and alignment data, the
storing and handling of which poses big challenges.
Having data and software tools on a single platform can
substantially facilitate genome-wide analyses and
improve reproducibility of results (see, for instance, a
workflow for the present study in Figure 4). To dissemi-
nate the software developed for our project t o the
research community, we used Galaxy [23] - a free,
open-source genomics portal with a consistent and easy-
to-use interface capable of handling vast amounts of
data. Galaxy stores all sequences and alignments locally,
and provides a multitude of software t ools organized in
different sections. The ones we developed (Table 3) are
available under the ‘Regional variation’, ‘Multiple regres-
sion’ ,and‘ Multivariate analysis’ sections, and include
software for alignm ent data preprocessing, identification
of mutations and computation of rates, aggregation of
genomic variables, and statistical analyses (more details
are provided in the Materials and methods).
Discussion
In this study we investigate regional co-variation among
mutation rates in largely neutrally evolving parts of the
human genome (the AR and NCNR subgenomes), and
its association with features of the genomic landscape.
For the first time, the structure and causes of mutation
rate co-variation were studied v ia a multivariate
approach consider ing several mutation types and a large
Ananda et al. Genome Biology 2011, 12:R27
/>Page 8 of 18
number of genomic features jointly. Notably, the simi-
larity in results obtained fo r the AR and NCNR subge-
nomes lends supp ort to the notion of a comm on
denominator shaping mutagenesis in b oth repetitive and
unique parts of the genome.
Association of insertion, deletion and substitution rates,
and its causes
As indicated by the first principal component of our
PCA analysis, the strongest co-variation in the genome
is among insertion, deletion, and substitution rates.
While this association has been suggested by previous
pair-wise analyses [8,37], here we are able to speculate
about its causes using the CCA results. The first AR
and second NCNR canonical component pairs (Figure
3) suggest that the co-variation of indel and substitution
rates is s haped by a common set of genomic features.
Some of these features have been found to affect rates
of individual mutation types in previous studies; in par-
ticular, GC content, number of CpG islands and SINEs,
Figure 4 Galaxy workflow devel oped for estimati ng mutation rates and computing principal components. A similar workflow (not
shown) was implemented to compute canonical correlation component pairs. MAF, multiple alignment format.
Table 3 ’Regional variation’, ‘multiple regression’ and ‘multivariate analysis’ toolsets in Galaxy
Data pre-processing tools
Make windows To partition genome into windows of a user-specified size
Feature coverage To apportion various genomic features in genomic windows
Filter nucleotides To identify and mask low-quality nucleotides from alignments based on a quality score cutoff
specified by the user
Mask CpG/non-CpG sites To identify and mask CpG/non-CpG-containing sites from alignments
Tools for identifying mutations and
computing their rates
Fetch Indels To identify insertions and deletions from three-way alignments using a user-specified outgroup
Estimate indel rates To estimate indel rates by aggregating insertions and deletions in genomic regions specified by the
user
Fetch substitutions To identify nucleotide substitutions from pair-wise alignments
Estimate substitution rates To estimate substitution rate according to Jukes-Cantor JC69 model
Extract orthologous microsatellites To fetch microsatellites using SPUTNIK, and detect orthologous repeats
Estimate microsatellite mutability To estimate microsatellite mutability by grouping (and sub-grouping) repeats based on their size,
unit and motif
Multiple regression tools
Perform linear regression To construct a linear regression model using the user-selected predictors and response variables
Perform best-subsets regression To examine all of the linear regression models that can be created from all possible combinations of
the predictors variables
Compute RCVE To compute RCVE (relative contribution to variance) for all possible variable subsets
Multivariate analysis tools
PCA To perform PCA on a set of variables
CCA To perform CCA on two sets of variables
Kernel PCA To perform kernel PCA on a set of variables, using a user-specified kernel
Kernel CCA To perform kernel CCA on two sets of variables, using a user-specified kernel
RCVE, relative contribution to variability explained.
Ananda et al. Genome Biology 2011, 12:R27
/>Page 9 of 18
and density of coding exons have been shown to associ-
ate positively with indel rate and sub stitution rate varia-
tion [2,5,8,10]. Other genomic features are investigated
here for the first time; we show that non-CpG methyl-
cytosines, nuclear lamina binding sites and nucleosome-
free regions are significant contributors to mutation rate
co-variation, suggesting a role for non-CpG methylation,
nuclear lamina association, and chromatin structure in
mutagenesis.
The positive effect of GC content, density of coding
exons and no n-CpG methyl-cytosines on mutation rates
underlines the role of methylation in creating mutation
hotspots [38,39], while the negative effect of number o f
nuclear lamina binding sites and density of nucleosom e-
free regions suggests that regions associated with the
lamina and/or having compact chromatin structures are
less prone to mutations. Distance from telomere appears
alongside all of the above mentioned genomic features
as a strong contributor to the second NCNR predictor
canonical component, with a negative association with
the responses, which emphasizes peculiar mutagenic
mechanisms acting near telomeres [6,8,10,40]. Notably,
the number of nuclear lamina binding sites is positively
associated with the distance to telomere i n this compo-
nent; in agreement with another s tudy [15], this indi-
cates that lamina binding regions might be less mutable
when they are located at a distance from the telomeres.
The first AR and second NCNR canonical component
pairs suggest that genomic regions with many nuclear
lamina binding sites, a high density of nucleosome-free
regions, low GC content, low exon density, and fewer
SINEs are less prone to insertions, deletions and nucleo-
tide substitutions (Figure 3). Regions associated with
nuclearlaminaconstituteastronglyrepressivechroma-
tin environment [15], low-GC and gene-poor regions
are known to possess compact chromatin structure and
higher concentration of indels [41-43], and the preferen-
tial retention of SINEs in GC-rich regions has al so been
linked to the chromatin structure (SINE integration may
be facilitated by chromatin decondensation in GC-rich
regions) [44]. Further, these component pairs show the
density of nucleosome-free regions to be positively asso-
ciated with nuclear lamina counts, and negatively asso-
ciated with both GC content, density of CpG islands
and coding exons. In all, the picture is one of nucleo-
some-free regions characterized by a compact chromatin
structure.
In summary, the first AR and second NCNR CCA
component p airs suggest that methylation and chroma-
tin structure may have a dominant role in the strong
co-variation of indel rates and substitution rate - typify-
ing an inverse relationship between compact chromatin
structure and proneness of DNA to indels and su bstitu-
tions. This can perhaps be attribut ed to the low rate of
lesion formation in compact chromatin regions [45] and
to the differences in repair mechanisms between differ-
ent chromatin environments [46].
The third AR and NCNR CCA component pairs
depict deletion rate variation, with the third NCNR
CCA component pairs also indicating a negative associa-
tion between insertion and deletion rates (Figure 3). The
corresponding predictor components have negative
loadings for GC content, SINE counts and density of
conserved elements (the latter only for the AR subge-
nome). GC-poor regions are known to be late-replicat-
ing [32,33] and more prone to replication errors [47],
which accounts for the elevated mutation rates; our
observation therefore supports a role of replication in
generating deletions. Furthermore, we confirm the nega-
tive association between SINE counts and deleti on rates
observed previously [8,2 1]. The positive association of
GC content and density of c oding exons with insertion
rates, and their negative association with deletion rates,
point to genomic regions that tolerate more insertions
than deletions; such regions were indeed found to be
present in GC-rich, gene-rich isochores in Venter’s gen-
ome by a recent study [43]. The negative association of
the density of conserved elements with deletion rates
reiterates a previous observation about c onserved and
functional regions being depleted of small deletions [8].
A set of features comprising male and female recom-
bination rates and distance to telomere was identified as
affecting substitution rates through the second AR and
the first NCNR CCA component pair (Figure 3). These
again reflect the role of recombination in contributing
to substitution rate variation [1,2,6,10,48], and reiterate
the presence of mutagenic mechanisms acting near telo-
meres that can lead to elevated nucleotide substitution
rates [10]. Alternatively, or additionally, telomeres might
possess f ixation biases, for example, due to biased gene
conversion [49]. The strong positive loading for GC
content in the NCNR subgenome is a possible conse-
quence of recombination-associated mismatch repair,
which is GC-biased in mammals [48,50,51].
Microsatellite mutability and its genomic determinants
Our results suggest that microsatellite mutability is dri-
ven by different factors than indel and substitution
rates. Indeed, microsatellite mutability was the only sig-
nificant contributor to the second PCA component,
indicating a variation largely orthogonal to that of the
other three mutation rates. No association between
microsatellite mutability (computed here for mononu-
cleotide microsatellites only) and substitution rate was
found also in another recent study [9]. The presence of
a negative correlation between microsatellite density and
substitution rates (Figure S1 in Additional file 1) con-
firms the findings of Zhu and colleagues [52], and
Ananda et al. Genome Biology 2011, 12:R27
/>Page 10 of 18
suggests differences in the dynamics and genomic land-
scape correlates of microsatellite mutability and micro-
satellite birth-death frequency.
The fourth AR and NCNR CCA component pairs,
which are dominated by microsatell ite mutability on the
response side, are characterized by marginal correlations
and smaller numbers of genomi c features with sizeable
loadings, suggesting an insubstantial role of the genomic
landscape in explaining microsatellite mutability. In
agreement with this, a recent study concluded that a
microsatellite’s intrinsi c features (repea t number, length
and motif identity) a re the p rimary determinants of its
mutability [9]. Nevertheless, it is important to note a
positive association between microsatellite mutability
and the density of CpG islands, and a negative associa-
tion between microsatellite mutability and counts of
methylated non-C pG sites. Together, these observations
suggest that microsatellite mutability is suppressed in
methylated regions (CpG islands are usually unmethy-
lated) [39].
Nonlinear trends in mutation rate co-variation and its
relationship with genomic predictors
A comparison o f scores fro m PCA an d kPCA indi cates
some departure from linearity in the mutation rate co-var-
iation structure. Non-linearities in the relationsh ip
between insertion and deletion rates, as well as between
indel and substitution rates, have been noted earlier [8].
However, previous analyses were only pair-wise (that is,
did not consider several mutation types simultaneously)
and did not focus on identifying regions responsible for
non-linear signal. Here we show that genomic loci driving
non-linearities in mutation rate co-variation are concen-
trated on chromosome X and in proximity to the telo-
meres of autosomes, suggesting a role for the unique
landscape of chromosome X, as well as unexplored muta-
genic mechanisms acting near telomeres. Indeed, loci with
the strongest departures from linearity tend to concentrate
in those parts of the genome where rates of nucleotide
substitutions, insertions and deletions are markedly higher
(telomeres) or lower (chromosome X) than the corre-
sponding autosomal averages [4,6,8,10,23,40,53]. In com-
parison with au tosomes, chromosome X is G C-poor
[54,55] , late replicating [33] and has a biased distribution
of LINE and SINE transposable elements [26,56-58], while
autosomal subtelomeric regions are relatively GC-rich [6],
have higher recombination rates [6,59-61] and are
enri ched for double-stranded breaks/repair [14,62]. Such
differences in genomic landscape features might indeed
substantially impact the structure of mutation rate co-
variation.
In contrast, a comparison of scores from CCA and
kCCA stressed departures from linearity on the predic-
tor side (genomic features), with genomic loci driving
non-lineariti es mostly concentrated around the centro-
meres of large autosomes. This suggests that chromo-
some size, unexplored mutagenic mechanisms acting
near centromeres, and other factors (for example, repair
differences between subtelomeric regions and other
parts of t he genome) may be responsible for non-linear
signals associating mutation rates and genomic land-
scape features. Indeed, the non-linearities we detected
through kCCA, although much more marked for geno-
mic features, may recapitulate non-linear trends
observed pair-wise in previous studies; for example,
non-linear relationships between nucleotide substitution
rates and GC content [2,6,10,63], indel rates and GC
content [8], substitution rates and distance to t elomere
[10], and insertion rates and distance to telomere [8]. A
possible interpretation of the high concentration of
‘non-linearity driving’ loci around the centromeres of
large chromosomes is that non-linear signals might
manifest themselves only at a sufficient distance from
the telomeres (an average absolute distance of at least
60 Mb), with smaller chromosomes devoid of such loci
because this distanc e cannot be achieved. Other inter-
pretations could involve differen ces between subtelo-
meric regions [14] and regions away from the telomeres
[62] relative to DNA repair.
In summary, we uncov ered important information on
how a shared local genomic landscape shapes the co-
variation structure of mutation rates. The landscape sur-
rounding centromeres of large autosomes comprises
strong non-linearities among genomic predictors as they
affect mutation rates - correspondingly, the latter are
linearly related and have moderate values. Subtelomeric
and chromosome X landscapes differ notably, with
genomic predictors behaving linearly as they affect
mutation rates, and the latter showing non-linearities
and extreme values (high and low, respectively). Inter-
estingly, the landscape throughout small autosomes
appears similar to the subtelomeric l andscape of larger
autosomes, suggesting that a region must be sufficiently
removed from telomeres in absolute terms before non-
linearities among genomic predictors can occur. We
note that a similar landscape (with genomic features
behaving linearly as they affect mutation rate s) on small
autosomes might stem from the s patial proximity and
preferential interactions among these chromosomes [64].
Results at finer genomic scales
Results obtained repeating our analyses with 0.5-Mb and
0.1-Mb windows largely agreed with those described and
discussed for 1-Mb windows. In particular, the co-varia-
tion between i ndel and substitution rates was observed
and found to be dictated by a common set of genomic
features at all three scales (Figures 1 and 3; Figures S9
to S17 in Additional file 1). Similarly, substitution rate
Ananda et al. Genome Biology 2011, 12:R27
/>Page 11 of 18
variation was also observed at all three scales and found
to be d riven by the same genomic landscape features.
However, some differences were observed with respect
to microsatellite mutability. Unlike at the 1-Mb scale, at
finer scales microsatell ite mutability did show some co-
variation with indel and substitution rates. In addition,
genomic features appeared to have a stronger effect on
microsatellite mutability at finer scales. While at the 1-
Mb scale only CpG islands and methylated non-CpG
sites showed a (mild) association with microsatellite
mutability, at the 0.5-Mb and 0.1-Mb scales density of
nucleosome-free regions, density of SNPs and replica-
tion timing were also fo und to be significant predictors
(Figure 3; Figures S12 to S17 in Additional file 1). This
hints to a possible role of microsatellites in attracting
SNPs in their neighborhood (positive loading for SNP
density), likely facilitated by an interaction between het-
erozygous sites and mismatch repair process [65-67],
which is known to be less effective in late replicating
regions [68] (positive loading for replication timing).
These findings are evidence that genomic landscape
effects on microsatellite mutability cannot be completely
disregarded. When observed a t larger scales (for exam-
ple, 1-Mb and 5-Mb, as seen here and in [9]) microsa-
tellite mutability appears mostly driven by their intrinsic
features. However, when focusing on finer scales (0.5
Mb and 0.1 Mb), genomic landscape features seem to
gain significant influence. It is important to remark that
these observations should be considered preliminary
because we only analyzed mononucleotide microsatel-
lites; higher o rder microsatellites (di-, tri-, tetra-nucleo-
tide microsatellites) are known to have very different
dynamics, and may show d istinct associations with the
genomic landscape.
Results for the human-macaque and mouse-rat
comparisons
Both the structure of mutation rate co-variation and its
association with the genomic landscape appear similar
in human-orangutan and human-macaque comparisons
(Figures 1 and 3; Figures S9 to S16 in Additional file 1),
which span rather different evol utionary distan ces
(approximately 12 million years and approximately 25
million years, respectively). While other phylogenetic
distances should be considered in other studies, this
suggests that our results are not dictated by specific evo-
lutionary distances.
The structure of mutation rate co-variation in the
mouse-rat comparison (approximately 12 to 24 million
years) was found to be very similar to that on the pri-
mate branches (Figures 1 and 3; Figures S9 to S17 in
Additional file 1). However, the association of mutation
rates with certain genomic landscape variables seemed
to differ - in particular, GC content, SNP density,
recombination rates, and LINE and SINE counts (Figure
S17 in Additional file 1). This could be attributed to dif-
ferences between the genomic landscapes of primates
and rodents; specifically, when compared to the human
genome, the mouse genome has higher mean GC con-
tent, more active L1 elements, lower overall levels of
recombination, and higher mutation rates [36,59].
Recombination rates, which appeared to significantly
influence indel and substitution rates in human-orangu-
tan and human-macaque comparisons, showed barely
minimal influence in the mouse-rat comparison, consis-
tent with previous observations that the role of recombi-
nation rate in rodent mutagenesis is at best moderate
[59,69].
Conclusions
The use of multivariate techniques was crucial to our
investigation of mutation rate co-variation and its rela-
tionship with the genomic landscape, as it allowed us to
consider several rates and sev eral genomic features
simultaneously. The important insights we were able to
gather regarding mammalian mutagenesis could pre-
viously only be speculated about indirectly, if at all,
through pair-wise and univariate analyses. Moreover,
our in silico results provide useful hypotheses (for exam-
ple, the decoupling of microsatellite and indel/substitu-
tion mutations and their contrasting relationship with
the underlying genomic landscape; the likely role of
non-CpG sites and nuclear lamina binding regions in
mutagenesis) that can be further evaluated in wet-lab
experiments (see, for instance, the h ybrid computa-
tional/wet-lab approach we adopted in [70]).
In addition to an improved understanding of muta-
gen esis, our work has direct applica tion to related areas
of genomic research, such as the prediction of functional
elements. Identification of functional elements in non-
coding regions of the genome is contingent upon the
ability to clearly discr iminate funct ional sites from neu-
trally evolving ones, which is complicated by regional
variation of neutral mutation rates. Previous studies
have indicated that conservation, or more generally
alignment-based scores, have increased performance in
the prediction of functional elements when corrected to
incorporate local substitution rates [10,71,72]. Future
studies could employ our results when designing local
background corrections in prediction algorithms. The
significant signals obtained from our principal compo-
nent and canonical correlation analyses could be used as
composite correction variables, taking into account
simultaneously multiple mutation types and/or genome
landscape features. Notably, the results of our kernel
principal components and canonical correlation analyses
suggest that, while in some regions of the genome linear
composites of mutation rates and/or landscape features
Ananda et al. Genome Biology 2011, 12:R27
/>Page 12 of 18
will be satisfactor y, non-linear composites may be much
more effective in others.
The statistical and computational tools developed for
our study have been integrated into Galaxy, a user-
friendly genomics platform [23]. Our multivariate analy-
sis tools are therefore available to the scientific commu-
nity to reproduce our results, to investigate mutation
rate co-variation in other genomes, and to address a
plethora of other important biological questions on a
genome-wide scale.
Materials and methods
Data acquisition and pre-processing
Two types of presumably neutrally evolving subge-
nomes, the NCNR subgenome and the AR subgenome,
were constructed based on the March 2006 build of the
human genome (hg18). The NCNR subgenome was
constructed by excluding known genes (and the 5-kb
flanking regions surrounding them) as annotated at the
UCSC Genome Browser [73-75] and known functional
elements, including experimentally validated ones
(CTCF binding sites, estro gen receptor binding sites,
RNA polymerase II binding sites), and computationally
predicted ones (most conserved elements produced by
phastCons, vista enhancers, predicted CTCF binding
sites, and reg ions with ES PERR (evol utionary and
sequence pattern extraction through reduced representa-
tions) regulatory potential scores above 0.05 ), all as
annotated in the UCSC Genome Browser [73,75], to
remove the coding and regulatory parts of the genome,
and to eliminate additional sequences evolving under
functional constraints from the NCNR subgenome.
Furthermore, all repeats identified by RepeatMasker
[28], expect for mononucleotide microsatellites, were
removed from the NCNR subgenome to exclude overlap
with the AR subgenome. The AR subgenome consisted
of all transposable elements that were inserted in the
human genome before human-macaque divergence
(excluding L1PA1-A7, L1HS, and AluY). The human
genome was divided into 1-Mb windows, and coverage
for both subgenomes was computed in each of the win-
dows. Windows having less than 25% coverage of either
NCNR sequences or ARs were discarded. Similarly, to
perform analyses at finer scales, the human genome was
divided into 0.5-Mb and 0.1-Mb windows and windows
with less than 25% coverage of either NCNR sequences
or ARs were discarded.
Alignments correspondingtothetwosubgenomes
were fetched and pre-processed using tools from Galaxy
(see Toolset section). Human-oranguta n pair-wise align-
ments were fetched and processed for s ubstituti on rate
and microsatellite mutability computations, after being
filtered for quality using orangutan PHRED sc ores (with
a minimum quality threshold of 20) and for synteny
(only those alignments blocks that contained orangutan
chromosomes syntenic to the human chromosomes
were considered). Similarly, human-orangutan-macaque
ali gnments were fetched and prepared for insert ion and
deletion rate computations. The proportion of the two
subgenomes covered by these alignments is summarized
in Table S8 in Additional file 1.
Estimating mutation rates
Indels that occurred in the human lineage since its
divergence from the orangutan lineage were obtained
from the human-orangutan-macaque alignments, and
insertions were distinguished from deletions using
macaque as an outgroup (see detailed methods in [8]).
Indels that overlapped with microsatellites were dis-
carded to avoid scoring the same events twice. The
insertion rate for each 1-Mb window was computed as
the ratio of the number of insertions in all indel-con-
taining quality filtered NCNR (or AR) alignment block s
in that window to the total number of nucleotides in all
alignment blocks present in that window. Similarly, the
deletion rate was computed as the ratio of the number
of deletions to the total number of nucleotides. Nucleo-
tide substitutions were identified from the NCNR (or
AR) human-orangutan alignments using the Jukes’ and
Cantor’ s (JC69) model (see detailed methods in [10]).
The nucleotide substitution rate for eac h window was
then computed as the ratio of t he total number of such
substitutions in the window to the total number of
nucleotides in the alignment blocks falling in the win-
dow. Orthologous human-orangutan mononucleotide
microsatellites were identified using a modified version
of Sputnik [76] that allows detection of mononucleotide
microsatellites having at least nine repeats (based on
micro satelli te thresholds determi ned by previous studies
[70,77]), separated from each other by at least 10 bp,
and having the same repeat motif at orthologous loca-
tions in both species. They were then grouped into
repeat number bins of size 4 (for example, 9 to 12, 13
to 16, and so on), and the mutability of each group was
computed following the methods des cribed in [78]. Fol-
lowing Kelkar et al.[9],onlygroupswith30ormore
microsatellites were considered to ensure accuracy in
the estimation of mutability. To eliminate the effect of
repeat number on mutability, the mutability values were
regressed on average repeat number of the bins and the
residuals obtained were considered for further analysis.
Only mononucleotide microsatellites were considered,
since sufficient numbers of other microsatellites (repeats
of di-, tri-, or t etranucleotide motifs) could not b e
obtained in windows of 1-Mb or smaller. Any mutation
occurring in overlapping alignment blocks was discarded
to avoid counting the same locus more than once, which
would otherwise lead to an inflation of mutation rates.
Ananda et al. Genome Biology 2011, 12:R27
/>Page 13 of 18
The workflow for estimating mutation rates i s depicted
in Figure 4.
For human-macaque comparisons, indel rates were
computed from human-macaque-marmoset alignments
preprocessed as described above, with marmoset as the
outgroup, and substitution rates and microsatellite mut-
ability were computed from pre-processed human-maca-
que pairwise alignments.
Aggregating genomic landscape features
Genomic features such as GC content, number of CpG
islands, male and female recombination rates, distance
to telomere, number of LINEs, number of SINEs, SNP
density and number of nuclear lamina binding sites
were obtained from the UCSC Genome Browser per 1-
Mb window of the human genome, based on hg18
annotations of the human genome in the UCSC Gen-
ome Browser. GC content was obtained from the
gc5base program available from the UCSC Genome
Browser, which computed the percentage of G and C
nucleotid es in 1-Mb windows . CpG islands wer e
obtained from the cpgIslandExt table [79], and their
counts were apportioned into1-Mbwindowsusing
Galaxy tools. Male and female recombination rates in 1-
Mb windows were obtained from the deCODE map
rates [60] from the recombRate table. The coordinates
of LINE and SINE elements were obtained from the
RepeatMasker track and their respective counts in each
1-Mb window were computed using Galaxy tools. SNPs
were obtained from the SNP129 track [80]. Nuclear
lamina-associated sites were obtained from the ‘NKI
LaminB1’ track [15] and were apportioned into 1-Mb
windows after filtering out non-positive intensities and
therefore retaining only those domains that are strongly
bound to the lamina. Replication timing was calculated
asthetimespentbyasequenceintheSphaseofthe
cell [33]. Genomic coordinates of non-CpG methyl-cyto-
sines were obtained from the datasets produced by Lis-
ter and colleagues [16]. Since the majority of the
chromosomes between human and orangutan genomes
have little or no chromosomal rearrangements [81], only
the human telomere coordinates were considered to cal-
culate distances to telomere. Telomere coordinates were
obtained from the Gap track, and t he distance from the
middle of each window to its closest telomere was com-
puted. Nucleosome-free regions predicted from MNase
cleavage [17] were obtained, and their density in 1-Mb
windows was computed using Galaxy tools . Coordinates
of coding exons were obtained from the UCSC Genes
track, and their coverage per window was computed
using Galaxy tools. Similarly, we obtained coordinates of
most conserved regions from the ‘ 28-way most con-
served’ track, removed coding exons from this list and
obtained coverage per window using Galaxy tools.
At 0.5-Mb an d 0.1-Mb scales, all features except
recombinati on rate we re computed as described above.
Recombination rates computationally predicted from
human genetic variation data [82] were used for 0.5-Mb
and 0.1-Mb windows, as sex-specific rates are not avail-
able at these scales.
Multivariate analysis
Normality and outliers
The resulting datasets consisting of aggre gated genomic
variables and mutation rates computed for the AR and
NCNR subgenomes, separately, were each tested for
conformity to multivariate normality, and subjected to
multivariate outlier detection. As with simpler tools,
multivariate techniques can be used in a purely descrip-
tive manner. However, when tests of significance are
required, and more generally if the data depart dramati-
cally from multivariate normality, results may be mis-
leading and difficult to interpret [31]. Our dataset was
tested for conformity to multivariate normality based on
a quantile-quantile (Q-Q) plot of ordered squared-
robust Mahalanobis distances of the observations against
the quantiles of a chi-squared distribution with degrees
of freedom equal to the number of variables in the data-
set. Mahalanobis distances give a measure of the dis-
tance of a particular observation from the mean vector
of the sample, and take into account the covariance
matrix - thereby quantifying both the shape and size of
multivariate data [83]. If the observations follow multi-
variate normality, then these distances are known to
have a chi-squared distribution with q degrees of free-
dom (where q is the number of variables in the dataset)
[31]. The Q-Q plot for our dataset did not depart sub-
stantially from a straight line through the origin (data
not shown), i ndicating conformity to multi variate
normality.
Outliers may also substantially affect the results of
multivariate techniques. We identified outliers as obser-
vations having large squared Mahalanobis distances
based on a 90% quantile of the chi-squared distribution
using the ‘mvoutlier’ package i n R [84]. After removing
outliers, we retained a total of 2,027 windows in ARs,
and 1,953 windows in NCNR sequences, which were
considered for all subsequent analyses.
Normality tests and outlier filtering were performed
on windows at all genomic scales and all phylogenetic
branches and the re sulting statistics are summarized in
Table S9 in Additional file 1.
Principal component analysis
PCA [31,34] extracts linear combinations of maximal var-
iance in a given space of variables. The first principal
component represents the linear combination whose var-
iance in the data cloud is greatest amongst all possible
linear combinations. The second principal compo nent is
Ananda et al. Genome Biology 2011, 12:R27
/>Page 14 of 18
constructed to be orthogonaltothefirstprincipalcom-
ponent , and to account for maximal variance after it, and
so on. We performed PCA in the four-dimensional space
of mutation rates using the princomp funct ion from the
R statistical package [85]. The principal components
were extracted based on the correlation matrix (not the
covariance matrix), and were therefore unaffected by
units of measurement, scale and location of the different
mutation rates. Of the four principal components, only
the first two had eigenvalues (variances) ≥ 1(theaverage
eigenvalue of a correlation matrix), and they accounted
for nea rly 75% of the total variance. Therefore, following
Kaiser’ srule[29],wedecidedtoconsideronlythefirst
two principal components. The eigenvectors (loadings),
which capture the correlations between prin cipal compo-
nents and original variables, were used to interpret the
results of PCA.
Kernel principal component analysis
Gaussian kPCA [30] was performed using the R package
‘ kernlab’ [86]. kPCA is a non-linear version of PCA,
which employs a kernel function (K(x,x’)=exp(-s ||x -
x’ ||
2
) in the Gaussian case) to calculate the inner pro-
ducts between data points in a high dimensional space F
representing non-linearity, without actually performing
the mapping to this space (this reduces computational
burden). PCA is thus perfor med on F. The kernel func-
tion shown above is a general-purpose Gaussian radial
basis function, which is normally used when no prior
knowledge is available about the structure of the data.
To determine if the signals obtained from kernel PCA
are comparable with those from linear PCA, we
obtained the scores of the observations (genomic win-
dows) on the strongest kernel principal component and
regressed them against the scores of the observations on
the significant linear principal components. This allowed
us to quantify how well the ke rnel scores of our geno-
mic windows were recapitulated by their linear scores,
that is, how comparable non-linear and linear signals
were in the windows.
Canonical correlation analysis
CCA [31,34] extracts linearly correlated features from
two sets of variables, both multidimensional in nature
(that is, several Xs versus several Ys). It involves identi-
fying pairs of maximally correlated canonical variates
(CVs; u
i
,v
i
), where u
i
is a linear combination of the Xs,
and v
i
a linear combination of the Ys. The first CV pair
(u
1
,v
1
) has highest correlation R
1
among all possible lin-
ear combinations of Xs and Ys. Similarly, the second
CV pair (u
2
,v
2
) has the second largest correlation R
2
,
with the constraint that u
2
is orthogonal to u
1
, and v
2
to
v
1
, and so on. In all, s pairs (u
1
,v
1
), (u
2
,v
2
), ,(u
s
,v
s
)are
extracted, such that R
1
>R
2
> >R
s
, where s is the
smallest between the number of Xs and number of Ys.
We performed CCA with the aid of functions from
the R package ‘ yacca’ [87]. Four CVs were obtained, the
statistical significance of which was assessed using an F
test for canonical correlations, with Rao’s ap proximation
[34]. Loadings, which represent the correlations between
the original variables and the respective CVs, were used
to interpret the CVs in terms of the original X and Y
variables.
Kernel canonical correlation analysis
kCCA [35] is a non-linear version of CCA, which uses a
kernel function to provide maximally correlated non-lin-
ear features from the two sets of variables. We imple-
mented it with the R ‘kernlab’ package employing again
a Gaussian radial basis function as kernel.
For the strongest kernel canonical component, we
used standardized predictor (or response) variable coef-
ficients for each observation as an indicator of how
strongly the observation is scored by the kernel compo-
nent. These scor es were then regressed against standar-
dized predictor (or response) variable scores obtained
from significant linear components to understand the
extent to which non-linear and linear signals were
compatible.
Comparison of linear and non-linear PCA (or CCA) scores
We regressed the ‘strongest’ non-linear signal (scores
from kPCA or kCCA) onto significant linear signals
(scores from PCA or CCA) to identify the extent to
which the non-linear signal was being captured by the
linear signals. Windows for which the standardized
absolute residuals were greater than 2 were considered
as drivers of non-linearity, that is, locations at which the
non-linear signal was poorly recapitulated by the linear
ones.
Toolset in Galaxy
The following software to ols are made available under
the ‘Regional variation’, ‘Multiple regression’, and ‘Multi-
variate analysis’ tool sections of Galaxy.
Alignment data preprocessing
These are general-purpose tools, which can be used to
process multiple genomic alignments of any species.
We contributed tools to filter multiple alignments
based on PHRED quality scores available for each
sequenced genome at the UCSC Genome Browser
[73,75], and to mask CpG or non-CpG sites in multi-
ple alignments. For the first, quality scores for several
species are locally cached in Galaxy, and the user is
provided with options to s elect which species to mask,
what quality cutoffs to use, how many positions sur-
rounding low-quality bases to mask, and so on. For the
second, the user can select an inclusive or restrictive
definition of CpG sites [11], as well as the species on
which to base the masking.
Ananda et al. Genome Biology 2011, 12:R27
/>Page 15 of 18
Computation of mutation rates
These tools allow the computation of nucleotide substitu-
tions and microsatellite mutability from pair-wise align-
ments, and the computation o f rates of insertions and
deletions from three-way alignments. The mutations iden-
tified by these tools can be aggregated in genomic win-
dows, and mutation rates per window can be calculated.
Aggregation of genomic features
Galaxy provides a direct connection to the UCSC Gen-
ome Browser [73,75], which houses genomic sequences
and annotation data for numerous genomes. Genomic
features retrieved into Galaxy from the UCSC table
browser can be aggregated in windows of user-defined
size by using the ‘Make windows’ and ‘Feature coverage’
tools in the ‘Regional variation’ section.
Statistical analyses
Tools for performing multiple regression, best subsets
selection, and to compute RCVE (relative contribution
to variability explained, a measure of the role of each
predictor in explaining the total variability of a
response) [8], are available in the ‘Multiple regression’
section. Besides providing summary regression output,
the se tools produce a number of diagnostic plots. Tools
for performing linear and kernel PCA and CCA are
available in the ‘Multivariate analysis’ section. These
tools give the user several convenient options (for exam-
ple, which variables to include, whether to scale the
variables, what type of kernel to use) and produce sum-
mary output and graphics.
Additional material
Additional file 1: Figures and tables depicting PCA and CCA results
along the human-macaque and mouse-rat branches at 1-Mb, 0.5-
Mb, and 0.1-Mb scales, and along the human-orangutan branch at
0.5-Mb and 0.1-Mb scales.
Abbreviations
AR: ancestral repeats; bp: base pair; CCA: canonical correlation analysis; CV:
canonical variate; indel, insertion and deletion; kCCA: kernel canonical
correlation analysis; kPCA: kernel principal component analysis; LINE: long
interspersed repetitive elements; Mb: megabase; NCNR: non-coding non-
repetitive; PCA: principal component analysis; SINE: short interspersed
repetitive element; SNP: single nucleotide polymorphism.
Acknowledgements
We are grateful to Ross Hardison, Yogeshwar Kelkar, Erika Kvikstad, Melissa
Wilson Sayres, Benjamin Dickins, and Svitlana Tyekucheva for helpful
discussions and to Anton Nekrutenko for his assistance with integrating the
tools developed here into Galaxy. Our thanks are also due to the Genome
Center at Washington University School of Medicine in St Louis, and the
Broad Institute at MIT and Harvard for making available the marmoset and
guinea pig genome assemblies, respectively. This study was supported by
NSF grant DBI-0965596 and by NIH grant RO1GM087472.
Author details
1
Center for Medical Genomics, Penn State University, University Park, PA
16802, USA.
2
Integrative Biosciences Program, Penn State University,
University Park, PA 16802, USA.
3
Department of Statistics, Penn State
University, 505A Wartik Laboratory, University Park, PA 16802, USA.
4
Department of Biology, Penn State University, 305 Wartik Laboratory,
University Park, PA 16802, USA.
Authors’ contributions
All authors conceived and designed the analysis framework. GA
implemented and performed the analyses. All authors participated in
interpretation of results. All authors read and approved the final manuscript.
Received: 7 December 2010 Revised: 21 February 2011
Accepted: 22 March 2011 Published: 22 March 2011
References
1. Lercher MJ, Williams EJ, Hurst LD: Local similarity in evolutionary rates
extends over whole chromosomes in human-rodent and mouse-rat
comparisons: implications for understanding the mechanistic basis of
the male mutation bias. Mol Biol Evol 2001, 18:2032-2039.
2. Hardison RC, Roskin KM, Yang S, Diekhans M, Kent WJ, Weber R, Elnitski L,
Li J, O’Connor M, Kolbe D, Schwartz S, Furey TS, Whelan S, Goldman N,
Smit A, Miller W, Chiaromonte F, Haussler D: Covariation in frequencies of
substitution, deletion, transposition, and recombination during eutherian
evolution. Genome Res 2003, 13:13-26.
3. Ellegren H: Microsatellites: simple sequences with complex evolution. Nat
Rev Genet 2004, 5:435-445.
4. Makova KD, Yang S, Chiaromonte F: Insertions and deletions are male
biased too: a whole-genome analysis in rodents. Genome Res 2004,
14:567-573.
5. Lunter G, Ponting CP, Hein J: Genome-wide identification of human
functional DNA using a neutral indel model. PLoS Comput Biol 2006, 2:e5.
6. Hellmann I, Prufer K, Ji H, Zody MC, Paabo S, Ptak SE: Why do human
diversity levels vary at a megabase scale? Genome Res 2005,
15:1222-1231.
7. Webster MT, Axelsson E, Ellegren H: Strong regional biases in nucleotide
substitution in the chicken genome. Mol Biol Evol 2006, 23:1203-1216.
8. Kvikstad EM, Tyekucheva S, Chiaromonte F, Makova KD: A macaque’s-eye
view of human insertions and deletions: differences in mechanisms.
PLoS Comput Biol 2007, 3:1772-1782.
9. Kelkar YD, Tyekucheva S, Chiaromonte F, Makova KD: The genome-wide
determinants of human and chimpanzee microsatellite evolution.
Genome Res 2008, 18:30-38.
10. Tyekucheva S, Makova KD, Karro JE, Hardison RC, Miller W, Chiaromonte F:
Human-macaque comparisons illuminate variation in neutral
substitution rates. Genome Biol 2008, 9:R76.
11. Taylor J, Tyekucheva S, Zody M, Chiaromonte F, Makova KD: Strong and
weak male mutation bias at different sites in the primate genomes:
insights from the human-chimpanzee comparison. Mol Biol Evol 2006,
23:565-573.
12. Li WH, Yi S, Makova K: Male-driven evolution. Curr Opin Genet Dev 2002,
12:650-656.
13. Ellegren H: Characteristics, causes and evolutionary consequences of
male-biased mutation. Proc Biol Sci 2007, 274:1-10.
14. Linardopoulou EV, Williams EM, Fan Y, Friedman C, Young JM, Trask BJ:
Human subtelomeres are hot spots of interchromosomal recombination
and segmental duplication. Nature 2005, 437
:94-100.
15.
Guelen
L, Pagie L, Brasset E, Meuleman W, Faza MB, Talhout W, Eussen BH,
de Klein A, Wessels L, de Laat W, van Steensel B: Domain organization of
human chromosomes revealed by mapping of nuclear lamina
interactions. Nature 2008, 453:948-951.
16. Lister R, Pelizzola M, Dowen RH, Hawkins RD, Hon G, Tonti-Filippini J,
Nery JR, Lee L, Ye Z, Ngo QM, Edsall L, Antosiewicz-Bourget J, Stewart R,
Ruotti V, Millar AH, Thomson JA, Ren B, Ecker JR: Human DNA methylomes
at base resolution show widespread epigenomic differences. Nature
2009, 462:315-322.
17. Ozsolak F, Song JS, Liu XS, Fisher DE: High-throughput mapping of the
chromatin structure of human promoters. Nat Biotechnol 2007,
25:244-248.
18. Chiaromonte F, Yang S, Elnitski L, Yap VB, Miller W, Hardison RC:
Association between divergence and interspersed repeats in
mammalian noncoding genomic DNA. Proc Natl Acad Sci USA 2001,
98:14503-14508.
Ananda et al. Genome Biology 2011, 12:R27
/>Page 16 of 18
19. Tian D, Wang Q, Zhang P, Araki H, Yang S, Kreitman M, Nagylaki T,
Hudson R, Bergelson J, Chen JQ: Single-nucleotide mutation rate
increases close to insertions/deletions in eukaryotes. Nature 2008,
455:105-108.
20. Pearson CE, Nichol Edamura K, Cleary JD: Repeat instability: mechanisms
of dynamic mutations. Nat Rev Genet 2005, 6:729-742.
21. Yang S, Smit AF, Schwartz S, Chiaromonte F, Roskin KM, Haussler D,
Miller W, Hardison RC: Patterns of insertions and their covariation with
substitutions in the rat, mouse, and human genomes. Genome Res 2004,
14:517-527.
22. Rolfsmeier ML, Lahue RS: Stabilizing effects of interruptions on
trinucleotide repeat expansions in Saccharomyces cerevisiae. Mol Cell Biol
2000, 20:173-180.
23. Taylor J, Schenck I, Blankenberg D, Nekrutenko A: Using galaxy to perform
large-scale interactive data analyses. Curr Protoc Bioinformatics 2007, 10,
Unit 10.5.
24. Makova KD, Li WH: Strong male-driven evolution of DNA sequences in
humans and apes. Nature 2002, 416:624-626.
25. Gaffney DJ, Keightley PD: The scale of mutational variation in the murid
genome. Genome Res 2005, 15:1086-1094.
26. Kvikstad EM, Makova KD: The (r)evolution of SINE vs. LINE distributions in
primate genomes: Sex chromosomes are important. Genome Res 2010,
20:600-613.
27. Webster MT, Smith NGC, Lercher MJ, Ellegren H: Gene expression, synteny,
and local similarity in human noncoding mutation rates. Mol Biol Evol
2004, 21:1820-1830.
28. RepeatMasker. [ />29. Kaiser HF: The varimax criterion for analytic rotation in factor analysis.
Psychometrika 1958, 23:187-200.
30. Scholkopf B, Smola A, Muller KR: Nonlinear component analysis as a
kernel eigenvalue problem. Neural Computation 1998, 10:1299-1319.
31. Everitt BS: An R and S-Plus Companion to Multivariate Analysis London:
Springer; 2005.
32. Deschavanne P, Filipski J: Correlation of GC content with replication
timing and repair mechanisms in weakly expressed E. coli genes. Nucleic
Acids Res 1995, 23:1350-1353.
33. Woodfine K, Fiegler H, Beare DM, Collins JE, McCann OT, Young BD,
Debernardi S, Mott R, Dunham I, Carter NP: Replication timing of the
human genome.
Hum Mol Genet 2004, 13:191-202.
34.
Mardia
KV, Kent JT, Bibby JM: Multivariate Analysis London: Academic Press;
1979.
35. Kuss M, Graepel T: Technical Report No. 108: The Geometry of Kernel
Canonical Correlation Analysis Tübingen, Germany: Max Planck Institute for
Biological Cybernetics; 2003 [ />upload_22685_TR-108.pdf].
36. Mouse Genome Sequencing Consortium: Initial sequencing and
comparative analysis of the mouse genome. Nature 2002, 420:520-562.
37. Wetterbom A, Sevov M, Cavelier L, Bergstrom TF: Comparative genomic
analysis of human and chimpanzee indicates a key role for indels in
primate evolution. J Mol Evol 2006, 63:682-690.
38. Walsh CP, Bestor TH: Cytosine methylation and mammalian development.
Genes Dev 1999, 13:26-34.
39. Cross SH, Bird AP: CpG islands and genes. Curr Opin Genet Dev 1995,
5:309-314.
40. The Chimpanzee Sequencing and Analysis Consortium: Initial sequence of
the chimpanzee genome and comparison with the human genome.
Nature 2005, 437:69-87.
41. Saccone S, Federico C, Bernardi G: Localization of the gene-richest and
the gene-poorest isochores in the interphase nuclei of mammals and
birds. Gene 2002, 300:169-178.
42. Di Filippo M, Bernardi G: Mapping DNase-I hypersensitive sites on human
isochores. Gene 2008, 419:62-65.
43. Costantini M, Bernardi G: Mapping insertions, deletions and SNPs on
Venter’s chromosomes. PLoS One 2009, 4:e5972.
44. Weiner AM: SINEs and LINEs: the art of biting the hand that feeds you.
Curr Opin Cell Biol 2002, 14:343-350.
45. Boulikas T: Evolutionary consequences of nonrandom damage and repair
of chromatin domains. J Mol Evol 1992, 35:156-180.
46. Bohr VA, Phillips DH, Hanawalt PC: Heterogeneous DNA damage and
repair in the mammalian genome. Cancer Res 1987, 47:6426-6436.
47. Filipski J: Correlation between molecular clock ticking, codon usage
fidelity of DNA repair, chromosome banding and chromatin
compactness in germline cells. FEBS Lett 1987, 217:184-186.
48. Duret L, Arndt PF: The impact of recombination on nucleotide
substitutions in the human genome. PLoS Genet
2008, 4:e1000071.
49.
Duret
L, Galtier N: Biased gene conversion and the evolution of
mammalian genomic landscapes. Annu Rev Genomics Hum Genet 2009,
10:285-311.
50. Bill CA, Duran WA, Miselis NR, Nickoloff JA: Efficient repair of all types of
single-base mismatches in recombination intermediates in Chinese
hamster ovary cells: Competition between long-patch and G-T
glycosylase-mediated repair of G-T mismatches. Genetics 1998,
149:1935-1943.
51. Brown TC, Jiricny J: Different base/base mispairs are corrected with
different efficiencies and specificities in monkey kidney cells. Cell 1988,
54:705-711.
52. Zhu YY, Strassmann JJE, Queller DDC: Insertions, substitutions, and the
origin of microsatellites. Genet Res 2000, 76:227-236.
53. International Chicken Genome Sequencing Consortium: Sequence and
comparative analysis of the chicken genome provide unique
perspectives on vertebrate evolution. Nature 2004, 432:695-716.
54. Ross MT, Grafham DV, Coffey AJ, Scherer S, McLay K, Muzny D, Platzer M,
Howell GR, Burrows C, Bird CP, Frankish A, Lovell FL, Howe KL, Ashurst JL,
Fulton RS, Sudbrak R, Wen G, Jones MC, Hurles ME, Andrews TD, Scott CE,
Searle S, Ramser J, Whittaker A, Deadman R, Carter NP, Hunt SE, Chen R,
Cree A, Gunaratne P, et al: The DNA sequence of the human X
chromosome. Nature 2005, 434:325-337.
55. Skaletsky H, Kuroda-Kawaguchi T, Minx PJ, Cordum HS, Hillier L, Brown LG,
Repping S, Pyntikova T, Ali J, Bieri T, Chinwalla A, Delehaunty A,
Delehaunty K, Du H, Fewell G, Fulton L, Fulton R, Graves T, Hou SF,
Latrielle P, Leonard S, Mardis E, Maupin R, McPherson J, Miner T, Nash W,
Nguyen C, Ozersky P, Pepin K, Rock S, et al: The male-specific region of
the human Y chromosome is a mosaic of discrete sequence classes.
Nature 2003, 423:825-837.
56. Abrusan G, Krambeck HJ, Junier T, Giordano J, Warburton PE: Biased
distributions and decay of long interspersed nuclear elements in the
chicken genome. Genetics 2008, 178:573-581.
57. Boissinot S, Entezam A, Furano AV: Selection against deleterious LINE-1-
containing loci in the human lineage. Mol Biol Evol 2001, 18:926-935.
58. Jurka J, Kohany O, Pavlicek A, Kapitonov VV, Jurka MV: Duplication,
coclustering, and selection of human Alu retrotransposons. Proc Natl
Acad Sci USA 2004, 101:1268-1272.
59. Jensen-Seaman MI, Furey TS, Payseur BA, Lu Y, Roskin KM, Chen CF,
Thomas MA, Haussler D, Jacob HJ: Comparative recombination rates in
the rat, mouse, and human genomes. Genome Res 2004, 14:528-538.
60. Kong A, Gudbjartsson DF, Sainz J, Jonsdottir GM, Gudjonsson SA,
Richardsson B, Sigurdardottir S, Barnard J, Hallbeck B, Masson G, Shlien A,
Palsson ST, Frigge ML, Thorgeirsson TE, Gulcher JR, Stefansson K: A high-
resolution recombination map of the human genome. Nat Genet 2002,
31:241-247.
61. Yu A, Zhao C, Fan Y, Jang W, Mungal AJ, Deloukas P, Olsen A, Doggett NA,
Ghebranious N, Broman KW, Weber JL: Comparison
of
human genetic and
sequence-based physical maps. Nature 2000, 409:951-953.
62. Rudd MK, Friedman C, Parghi SS, Linardopoulou EV, Hsu L, Trask BJ:
Elevated rates of sister chromatid exchange at chromosome ends. PLoS
Genet 2007, 3:e32.
63. Eory L, Halligan DL, Keightley PD: Distributions of selectively constrained
sites and deleterious mutation rates in the hominid and murid
genomes. Mol Biol Evol 2010, 27:177-192.
64. Lieberman-Aiden E, van Berkum NL, Williams L, Imakaev M, Ragoczy T,
Telling A, Amit I, Lajoie BR, Sabo PJ, Dorschner MO, Sandstrom R,
Bernstein B, Bender MA, Groudine M, Gnirke A, Stamatoyannopoulos J,
Mirny LA, Lander ES, Dekker J: Comprehensive mapping of long-range
interactions reveals folding principles of the human genome. Science
2009, 326:289-293.
65. Amos W: Heterozygosity and mutation rate: evidence for an interaction
and its implications. Bioessays 2010, 32:82-90.
66. Amos W: Even small SNP clusters are non-randomly distributed: is this
evidence of mutational non-independence? Proc Biol Sci 2010,
277:1443-1449.
Ananda et al. Genome Biology 2011, 12:R27
/>Page 17 of 18
67. Amos W, Flint J, Xu X: Heterozygosity increases microsatellite mutation
rate, linking it to demographic history. BMC Genet 2008, 9:72.
68. Stamatoyannopoulos JA, Adzhubei I, Thurman RE, Kryukov GV, Mirkin SM,
Sunyaev SR: Human mutation rate associated with DNA replication
timing. Nat Genet 2009, 41:393-395.
69. Huang SW, Friedman R, Yu N, Yu A, Li WH: How strong is the
mutagenicity of recombination in mammals? Mol Biol Evol 2005,
22:426-431.
70. Kelkar YD, Strubczewski N, Hile SE, Chiaromonte F, Eckert KA, Makova KD:
What is a microsatellite: a computational and experimental definition
based upon repeat mutational behavior at A/T and GT/AC repeats.
Genome Biol Evol 2010, 2:620-635.
71. Siepel A, Bejerano G, Pedersen JS, Hinrichs AS, Hou MM, Rosenbloom K,
Clawson H, Spieth J, Hillier LW, Richards S, Weinstock GM, Wilson RK,
Gibbs RA, Kent WJ, Miller W, Haussler D: Evolutionarily conserved
elements in vertebrate, insect, worm, and yeast genomes. Genome Res
2005, 15:1034-1050.
72. Taylor J, Tyekucheva S, King DC, Hardison RC, Miller W, Chiaromonte F:
ESPERR: Learning strong and weak signals in genomic sequence
alignments to identify functional elements. Genome Res 2006,
16:1596-1604.
73. Karolchik D, Kuhn RM, Baertsch R, Barber GP, Clawson H, Diekhans M,
Giardine B, Harte RA, Hinrichs AS, Hsu F, Kober KM, Miller W, Pedersen JS,
Pohl A, Raney BJ, Rhead B, Rosenbloom KR, Smith KE, Stanke M,
Thakkapallayil A, Trumbower H, Wang T, Zweig AS, Haussler D, Kent WJ:
The UCSC Genome Browser Database: 2008 update. Nucleic Acids Res
2008, 36:D773-779.
74. Hsu F, Kent WJ, Clawson H, Kuhn RM, Diekhans M, Haussler D: The UCSC
Known Genes. Bioinformatics 2006, 22:1036-1046.
75. Kent WJ, Sugnet CW, Furey TS, Roskin KM, Pringle TH, Zahler AM,
Haussler D: The human genome browser at UCSC. Genome Res 2002,
12:996-1006.
76. Sputnik. [ />77. Lai Y, Sun F: The relationship between microsatellite slippage mutation
rate and the number of repeat units. Mol Biol Evol 2003, 20:2123-2131.
78. Webster MT, Smith NG, Ellegren H: Microsatellite evolution inferred from
human-chimpanzee genomic sequence alignments. Proc Natl Acad Sci
USA 2002, 99:8748-8753.
79. Gardinergarden M, Frommer M: Cpg Islands in Vertebrate Genomes. J Mol
Biol 1987, 196:261-282.
80. Sherry ST, Ward MH, Kholodov M, Baker J, Phan L, Smigielski EM, Sirotkin K:
dbSNP: the NCBI database of genetic variation. Nucleic Acids Res 2001,
29:308-311.
81. Muller S, Wienberg J: “Bar-coding” primate chromosomes: molecular
cytogenetic screening for the ancestral hominoid karyotype.
Hum Genet
2001, 109:85-94.
82. Myers S, Bottolo L, Freeman C, McVean G, Donnelly P: A fine-scale map of
recombination rates and hotspots across the human genome. Science
2005, 310:321-324.
83. Filzmoser P, Garrett RG, Clemens R: Multivariate outlier detection in
exploration geochemistry. Computers Geosci 2005, 31:579-587.
84. Gschwandtner M, Filzmoser P: mvoutlier: Multivariate outlier detection
based on robust methods. R package version 1.4. 2009 [http://medipe.
psu.ac.th/cran-r/web/packages/mvoutlier/index.html].
85. R Development Core Team: R: A language and environment for statistical
computing. Vienna, Austria: R Foundation for Statistical Computing; 2009.
86. Karatzoglou A, Smola A, Hornik K, Zeileis A: kernlab - an S4 package for
kernel methods in R. J Stat Software 2004, 11:1-20[ />v11/i09/paper].
87. Butts CT: yacca: Yet Another Canonical Correlation Analysis Package. R
package version 1.1. 2009 [ />index.html].
doi:10.1186/gb-2011-12-3-r27
Cite this article as: Ananda et al.: A genome-wide view of mutation rate
co-variation using multivariate analyses. Genome Biology 2011 12:R27.
Submit your next manuscript to BioMed Central
and take full advantage of:
• Convenient online submission
• Thorough peer review
• No space constraints or color figure charges
• Immediate publication on acceptance
• Inclusion in PubMed, CAS, Scopus and Google Scholar
• Research which is freely available for redistribution
Submit your manuscript at
www.biomedcentral.com/submit
Ananda et al. Genome Biology 2011, 12:R27
/>Page 18 of 18