Soil Mechanics for Unsaturated Soils phần 5 pptx
Bạn đang xem bản rút gọn của tài liệu. Xem và tải ngay bản đầy đủ của tài liệu tại đây (3.51 MB, 57 trang )
8.3
SOLUTIONS
OF
THE PORE PRESSURE EQUATIONS AND COMPARISONS
21
1
Ngure
8.34
The development
of
pore pressures and pore pressure parameters
for
a more com-
pressible soil. (a) Development
of
pore-air and pore-water pressures;
@)
pore
pressure parame-
ters.
212
8
PORE PRESSURE PARAMETERS
-
rnt
(assumed)=
1.21
x
(l/kPa)
Rs
=
0.7
Re
=
0
1 1 1
1
I
Q1
6
E
0
c
9
1
.o
0.9
0.8
0.7
0.6
0.5
A
-Pore-air pressure measurements from
-Predicted oore-oressure in accordance
Gibbs
(1
963)
with
Hilf's
analisis
1
0.9
0.8
a,
0
E
0.7
-
8
0.6
0.5
-500
-400 -300
-200
-100
0
100
200
300
400
500
Pore pressures, u (kPa)
(a)
60
s
70
C
c
E
3
2
-
80
a
0)
90
O"
100
.~
0
0.1 0.2
0.3
0.4
0.5
0.6
0.7
0.8
0.9
1
Pore pressure parameters
(b)
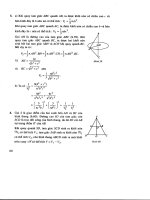
Figure
8.35
Comparison
of
theoretical predictions and laboratory measurements
of
pore-water
pressures under undrained loading conditions. (a) Development
of
pore-air and pore-water pres-
sures;
@)
pore
pressure panmeters.
8.3
SOLUTIONS
OF
THE
PORE
PRESSURE
EQUATIONS
AND
COMPARISONS
213
0
200
400
goo
800
Isotropic
pressure,
(I,
(kPa)
Figure
8.36
Comparison of theoretical computations and laboratory measurements of pore-air
and
pore-water pressures (data from Bishop and Henkel,
1962).
A
comparison of the theoretically computed pore pres-
sures and pore-water pressure measurements (Gibbs, 1963)
is presented in Fig. 8.35. Coefficients of volume change
(i.e.,
mi
and
rnl)
must
be
assumed in order to compute the
tangent
B,
and
B,
pore pressure parameters. The coeffi-
cients
are
also
assumed to be constant during the undrained
loading process. The assumption of constant coefficients
of
volume change may contribute to deviations between the
measured and predicted pore-water pressures. In general,
the soil compressibility will decrease as the total stress in-
creases. The predicted pore-air pressure from
Eq.
(8.83)
is in good agreement with predictions using Hilf
s
analysis
[Le.,
Eq.
(8.65)]. The agreement between Hilfs analysis
and the more rigorous equations is the result of setting the
parameter
R,
(i.e.,
~/rny)
to zero. This assumption means
that the volume change associated with the
air
phase does
not depend on the matric suction change, but only on the
total
stress change. This, in essence, is the assumption in-
volved in Hilfs analysis.
This
agreement may not occur
when the parameter
R,
is not zero.
The tangent
B,
and
B,
parameters increase to unity as
saturation is approached, while the secant
B:
and
BL
pa-
rameters approach a value of 0.7 [Fig.
8.35@)].
The secant
B:
pore
pressure parameter using the marching-forward
Table
8.3
CoefRcients
of
Volume Change used in the Theoretical
Computations
of
Pore Pressures on Test Data Presented by
Bishop and Henkel(1962)
Test
No.
Coefficients of Volume Change
No.
1
u3
c
70
kPa
(#la)
u3
>
70kPa(#lb)
Soil structure,
my
4.0
x
10-~ 2.9
x
10-5
Air phase,
my
2.6
x
2.9
x
10-~
No.
2
u3
c
140 kPa (#2a)
u3
>
140 kPa (#2b)
Soil stmcture,
mf
1.0
x
10-4
2.6
x
10-5
Air phase,
my
8.7
x
10-~ 2.6
x
10-5
214
8
WRE PRESSURE PARAMETERS
700
600
500
-
400
-
2
f
300
;
200
In
Y) Y)
100
0
-100
68
0
2 4
AV
VO
Volume change,-
(%)
(a)
0
100
200 300
400
500 600
Isotropic pressure,
us
(kPa)
(b)
I I I
I
0
100
200 300 400 500 600
(C)
1
501
I
Deviator stress,
(a,
-
as)
(kPa)
Figure
8.37
Pore pressure development during undrained triax-
ial test no.
1.
(a) Stress-strain behavior during an undrained,
triaxial test (from Knodel and Coffey, 1966);
(b)
B,
and
B,
pore
pressure parameters; (c)
D,
and
D,
pore pressure parameters.
technique is slightly different from the secant
BA,,
pore
pressure parameter obtained from Hilf
s
analysis. The dif-
ference could
be
attributed to
the
assumption of zero matric
suction in Hilf
s
analysis.
Measurements of pore-air and pore-water pressures for
600
500
-400
I
300
f
200
100
0
-100
?.!
a
2 4
6
8
AV
Volume change,- VO
(%I
(a)
a
I
1
I
I
100 200 300 400
Isotropic pressure,
US
(kPa)
(b)
-100;
!
I
I
-50!l
100
2;)o 3bo 4k 5bo 6k
Deviator stress,
(a,
-
a,)
(kPa)
(C)
Figure
8.38
Pore pressure development during undrained triax-
ial test no.
2.
(a) Stress-strain behavior during an undrained,
triaxial test
(from
Knodel and Coffey,
1966);
(b)
B,
and
B,,,
pore
pressure parameters;
(c)
D,
and
D,
core pressure parameters.
two unsaturated soils under isotropic, undrained loading
have been presented by Bishop and Henkel(l962) and are
shown in Fig.
8.36.
The theoretical predictions of the pore-
air and pore-water pressures can be made using varying
coefficients of volume change, as outlined in Table
8.3.
As
8.3
SOLUTIONS OF THE PORE PRESSURE EQUATIONS AND COMPARISONS
215
AV
VO
Volume change,-(%)
(a)
Isotropic pressure,
u3
(kPa)
(b)
'-0
100
200
300
400
500
600
Deviator stress,
((11
-
US)
(kPe)
(C)
Figure
8.39
Pore pressure development during undrained triax-
ial test
eo.
3.
(a) Stress-strain behavior during an undrained,
triaxial test (from Knadel and Coffey,
1%);
(b)
B,
and
B,
pore
pressure parameters; (c)
D,
and
D,
pore pressure parameters.
the isotropic pressure is increased, the soil compressibility
is decreased. The results indicate that the theoretical com-
putations better predict the measured pore pressures when
the coefficients of volume change are varied during load-
ing. Evidence indicates that the assessment of the coeffi-
150
1
1
I
I
I
I
22
0
22
0
0
50
100
150 200 250
Net isotropic pressure,
(a,
-
u.)
(kPa)
(a)
0.10
I
I
I
I
0
200
400
800
800
lo00
Net isotropic pressure,
(u3
-
u.)
(kPa)
(b)
Figure
8.40
Experimental results showing the
o
parameters of
two
soils. (a) Development of the
o
parameter for compacted
shale;
(b)
development of the
o
parameter for
a
compacted boul-
der clay. (Bishop,
1961a).
cients of volume change during loading is an important fac-
tor in predicting the pore-water pressures.
8.3.5
Experimental
Results
of
Tangent
B
and
A
Parameters
for
Triaxial
Loading
Undrained, triaxial testing is commonly performed by first
increasing the isotropic pressure of the soil specimen to
a
given minor principal
stress,
4.
The pore pressures devel-
oped during the isotropic pressure increase,
du3,
can
be
written as tangent
B
pore pressure parameters.
The second step in the triaxial test is to increase the ver-
tical stress on the soil specimen to produce a maximum
value for the major principal
stress,
uI
.
The minor principal
stress,
u3,
remains constant. The change in pore pressures
during an increment
of
deviator stress,
d(u,
-
u3),
gives
the tangent
D
pore
pressure parameter.
The
resultant pore-
air and pore-water pressures can be obtained by a super-
position method, as expressed by
Eqs.
(8.107) and (8.101),
respectively.
Figures 8.37-Fig. 8.39 present pore pressure measure-
ments obtained from undrained, triaxial tests performed by
the
U.S.
Department of the Interior Bureau of Reclamation
(U.S.B.R. (1966)). The plotted volume changes
are
ex-
pressed in terms of the initial volume of the soil,
V,.
The
216
8
PORE PRESSURE PARAMETERS
pore pressure parameters computed from the experimental
results are the average tangent
B
or
D
parameters. The re-
sults indicate that the tangent
B
and
D
parameters are a
function of the stress state in the soil and the degree
of
saturation of the soil. In general, the pore pressure param-
eters increase as the total stress on the soil increases.
8.3.6
Experimental Measurements
of
the
a
Parameter
Figure 8.40 presents two sets
of
experiments where the
a
parameter was measured on two compacted soils under
isotropic loading (Bishop, 1961a). The
CY
parameter is the
ratio of the matric suction change,
d(u,
-
uw),
to the net
isotropic pressure change,
d(u3
-
u,).
This is
in
accor-
dance
with
the definition of the
CY
parameter given
in
Eq.
(8.129).
The first test is on a shale compacted at a water content
slightly above optimum water content. The
a
parameter
was initially about 0.6, and decreased as the net isotropic
pressure increased, as shown
in
Fig. 8.40(a). The second
test is on a boulder clay compacted slightly below optimum
water content. The
a
pameter started with a value
of
about
0.1,
and also decreased
with
increasing net isotropic
pressures, as illustrated in Fig. 8.40(b). In other words, the
change
in
matric suction due to a change
in
net isotropic
pressure becomes insignificant at high total stresses or low
matric suctions.
CHAPTER
9
Shear
Strength
Theory
Many geotechnical problems such as bearing capacity, lat-
eral earth pressures, and slope stability are related to the
shear strength of a soil. The shear strength of a soil can be
related to the stress state in the soil. The stress state vari-
ables generally used for an unsaturated soil are the net nor-
mal stress,
(u
-
u,),
and the matric suction,
(u,
-
uw),
as
explained
in
Chapter
3.
This chapter describes how. shear
strength
is
formulated in terms of the stress state variables
and the shear strength parameters. Techniques for measur-
ing the shear strength parameters in the laboratory are out-
lined
in
Chapter 10. The application of the shear strength
equation to different types of geotechnical problems is pre-
sented in Chapter 11.
A
brief historical review of the shear strength theory and
attempts to measure relevant soil properties is given
in
this
chapter prior to formulating the shear strength equation.
The shear strength test results discussed in the review are
selected from the many references on this subject. The se-
lection of research papers for reference is based primarily
upon whether or not the researcher used proper procedures
and techniques for the measurement or control of the pore
pressures during the shearing process. The two commonly
performed shear strength tests are the triaxial test and the
direct shear test. The theory associated with various types
of triaxial tests and direct shear tests for unsaturated soils
are compared and discussed
in
this chapter. Measurement
techniques and related equipment are described in Chapter
10.
A
theoretical model for predicting the strain rate re-
quired for testing unsaturated soils is also presented.
The shear strength equation for an unsaturated soil is pre-
sented, both in analytical and graphical forms. Both forms
of presentations assist
in
visualizing the changes which
oc-
cur when going from unsaturated to saturated conditions
and vice versa. The possibility of nonlinearity in the shear
strength failure envelope is discussed. Various possible
methods for handling the nonlinearity are outlined.
Soil specimens which are “identical” in their initial con-
ditions are required for the determination of the shear
strength parameters in the laboratory. If the strength pa-
rameters
of
an undisturbed soil are to
be
measured, the tests
should
be
performed on specimens with the same geolog-
ical and stress history. On the other hand, if strength pa-
rameters for a compacted soil are being measured, the
specimens should
be
compacted at the same initial water
content and with the same compactive effort. The soil can
then be allowed to equalize under a wide range of applied
stress conditions. It is most impottant to realize that soils
compacted at different water contents, to different densi-
ties, are “different” soils. In addition, the laboratory test
should closely simulate the loading conditions that are
likely to occur in the field. Various stress paths that can be
simulated by the triaxial and the direct shear tests are de-
scribed in Chapters 9 and 10.
9.1
HISTORY
OF
SHEAR
STRENGTH
The shear strength of a
saturated
soil
is
described using the
Mohr-Coulomb failure criterion and the effective stress
concept (Terzaghi, 1936).
(9.1)
where
rff
=
shear stress on the failure plane at
failure
c’
=
effective cohesion, which is the shear
strength intercept when the effective
normal stress is equal to zero
(ar
-
uw)i
=
effective normal stress on the failure
plane at failure
uff
=
total normal stress on the failure
plane at failure
uwf
=
pore-water pressure at failure
9‘
=
effective angle of internal friction.
T~
=
c‘
+
(af
-
tan
4‘
Equation (9.1) defines a line, as illustrated in Fig. 9.1
The line is commonly referred to as a failure envelope.
This envelope represents possible combinations
of
shear
stress and effective normal stress on the failure plane at
failure. The shear and normal stresses in
Eq.
(9.1) are given
217
218
9
SHEAR STRENGTH THEORY
t
Failure envelope:
T~~
=
c‘
+
(ul
-
u,h tan
4’
7
0
Effective normal stress,
(a
-
u,)
Figure
9.1
Mohr-Coulomb failure envelope for a saturated soil.
the subscript
“J”
The
‘7’’
subscript within the brackets
refers to the failure plane, and the
“f”
subscript outside
of the brackets indicates the failure stress condition. One
subscript
‘7’’
is given to the pore-water pressure to indi-
cate the failure condition. The pore-water pressure acts
equally on all planes (i.e., isotropic). The shear stress de-
scribed by the failure envelope indicates the shear strength
of the soil for each effective normal stress. The failure en-
velope is obtained by plotting a line tangent to a series of
Mohr circles representing failure conditions. The slope of
the line gives the effective angle of internal friction,
4’,
and its intercept on the ordinate is called the effective cohe-
sion,
c’.
The direction of the failure plane
in
the soil is
obtained by joining the pole point to the point of tangency
between
the Mohr circle and the failure envelope (see
Chapter
3).
The tangent point on the Mohr circle at failure
represents the stress state on the failure plane at failure.
The use of effective stresses with the Mohr-Coulomb
failure criterion has proven to
be
satisfactory
in
engineer-
ing practice associated with saturated soils. Similar
at-
tempts have been made to find a single-valued effective
stress variable for unsaturated soils, as explained
in
Chap-
ter
3.
If this were possible, a similar shear strength equa-
tion could be proposed for unsaturated soils. However,
in-
creasing evidence supports the use of two independent
stress state variables to define the stress state for an unsat-
urated soil, and consequently the shear strength (Matyas
and Radhakrishna,
1968,
Fredlund and Morgenstern,
1977).
Numerous shear strength tests and other related studies
on unsaturated soils have been conducted during the past
30
years. This section presents a review
of
studies related
to the shear strength of unsaturated soils. Similar to satu-
rated soils, the shear strength testing of unsaturated soils
can
be
viewed
in
two
stages. The first stage is prior to
shearing, where the soils can be consolidated to
a
specific
set of stresses or left unconsolidated. The second stage in-
volves the control of drainage during the shearing process.
The pore-air and pore-water phases can
be
independently
maintained as undrained or drained during shear.
In the drained condition, the pore fluid is allowed to
completely drain from the specimen. The desire is that there
be
no excess pore pressure built up during shear. In other
words, the pore pressure is externally
controlled
at a con-
stant value during shear. In the undrained condition, no
drainage
of
pore fluid is allowed, and changing pore pres-
sures during shear
may
or may not
be
measured. It is im-
portant, however, to measure or control the pore-air and
pore-water pressures when it is necessary to know the net
normal stress and the matric suction at failure. The stress
state variables at failure must
be
known in order
to
assess
the shear strength of the soil
in
a fundamental manner.
Many shear strength tests on unsaturated soils have been
performed without either controlling or measuring the pore-
air and pore-water pressures during shear. In some cases,
the matric suction of the soil has
been
measured at the be-
ginning of the test. These results serve only as an indicator
of the soil shear strength since the actual stresses at failure
are unknown.
A
high air entry disk with an appropriate air entry value
should
be
used when measuring pore-water pressures in an
unsaturated soil. The absence of a high air entry disk will
limit the possible measurement of the difference between
the
pore-air and pore-water pressure to a fraction of an
atmosphere. The interpretation of the results from shear
strength tests on unsaturated soils becomes ambiguous
when the stress state variables at failure are not known.
The following literature review is grouped into two cate-
gories. The first category is a review of shear strength tests
where there has been adequate control or measurement
of
the pore-air and pore-water pressures. The second cate-
gory is a review of shear strength tests on unsaturated soils
where there has been inadequate control or measmment
of pore pressures during shear.
9.1
HISTORY
OF
SHEAR STRENGTH
219
The concept of "strain" is used in presenting triaxial test
results in the form of
stress
versus strain curves. Stress and
strain concepts are discussed in detail in Chapters 3 and
12, respectively.
Normal
strain is defined
as
the ratio of
the change in length to the original length. When a soil
specimen is subjected to an axial normal stress, the normal
strain in the axial direction can
be
defined
as
follows (Fig.
9.2):
(100) (9.2)
ey
=
axial normal strain in the ydirection ex-
Lo
=
original length of the soil specimen
L
=
final
length of the soil specimen.
A
series of direct shear tests on unsaturated fine sands
and coarse silts were conducted by Donald (1956). The
tests were performed in a modified direct shear box, as
shown in Fig. 9.3(a). The pore-air and pore-water pres-
sures were controlled during shear. The top of the direct
shear box was exposed to the atmosphere in order to main-
tain the pore-air pressure,
u,,
at atmospheric pressure,
101.3 kPa (i.e., zero gauge pressure). The pore-water
pressure,
u,,
was
controlled at a negative value by apply-
ing
a
constant negative head to the water phase. The spec-
imen was placed in contact with the water in the base of
the shear box through
use
of
a colloidon membrane. The
water in the base of the shear box was then connected to a
constant head overflow tube at a desired negative gauge
pressure [Fig. 9.3(b)]. The pore-water pressure could be
reduced to approximately
zero
absolute before cavitation
occurred in the measuring system.
The soil specimens were consolidated under a total stress
of
approximately 48 kPa, with a uniform initial density.
The desired negative pore-water pressure was applied for
several hours in order for the specimens to reach equilib-
Lo
-
L
Lo
=
-
where
pressed as a percentage
I""
+
Figure
9.2
Strain concept used in the triaxial test.
A
/Colloidon membranes
II
Sintered bronze1
Plastic tube
(4
To
LTXcuum
I
u
Constant head overflow tube
(b)
Figure
9.3
Modified direct
shear
equipment
for
testing soils un-
der low matric suction. (a) Modified direct
shear
box
with
a col-
loidon membrane;
(b)
system
for
applying a constant negative
pore-water pressure
(from
Donald,
1956).
rium. The specimens were then sheared at a rate of 0.071
mm/s. The results from four types of sand
are
presented
in Fig. 9.4. The shear strength at zero matric suction is the
strength due to the applied total stress.
As
the matric suc-
tion is increased, the shear strength increases
to
a peak
value and then decreases to a fairly constant value.
As
long
as the specimens were saturated, the strengths of the sands
appeared
to
incmse at the
same
rate as for an increrise in
total stress. Once the sands desaturated, the rate of increase
in strength decreased, and in fact, the strength decreased
when the suction was increased beyond some limiting
value.
The
U.S.
Bureau of Reclamation has performed a num-
ber of studies on the shear strength
of
unsaturated,
com-
pacted soils in conjunction with the construction of
earth
fill dams and embankments (Gibbs
et
al.
1960; Knodel and
Coffey, 1966; Gibbs and Coffey, 1969). Undrained triaxial
tests with pore-air and pore-water pressure measurements
were perfarmed. The pore-air pressure,
u,,
was measured
through the use of a
coarse
ceramic disk at one end of the
specimen. The pore-water pressure,
u,,
was
measured
at
the other end of the specimen through the
use
of a
high
air
entry disk. The pore-air and pore-water pressures were
measured during the application of an isotropic pressure,
a3,
and subsequently during the application of the deviator
stress,
(a,
-
u3).
The pore-air pressure measurements
agreed closely with the pore-air pressure predictions using
Hilf
s
analysis (Chapter 8).
220
25
-
20
-
__
-
e
m
Medium
Frankston sand
E
10-
I
r
9
SHEAR STRENGTH THEORY
I
I I
I
I
8-
Ff-f-:
Graded Frankston
sand
-
__
-
~
8
Matric suction,
(u,
-
u,)
(kPaJ
(a)
25
20
f
15
3
:
10
I
-
t
.c
ln
5
0
Matric suction,
(u,
-
u,J
(kPa)
(C)
Figure
9.4
Results
of
direct shear tests on sands under low matric suctions
(modified
from Don-
ald,
1956).
No
attempt was made to relate the measured shear
strength to the matric suction,
(u,
-
u,).
Rather, two sets
of shear strength parameters were obtained by plotting two
Mohr-Coulomb envelopes. The first envelope was tangent
to Mohr circles plotted using
the
(a
-
u,)
stress variables
[i.e.,
Eq.
(9.
l)].
The
second envelope was tangent to Mohr
circles plotted using the
(a
-
u,)
stress variables. Figure
9.5
presents typical plots of two envelopes used to plot the
shear strength data. The
pore
pressure measurements for
undrained triaxial test no.
3
were presented in Chapter
8.
The two failure envelopes indicated that there is a greater
difference in their cohesion intercepts than in their friction
angles.
An extensive research program on unsaturated soils was
conducted at Imperial College, London, in the late
1950's
and early
1960's.
At the Research Conference on the Shear
Strength of Cohesive Soils, Boulder, CO, Bishop
et
al.
(1960)
proposed testing techniques and presented the
re-
sults of five
types
of shear strength tests on unsaturated
soils. The
types
of
tests were:
1)
consolidated drained,
2)
consolidated undrained,
3)
constant water content,
4)
un-
drained, and
5)
unconfined compression tests. These are
P
400r
Specimen
No.
1
v)
$
100
r
200
400
600
800
Stress variable,
(a
-
u.
)
(kPa)
(a)
0
400
:
300
g-
200
c
;
100
0)
c
mo
200
400
600 800
0
Stress variable,
(a
-
u,) (kPa)
(b)
Figure
9.5
Two
procedures used by the
U.S.
Bureau
of
Recla-
mation to plot their shear strength
data.
(a) Failure envelope based
on
the
(a
-
u,,)
stress variables;
@)
failure envelope based
on
the
(a
-
u,,,)
stress
variables (from Gibbs and Coffey,
1969).
9.1
HISTORY
OF
SHEAR STRENGTH
221
stant water content test results on a compacted shale. The
condition when the
[(a,
-
u3)/(u3
-
uW)lfratio reached a
maximum value
was
considered to be the failure condition.
In 1961, Bishop and Donald introduced a device called
a “bubble pump” to remove and measure the air that dif-
fused through the high air entry disk and that was released
as free air in the triaxial cell base compartment. The work-
ing mechanism
of
the bubble pump
was
explained in Chap-
ter 6.
Pore-air diffusion through the rubber membrane into the
water in the triaxial cell
was
prevented by completely sur-
rounding the membrane (Le., specimen) with mercury
rather than with water. The mults of a consolidated drained
test on an unsaturated loose silt were used to verify the
significance and application of the
(a
-
u,)
and
(u,
-
uw)
stress variables. Laboratory testing techniques and details
of various types of triaxial
tests
were explained and sum-
marized by Bishop and Henkel in 1962.
The
use
of the axis-translation technique in the shear
strength testing of unsaturated soils was examined by
Bishop and Blight (1963).
A
compression test with the net
confinement maintained at zero was conducted on a com-
pacted Selset clay specimen using a stepwise series of axis-
translation pressures. The results show a monotonic shear
stress versus strain relationship as long
as
the matric suc-
tion remains constant during the test.
A
comparison
be-
tween
the shear strengths obtained from similar tests with
and without axis translation
was
also
performed on Taly-
bont clay. The shear stress versus strain
curves
from the
two types of tests agree closely. This experimentally con-
firms the applicability of the axis translation technique for
the laboratory testing of unsaturated soils. In addition, the
ability of the pore-water to withstand absolute tensions
greater than 1 atm (i.e., 101.3 kPa) is confirmed since the
explained in greater detail in Section 9.3. The tests were
performed using a modified triaxial cell. The pore-air and
pore-water pressures were either measured or controlled
during the test.
Bishop (l%lb) gave a discussion on the measurement of
pore
pressures in triaxial tests at the Conference on Pore
Pressure and Suction in Soils in London. Tests confirmed
that pore-water pressures could be measured directly
through a saturated coarse porous ceramic disk sealed onto
the base pedestal below a
soil
specimen. The pore-water
pressure measurements were made by balancing the pres-
sure in the measuring system, with the pore-water pressure
measured using a null indicator to ensure a no-flow con-
dition. This direct measurement, however, was limited to
a gauge pressure range above negative
90
Pa. Bishop and
Eldin (1950) successfully measured pore-water pressures
down to negative
90
kPa in a saturated soil specimen dur-
ing a consolidated undrained test with a carefully deaired
measuring system. Pore-water pressures less than
-
1 atm
can be measured using the axis-translation technique (Hilf,
1956;
see
Chapter 3).
The axis-translation technique translates the highly neg-
ative pore-water pressure to a pressure that can
be
mea-
sud without cavitation of the water in the measuring sys-
tem. In addition, a high air entry disk with an air entry
value greater than the matric suction being measured must
be used in order to prevent the passage of pore-air into the
measuring system.
A
single layer of glass fiber cloth with
a low attraction for water was placed on the top of the
spec-
imen for pore-air pressure measurement or control.
The test results were presented in terms of stress points,
as explained in Chapter 3, and were plotted with respect to
the
((6,
+
a3)/2
-
and
((6,
+
u3)/2
-
stress
variables at failure. Figure 9.6 shows a typical plot of con-
200
[
I
I
I
I
I
I
I
1
a1
-
03
Stresses at max
(
-
03
-
uw
-
*
(constant water content)
Saturated specimens
(consolidated undrained with pore-water pressure measurement)
0
I
I
I
I
I
1
0
50
100
150
200
250
300
350
Figure
9.6
Results of constant water content triaxial tests on
a
shale (clay fraction
22%)
com-
pacted at a water content of
18.6%
(from Bishop
er
ai.,
1960).
222
9
SHEAR STRENGTH THEORY
test results without axis translation yielded essentially the
same shear strength as those with axis translation.
The development of pore-air and pore-water pressures
during undrained tests was also studied by Bishop and
Blight (1963). Typical results of constant water content
tests were presented and discussed. Donald (1963) pre-
sented further results of undrained tests on compacted
Talybont clays with pore-air and pore-water pressure mea-
surements. Pore-air and pore-water pressure changes dur-
ing the compression were found to be a reflection of the
volume change tendencies for the soil. The strain rate of
testing affected the pore-air pressure response more than
the pore-water pressure response. The matric suction of
the soil specimen increased markedly with axial strain.
In 1963, a research program on the engineering behavior
of unsaturated soils was undertaken by the Soil Engineer-
ing Division at the Massachusetts Institute of Technology
(Le., M.I.T.) in Boston. The triaxial apparatus was of the
same design as that used by Bishop and Donald (1961),
with the following exceptions (M.I.T., 1963). The null in-
dicator for measuring pore-water pressure was replaced
with an electrical pressure transducer. The glass fiber cloth
at the top of the soil specimen, for measuring pore-air
pressure, was substituted with a coarse porous disk.
A
se-
ries of consolidated undrained tests with pore pressure
measurements and undrained tests with pore-air pressure
control and pore-water pressure measurements were per-
formed
on
compacted specimens. The specimens were a
mixture of
80%
ground quartz and
20%
kaolin. Some dif-
ficulty was experienced in analyzing the test data using a
single-valued stress variable. In particular, the data showed
considerable scatter, and indicated that an increase
in
ma-
tric suction produced a slight decrease in shear strength. In
general, the data appeared to be quite inconclusive.
Blight (1967) reported the results of several consolidated
drained tests performed on unsaturated soil specimens.
All
specimens were compacted at a water content of 16.5%
using the standard AASHTO compactive effort. The spec-
imens were then brought to equilibrium at three matric suc-
tion values
in
a triaxial cell. Two specimens, subjected to
a constant matric suction, were tested using two net con-
fining pressures,
(uj
-
u,)
(Le., 13.8 and 27.6 kPa). The
deviator stress versus strain curves obtained from these tests
are shown in Fig. 9.7(a). The results indicate an increase
in
shear strength with increasing matric suction, and also
with an increasing net confining pressure. The water vol-
ume changes and overall specimen volume changes during
compression are presented in Fig. 9.7(b) and (c), respec-
tively, for the specimens sheared under a constant matric
suction of 137.9 kPa. Although pore-water was expelled
from
the
specimen during shear, the overall volume of the
specimen increased. In other words, the specimens dilated
during compression.
The shear strength
of
two unsaturated, compacted soils
from India, namely, Delhi
silt
and Dhanauri clay, were
o
n
v
(a,
-
ua)
=
27:6
kPa
I
I
I I I
0123456
Axial strain,
ev
(%I
i
(a)
0123456
Axial strain,
ev
(%)
(b)
5
4
-0.5
0123456
(C)
Axial strain,
ty
(%I
Figure
9.7
Consolidated drained tests on an unsaturated silt. (a)
Typical deviator stress versus strain curves;
(b)
water volume
change versus strain relations; (c) specimen volume change ver-
sus strain relations (from Blight, 1967).
tested by Satija and Gulhati (1978 and 1979). Consolidated
drained tests were performed with the pore pressures being
maintained in a modified triaxial cell. Constant water con-
tent tests with pore-air pressure control and pore-water
pressure measurement were also performed.
Research on the behavior of unsaturated soils was un-
dertaken at the University of Saskatchewan, Canada, in
the
mid-1970's. In 1977, Fredlund and Morgenstern proposed
the use of
(u
-
u,)
and
(u,
-
u,,,)
as independent stress
state variables. In 1978, a shear strength equation for an
unsaturated soil was proposed, making use
of
these inde-
pendent stress state variable (Fredlund
et
al.
1978). The
shear strength of an unsaturated soil was considered to con-
sist of an effective cohesion,
c',
and independent contri-
butions from the net normal stress,
(u
-
uJ,
and a further
contribution from the matric suction,
(u,
-
u,,,).
The effec-
9.
I
HISTORY
OF
SHEAR STRENGTH
223
tive angle of internal friction,
4',
was associated with the
shear strength contribution from the net normal stress state
variable. Another angle, namely,
4b,
was introduced and
related to the shear strength contribution from the matric
suction stress state variable. Two sets of shear strength test
results from Imperial College and one set of data from
M.I.T. were used in the examination of the proposed shear
strength equation. The test data indicated a failure surface
which was essentially planar. The failure envelope was
viewed as a three-dimensional surface. The three-dimen-
sional plot with
(u
-
u,)
and
(u,
-
u,)
as abscissas can
be
visualized as an extension of the conventional Mohr-Cou-
lomb failure envelope (Fredlund,
1979).
Satija
(1978)
conducted an experimental study on the
shear strength behavior of unsaturated Dhanauri clay. Con-
stant water content and consolidated drained tests were
conducted on compacted specimens for various values of
(u
-
u,)
and
(u,
-
u,)
stresses. The triaxial apparatus was
similar to that used in the M.I.T. research program
(M.I.T.,
1963).
Pore pressures were either controlled or
measured throughout the shear test. The appropriate strain
rate was found to decrease with a decreasing degree of sat-
uration of the soil (Satija and Gulhati,
1979).
The results
were presented as a three-dimensional surface where half
of the deviator stress at failure,
((a,
-
u3)/2},was plotted
with respect to the net minor principal stress at failure,
(us
-
u,),,
and the matric suction at failure,
(u,
-
u,),(Gul-
hati and Satija,
1981).
Some of the data from this program
are reanalyzed and presented in Chapter
10.
A
series of consolidated drained direct shear and triaxial
tests
on
unsaturated Madrid grey clay were reported by
Es-
cario in
1980.
The tests were performed under controlled
matric suction conditions using the axis-translation tech-
nique. A modified shear
box
device, enclosed in a pressure
chamber, was used to apply a controlled air pressure to the
soil specimen. The specimen was placed on a high air entry
disk
in
contact with water at atmospheric pressure. This
arrangement is similar to the pressure plate technique,
where the matric suction is controlled by varying the pore-
air pressure, while
the
pore-water pressure is maintained
constant. Prior to testing, the soil specimens were statically
compacted and brought to the desired matric suction under
an applied vertical normal stress. Typical results obtained
from the direct shear tests are presented in Fig.
9.8.
The
failure envelopes exhibit almost a parallel upward transla-
tion, indicating an increase in the shear strength as the soil
matric suction is increased.
The results of triaxial tests by Escario
(1980)
are shown
in
Fig.
9.9
The pore-water pressure was controlled at at-
mospheric conditions through a high air entry disk placed
at the bottom of the soil specimen. An air pressure was
applied to the soil specimen through a coarse porous disk
placed on top of the soil specimen. The specimen was en-
closed in a rubber membrane, and the confining pressure
was applied using water as the medium in the triaxial cell.
Madrid grey clay (statically compacted)
Liquid limit
=
81%
Plasticity index
=
43%
pd
max
=
1360 kg/m3
AASHTo
1
w,,,,,,
=
29%
0
100
200 300 400
500
600 700
Net normal stress,
(U
-
u.) (kPa)
Figure
9.8
Increase in shear strength for Madrid clay
due
to
an
increase
in
matric suction, obtained from direct shear tests (from
Escario,
1980).
The results demonstrated
an
increase in shear strength with
an increase in matric suction.
In
1982,
a series of multistage triaxial tests was per-
formed by
Ho
and Fredlund on unsaturated soils. Undis-
turbed specimens of two residual soils from Hong Kong
were used in the testing program. The soils were
a
decom-
posed rhyolite and a decomposed granite. The program
consisted of consolidated drained tests with
the
pore-air
pressure was controlled from
the
top of the specimen
through a coarse porous
disk.
The pore-water pressure was
controlled from
the
bottom of the specimen using a high
air entry disk sealed onto the base pedestal. The desired
matric suction in the specimen was obtain by controlling
the pore-air and pore-water pressures using
the
axis-trans-
lation technique. The strain rate required
for
shearing an
unsaturated soil was discussed in detail using
a
theoretical
formulation described by
Ho
and Fredlund
(1982~).
The triaxial test results showed essentially a planar fail-
ure envelope when analyzed using the proposed shear
strength equation. Typical two-dimensional projections
of
P
s
h
L
m
5
400
300
200
100
0
I
0
100
200 300
400
500
600 700
Net normal stress,
(u
-
u.) (kPa)
Figure
9.9
Increase
in
shear strength due
to
matric suction for
Madrid clay, obtained from
triaxial
tests
(modified
from
Escario,
1980).
224
9
SHEAR
STRENGTH
THEORY
the failure envelope onto the shear stress,
7,
versus
(u
-
u,)
plane are presented in Fig. 9.10(a). The intersections
between the failure envelope and the ordinate are plotted
in Fig. 9.10(b). For a constant net confining pressure, the
shear strength at failure increased with increasing matric
suctions, as illustrated in Fig. 9.10(a). For a planar failure
envelope, the internal friction angle,
4',
remains essen-
tially constant under saturated and unsaturated conditions.
The effect of matric suction is clearly shown by the
db
angle in Fig. 9.10(b).
Typical
4
angles have been measured for various soils,
and the results have been summarized by Fredlund
(1
985a).
The experimental results showed that the angle
4b
is al-
ways smaller than or equal to the internal friction angle,
4'.
Gan (1986) conducted a multistage direct shear testing
program on an unsaturated glacial till.
A
modified direct
shear
box
that allowed the control of the pore-air and pore-
water pressures was
used
for testing. The shear box was
enclosed in an air pressure chamber in order to control
the
pore-air pressure. The pore-water pressure was controlled
through the base of the specimen using a high air entry
disk. Consolidated drained direct shear tests were per-
m/
34.5 32.5
-
OO
100 200
300
400
Net normal
stress,
(a
-
u,) (kPa)
(a)
I I
I
I
40
80
120
1
60
Matric suction,
(Ua
-
uw) (kPa)
(b)
Figure
9.10
Two-dimensional presentation
of
failure envelope
for decomposed gmnite specimen
No.
22. (a) Failure envelope
projected onto the
7
versus
(u
-
u,)
plane;
(b)
intersection line
between the failure envelope and the
7
versus
(u,
-
u,)
plane
(from
Ho
and Fredlund, 1982a).
formed with matric suction being controlled during shear
(Le., axis-translation technique). Matric suctions ranged
from
0
to 500 kPa, while the net normal stress was main-
tained at approximately 72 kPa. Typical test results are pre-
sented in Fig. 9.11(a), where the shear stress is plotted
with respect to the matric suction axis (Le.,
7
versus
(u,
-
u,)
plane) for a constant net normal stress at failure,
(af
-
u&
The results show some nonlinearity of the failure en-
velope on the shear stress versus matric suction plane. The
4*
angle commences at a value equal to
4'
(Le., 25.5"
when measured under saturated conditions) for low matric
suctions. The
q5b
angle decreases to
7"
at high matric suc-
tion values, as shown in Fig. 9.1 l(b).
The nonlinearity in the shear strength versus matric suc-
tion relationship was also observed by Escario and Shez
(1986). Direct shear tests were performed on three soils,
namely, Madrid grey clay, red clay of Guadalix de la
Sierra, and Madrid clayey sand. The tests were performed
on a modified direct shear
box
using the procedure de-
scribed by Escario (1980).
A
curved relationship between
shear stress and matric suction was obtained as illustrated
in Fig. 9.12(b) for Madrid grey clay. The nonlinearity of
the shear stress versus matric suction relationship has
be-
come more noticeable as soils are being tested over a wider
range of matric suctions.
9.1.1
Data Associated with Incomplete Stress
Variable Measurements
Numerous shear strength tests on unsaturated soils have
been conducted without a knowledge of the pore-air and/
I,!
Ill
01
I'
"
'
"
"
J
0
100
200 300 400 500
Matric suction,
(ua
-
u,) (kPa)
(b)
Figure
9.11
Direct shear test results exhibiting a nonlinear
re-
lationship between
T
versus
(u,
-
uw).
(a) Failure envelope
pro-
jected onto the
T
versus
(u,
-
uw)
plane;
(b)
varying
@
with
respect to matric suction
(from
Gan,
1986).
-
2
5
?!
8
-Y
b
w
L
c
v)
2
-*
h
vi
2
-
L
Io
5
Figure
9.12
600
400
200
800
r
-
-
-
‘A
2&l
4&
6&
Sb
Net normal stress,
(a
-
u,) (kPa)
(a)
800
r
736 kPa
588 kPa
441
kPa
294 kPa
118
kPa
(UI
-
uak
200
J
0
200
400
600 800
lo00
Matric suction, (u,
-
u,) (kPa)
(b)
Direct shear test results for Madrid grey clay, un-
-
der controlled matric suctions. (a) Shear stress Venus
net
confin-
ing pressure relationship for various matric suctions;
(b)
shear
stress versus matric suction relationship (from Escario and
SBez,
1986).
or pore-water pressures at failure. Examples are uncon-
fined compression tests where the initial matric suction of
the specimens was established or measured (Aitchison,
1959; Blight, 1966; Williams and Shaykewich, 1970; Edil
et
al.
1981). Undrained triaxial tests with only pore-water
pressure measurements during shear have also been
per-
formed (Kassiff, 1957).
Consolidated, undrained triaxial tests with only pore-
water pressure measurements during shear have
been
per-
formed by Neves (1971). Neves (1971) used a high air en-
try
disk
in
making the pore-water pressure measurements.
Komomik
et
al.
(1980) carried out consolidated undrained
tests where the initial matric suction of the specimens was
established using osmotic suction equilibrium.
The interpretation of the above tests becomes more
meaningful
in
view of the theory presented later
in
this
chapter. The brevity of the presentation
of
data on tests
where the pore pressures at failure were not measured
should not
be
interpreted as
a
vote against these tests.
Rather, these tests should
be
viewed as “total stress” type
tests that can only be justified on the basis of a simulation
of specific drainage conditions.
9.2
FAILURE ENVELOPE
FOR
UNSATURATED
SOILS
The shear strength envelope is
a
measure of the ability
of the soil to withstand applied shear stresses. The soil will
fail when the applied shear stress exceeds the shear strength
9.2
FAILURE ENVELOPE FOR UNSATURATED
SOILS
225
of the soil. The following discussions deal with several cri-
teria for defining soil failure and present the related math-
ematical expressions.
9:2.1
Failure Criteria
There are numerous laboratory and field methods avail-
able for the measurement of shear strength. In
the
labora-
tory, soil specimens taken from the field can
be
tested
un-
der a range of stress state conditions that
are
likely to
be
encountered in the field. The results can
be
used to define
the shear strength parameters of the soil. The initial con-
ditions of the soil specimens must be essentially identical
in order for the results to produce unique shear strength
parameters
for
the soil. Only specimens
with
the same geo-
logical condition and stress history should be used
to
define
a specific set of shear strength parameten.
Unsaturated soil specimens are sometimes prepared by
compaction. In this case, the soil specimens must be com-
pacted at the same initial water content to produce the same
dry density in order to qualify as an “identical” soil. Spec-
imens compacted at the same water content but at different
dry densities, or vice versa, cannot be considered
as
“iden-
tical” soils, even though their classification properties
the same. Soils with differing density and water content
conditions can yield different shear strength parameters, and
should be considered
as
different soils (Fig. 9.13).
The shear strength test is performed by loading a soil
specimen with increasing applied loads until a condition of
failure is reached. There are several ways to perform the
test,
and
there are several criteria for defining failure. Con-
sider a consolidated drained triaxial compression test where
the pore pressures in the soil specimen are maintained con-
stant [Fig. 9.14(a)]. The soil specimen is subjected to a
constant matric suction, and is surrounded by a constant
net confining pressure (i.e., the net minor normal stress),
(u3
-
ua).
The specimen
is
failed by increasing the net
axial pressure (Le., the net major normal stress),
(q
-
ua).
The difference between the major and minor normal
I
Low
@=
flocculated
soil
structure lcompactive
b=
dispersed soil structure
jeffon
Water content,
w
Figure
9.13 The particle structure of clay specimens compacted
at
various dry densities and
water
contents (from
Lambe,
1958).
226
9
SHEAR
STRENGTH
THEORY
Constant
(Ua
-
uw)
I_
(at
-
u3)m.x
j
Mohr
circle
?t
failure
Figure
9.14
Consolidated drained
triaxial
compression
test
data.
(a)
Applied stress&
for
a
consolidated
drained
test;
(b)
Mohr
circles illustrating changes
in
the stress states during shear.
stresses, commonly referred to as the deviator stress,
(a,
-
a3),
is a measure of the shear stress developed in the soil
[see
Fig. 9.14(b)].
As
the soil is compressed, the deviator
stress increases gradually until a maximum value is ob-
tained, as illustrated in Fig. 9.14(b). The applied deviator
stress is usually plotted with respect to the axial strain,
e,,,
and the plot is referred to as a “stress versus strain” curve.
Figure 9.15(a) shows two stress versus strain curves for
Dhanauri clay. The tests were performed as consolidated
drained triaxial tests at two different net confining pres-
The maximum deviator stress,
(al
-
u~),,,~~,
is an indi-
cator of the shear strength of the soil, and has been used
as a failure criterion. The net principal stresses correspond-
ing to failure conditions
are
called the net major and net
minor normal stresses at failure (Le.,
(al
-
u&and
(u3
-
u&,
respectively), as indicated in Fig. 9.14(b).
An alternative failure criterion is the principal stress ratio
defined as
(ul
-
U~)~/(U~
-
u,)~)
(Bishop
et
al.
1960).
A
plot of the principal stress ratio versus the axial strain for
an
undrained triaxial test on a compacted shale is illus-
trated, along with the corresponding
stress
versus strain
curve, in Fig. 9.16(a). In an undrained test, the maximum
deviator
stress,
(al
-
a3)max,
and the maximum principal
stress ratio,
(al
-
u3),,,J(u3
-
u,)~,
may not occur at the
sures.
0
4
8
12
16
20
24
Axial strain,
e,,
(%)
6
)
mm
st,
1.6
0
4
8
12
16
20
24
Axial strain,
cy
(96)
(b)
‘
b
4
8
12 16
20 24
Axial strain,
ey
(%)
Figure
9.15
Consolidated
drained
triaxial
test results on
Dhan-
auri
clay.
(a)
Stress versus strain curve;
(b)
water content change
versus strain curve; (c) soil volume change versus
strain
curve
(from
Satija,
1978).
(C)
same axial strain, as illustrated in Fig. 9.16(a). The max-
imum principal stress ratio is a function of the pore-water
pressure measured during the undrained test [Fig. 9.16(b)].
On the other hand, the maximum deviator stress is not a
direct function of the pore pressures. For the results pre-
sented in Fig. 9.16(a),
the
authors selected the maximum
principal stress ratio as the failure criterion since it oc-
curred prior to the maximum deviator stress.
In a drained test, the deviator stress curve has the same
shape as the principal stress ratio curve since the pore pres-
sures are maintained constant throughout the test. In other
words, the denominator of the principal stress ratio,
(a3
-
u,),
is a constant. It is possible that the use of the principal
stress ratio as a failure criterion for unsaturated soils
may
9.2
FAILURE ENVELOPE FOR UNSATURATED
SOILS
227
350
m
g
250
6
E’
150
2
300
6
200
5
100
-
-
m
8
50
P
0
Axial strain,
t,
(%)
(a)
5
10
15 20 25
Axial strain,
ey
(%)
(b)
d
P
0
5
10
15 20 25
Axial strain,
t,
(%)
(C)
-
-1.5
$
Figure
9.16
Undrained triaxial tests on
a
compacted shale. (a)
Stress versus strain curve;
(b)
pore pressures versus strain curve;
(c)
soil
volume change versus strain curve (fmm Bishop
et
al.,
1960).
require further study. It is not clear, for example, whether
the pore-air pressure or the pore-water pressure should
be
used in calculating the principal stress ratio. In addition,
the use of other ratios of the principal stresses may
be
pos-
sible. For example, the ratio
(a,
-
ua)/(u3
-
u,)
or
(al
-
u,,,)/(u3
-
uw)
may also
be
possible as a failure criterion.
The above failure criteria depict some maximum com-
bination
of
stresses that the soil can resist. However, some-
times the stress versus strain curve does not exhibit an ob-
vious maximum point, even at large strains, as shown in
Fig.
9.17.
In this case, an arbitrary strain (e.g.,
12%)
is
selected to represent the failure criterion. The limiting strain
failure criterion is sometimes used when large deforma-
tions are required in order to mobilize the maximum shear
stress. A limiting displacement definition of failure is
sometimes used in direct shear testing.
The above-mentioned failure criteria have been proposed
for the shear strength analysis of unsaturated soils with lim-
ited corroborating evidence. In general, the different fail-
ure criteria produce similar shear strength parameters. Fur-
t
Strain limit
Strain,
t
Figure
9.17
Strain
limit
used
as
a failure criterion.
ther research is needed to establish
the
most appropriate
failure criteria for unsaturated soils.
9.2.2
Shear
Strength
Equation
The shear strength of an
urnarumred
soil can
be
formu-
lated in terms of independent stress state variables
(Fred-
lund
et
ul.
1978).
Any two of the three possible stress state
variables can
be
used for the shear strength equation. The
stress state variables,
(u
-
u,)
and
(u,
-
u,,,),
have been
shown to
be
the most advantageous combination for prac-
tice. Using these stress variables, the shear strength equa-
tion is written
as
follows:
where
c’
=
intercept of the “extended” Mohr-Cou-
lomb failure envelope on the shear
stress
axis where the net normal stress and the
matric suction at failure
are
equal to zero;
it is
also
referred to
as
“effective cohe-
sion”
net normal stress state on the failure plane
at failure
pore-air pressure on the failure plane at
failure
angle of internal friction associated with
the net normal stress state variable,
(af
-
matric suction on the failure plane at fail-
angle indicating
the
rate of increase in
shear stwngth relative to the matric suc-
tion,
(u,
-
uw),.
Ua)f
ure
A comparison of
Eqs.
(9.1)
and
(9.3)
reveals that the
shear strength equation for an unsaturated
soil
is an exten-
sion of the shear strength equation for a saturated
soil.
For
an unsaturated soil, two stress state variables
are
used to
describe! its shear strength, while only one
smss
state vari-
able [Le., effective normal
stress,
(u,
-
u,,,),]
is required
for a saturated soil.
The shear strength equation for an unsaturated soil ex-
hibits a smooth transition to the shear strength equation for
228
9
SHEAR STRENGTH THEORY
a saturated soil.
As
the soil approaches saturation, the pore-
water pressure,
u,,
approaches the pore-air pressure,
u,,
and the matric suction,
(u,
-
u,),
goes to zero. The matric
suction component vanishes, and Eq.
(9.3)
reverts to the
equation for a saturated soil.
9.2.3
Extended Mohr-Coulomb Failure Envelope
The failure envelope for a saturated soil is obtained by
plotting a series of Mohr circles corresponding to failure
conditions on a two-dimensional plot, as shown in Fig.
9.1.
The line tangent to the Mohr circles is called the failure
envelope, as described by
Eq.
(9.1).
In
the case of an
un-
saturated soil, the Mohr circles corresponding to failure
conditions can be plotted in a three-dimensional manner,
as illustrated in Fig.
9.18.
The three-dimensional plot has
the shear stress,
7,
as the ordinate and the two stress state
variables,
(a
-
u,)
and
(u,
-
u,),
as abscissas. The frontal
plane represents a saturated soil where the matric suction
is zero. On the frontal plane, the
(a
-
u,)
axis reverts to
the
(a
-
u,)
axis since the pore-air pressure becomes equal
to the pore-water pressure
at
saturation.
The Mohr circles for an unsaturated soil are plotted with
respect to the net normal stress axis,
(a
-
u,),
in the same
manner as the Mohr circles are plotted for saturated soils
with respect to effective stress axis,
(a
-
u,).
However,
the location of the Mohr circle plot in the third dimension
is a function of the matric suction (Fig.
9.18).
The surface
tangent to the Mohr circles at failure is referred to as the
extended Mohr-Coulomb failure envelope for unsaturated
soils. The extended Mohr-Coulomb failure envelope de-
fines the shear strength of an unsaturated soil. The inter-
section line between the extended Mohr-Coulomb failure
envelope and the frontal plane is the failure envelope for
the saturated condition.
The inclination of the theoretical failure plane is defined
by joining the tangent point on the Mohr circle to the pole
point, as explained in Chapter
3.
The tangent point on the
Mohr circle at failure represents the stress state on the fail-
ure plane at failure.
The extended Mohr-Coulomb failure envelope may be a
planar surface or it may be somewhat curved. The theory
presented in this chapter assumes that the failure envelope
is planar and can be described by
Fq.
(9.3).
A
curved fail-
ure
envelope can also be described by
Eq.
(9.3)
for limited
changes in the stress state variables. Techniques for han-
dling the non-linearity of the failure envelope are described
in Section
9.7.
Figure
9.18
shows a planar failure envelope that inter-
sects the shear stress axis, giving a cohesion intercept,
c’.
The envelope has slope angles of
4’
and
cpb
with respect to
the
(u
-
u,)
and
(u,
-
u,)
axes, respectively. Both angles
are assumed
to
be
constants. The cohesion intercept,
c’,
and the slope angles,
4’
and
db,
are the strength parameters
used to relate the shear strength to the stress state variables.
The shear strength parameters represent many factors which
have been simulated in the test. Some of these factors are
density, void ratio, degree of saturation, mineral compo-
sition, stress history, and strain rate. In other words, these
factors have been combined and expressed mathematically
in the strength parameters.
The mechanical behavior of an unsaturated soil is af-
fected differently by changes in net nod stress than by
changes in matric suction (Jennings and Burland,
1962).
The increase in shear strength due to an increase in net
normal stress is characterized by the friction angle,
4’.
On
the other hand, the increase in shear strength caused by an
increase in matric suction is described by the angle,
db.
The
value
of
4b
is consistently equal to or less than
4
‘,
as
indicated in Table
9.1,
for soils from various geographic
locations.
0
Net
normal
stress,
(a
-
u.)
Figure
9.18
Extended Mohr-Coulomb
failure
envelope
for
unsaturated
soils.
9.2
FAILURE ENVELOPE
FOR
UNSATURATED
SOILS
229
Table
9.1
Experimental
Values
of
r$b
C’
4’
4b
Soil Type (Pa) (degrees) (degrees) Test Procedure Reference
Compacted shale;
w
=
18.6%
Boulder clay;
w
=
11.6%
Dhanauri clay;
w
=
22.296,
Pd
Dhanauri clay;
w
=
22.2%,
Pd
=
1580
kg/m3
=
1478
kg/m3
=
1580
kg/m3
=
1478
kg/m3
Dhanauri Clay;
W
22.256,
pd
DhWuri Clay;
W
=
22.2%,
Pd
Madrid grey clay;
w
=
29%,
Undisturbed decomposed granite;
Undisturbed decomposed rhyolite;
Tappen-Notch Hill silt;
w
=
21.596,
Compacted glacial till;
w
=
12.2%,
Hong Kong
Hong Kong
Pd
=
1590
kg/m3
Pd
=
1810
kg/m3
15.8
9.6
37.3
20.3
15.5
11.3
23.7
28.9
7.4
0.0
10
24.8
27.3
28.5
29.0
28.5
29.0
223
33.4
35.3
35.0
25.3
18.1
21.7
16.2
12.6
22.6
16.5
16.1
15.3
13.8
16.0
7-25.5
Constant water content
Constant water content
Consolidated drained triaxial
tnaxial
triaxial
Constant drained triaxial
Consolidated water content
triaxial
Constant water content
triaxial
Consolidated drained direct
shear
Consolidated drained
multistage triaxial
Consolidated drained
multistage triaxial
Consolidated drained
multistage triaxial
Consolidated drained
multistage direct shear
Bishop
et
al.
(1960)
Bishop
et
al.
(1960)
Satija,
(1978)
Satija,
(1978)
Satija,
(1978)
Satija,
(1978)
Escario
(1980)
Ho
and Fredlund
(1982a)
Ho
and Fredlund
(
1982a)
Krahn
et
al.
(
1989)
Gan
et
ai.
(1988)
“Average value.
The failure envelope intersects the shear stress versus
matric suction plane along a line of intercepts, as illustrated
in Fig.
9.19.
The line of intercepts indicates an increase in
strength as matric suction increases. In other words, the
shear strength increase with respect to an increase in matric
suction is defined by the angle,
r$b.
The equation for the
line
of
intercepts is as follows:
(9.4)
c
=
intercept of the extended Mohr-Coulomb failure
envelope with the shear stress axis at a specific ma-
c
=
c’
+
(u,
-
u,),tan
r$b
where
c
c
=
c’
+
(u.
-
u,h tan db
c
c
=
c’
+
(u.
-
u,h tan db
e
c)
L
m
(ua
-
uwh4
u.
-
UA-4
(u.
-
uwk3 ~
Matric suction,
(us
-
uw)
E=-
Figure
9.19
Line
of
intercepts along the failure plane on the
7
versus
(u.
-
uw)
plane.
230
9
SHEAR STRENGTH THEORY
tric suction,
(u,
-
u,)~,
and zero net normal stress;
it
can
be
referred to as the "total cohesion inter-
cept.
"
The extended Mohr-Coulomb failure envelope can be
presented as a horizontal projection onto the
7
versus
(a
-
u,)
plane. The horizontal projection can be made for var-
ious matric suction values,
(u,
-
u,)~.
The horizontal pro-
jection of the failure envelope onto the
T
versus
(a
-
u,)
plane results in a series of contours shown in Fig. 9.20(a).
The lines have different cohesion intercepts, depending
upon their corresponding matric suctions. The cohesion in-
tercept becomes the effective cohesion,
c',
when the matric
suction goes to zero. All lines of equal matric suction have
the same slope angle,
4',
as long as the failure plane is
planar. The equation for these contour lines can
be
written
as
(9.5)
T~~
=
c
+
(a-
-
u,),
tan
4'
where
c
=
total cohesion intercept.
Substituting
Eq.
(9.4) into
Eq.
(9.5) yields the equation
for the extended Mohr-Coulomb failure envelope [i.e.,
Eq.
(9.3)]. Equation (9.5) is the same as Eq. (9.3), and Fig.
9.20(b) is a two-dimensional representation of the ex-
tended Mohr-Coulomb failure envelope. The failure en-
velope projection illustrates the increase
in
shear strength
as matric suction is increased at a specific net normal stress.
The projected failure envelope is a simple, descriptive rep-
resentation of the three-dimensional failure envelope,
Equation (9.5) is also convenient to use when performing
analytical studies involving unsaturated soils.
The inclusion of matric suction in the definition of the
cohesion intercept does not necessarily suggest that matric
suction is a cohesion component of shear strength. Rather,
the matric suction component (i.e.,
(u,
-
u,)
tan
#b)
is
lumped with effective cohesion,
c',
for the purpose of
translating the three-dimensional failure envelope onto a
two-dimensional representative plot. The suction compo-
nent of shear strength has also been called the apparent or
total cohesion (Taylor, 1948).
A
smooth transition from the unsaturated to the saturated
condition can
be
demonstrated using the extended Mohr-
Coulomb failure envelope shown in Fig. 9.18.
As
the soil
becomes saturated, the matric suction goes to zero and the
pore-water pressure approaches the pore-air pressure.
As
a result, the three-dimensional failure envelope is reduced
to the two-dimensional envelope of
7
versus
(a
-
u,).
The
smooth transition can
also
be
observed
in
Fig. 9.20(b).
As
the matric suction decreases, the failure envelope projec-
tion gradually lowers, approaching the failure envelope
for
the saturated condition, In this case, the cohesion intercept,
c,
approaches the effective cohesion,
c'.
The extended Mohr-Coulomb failure envelope can also
be projected horizontally onto the
T
versus
(u,
-
u,)
plane
(Fig. 9.21). The horizontal projection is made for various
net normal stresses at failure,
(af
-
u,)-[Fig. 9.21(a)]. The
resulting contour lines have
an
ordinate intercept of
(c'
+
(a-
-
u.),
tan
4')
and a slope angle of
4ib
[Fig. 9.21(b)].
The horizontal projection shows that there is an increase
in
shear strength as the net normal stress is increased at a spe-
cific matric suction.
9.2.4
Use
of
(a
-
u,)
and
(u,
-
u,)
to Define Shear
Strength
The shear strength equation [Le.,
Eq.
(9.3)] has thus far
been
expressed using the
(a
-
u,)
and
(u,
-
u,)
stress state
variables. The shear strength equation for an unsaturated
soil can also
be
expressed in terms of other combinations
of stress state variables, such as
(a
-
uw)
and
(u,
-
u,):
7,
=
c'
+
(a,
-
u,),tan
4'
+
(u,
-
u,),tan
4"
(9.6)
net normal stress state with respect to the
pore-water pressure on the failure plane at
failure
friction angle associated with the matric
suction stress state variable,
(u,
-
uW)-,
when using the
(a
-
u,)
and
(u,
-
u,)
stress state variables in formulating the
shear strength equation.
As
the matric suction goes to zero, the third terms
in
Eqs. (9.6) and (9.3) disappear, and the pore-water pres-
sure approaches the pore-air pressure.
As
a result, both
equations revert to the shear strength equation for a satu-
rated soil [Le., Eq. (9.1)]. Therefore, the second term in
both equations should have the same friction angle param-
eter,
4'
(i.e.,
(af
-
u&tan
4'
and
(a,
-
u,),tan
4').
Equations (9.6) and (9.3) give the same shear strength
for a soil at a specific stress state.
As
a result, Eq. (9.6)
can
be
equated to
Eq.
(9.3):
(9.7)
-uaf
tan
4'
+
(u,
-
uw)f
tan
4b
=
-uwftan
4'
+
(u,
-
u,),tan
4".
Rearranging
Eq.
(9.7) gives the relationship between the
(9.8)
Equation
(9.8)
shows that the friction angle
6"
will gen-
erally be negative since the magnitude of
qjb
is less than or
equal to
4'.
Figure 9.22 displays the extended Mohr-Cou-
lomb failure envelope when failure conditions are plotted
with respect to the
(a
-
u,)
and
(u,
-
u,)
stress state
variables [Le., Eq. (9.6)J and with respect to the
(a
-
u,)
and
(u,
-
u,)
stress state variables [i.e., Eq. (9.3)].
friction angles:
tan
4"
=
tan
4b
-
tan
4'.
9.2
FAILURE ENVELOPE FOR UNSATURATED
SOILS
231
T~~
=
c
+
(UI
-
u.h
tan
4’
or
0
Net
normal
stress.
(u
-
u.)
(b)
Figure
9.20
Horizontal projection
of
the failure envelope
onto
the
T
versus
(u
-
u,)
plane,
viewed parallel
to
the
(u,
-
u,)
axis. (a) Failure envelope projections onto the
7
versus
(a
-
u,)
plane;
(b)
contour lines of the failure envelope onto the
7
versus
(a
-
u,)
plane.
9.2.5
Mohr-Coulomb and Stress Point Envelopes
The extended Mohr-Coulomb envelope has
been
defined
as a surface tangent to the Mohr circles at failure. Each
Mohr circle
is
constructed using the net minor and net ma-
jor
principal stresses at failure [i.e.,
(ay
-
UQ
and
(alf
-
usf)],
as shown in Fig.
9.23(b).
The difference between the
net minor and net major principal stress at failure is called
the maximum deviator stress.
The top point
of
a Mohr circle with coordinates
(pf,
qf,
rr)
can be used as to represent the stress conditions at fail-
ure.
A
detailed discussion on stress points and stress paths
is
given in Chapter
3.
A
stress point surface (Le., stress
point envelope) can
be
drawn through the stress points at
failure [Fig.
9.23@)].
The stress point envelope
is
another
representation of the stress state
of
the
soil
under failure
conditions, However, the stress point envelope and the ex-
tended Mohr-Coulomb failure envelope are different sur-
faces. Nevertheless, the stress point envelope can
be
used
to represent the stress state at failure.
232
9
SHEAR STRENGTH THEORY
0
Matric suction,
(u.
-
u,)
(b)
Figure
9.21
Horizontal projections of the failure envelope onto the
7
versus
(u,
-
u,)
plane,
viewed parallel to the
(u
-
u,)
axis.
(a)
Failure envelope projections onto the
7
versus
(u,
-
u,)
plane;
(b)
contour lines
of
failure envelope on the
7
versus
(II,
-
u,)
plane.
The stress point envelope can
be
defined by the following
equation
:
qf
=
d‘
+
pf
tan
$’
+
rf
tan
qb
(9.9)
where
qf
=
half of the deviator stress at failure (i.e.,
(a,
-
aIf
=
major principal stress at failure
a3f
=
minor principal stress at failure
d’
=
intercept of the stress point envelope
on
the
q
axis
when
pf
and
rf
are equal to zero
@3),/
2)
pf
=
((u,
+
a3)/2
-
u,)f;
mean net normal stress at
JI’
=
slope angle
of
the stress point envelope with
re-
rf
=
matric suction at failure [i.e.,
(u,
-
u&]
failure
spect to the stress variable,
pf
I,P
=
slope angle of the stress point envelope with re-
Figure 9.23(b) presents a planar stress point envelope
corresponding to the planar extended Mohr-Coulomb fail-
ure envelope shown in Fig. 9.23(a). Equation (9.9) defines
the stress point envelope. The frontal plane in Fig. 9.23(b)
spect to the stress variable,
rf
9.2
FAILURE ENVELOPE FOR UNSATURATED
SOILS
233
The ordinate intercept of the stress point envelope on the
q
versus
r
plane is equal
to
d'
when
rf
is zero. The ordinate
intercept is
equal
to
d
[Le.,
Eq.
(9. lo)] when rfis not
zero.
The above variables,
d',
#',
and
#',
are the required pa-
rameters for
Eq.
(9.9). The stress point envelope can also
be represented by contour lines when the surface is pro-
jected onto the
q
versus
p
plane. The equation for the con-
tour lines
is
obtained by substituting
Eq.
(9.10) into
Eq.
(9.9):
q/
d
+
p/tan
#'.
(9.11)
The stress point envelope can be related to the extended
Mohr-Coulomb failure envelope by obtaining the relation-
ships between the parameten
used
to define both envelopes
(i.e., e,
6',
+6
and
d,
#',
@).
Figure 9.24 presents Mohr
circles on the
T
versus
(a
-
uJ
plane for a specific matric
suction. The extended Mohr-Coulomb failure envelope is
drawn tangent to the Mohr circles (e.g., at point
A),
whereas the stress point envelope passes through the top
points of the Mohr circles (e.g., through points
B).
The
extended Mohr-Coulomb failure envelope and the stress
point envelope have slope angles of
6'
and
#',
respec-
tively,
with
respect to the
(a
-
u,)
axis. The distance
be-
tween the tangent point
A
and the top point
B
(Le.,
AB)
can
be
computed
from
triangle
ALX
as Wing equal
to
(qf
sin
6').
As the Mohr circle moves to the left, the radius,
qf,
decreases and eventually goes to
zero.
As a result, the
distance between the tangent and the top points (Le.,
qf
sin
6')
also decreases and eventually goes to
zero.
This
means
that the extended Mohr-Coulomb failure envelope and the
stress point envelope converge to a point on the
(a
-
uo)
axis (i.e., point
2').
The relationship between the slope angles,
6'
and
#',
is
obtained by equating the lengths,
E,
computed from
Ui-
angles
TBC
and
TAC
as
follows:
Y
-
Net normal stress,
(a
-
u,)
(a)
v=
16.8
+
(u,
-
u.
h
tan
24.8O
+
(u.
-
u,h
tan
18.1
(kPa)
Net normal stress
(a
-
u,)
(
b)
Figure
9.22
Extended Mohr-Coulomb failure envelope plotted
with respect to two possible combinations of stress state variables
(a) Failure envelope defined in terms
of
the
(a
-
u,)
and
(u,
-
u,)
stms
state variables;
(b)
failure envelope defined in
terms of the
(u
-
u.)
and
(u,,
-
u,)
stms
state variables (data
from
Bishop
et
al.,
1960).
represents the saturated condition where the matric suction
is zero. As a result, the
((al
+
u3)/2
-
u,)
axis reverts to
the
((al
+
u3)/2
-
u,)
axis on the frontal plane. The
in-
tersection line between the
stress
point envelope and the
frontal plane is a line commonly referred to as the Kf-line
in
satuntted soil mechanics (Lambe and Whitman, 1979).
The Kf-line passes through the top points of the Mohr cir-
cles for saturated soils at failure. The &line has a slope
angle,
$',
with respect to the
p
axis and an ordinate inter-
cept,
d',
on the
q
axis.
Any
line parallel to the Kf-line on
the planar stress point envelope will have a slope angle,
$',
with respect to the
p
axis. The
stress
point envelope
reverts to the K,-line as the soil becomes saturated or when
matric suction,
r-,
is equal to
zero.
The intersection line between the stress point envelope
and
the
q
versus
r
plane has a slope angle
#6,
with respect
to the
r
axis [Fig. 9.23(b)]. The intersection line indicates
that there is an increase in strength as the matric suction at
failure,
I
increases. The equation for the intersection line
can be wntten as follows:
(9.10)
where
d
=
ordinate intercept of the stress point envelope on
the
q
axis at an
rf
and
pf
value equal to zero.
f'.
d
=
d'
+
rftan$'
(9.12)
The
qf
variable can be cancelled, giving
tan
#'
=
sin
6'.
(9.13)
The relationship between the cohesion intercept,
c,
and
the ordinate intercept,
d,
can be computed by considering
the distance between points Tand
0
(Le.,
To):
d
C
(9.14)
Substituting
Eq.
(9.13) into
E!q.
(9.14) and reamnging
d
=
CCOS~'.
(9.15)
When the matric suction at failure is equal to zero (i.e.,
(9.16)
-=-
tan
*'
tan
4"
E@.
(9.14) yields
the saturated condition),
Eiq.
(9.15) becomes
d'
=
c'
cos
4'.
234
9
SHEARSTRENGTHTHEORY
d
I
-
-
-
-
-
__
.
.
-
. .
.
-
- -
__
-
-
.
-
-
(b)
Figure
9.23
Comparisons of the failure envelope and the corresponding stress point envelope.
(a) Extended Mohr-Coulomb failure envelope;
(b)
stress point envelope.
Figure
9.25
shows the intersection lines of the extended
Mohr-Coulomb failure envelope and the stress point en-
velope on the shear strength versus matric suction plane.
The intersection lines associated with the extended Mohr-
Coulomb failure envelope and the stress point envelope are
defined by Eqs.
(9.4)
and
(9.10),
respectively. The ratio
between the
d
and
c
values is always constant and equal to
cos
#’
[i.e., Eq.
(9.15)]
at various matric suctions.
As
a
result, the difference between the
d
and
c
values is not con-
stant for different matric suctions. In other words, the in-
tersection lines are not parallel, or put another way,
#b
is
not equal to
$b.
Substituting Eqs.
(9.4)
and
(9.10)
into
Eq.
(9.15)
gives the following relationship:
d’
+
rftan
$b
=
c’
cos
4’
+
(u,
-
uJftan
#b
cos
4’.
(9.17)
Equation
(9.17)
can
be
rearranged by substituting
Eq.
9.2
FAILURE ENVELOPE
FOR
UNSATURATED
SOILS
235
c
T
Net normal stress,
(a
-
ua)
I ATBc:
5,
=
(ATACI-~
Figure
9.24
Relationships among the variables
c,
d,
rp’,
and
$I.
(9.16)
for
d’
and substituting
(u,
-
u&
for
rf
in order to
obtain the relationship among
$’,
+’,
and
4’:
tan
$’
=
tan
4’
cos
4’.
(9.18)
The above relationships [Le.,
Eqs.
(9.13),
(9.15), (9.17),
and
(9.
l8)] can
be
used
to define the
stress
point envelope
corresponding to an extended Mohr-Coulomb failure en-
velope
or
vice versa. The extended Mohr-Coulomb failure
envelope can
be
established
by
testing a soil in the satu-
rated and unsaturated conditions. The Mohr-Coulomb fail-
ure envelope for the saturated condition gives the angle of
internal friction,
+‘,
and the effective cohesion,
c’.
Theo-
retically, the cohesion intercept,
c,
can
be
obtained from a
single Mohr circle at a specific matric suction if a planar
failure envelope is assumed. Figure
9.26
illustrates the
constmction of a Mohr cimle at failure with its correspond-
ing
pf
and
qf
values.
A
failure envelope with a slope angle
d
=
c
cos
(6’
tan
llrb
=
tan
4b
cos
4’
d’
=
e’
cos
of
4‘
is drawn tangent to the Mohr circle at point
A.
The
envelope intersects the shear strength axis at point
B
and
the
(u
-
u,)
axis at point
T.
The cohesion intercept,
c,
is
computed from triangle
TBO
(see
Fig.
9.26):
Rearranging
Eq.
(9.19)
gives
(9.19)
(9.20)
The cohesion intercepts,
c,
at various matric suctions can
be
computed using
Eq.
(9.20)
and plotted on the shear
strength versus matric suction plane
(see
Fig.
9.25)
in
or-
der
to
obtain the angle,
+’.
Knowing the strength param-
eters,
c’,
+’,
and
&’,
the parameters
for
the stress point
envelope (i.e.,
d’,
+‘,
and
$9
can
also
be
computed.
Extended Mohr-Coulomb
failure enveloDe
ui
u)
L
Stress point envelope
/
c
=
c’
+
(u.
-
u,h
tan
I
I
d
=
d‘
+
(u.
-
u,h
tan
$hb
I-(ua
-
UW)~
Figure
9.25
Relationship among the
+’,
rpb,
and
$b
angles.
Matric suctlon,
(ua
-
uw)