Báo cáo y học: "Small RNA sequencing reveals miR-642a-3p as a novel adipocyte-specific microRNA and miR-30 as a key regulator of human adipogenesis" ppt
Bạn đang xem bản rút gọn của tài liệu. Xem và tải ngay bản đầy đủ của tài liệu tại đây (2.02 MB, 13 trang )
RESEA R C H Open Access
Small RNA sequencing reveals miR-642a-3p as a
novel adipocyte-specific microRNA and miR-30 as
a key regulator of human adipogenesis
Laure-Emmanuelle Zaragosi
1,2
, Brigitte Wdziekonski
2,3
, Kevin Le Brigand
1,2
, Phi Villageois
2,3
, Bernard Mari
1,2
,
Rainer Waldmann
1,2
, Christian Dani
2,3
and Pascal Barbry
1,2*
Abstract
Background: In severe obesity, as well as in normal development, the growth of adipose tissue is the result of an
increase in adipocyte size and numbers, which is underlain by the stimulation of adipogenic differentiation of
precursor cells. A better knowledge of the pathways that regulate adipogenesis is therefore essential for an
improved understanding of adipose tissue expansion. As microRNAs (miRNAs) have a critical role in many
differentiation processes, our study aimed to identify the role of miRNA-mediated gene silencing in the regulation
of adipogenic differentiation.
Results: We used deep sequencing to identify small RNAs that are differentially expressed during adipogenesis of
adipose tissue-derived stem cells. This approach revealed the un-annotated miR-642a-3p as a highly adipocyte-
specific miRNA. We then focused our study on the miR-30 family, which was also up-regulated during adipogenic
differentiation and for which the role in adipogenesis had not yet been elucidated. Inhibition of the miR-30 family
blocked adipogenesis, whilst over-expression of miR-30a and miR-30d stimulated this process. We additionally
showed that both miR-30a and miR-30d target the transcription factor RUNX2, and stimulate adipogenesis via the
modulation of this major regulator of osteogenesis.
Conclusions: Overall, our data suggest that the miR-30 family plays a central role in adipocyte development.
Moreover, as adipose tissue-derived stem cells can differentiate into either adipocytes or osteoblasts, the down-
regulation of the osteogenesis regulator RUNX2 represents a plausible mechanism by which miR-30 miRNAs may
contribute to adipogenic differentiation of adipose tissue-derived stem cells.
Background
Obesity, by itself or associated with ancillary disorders
such as diabetes and cardiovascular pathologies, repre-
sents a major public health issue in dev eloped countries.
In severe obesity, as well as in normal development, the
growth of adipose tissue is the result of adipocyte hyper-
trophy and hyperplasia. It is now well established that a
pool of multipotent progenitor cells persists in adipose
tissue throughout life and is able to differentiate to give
rise to adipocytes [1-3]. Certain key events controlling
the terminal differentiation of progenitors into adipocytes
have been identified. Transcription factors such as
CCAAT/enhancer-binding proteins (C/EBPs) and peroxi-
some proliferator-activated receptors (PPARs) are known
to play a critical role in this process [4]. However, the
molecular mechanisms controlling the early steps of adi-
pocyte progenitor commitment towards adipocyte differ-
entiation rema in poorly understood. Several lines of
evidence suggest that osteoblasts and adipocytes share
the same precursor cell type. Mesenchymal stem cells
isolated from different tissues can differentiate into both
lineages at a clonal level [2,5,6 ]. A reciprocal and inverse
relationship exists between adipogenesis and osteogenesis
[7-9]. Pathophysiological conditions such as ageing or
osteoporosis, for instance, involve a concomitant
decrease in trab ecular bone volume a nd an increase
in bon e-marrow adipocyte numbers [10]. Moreov er,
* Correspondence:
1
Centre National de la Recherche Scientifique, Institut de Pharmacologie
Moléculaire et Cellulaire, UMR-6097, 660 route des lucioles, Valbonne Sophia-
Antipolis, 06560, France
Full list of author information is available at the end of the article
Zaragosi et al. Genome Biology 2011, 12:R64
/>© 2011 Zaragosi et al.; licensee BioMed Central Ltd. This is an open acces s article di stribut ed under the terms of the Creat ive Commons
Attribution License ( which permits unrestricted use, distribut ion, and reproduction in
any medium, provided the original work is properly cited.
molecular mechanisms that activate differentiation
towards one lineage often inhibit differentiation towards
the opposite fate. Several signaling pathways, including
the bone morphogenetic protein, Wnt, Hedgehog and
insulin-like growth factor pathways, as well as transcrip-
tion factors such a s PPARg and RUNX2 (runt-related
transcription factor 2), have already been shown to mod-
ulate the balance between adipogenesis and osteogenesis
(reviewed in [11]).
MicroRNAs (miRNAs) are a subclass of regulatory,
non-coding RNAs that regulate gene expression at a
post-transcriptional level by affecting mRNA translation
and stability [12]. Up to 30% of human genes could
potentially be regulated by miRNAs [13]. The ability of a
miRNA to interact wit h many targets, together with the
possibility for several miRNAs to share the same target,
represent powerful regulatory mechanisms that tremen-
dously increase the complexityofbiologicalnetworks.
Over the past few years, miRNAs have been shown to
regulate many cellular processes, including adipogenesis
and osteogenesis. miR-103, miR-143, miR-17~92, miR-
21, and miR-204/211 have been reported to promote adi-
pogenesis [14-18], while the miR-27 family inhibits this
process [19]. Similarly, osteogenesis is regulated posi-
tively by miR-29b, and negatively by miR-133, miR-135
and miR-125b [20].
Our present work aims to clarify the role of miRNAs in
the regulation of adipogenesis. We have characte rized
small RNAs that are modulated by adipogenic differentia-
tion in human adipose tissue-derived stem (hMADS) cells
by a deep-sequencing approach. Among the RNA species
we sequenced, mi RNAs were the most abundant class of
annotated small RNAs. However, we also found significant
variations in expression levels of non-annotated small
RNAs during adipogenic differentiation. A current bioin-
formatics challenge in small RNA research is the predic-
tion of RNA targets and how their regulation is integrated
into already existing biological networks. We performed
such a study in the specific context of the miR-30 family,
in order to evaluate the capacities of these miRNAs to reg-
ulate adipogenesis. Our investigations focused on the tran-
scription factor RUNX2, a major regulator of osteogenesis,
which we established as a bona fide target of miR-30a and
miR-30d.
Results
Global analysis of miRNAs by high-throughput
sequencing during adipogenesis of hMADS cells
To identify small RNAs that are differentially expressed
during human adipogenesis, hMADS cells were differen-
tiated into adipocytes in vitro. RNA was extracted from
confluent undifferentiated (day 0) cells and from cells
that were differentiated for 3 or 8 d ays. Differentiation
efficiency was checked by expression profiling of specific
genes, such as those encoding adiponectin and PPARg
(Additional file 1).
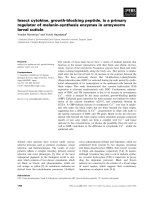
Small RNA libraries were sequenced on an Applied
Biosystems SOLiD sequencer. As shown in Figure 1a, 40
to 45% of the reads that were mapped to the human
genome (release hg19) accounted for miRNAs annotated
in mirBase (release 16). Other sma ll RNA species, such
as piwi-interacting RNAs (piRNAs) and small nucleolar
RNAs (snoRNAs), were also identified but with a lower
abundance. Interestingly, 36. 5 to 42.6% of mapped reads
corresponded to non-annotated small RNAs. The distri-
bution of the different miRNAs was highly heteroge-
neous: just a few miRNAs represented high fractions of
the reads. For instance, in undifferentiated cells, a mong
the 145 mature miRNAs that each represented > 0.03%
of the reads, 131 had a relative abundance that was
below 1% while miR-21 and miR-29a were highly abun-
dant and accounted for 30.2% and 13.8% of miRNA
reads, respectively (Figure 1b). The complete set of
detected mature miRNAs is shown in Additional file 2.
The relative abundance of each miRNA was then com-
pared between di fferen tiated (adipogenesis at day 3 and
day 8) and undifferentiated (confluency) conditions. For
statistical analyses, only miRNAs with a minimum relative
abundance of 0.03% in at least one of the experimental
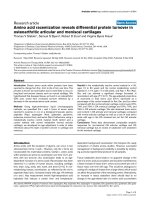
condition were considered. A significant differential expres-
sion was observed for 26 miRNAs, based on a P-value
below 0.05. This defined our top 26 regulated miRNAs, the
expression pattern of which is depicted in Figure 2a and
Table1.Twenty-onemiRNAsfromthetop26wereup-
regulated during differentiation, while five miRNAs were
down-regulated. Thus, differentiation seems to be charac-
terized by a predominant increase in miRNA expression.
The expression patterns of miRNAs that were pre-
viously reported in adipocytes or their precursors are in
agreement with published data, as summarized in Addi-
tional file 3. However, the adipogenesis-dependent regu-
lation of many of the differentially expressed miRNAs
we identified has never been described before; these
include miR-642a-3p, miR-345, miR-193b, miR-29c,
miR-664, miR-10b, miR-136, miR-22*, miR-181a, m iR-
154*, let-7a, let-7b and let-7c.
Up-regulation of miR-642a-3p, miR-378/378* and miR-30
miRNAs suggests their contribution to adipogenesis
The expression profile of the miRNAs that were strongly
up-regulated during adipogenesis (miR-642a-3p, miR-
378, miR-30a, miR-30b, miR-30c, miR-30d, miR-30e, and
miR-193b) was validated by quantitative PCR (qPCR;
Additional file 4). Although some of the fold changes
obtained by this technique were not strictly equal to
those obtained by d eep sequencing, this approach con-
fir med qualitatively the st imulation of the expression for
all of these miRNAs.
Zaragosi et al. Genome Biology 2011, 12:R64
/>Page 2 of 13
miR-642a-3p, with a 7. 32-fold induction during adipo-
genic differentiation, was the most highly and signifi-
cantly (P-value = 4.67.10
-7
) regulated miRNA in o ur
dataset (Table 1 and Figure 2a). Of note, miR-642a-3p is
not annotated in mirBase 16; only miR-642a-5p has been
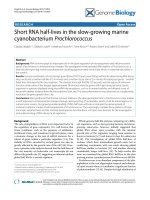
reported before. In our dataset, both miR-642a-5p and
-3p were induced during differentiation, but miR-642a-
3p had a h igher relative a bundance t han miR-642a-5p
(Figure 3). For identification of differentially expressed
miRNAs, only miR-642a-3p reached significance since
the cloning frequency of miR-642a-5p was under the
threshold of 0.03% that we defined. Interestingly, both
miR-642a-3p and miR-642a-5p were undetectable in
undifferentiated hMADS cells, suggesting a high specifi-
city for adipocytes. miR-642a is positioned on chromo-
some 19, in intron 7 of the GIPR (glucose-dependent
insulinotropic polypeptide receptor) gene (Additional file
5). GIPR mRNA and protein were found to be up-regu-
lated during adipocyte differentiation [21]. This is
consistent with an up-regulation of miR-642a, assuming
that miR-642a and GIPR share the same promoter. The
GIPR ligand, GIP, was shown to promote fatty acid
synthesis in adipocytes [22] and to favor obesity in vivo
[23]. Altogether, these data sugg est that miR- 642a mi ght
be linked to adipose tissue development.
Incidentally, miR-378 microRNAs, also highly regulated
in our model, have a genomic location in intron 1 of
PPARGC1B (Additional f ile 5) and miR-378 has already
been described as positiv ely regulated in adipogenesis
(Additional file 3). In addition to miR-378, our data con-
firmed that the miR-30 family was up-regulated in adipo-
genesis (Table 1). Interestingly, the relative abundance of
the miR-30 family varies from 1.1% in undifferentiated
cells to 4.9% in adipocyte-differen tiated cells (Figure 2b).
In particular, miR-30a and miR-30d accounted for 3.7%
of all sequenced miRNAs in adipocyte-differentiated
hMADS cells. Even though non e of the miR-30 family
members are encoded within i ntrons of pro-adipogenic
(a)
(b)
miRNA
piRNA
tRNA
UCSC
snoRNA
other ncRNA
rRNA
0
5
10
15
20
25
30
35
40
45
miR-21
miR-29a
miR-145
miR-125b
miR-23a
miR-24
miR-31
miR-100
let-7a
miR-376c
miR-103
miR-365
miR-193b
miR-29b
miR-199b-5p
miR-574-3p
miR-19b
miR-4286
miR-125a-5p
miR-191
let-7b
miR-99a
miR-23b
miR-221
miR-199a-5p
miR-30d
miR-34a
miR-130a
miR-140-3p
miR-31*
miRNA count distribution
(per 100 miRNA matching reads)
0
10
20
30
40
50
60
70
80
90
ND AD3 AD8
Percentage of matching reads
100
miRNA
(other species)
not-annotated
Figure 1 Distribution of deep-sequenced small RNAs across non-coding RNA categories. (a) Reads were matched versus the hg19 genome
build and then distributed in an exclusive manner to human miRNAs, as well as miRNAs of species other than human (mirBase 16), to UCSC
annotated sequences (UCSC Refflat file) and finally to non-coding RNA classes (fRNAdb, database of ncRNA.org): piwi-interacting RNA (piRNA), tRNA,
rRNA, small nucleolar RNA (snoRNA) and other non-coding RNA (ncRNA). Reads that did not match any of those non-coding RNA classes were
labeled as ‘non-annotated’. Data are the average of read sequencing frequency (percentage) for each experimental condition. ND, undifferentiated
cells; AD3, adipogenesis day 3; AD8, adipogenesis day 8. (b) Relative abundance of reads corresponding to the 30 most expressed miRNAs in
undifferentiated hMADS cells. Read counts are normalized to 10
6
total miRNA reads per sample. Data are the average of sequencing of samples
from two independent experiments, each with two technical replicates with opposite sequencing directions (error bars represent ± standard error).
Zaragosi et al. Genome Biology 2011, 12:R64
/>Page 3 of 13
sites, their increased abundance is likely to reflect a major
role in differentiation.
Gain and loss of function studies reveal that the miR-30
family favors adipogenesis
Given their up-regulation after induction of adipogenesis
and their high abundance in adipocytes, we focused on
the role o f miR-30 family members in adipogenesis. We
altered their expression by transfecting synthetic miR-30
miRNAs or the corresponding antagomirs. Inhibition of
the miR-30 family was achieved with the transfection of a
combination of three oligonucleotides that can target and
inhibit activity of the whole miR-30 family. Over-expres-
sion was obtained with transfection of pre-miRNAs for
miR-30a and miR-30d. In both cases, sub-confluent
hMADS cells were transfected and then submitted to adi-
pogenic differentiation three days later, once cells had
reached confluency. Adipogenesis was scored after
10 days (miRNA knock-down) or 4 days (miRNA over-
expression) in differentiating medium. At each analyzed
(a)
(b)
ND
miR-30
1.1%
Other miRNA
98.9%
AD3
Other miRNA
98.1%
miR-30
1.9%
AD8
miR-30
4.9%
Other miRNA
95.1%
Figure 2 miRNA expression data in differentiated versus undifferentiated human adipose tissue-derived stem cells. (a) Heatmap of the
fold-change (log2 transformed) of miRNA expression in differentiated versus undifferentiated hMADS cells. The top 26 regulated miRNAs are
represented (P-value < 0.05). Two independent experiments are displayed. (b) Relative abundance of the miR-30 family over total detected
miRNAs in undifferentiated and adipocyte-differentiated hMADS cells. Data are the average of sequencing of samples from two independent
experiments, each with two technical replicates with opposite sequencing directions. ND, undifferentiated cells; AD3.1, adipogenesis day 3,
replicate 1; AD3.2, adipogenesis day 3, replicate 2; AD8.1, adipogenesis day 8, replicate 1; AD8.2, adipogenesis day 8, replicate 2.
Zaragosi et al. Genome Biology 2011, 12:R64
/>Page 4 of 13
time point, inactivation and over-expression were effi-
cient, as shown by qPCR (Additional file 6).
Morphological observation and coloration of lipid dro-
plets showed that inactivation of the miR-30 family
impaired adipogenesis and that over-expression of miR-
30a and miR-30d improved adipogenesis (Figure 4a). This
was confirmed by the evaluation of the adipogenic-specific
glycerol-3-phosphate deshydro genase (GPDH) enzymatic
activity. Inactivation of the miR-30 family drastically
reduced GPDH activity at day 10 (fold reduction of 23.9).
Interestingly, over-expression of miR-30a and miR-30d
was sufficient to enhance this activity at day 4 (fold induc-
tion of 1.6; Figure 4b). Finally, we checked for the expres-
sion of the adipogenic-induced transcripts C/EBPb,
PPARg and fatty acid binding protein (FABP) 4. These
genes showed consistent profiles after inactivation of the
miR-30 family and over-expression of miR-30a (Figure 4c).
miR-30 miRNAs stimulate adipogenesis via inhibition of
the osteogenesis transcription factor RUNX2
To identify molecular mechanisms that would regulate
the effects of miR-30 miRNAs on adipogenesis, bioinfor-
matics prediction of their targets was performed with
TargetScan. It revealed that RUNX2 bears several
conserved binding sites for th ese miRNAs (Additional
file 7). RUNX2, also known as CBFA1, is a key regulator
of osteogenesis and its expression is detected a t the
undifferentiated state. It increases during osteogenesis
and decreases during adipogenesis [24] (Additional
file 1).
In order to test whether RUNX2 is targeted by the
miR-30 family, we cloned two regions of its 3’ UTR that
contain the predicted mi R-30 bindin g sites into the pSi-
CHECK™-2 vector, downstream of the Renilla transla-
tional stop codon (Figure 5a,b). The fir st region covers
positions 32 to 332 of the RUNX2 3’ UTR and contains
a poorly vertebrate-conserved putative miR-30 binding
site (positions 229 to 235 of the RUNX2 3’ UTR). The
second region covers positions 3,102 to 3,421 of the
RUNX2 3’ UTR and encompasses two vertebrate-con-
served putative binding sites (positions 3,348 to 3,354
and positions 3,359 to 3,365 of the RUNX2 3’ UTR).
HEK-293T cells were co-transfected with either con-
struct together with the following synthetic pre-miRNAs:
negative control, miR-30a, miR-30d or miR-378 (as
RUNX2 does not bear any putative binding site for this
miRNA, miR-378 was used here as an additional control).
When cells were transfected with pSi-CHECK™-2 bearing
Table 1 Top 26 regulated miRNAs during adipogenesis
log
2
(AD3/ND) log
2
(AD8/ND) P-value AD8/ND Maximal read number across all samples (per million miRNA reads)
hsa-miR-642a-3p
a
3.64 ± 0.04 7.32 ± 0.08 4.67E-07 349
hsa-miR-378 0.72 ± 0.42 4.32 ± 0.11 2.22E-06 8,714
hsa-miR-378* 0.28 ± 0.02 4.24 ± 0.05 9.42E-05 998
hsa-miR-345 1.68 ± 0.10 2.53 ± 0.13 3.76E-04 1,605
hsa-miR-378c 1.49 ± 0.32 4.51 ± 0.49 0.001 698
hsa-miR-193b 0.89 ± 0.10 1.46 ± 0.08 0.005 31,446
hsa-miR-29c 0.43 ± 0.01 2.41 ± 0.2 0.007 26,009
hsa-miR-34b* 4.10 ± 1.34 4.51 ± 1.28 0.007 1,009
hsa-let-7e -0.85 ± 0.02 -1.48 ± 0.03 0.008 1,338
hsa-miR-30c 1.09 ± 0.18 2.49 ± 0.33 0.009 7,848
hsa-miR-664 1.41 ± 0.01 1.98 ± 0.01 0.012 739
hsa-miR-10b 0.56 ± 0.15 1.25 ± 0.31 0.019 3,258
hsa-miR-34a 3.70 ± 0.12 3.73 ± 0.11 0.022 32,529
hsa-miR-30a 1.54 ± 0.18 3.05 ± 0.27 0.022 49,240
hsa-miR-186 0.36 ± 0.03 2.15 ± 0.46 0.023 845
hsa-miR-136 -0.25 ± 0.02 1.53 ± 0.33 0.027 3,083
hsa-miR-30b 0.53 ± 0.42 1.82 ± 0.46 0.027 3,185
hsa-let-7b -0.47 ± 0.18 -1.57 ± 0.60 0.032 13,065
hsa-miR-22* 0.41 ± 0.06 1.27 ± 0.31 0.034 1,281
hsa-miR-30e 0.52 ± 0.13 1.41 ± 0.08 0.037 2,251
hsa-miR-181a 1.66 ± 0.24 2.82 ± 0.64 0.041 5,101
hsa-miR-154* -1.64 ± 0.03 -2.09 ± 0.52 0.043 367
hsa-miR-92a 2.14 ± 0.83 3.14 ± 0.73 0.043 2,885
hsa-let-7c -0.58 ± 0.07 -1.3 ± 0.33 0.044 1,718
hsa-let-7a -0.62 ± 0.07 -1.29 ± 0.29 0.045 19,329
miRNAs were sorted according to decreasing AD8-ND P-value (P < 0.05). AD3, adipogenesis day 3; AD8, adipogenesis day 8; ND, not differentiated.
a
Mature
miRNA is not annotated in mirBase (pre-miR is annotated).
Zaragosi et al. Genome Biology 2011, 12:R64
/>Page 5 of 13
AD3.1
ND.1
AD8.2
AD3.2
ND.2
AD8.1
counts / million
ATCTGAGTTGGGAGGGTCCCTCTCCAAA TGTGTCTTGGGGTGGGGGATCAAGACACATTTGGAGAGGGAACCTCCCAACTCGGCCTCTGCCATCAT TAGACACATTTGGAGAGGGAACGTCCCTCTCCAAATGTGTCT TG
0
70
140
210
280
hsa−mir−642a − chr 19 : 46178186 − 46178282 ( + )
p3p5
350
Figure 3 Abundance of each base along the miR-642a pre-miR. Each experimental condition is pictured using the color code in the insert.
Light grey shading highlights miR-642-5p (bases in orange) and miR-642-3p (bases in blue). Represented samples were sequenced in the 3’ to 5’
direction.
anti-neg anti-miR-30 pre-miR-neg pre-miR-30dpre-miR-30a
miR-30 family inhibition - Adipogenesis D10 miR-30a and miR-30d overexpression - Adipogenesis D4
C/EBP PPAR
FABP4
C/EBP PPAR
FABP4
miR-30 family inhibition
Adipogenesis D10
miR-30a overexpression
Adipogenesis D4
miR-30 family inhibition
Adipogenesis D10
miR-30a and -30d overexpression
Adipogenesis D4
Relative expression
compared to control
0
0.5
1.0
1.5
2.0
**
*
*
(a)
(b) (c)
GPDH activity
(nmol/min/mg protein)
anti-neg
anti-miR-30
anti-neg
a
nti-neg
anti-miR-30
ant
i-
m
i
R
-
30
pre-miR-neg
pre-miR-30a
pre
-miR-30a
pre-miR-neg
pre
-miR-neg
pre-miR-30a
0
10
20
30
40
anti-neg
anti-miR-30
pre-miR-neg
pre-mi
R-
30a
pre-miR-30d
Figure 4 The miR-30 family positively regulates hMADS cell adipocyte differentiation. (a) Sub-confluent hMADS cells were transfected
with one of anti-miR control (anti-neg), anti-miR 30, pre-miR control (pre-miR-neg), pre-miR-30a, or pre-miR-30d and were induced to undergo
adipocyte differentiation 3 days later. Differentiation was assessed at the indicated time points (D4 or D10) by photomicrographic recording (top
row) and Oil red O plus crystal violet counter-staining (lower row). (b) Assessment of adipogenesis by GPDH enzymatic activity. Results are
means of three culture wells (24-well plates). Error bars represent mean ± standard error of the mean (N = 3). *P < 0.05. (c) Expression of
adipogenesis-induced genes (CEBPb, PPARg and FABP4) by qPCR. The level of expression of each gene in control cells (anti-miR-neg or pre-miR-
neg) was taken as 1.
Zaragosi et al. Genome Biology 2011, 12:R64
/>Page 6 of 13
miR-30d binding site 1:
RUNX2 3’-UTR
(pos. 229 to 325)
miR-30d
miR-30d binding site 2:
RUNX2 3’-UTR
(pos. 3348 to 3354)
miR-30d
miR-30d binding site 3 and miR-30a unique binding site:
RUNX2 3’-UTR
(pos. 3359 to 3365)
miR-30d
miR-30a
Renilla
Firefly
T7
promoter
HSV-TK
promoter
RUNX2 3’-UTR
Renilla
Firefly
T7
promoter
HSV-TK
promoter
RUNX2 3’-UTR
(a)
(b)
(c)
0
20
40
60
80
100
120
140
160
180
no miR neg -30a -30d -378
Fold change mir/mir
-neg
0
20
40
60
80
100
120
140
no miR neg -30a -30d -378
Fold change mir/mir-neg
pSi-CHECK2-RUNX2 (reporter 1) pSi-CHECK2-RUNX2 (reporter 2)
pre-miR-30a
pre
-miR-30d
pre
-miR-neg
RUNX2
Tubulin
(d)
n.s. n.s. n.s.
** *
n.s.
Relative intensity 1 0.61 0.48
Reporter 1
Reporter 2
Reporter 2
Reporter 1
0.0
0.2
0.4
0.6
0.8
1.0
1.2
1.4
PPAR
(premiR-30 overexpression)
premiR-30a
premiR-30a
+ TSB neg
(e)
premiR- 30a
+TSB RUNX2
Figure 5 RUNX2 mRNA is a primary target for miR-30a and miR-30d. (a) Predicted interaction between miR -30a and miR-30d and their
putative binding sites in the 3’ UTR of RUNX2. The representation is limited to the region around the miR-30a and miR-30d complementary sites.
In bold is the ‘seed’ region with a conserved anchoring adenosine that is complementary to the first nucleotide of miR-30a and miR-30d
(underlined). (b) Schematic representation of the construct used in the luciferase assay: a 300-bp (reporter 1) and 319-bp (reporter 2) region of
the 3’ UTR of human RUNX2 containing the putative miR-30a and/or miR-30d target sites (black boxes) were cloned into the pSi-CHECK™-2
vector. (c) Normalized luciferase activity 48 hours after co-transfection of human pre-miR-30a, pre-miR-30d, pre-miR-378 or pre-miR-control (neg)
together with pSi-CHECK™-2 constructs in HEK 293 cells. Data were obtained from four independent experiments (error bars represent average
± standard error); n.s., not significant compared to pre-miR-control; *significant compared to pre-miR-control (P < 0.05); **significant compared to
pre-miR-control (P < 0.01). (d) Undifferentiated hMADS cells were transfected with either pre-miR control (pre-miR-neg) or pre-miR-30a or pre-
miR-30d. Four days later, cell lysates were prepared and expression of RUNX2 was investigated by western blotting. Tubulin was used as a
loading control. The integrated density of each band was quantified with Image J. Densities obtained for RUNX2 signals were divided by the
corresponding tubulin densities. Numbers below the blot are the density fold changes compared to the control condition. (e) Undifferentiated
hMADS cells were transfected with control target site blocker (TSB-neg) or with RUNX2 target site blocker (TSB-RUNX2) as well as with pre-miR-
30a. Adipogenic differentiation was evaluated by analyzing adiponectin and PPARg expression by qPCR. The level of expression of each gene in
the pre-miR-30a condition was taken as 1.
Zaragosi et al. Genome Biology 2011, 12:R64
/>Page 7 of 13
the first putative binding site, none of the tested miRNAs
had any effect on luciferase activity. In contrast, with pSi-
CHECK™-2 bearing the last two binding sites, miR-30a
and miR-30d triggered a more than two-fold decrease in
luciferase activity compared to the control miRNA (Figure
5c). As expected, miR-378 had no effect on luciferase
activity. Importantly, this effect was confirmed at the pro-
tein level for endogenous RUNX2. Transfection of sub-
confluent hMADS cells with pre-miR-30a or pre-miR-30d
induced a 0.61-fold or 0.48-fold de crease in RUNX2 pro-
tein levels, respectively (Figure 5d). Thus, these results
demonstrate that RUNX2 is a bona fide target of miR-30a
and miR-30d.
Finally, we sought to establish a direct link between
miR-30 effects on a dipogenesis and RUNX2 targeting.
We used the t arget site blocker (TSB) stra tegy to mask
miR-30 binding sites 2 and 3 in the RUNX2 3’ UTR.
Transfection with RUNX2 miR-30-specific TSB, bu t not
a control TSB, significantly decreased miR-30a stimula-
tion of adipogenesis (Figure 5E). In conclusion, RUNX2
targeting is, at least in part, responsible for miR-30 posi-
tive effects on adipocyte differentiation.
Discussion
Adipocyte differentiation is a complex process combining
several levels of regulation. Signaling pathways, such as
cAMP and insulin signaling pathways, as well as key tran-
scription factors, such as PPARg,C/EBPb and Krüppel-
like transcription factors (KLFs), have been extensively
studied [4,25].
Our results suggest a direct role of miRNA-mediated
post-transcriptional regulation in adipogenesis. In particu-
lar, we show that the miR-30 family is a positive, key regu-
lator o f adipocyte differentiatio n in a human adipo se
tissue-derived stem cell model. The up-regulation of miR-
30 expression is triggered at early stages of adipocyte
differentiation (day 3) and increases until terminal differ-
entiation. Of note, all miR-30 miRNAs do not belong to
the same genomic cluster (Additional file 8). In particular,
miR-30a and miR-30d are encoded by genes located on
distinct chromosomes, suggesting coordinated regulation
of distinct genomic regions. Factors that are responsible
for this coordinated regulation have not yet been
elucidated.
In order to dissect the molecular mechanisms involved
in the effects of miR-30 on adipogenesis, we searched for
predicted target g enes. We focused on RUNX2,whichis
a well-established regulator of osteogenesis. Indeed, an
inverse relationship is known to regulate the balance
between adipogenesis and osteogenes is. Thus, identifying
miRNAs that are up-regulated during adipogenesis and
that negatively regulate a key osteogenesis transcription
factor is of maj or importance. In fact, the RUNX2 path-
way has been reported as a potent inhibitor of the
expression of the master gene for adipogenesis, PPARg
[26]. Thus, it is tempting to speculate that RUNX2 inhi-
bition is required for adipocytedifferentiationandthat
miR-30 miRNAs play a critical role in this process.
We show here for the first time that miR-30 miRNAs
target RUNX2. Huang and co-workers [18] recently
demonstrated that miR-204 and miR-211, which were up-
regulated during adipogenesis of human bone marr ow
stem cells, also target RUNX2. However, we found that
miR-204 and miR-211 were expressed at extremely low
levels - for example, below our 0.03% threshold - while
miR-30 represented 4.9% of the miRNA reads in adipo-
cytes. This is probably not due to a deep sequencing clon-
ing bias, as miR-204 detection was above average and
better than that of miR-30 in a synthetic equimolar
miRNA panel that we sequenced in similar conditions
(data not shown). Thus, in our system, this very low abun-
dance of miR-204 and miR-211 suggests that their impact
on RUNX2 and differentiation is minor when compared
with the highly expressed miR-30 family. Importantly, we
also showed that miR-30 stimulation of adipogenesis was
impaired by masking miR-30 binding sites in the 3’ UTR of
RUNX2, and preliminary data suggest that miR-30 inhibi-
tion might stimulate osteogenesis. Altogether, these data
strongly support a direct and functional link between
RUNX2 and miR-30, but does not exclude the contribution
of additional miR-30 targets. In an attempt to identify the
ones that were regulated at the RNA level, we performed a
transcriptome analysis of hMADS cells that were trans-
fected with pre-miR-30a or pre-miR-30d and then sub-
mitted to adipocyte differentiation for 4 days. Using
miRonTop [27], we verified that predicted miR-30 targets
were correctly enriched in these experiments. Statistical
scores w ere highest for the miR-30 family (P-value =
5.32.10
-10
), showing its strong overall impact in these cells.
In the list of predicted miR-30 targets, we noticed the pre-
sence of CBFB (core binding factor beta), a co-transcription
factor that forms a heterodimer with RUNX proteins [28].
CBFB was down-regulated after over-e xpression of miR-
30a and -miR30d, and slightly up-regulated in the antimiR-
30 condition. Since CBFB was shown to be essential
for functions of RUNX1 and RUNX2 [28], these additional
data may explain the drastic effect of miR-30 on
adipogenesis.
In ad dition to miR-30 miRNAs, w e identified po tent
up-regulation of other miRNA families, such as miR-378
(35.7-fold), during adipogenic differentiation. A role of
decreased miR-378 expression in osteogenesis in the
osteoblastic cell line MC3T3-E1 has been suggested
recently [29]. Indeed, miR-378 appears to target nephro-
nectin, which is a positive regulato r of osteoblastic d if-
ferentiation. V ery recently, Gerin and co-workers [30]
identified miR-378/378* as positive regulators of
lipogenesis.
Zaragosi et al. Genome Biology 2011, 12:R64
/>Page 8 of 13
Although expressed at lower levels than the highly abun-
dant miR-30 fa mily, two members of the miR -642 fam ily
were t he most highly up-regulated miRNA in our adipo-
genesis model. T he function of these miRNAs has not
been reported before. Of interest, in a recent study identi-
fying the association of miR-519b with human obesity,
Martinelli and co-workers [31] also detected that miR-
642a was up-regulated in 19 out of 20 fat depots of obese
subjects. In our data, no reads corresponding to miR-642a
were detected for undifferentiated cells, indicating highly
adipogenic-restricted expression. Amongst both miR-642a
isoforms, only miR-642a-3p wa s above the 0.03% thresh-
old in our model. Yet, until recently (September 2010),
only miR-642a-5p was pre sent in mirBase release 15
(named miR-642 in release 15) and, thus, detectable on
commercial microarrays. The current mirBase release
(release 17) includes two miR-642 entries: miR-642a (miR-
642a-5p), which was detected at one copy in a unique,
hig h-throughput sequencing experiment; and miR-642b,
which is backed by an unknown number of reads.
As shown in Additional file 8, miR-642b is, in fact,
located on the opposite strand to miR-642a. The mature
sequence annotated in mirBase f or miR-642b is the 3p
arm of the pre-miRNA. While we also detected miR-642b,
this sequence was much less (14-fold) abundant than miR-
642a-3p. miR-642a-3p and miR-642b sequences are, in
fact, quite similar and only diverge by one base in their 3’
end. This observation raises doubts about the bona fide
existence of miR-642b. In our dataset, the f ew reads that
were attributed to miR-642b could, in fact, correspond to
miR-642a-3p reads bearing sequencing errors. To support
this hypothesis, we counted the reads attributed to each
miR-642 species within the raw read files. This appr oach
requires conversion of each miRNA sequence into the cor-
responding color-space sequence, and a perfect match
search for these seque nces in the read files. This method
confirmed that miR-642b was detected at very low lev els
compared with miR-642a-3p (Table S4 in Additional file
9). We also verified the quality of miR-642a-3p sequen-
cing. Figure S6 in Additional file 9 shows that the
positions allowing discrimination of miR-642-3p from
miR-642b correspond to high quality values. These values
suggest that the corresponding reads were correctly
assigned to miR-642-3p.
More generally, this raises questions about the quality
of some mirBase annotations . In particular , for miR NAs
with highly tissue-specific expression, such as miR-642a,
the low numbers of reads backing the mirBase entries
might lead to incorrect annotations.
Even though our study focused on miRNAs, we also
noted that 34.2% of reads that were mapped to the refer-
ence genome did not correspond to any annotated small
RNA. Our small RNA cloning strategy only captures
small RNAs that are, as miRNAs , 5’-phospho rylated and,
thus, eliminates RNA degradation products generated by
the major cellular ribonucleases, which generate frag-
ments that are not 5’-phosphorylated.
Some of those un-annotated, small RNAs wer e signifi-
cantly regulated during adipogenesis (not shown). Most of
the regulated sequences are located within the introns of
annotated genes. For instance, we identified an adipocyte-
enriched, 21-bp sequen ce within the fourth intron o f
NCOA2 (nuclear receptor coactivator 2, or transcriptional
intermediary factor 2 (TIF2); Additional file 10). It is note-
worthy that NCOA2 is a ssociated with obesity. In fac t,
TIF2
-/-
mice are resistant to diet-induced obesity and
TIF
-/-
mouse embryonic fibroblasts store lipids with a
much lower efficiency than TIF2
+/+
mouse em bryonic
fibroblasts [32].
Wealsofoundthat2.6to6.3%ofsmallRNAreads
mapped to tRNA sequences. Recently, Lee and co-workers
[33] described a new class of tRNA-derived small RNAs,
termed tRFs, that are not products of random degradation
or biogenesis. In our data, we found abundant reads
matching the 5’ end of mature tRNA (Additional file 10).
No function for this class of small RNA has yet been
suggested.
Conclusions
We iden tified several annotated, but also previously
unknown, small RNAs that are regulated during a dipo-
genesis, suc h as miR-642a-3p. Deep sequencing also
allowed the relative abundance of each miRNA to be esti-
mated, revealing miRNAs that reach relatively high
expression levels and are, thus, potentially relevant in adi-
pogenesis. Amongst the adipogenes is-induced miRNAs,
miR-30 reached the highest levels during differentiation.
We show that this miRNA family plays an important role
in adipogenesis via the targeting of RUNX2, a major reg-
ulator of osteogenesis.
Materials and methods
Cell culture
hMADS cells were obtained from the stroma of human
adipose tissue as described previously [34]. Briefly, we
used the stroma-vascular fraction of white adi pose tissue
from young donors (1 month old to 7 years old). Adipose
tissue was collected, with the informed consent of the par-
ents, as surgical scraps from surgical specimens from var-
ious surgeries, as approved by the Centre Hospitalier
Universitaire Nice Review Board. Approximately 200 mg
of adipose tissue were dissociated with type A collagenase
and the stroma-vascular fraction was separated fr om th e
adipocyte fraction by centrifugation. The crude stroma-
vascular fraction was plated on uncoated culture dishes;
12 hours after plating, non-adherent cells were removed
by a medium change and adherent cells (termed CA by
Rodriguez et al. [34]) were maintained in the proliferation
Zaragosi et al. Genome Biology 2011, 12:R64
/>Page 9 of 13
medium, which is composed of DMEM (low glucose) con-
taining 10% fetal calf serum, 0.01 M HEPES, 100 U/ml
penicillin and streptomycin. The hMADS cell populations
included in this study were isolated from a 4-month-old
(hMADS) male [34]. HEK 293 cells were purchased from
the American Type Culture Collection (Manassas, VA,
USA) and maintained in monolayer culture in DMEM
supplemented with 10% fetal calf serum.
In vitro hMADS cell differentiation
Adipocyte differentiation was induced on the day
hMADS cells reache d confluency. Adipogenic medium
was composed of DMEM/Ham’s F12 media supplemen-
ted with 10 μg/ml transferrin, 0.86 μ Minsulin,0.2nM
triiodothyronine, 1 μM dexamethasone, 100 μM isobu-
tyl-methylxanthine and 1 μM rosiglitazone. Three days
later, the medium was changed (dexamethasone and iso-
butyl-methylxanthine were omitted).
Evaluation of hMADS cell adipocyte differentiation
Neutral lipid accumulation was evaluated by Oil red O
staining, as pre viously described [35]. GPDH activity
was performed in triplicate wells, using the method
described previously [36] (GPDH is an enzyme that is
required for the formation of triglycerides). Expression
of the adipogenes is-induced markers PPARg2, FABP4,
adiponectin and C/EBP b was also evaluated by real-time
qPCR.
RNA extraction
hMADS cells were lysed by addition of TRIZOL reagent
(Invitrogen, Life Technologies Corporation, Carlsbad, CA,
USA) on the cell layers. Total RNAs containing the small
RNA fraction were then purified on a RNeasy kit column
(Qiagen, Valencia, CA, USA) according to t he manufac-
turer’s instructions. Purity and concentration of total RNA
samples were first evaluated using a Nanodrop spectro-
photometer (Thermo Scientific, Waltham, MA, USA).
RNA samples were run in a RNA nano-chip into a 2100
Bioanalyzer System (Agilent Technologies, Santa Clara,
CA, USA) to verify the integrity of the RNA samples.
Gene expression analysis by real-time qPCR and DNA
microarray
RNAs were retro-transcribed with the Mirscript RT kit
(Qiagen). Quantitative PCR was performed using LightCy-
cler
®
480 SYBR Green I Master mix and Light Cycler 480
real-time PCR machine (Roche Applied Science, Indiana-
polis, IN, USA). Expression levels of transcripts were eval-
uated using the comparative CT method (2-deltaCT).
Transcript levels of POLR2A and RPL13 were used for
sample normalization. Results are log2-transformed fold
changes of normalized 2-deltaCT. Data were obtained
from three independent experiments and are represented
as average ± standard error. Primer sequences are detailed
in Additional file 11.
DNA microarrays experiments were performed on
Agilent Sureprint G3 Human GE 8x60K microarrays
according to the manufacturer’ s instructions. The
experimental data and microarray design have been
deposited in the NCBI Gene Expression Omnibus [37]
under series GSE29207.
Small RNA cloning and sequencing
Total RNA containing the small RNA fraction were iso-
lated from hMADS cells as described above. The SOLiD™
Small RNA Expression Kit (Applied Biosystems, Life
Technologies Corporation, Carlsbad, CA, USA) was used
to build a library of double-stranded DNA molecules from
the population of small RNAs present in the different sam-
ples, which were the n read using the App lied Biosystems
SOLiD™ System sequencing according to the manufac-
turer’s instructions. Briefly, to tal RNAs containing the
small RNA fr action were hybri dized (at 65°C fo r 10 min-
utes, then at 16°C for 5 minutes) and ligat ed (at 16 °C for
16 hours) to adapters that are provided by the Small RNA
Expression Kit. Adapt or mix A (AdA) and adaptor mix B
(AdB) w ere used to produce templates for sequencing
small RNAs from the 5’ ends and from the 3’ ends, respec-
tively. As described in the Small RNA Expression Kit, sam-
ples were then reverse transcribed (at 42°C for 30 minutes)
to synthesize cDNA and treated with RNAse H (37°C for
30 minutes). Small RNA libraries were amplified by PCR
(17 cycles) and size selected on 8% polyacrylamide gels.
The 105- to 150-bp material (corresponding to 15- to
50-bp small RNAs) was excised from the gel and eluted in
nuclease-free water (70°C for 3 hours). DNA concentra-
tions of all samples were measured by qPCR.
Libraries were amplified by emulsion PCR and
sequenced on SOLiD according to the manufacturer’s
instructions. Read length was 35 bp. The experimental
data have been deposited in the NCBI Gene Expression
Omnibus under series GSE25715.
Small RNA deep sequencing data analysis
Colo r-sp ace reads were matched against annotated dat a-
bases using the Small RNA Analysis P ipeline Tool v 5.0
(RNA2MAP), provided by Applied Biosystems, using the
following parameters: one color-space mismatch within
the first 18 bases of the reads, called the ‘ seed sequence’
and two color-space mismatches on the following posi-
tions of the reads. First, small RNA reads were matched
against the human genome (hg19), then versus miRBase
release 16 to identify matches with non-human miRNA,
and finally versus non-coding RNA sequences from
fRNAdb, a database of ncRNA.org. For each annotated
miRNA that was sequenced, the number of sequences for
miRNAs was normalized to a to tal of 10
6
miRNA
Zaragosi et al. Genome Biology 2011, 12:R64
/>Page 10 of 13
sequences. The amount of each miRNA was determined
following a linear model. Only miRNAs with at least 300
counts per million in at least one of the experimental con-
ditions were conserved for differential expression analysis.
The significance of the difference between the experimen-
tal and control groups was estimated by an empirical
Bayes method using the limma package from Bioconduc-
tor [38].
Inactivation and over-expression of miRNAs
All transfections were performed with HighPerfect
transfection reagent (Qiagen). For inactivation of
miRNA expression, sub-confluent hMADS cells were
transfected with a combination of three DNA/LNA mix-
mers with a phosphorothioate backbone (Exiqon, Ved-
baek, Denmark), at a final concentration of 40 nM for
each. The sequences of these three DNA/LNA mixmers
were 5’ -CAGTCGGGGATGTTTAC-3’ ,5’ -CAGTC-
GAGGATGTTTAC-3’,and5’-GAGTGTAGGATGTT-
TAC-3’ . The simultaneous use of these three
oligonucleotides successfully inhibited all miRNAs from
the miR-30 family (Exiqon, personal communication;
Additional file 6). The sequence for the mismatch con-
trol oligonucleotide was CAGTCGAAGCTGTTTAC.
For over-expression, sub-confluent hMADS cells were
transfected with Pre-miR™ miRNA precursor molecules
(Ambio n, Life Technologies Corporation, Carlsbad, CA,
USA), at a final concentration of 40 nM. The negative
control was the ‘Pre-miR™ miRNA Precursor Molecules
- Negative Control #1’.
For both over-expression and inhibition studies, hMADS
cells were submitted to adipogenic medium 3 days after
transfection. For the target protection experiment, sub-
confluent hMADS cells were transfected with TSBs, which
are custom designed LNA oligonucleotides with a pho s-
phorothioate backbone (Exiqon); the sequences were 5’-
ACATGAAGTAAACACACA-3’ for miR-30-TSB and 5’-
CAGTCGAAGCTGTTTAC-3’ for TSB-neg (mismatch
control). TSBs were used a t a concentration of 20 nM.
The day after this first transfection, hMADS cells were co-
transfected with miR-30 Pre-miR™ miRNA precursor
molecules (Ambion) at a final concentration of 40 nM,
together with the miR-30-TSB again, or the mismatch
control TSB. hMADS cells were then submitted to adipo-
genic medium the day after the second transfection.
Cloning of RUNX2 3’ UTR in pSi-CHECK™-2
Partial sequences (positions 32 to 332 and positions 3,102
to 3,421) from the 3’ UTR of RUNX2 (ENST00000465038)
were amplified by PCR and cloned at the Xho I and NotI
sites of pSi-CHECK™-2 (Promega, Madison, WI, USA).
Synthetic miRNAs (miR-30a, miR-30d and miR-378) as
well as negative control (miR- Neg) were purchased from
Ambion. HEK 293T cells (20,000 p er well) were reve rse
transfected in 96-well white plates with 100 ng of pSi-
CHECK™-2 plasmid and 5 nmol of synthetic miRNAs
using 1 μl of lipofectamine 2000 (Invitrogen, Life Technol-
ogies Corporation, Carlsbad, CA, USA). The, 48 hours
after transfection, renill a and firefly luciferase activities
were assayed with the Dual Gl o Luciferase Assay System
(Promega) and measured with a luminometer (Lumino s-
kan Ascent, Thermo Scientific, Waltham, MA, USA).
Preparation of cell extracts and western blot analysis
Cells were rinsed with phosphate-buffered saline and solu-
bilized in stop buffer containing 50 mmol/l HEPES, pH
7.2, 150 mmol/l NaCl, 10 mmol/l EDTA, 10 mmol/l
Na
4
P
2
O
7
, 2 mmol/l Na
3
VO
4
, and 1% Triton X-100 supple-
mented with Protease Inhibitor Cocktail (Roche). RUNX2
antibody (MBL, Woburn, MA, USA) was used at a final
concentration of 0.5 ng/μl. Secondary horseradish peroxi-
dase-conjugated antibody was purchased from Promega.
Additional material
Additional file 1: Figure S1. Quantitative RT-PCR of adiponectin
(AdipoQ), PPARG2 and RUNX2 in adipocyte-differentiated (day 8) versus
differentiated hMADS cells. Real-time PCR was performed using
LightCycler
®
® 480 SYBR Green I Master mix and Light Cycler 480 real-
time PCR machine (Roche Applied Science, Indianapolis, IN, USA).
Expression levels of transcripts were evaluated using the comparative CT
method (2-deltaCT). Transcript levels of POLR2A and RPL13 were used for
sample normalization. Results are log2-transformed fold changes of
normalized 2-deltaCT. Data were obtained from three independent
experiments (error bars represent average ± standard error).
Additional file 2: Dataset showing all read count for mature
miRNAs.
Additional file 3: Table S1. Summary of concordant miRNA regulation
across published studies. FC, fold change; AD3, adipogenesis day 3; AD8,
adipogenesis day 8. References are detailed in the references section of
the main manuscript [39-42].
Additional file 4: Figure S2. Quantitative RT-PCR confirmation for eight
selected miRNAs. Data represent the log2 fold-change of expression
between adipocyte-differentiated (day 8) cells versus undifferentiated
hMADS cells. Mature miRNA expression was evaluated using Mirscript
assays (Qiagen SA, Courtaboeuf, France) as specified by the
manufacturer’s protocol. The forward primer for miR-642a-3p was
manually designed (5’-TCGTCGAGACACATTTGGAGAG-3’). Real-time PCR
was performed using LightCycler
®
® 480 SYBR Green I Master mix and
Light Cycler 480 real-time PCR machine (Roche Applied Science).
Expression levels of mature miRNAs were evaluated using comparative
the CT method (2-deltaCT). Transcript levels of POLR2A and RPL13 were
used for sample normalization. Results are log2-transformed fold changes
of normalized 2-deltaCT. Data were obtained from three independent
experiments (error bars represent average ± standard error).
Additional file 5: Figure S3. Genome-browser representation of reads
matching (a) miR-642a and (b) miR-378. For each nucleotide, the
corresponding read count was printed. For each panel, the following
information is represented, from top to bottom: chromosomal location,
genomic coordinates, counts for each sample (on the plus and minus
strand) and transcripts annotations (RefSeq Genes). Read counts
correspond to undifferentiated (ND.1) and day 8 differentiated (AD8.1)
hMADS cells samples. Only counts from the first biological replicate, with
a reading from 3’ to 5’, are represented.
Additional file 6: Figure S4. Quantitative RT-PCR confirmation of
inhibition or over-expression of the miR-30 family. Sub-confluent hMADS
Zaragosi et al. Genome Biology 2011, 12:R64
/>Page 11 of 13
cells were transfected and induced to differentiate as described in
Material and methods, 3 days after transfection. (a) For inhibition of the
miR-30 family, RNA was extracted and analyzed at day 10 of
differentiation. (b) For over-expression of pre-miR30a and pre-miR-30d,
RNA was extracted and analyzed at day 4 of differentiation. Mature
miRNA expression was evaluated using Mirscript assays (Qiagen SA) as
specified by the manufacturer’s protocol. Real-time PCR was performed
using LightCycler
®
® 480 SYBR Green I Master mix and Light Cycler 480
real-time PCR machine (Roche Applied Science). Expression levels of
mature miRNAs were evaluated using the comparative CT method (2-
deltaCT). Transcript levels of POLR2A and TBP were used for sample
normalization. Results are log2-transformed fold changes of normalized
2-deltaCT. Data were obtained from three independent experiments
(error bars represent average ± standard error).
Additional file 7: Figure S5. Screen shot from TargetScan (release 5.1)
showing conserved and poorly conserved miR-30 family putative binding
sites located in the 3’ UTR of human RUNX2.
Additional file 8: Tables S2 and S3. Table S2: miR-30 family identifiers,
genomic coordinates and mature sequences. Grey shading indicates
identical sequences. Table S3: miR-642 family identifiers, genomic
coordinates and mature sequences. Grey shading indicates identical
sequences.
Additional file 9: Table S4 and Figure S6. Table S4: miR-642 raw read
numbers. AD8, adipogenesis day 8. Figure S6: Quality values according to
base position along miR-642-3p reads. Top panel: values for sequencing
from the 5’ to 3’ end. Bottom panel: values for sequencing from the 3’ to
5’ end. Bases that allow discrimination between miR-642-3p and miR-
642b are highlighted in blue and indicated by arrows.
Additional file 10: Figures S7 and S8. Figure S7: genome-browser
representation of reads matching the fourth intron of NCOA2. For each
nucleotide, the corresponding read count was printed. The following
information is represented, from top to bottom: chromosomal location,
genomic coordinates, counts for each sample, transcript annotations
(RefSeq Genes) and non-coding RNA annotations (ncRNA.org). Read
counts correspond to undifferentiated (ND.1 and ND.2), day 3
differentiated (AD3.1 and AD3.2) and day 8 differentiated (AD8.1 and
AD8.2) hMADS cell samples, with sequencing from the 3’ to 5’ end.
Figure S8: genome browser representation of reads matching (a) tRNA32.
LysCTT and (b) tRNA113.AlaTGC. For each nucleotide, the corresponding
read count was printed. For each panel, the following information is
represented, from top to bottom: chromosomal location, genomic
coordinates, counts for each sample, transcript annotations (RefSeq
Genes) and non-coding RNA annotations (ncRNA.org). Read counts
correspond to undifferentiated (ND.1 and ND.2), day 3 differentiated
(AD3.1 and AD3.2) and day 8 differentiated (AD8.1 and AD8.2) hMADS
cell samples, with sequencing from the 3’ to 5’ end.
Additional file 11: Table S5. PCR primer sequences.
Abbreviations
bp: base pair; CBFB: core binding fact or beta; C/EBP: CCAAT/enhancer-
binding protein; DMEM: Dulbecco’s modified Eagle’s medium; FABP4: fatty
acid binding protein 4; GIPR: glucose-dependent insulinotropic polypeptide
receptor; GPDH: glycerol-3-phosphate dehydrogenase; hMADS: human
multipotent adipose-derived stem; miRNA: microRNA; NCOA2: nuclear
receptor coactivator 2; piRNA: piwi-interacting RNA; PPAR: peroxisome
proliferator-activated receptor; qPCR: quantitative polymerase chain reaction;
RUNX2: runt-related transcription factor 2; snoRNA: small nucleolar RNA; TIF2:
transcriptional intermediary factor 2; TSB: target site blocker; UTR:
untranslated region.
Acknowledgements
We acknowledge the excellent support from the Nice Sophia-Antipolis
Functional Genomics Platform and from Niels Frandsen from Exiqon. This
work was supported by CNRS, the Association pour la Recherche sur le
Cancer (ARC post-doctoral Fellowship to LEZ and grant number 4983) and
INCa (PL0079, PB).
Author details
1
Centre National de la Recherche Scientifique, Institut de Pharmacologie
Moléculaire et Cellulaire, UMR-6097, 660 route des lucioles, Valbonne Sophia-
Antipolis, 06560, France.
2
University of Nice Sophia-Antipolis, 28 avenue
Valrose, Nice Cedex 2, 06103, France.
3
Centre National de la Recherche
Scientifique, Institut de Biologie du Développement et Cancer, UMR6543, 28
avenue de Valombrose, Nice cedex 2, 06107, France.
Authors’ contributions
LEZ participated in the conception and design of the study, performed
experiments, analyzed and interpreted data, and drafted the manuscript. BW
performed experiments and collected data. KLB analyzed data, performed
statistical analysis, and reviewed the manuscript. PV performed experiments
and collected data. BM conceived of the study, participated in its design
and coordination and reviewed the manuscript. RW analyzed data and
reviewed the manuscript. CD conceived of the study, participated in its
design and coordination, collected data and reviewed the manuscript. PB
conceived of the study, participated in its design and coordination, collected
data and reviewed the manuscript. All authors read and approved the final
manuscript.
Competing interests
The authors declare that they have no competing interests.
Received: 3 January 2011 Revised: 5 May 2011 Accepted: 18 July 2011
Published: 18 July 2011
References
1. Rodriguez AM, Elabd C, Delteil F, Astier J, Vernochet C, Saint-Marc P,
Guesnet J, Guezennec A, Amri EZ, Dani C: Adipocyte differentiation of
multipotent cells established from human adipose tissue. Biochem
Biophys Res Commun 2004, 315:255-263.
2. Zuk PA, Zhu M, Ashjian P, De Ugarte DA, Huang JI, Mizuno H, Alfonso ZC,
Fraser JK, Benhaim P, Hedrick MH: Human adipose tissue is a source of
multipotent stem cells. Mol Biol Cell 2002, 13:4279-4295.
3. Spalding KL, Arner E, Westermark PO, Bernard S, Buchholz BA, Bergmann O,
Blomqvist L, Hoffstedt J, Naslund E, Britton T, Concha H, Hassan M,
Rydén M, Frisén J, Arner P: Dynamics of fat cell turnover in humans.
Nature 2008, 453:783-787.
4. Rosen ED, Spiegelman BM: Molecular regulation of adipogenesis. Annu
Rev Cell Dev Biol 2000, 16:145-171.
5. Guilak F, Lott KE, Awad HA, Cao Q, Hicok KC, Fermor B, Gimble JM: Clonal
analysis of the differentiation potential of human adipose-derived adult
stem cells. J Cell Physiol 2006, 206:229-237.
6. Muraglia A, Cancedda R, Quarto R: Clonal mesenchymal progenitors from
human bone marrow differentiate in vitro according to a hierarchical
model. J Cell Sci 2000, 113:1161-1166.
7. Ahdjoudj S, Fromigue O, Marie PJ: Plasticity and regulation of human
bone marrow stromal osteoprogenitor cells: potential implication in the
treatment of age-related bone loss. Histol Histopathol 2004, 19:151-157.
8. Pilat MJ, Ensor DS, Bosch JC: Cascade impactor for sizing particulates in
emission sources. Am Ind Hyg Assoc J 1971, 32:508-511.
9. Gimble JM, Robinson CE, Wu X, Kelly KA: The function of adipocytes in
the bone marrow stroma: an update. Bone 1996, 19:421-428.
10. Meunier P, Aaron J, Edouard C, Vignon G: Osteoporosis and the replacement
of cell populations of the marrow by adipose tissue. A quantitative study
of 84 iliac bone biopsies. Clin Orthop Relat Res 1971, 80:147-154.
11. Muruganandan S, Roman AA, Sinal CJ: Adipocyte differentiation of bone
marrow-derived mesenchymal stem cells: cross talk with the
osteoblastogenic program. Cell Mol Life Sci 2009, 66:236-253.
12. Baulcombe D: RNA silencing. Trends Biochem Sci 2005, 30:290-293.
13. Xie X, Lu J, Kulbokas EJ, Golub TR, Mootha V, Lindblad-Toh K, Lander ES,
Kellis M: Systematic discovery of regulatory motifs in human promoters
and 3’ UTRs by comparison of several mammals. Nature 2005,
434:338-345.
14. Xie H, Lim B, Lodish HF:
MicroRNAs induced during adipogenesis that
accelerate fat cell development are downregulated in obesity. Diabetes
2009, 58:1050-1057.
15. Esau C, Kang X, Peralta E, Hanson E, Marcusson EG, Ravichandran LV, Sun Y,
Koo S, Perera RJ, Jain R, Dean NM, Freier SM, Bennett CF, Lollo B, Griffey R:
Zaragosi et al. Genome Biology 2011, 12:R64
/>Page 12 of 13
MicroRNA-143 regulates adipocyte differentiation. J Biol Chem 2004,
279:52361-52365.
16. Wang Q, Li YC, Wang J, Kong J, Qi Y, Quigg RJ, Li X: miR-17-92 cluster
accelerates adipocyte differentiation by negatively regulating tumor-
suppressor Rb2/p130. Proc Natl Acad Sci USA 2008, 105:2889-2894.
17. Kim YJ, Hwang SJ, Bae YC, Jung JS: miR-21 regulates adipogenic
differentiation through the modulation of TGF-beta signaling in
mesenchymal stem cells derived from human adipose tissue. Stem Cells
2009, 27:3093-3102.
18. Huang J, Zhao L, Xing L, Chen D: MicroRNA-204 regulates Runx2 protein
expression and mesenchymal progenitor cell differentiation. Stem Cells
2010, 28:357-364.
19. Lin Q, Gao Z, Alarcon RM, Ye J, Yun Z: A role of miR-27 in the regulation
of adipogenesis. FEBS J 2009, 276:2348-2358.
20. Li Z, Hassan MQ, Jafferji M, Garzon R, Croce CM, van Wijnen AJ, Stein JL,
Stein GS, Lian JB: Biological functions of miR-29b contribute to positive
regulation of osteoblast differentiation. J Biol Chem 2009,
284:15676-15684.
21. Weaver RE, Donnelly D, Wabitsch M, Grant PJ, Balmforth AJ: Functional
expression of glucose-dependent insulinotropic polypeptide receptors is
coupled to differentiation in a human adipocyte model. Int J Obes (Lond)
2008, 32:1705-1711.
22. Hauner H, Glatting G, Kaminska D, Pfeiffer EF: Effects of gastric inhibitory
polypeptide on glucose and lipid metabolism of isolated rat adipocytes.
Ann Nutr Metab 1988, 32:282-288.
23. Miyawaki K, Yamada Y, Ban N, Ihara Y, Tsukiyama K, Zhou H, Fujimoto S,
Oku A, Tsuda K, Toyokuni S, Hiai H, Mizunoya W, Fushiki T, Holst JJ,
Makino M, Tashita A, Kobara Y, Tsubamoto Y, Jinnouchi T, Jomori T, Seino Y:
Inhibition of gastric inhibitory polypeptide signaling prevents obesity.
Nat Med 2002, 8:738-742.
24. Elabd C, Chiellini C, Massoudi A, Cochet O, Zaragosi LE, Trojani C,
Michiels JF, Weiss P, Carle G, Rochet N, Dechesne CA, Ailhaud G, Dani C,
Amri EZ: Human adipose tissue-derived multipotent stem cells
differentiate in vitro and in vivo into osteocyte-like cells. Biochem Biophys
Res Commun 2007, 361:342-348.
25. White UA, Stephens JM: Transcriptional factors that promote formation of
white adipose tissue. Mol Cell Endocrinol 2010, 318:10-14.
26. Hong JH, Hwang ES, McManus MT, Amsterdam A, Tian Y, Kalmukova R,
Mueller E, Benjamin T, Spiegelman BM, Sharp PA, Hopkins N, Yaffe MB: TAZ,
a transcriptional modulator of mesenchymal stem cell differentiation.
Science 2005, 309:1074-1078.
27. Le Brigand K, Robbe-Sermesant K, Mari B, Barbry P: MiRonTop: mining
microRNAs targets across large scale gene expression studies.
Bioinformatics 2010, 26:3131-3132.
28. Komori T: Requisite roles of Runx2 and Cbfb in skeletal development. J
Bone Miner Metab 2003, 21:193-197.
29. Kahai S, Lee SC, Lee DY, Yang J, Li M, Wang CH, Jiang Z, Zhang Y, Peng C,
Yang BB: MicroRNA miR-378 regulates nephronectin expression
modulating osteoblast differentiation by targeting GalNT-7. PLoS One
2009, 4:e7535.
30. Gerin I, Bommer GT, McCoin CS, Sousa KM, Krishnan V, Macdougald OA:
Roles for miRNA-378/378* in adipocyte gene expression and lipogenesis.
Am J Physiol Endocrinol Metab 2010, 299:E198-206.
31. Martinelli R, Nardelli C, Pilone V, Buonomo T, Liguori R, Castano I, Buono P,
Masone S, Persico G, Forestieri P, Pastore L, Sacchetti L: miR-519d
overexpression is associated with human obesity. Obesity (Silver Spring)
2010, 18:2170-2176.
32. Picard F, Gehin M, Annicotte J, Rocchi S, Champy MF, O’Malley BW,
Chambon P, Auwerx J: SRC-1 and TIF2 control energy balance between
white and brown adipose tissues. Cell 2002, 111:931-941.
33. Lee YS, Shibata Y, Malhotra A, Dutta A: A novel class of small RNAs: tRNA-
derived RNA fragments (tRFs). Genes Dev 2009, 23:2639-2649.
34. Rodriguez A-M, Pisani D, Dechesne CA, Turc-Carel C, Kurzenne J-Y,
Wdziekonski B, Villageois A, Bagnis C, Breittmayer J-P, Groux H, Ailhaud G,
Dani C: Transplantation of a multipotent cell population from human
adipose tissue induces dystrophin expression in the immunocompetent
mdx mouse. J Exp Med 2005, 201:1397-1405.
35. Wdziekonski B, Villageois P, Dani C: Development of adipocytes from
differentiated ES cells. Methods Enzymol 2003, 365:268-277.
36. Massiera F, Saint-Marc P, Seydoux J, Murata T, Kobayashi T, Narumiya S,
Guesnet P, Amri E-Z, Negrel R, Ailhaud G: Arachidonic acid and
prostacyclin signaling promote adipose tissue development: a human
health concern? J Lipid Res 2003, 44:271-279.
37. NCBI Gene Expression Omnibus. [ />38. Bioconductor. [].
39. Ortega FJ, Moreno-Navarrete JM, Pardo G, Sabater M, Hummel M, Ferrer A,
Rodriguez-Hermosa JI, Ruiz B, Ricart W, Peral B, Fernández-Real JM: MiRNA
expression profile of human subcutaneous adipose and during
adipocyte differentiation. PLoS One 2010, 5:e9022.
40. Kajimoto K, Naraba H, Iwai N: MicroRNA and 3T3-L1 pre-adipocyte
differentiation. RNA 2006, 12:1626-1632.
41. Qin L, Chen Y, Niu Y, Chen W, Wang Q, Xiao S, Li A, Xie Y, Li J, Zhao X,
He Z, Mo D: A deep investigation into the adipogenesis mechanism:
profile of microRNAs regulating adipogenesis by modulating the
canonical Wnt/beta-catenin signaling pathway. BMC Genomics 2010,
11:320.
42. Oskowitz AZ, Lu J, Penfornis P, Ylostalo J, McBride J, Flemington EK,
Prockop DJ, Pochampally R: Human multipotent stromal cells from bone
marrow and microRNA: Regulation of differentiation and leukemia
inhibitory factor expression. Proc Natl Acad Sci USA 2008, 105:18372-18377.
doi:10.1186/gb-2011-12-7-r64
Cite this article as: Zaragosi et al.: Small RNA sequencing reveals miR-
642a-3p as a novel adipocyte-specific microRNA and miR-30 as a key
regulator of human adipogenesis. Genome Biology 2011 12:R64.
Submit your next manuscript to BioMed Central
and take full advantage of:
• Convenient online submission
• Thorough peer review
• No space constraints or color figure charges
• Immediate publication on acceptance
• Inclusion in PubMed, CAS, Scopus and Google Scholar
• Research which is freely available for redistribution
Submit your manuscript at
www.biomedcentral.com/submit
Zaragosi et al. Genome Biology 2011, 12:R64
/>Page 13 of 13