Báo cáo y học: "Proteome-wide evidence for enhanced positive Darwinian selection within intrinsically disordered regions in proteins" pdf
Bạn đang xem bản rút gọn của tài liệu. Xem và tải ngay bản đầy đủ của tài liệu tại đây (1.09 MB, 17 trang )
RESEARC H Open Access
Proteome-wide evidence for enhanced positive
Darwinian selection within intrinsically disordered
regions in proteins
Johan Nilsson
1
, Mats Grahn
1
and Anthony PH Wright
1,2*
Abstract
Background: Understanding the adaptive changes that alter the function of proteins during evolution is an
important question for biology and medicine. The increasing number of completely sequenced genomes from
closely related organisms, as well as individuals within species, facilitates systematic detection of recent selection
events by means of comparative genomics.
Results: We have used genome-wide strain-specific single nucleotide polymorphism data from 64 strains of
budding yeast (Saccharomyces cerevisiae or Saccharomyces paradoxus) to determine whether adaptive positive
selection is correlated with protein regions showing propensity for different classes of structure conformation. Data
from phylogenetic and population genetic analysis of 3,746 gene alignments consistently shows a significantly
higher degree of positive Darwinian selection in intrinsically disorde red regions of proteins compared to regions of
alpha helix, beta sheet or tertiary structure. Evidence of positive selection is significantly enriched in classes of
proteins whose functions and molecular mechanisms can be coupled to adaptive processes and these classes tend
to have a higher average content of intrinsically unstructured protein regions.
Conclusions: We suggest that intrinsically disordered protein regions may be important for the production and
maintenance of genetic variation with adaptive potential and that they may thus be of central significance for the
evolvability of the organism or cell in which they occur.
Background
Understanding the process of adaptation is of central
importance for many biological questions, such as how
species respond to climate changes, pathogens or other
envir onmental perturbations, as well for the mechanisms
underlyi ng genetic diseases, such as cancer. Evolutionary
adaptation occurs when an inheritable change in the phe-
notype of an organism makes it more suited to its present
environment. In diseases like cancer, adaptive mutations
allow individual cells within multi-cellular organisms to
thrive at the expen se of neighbouring cell s by over-riding
the normal cellular controls that restrict cell growth and
division. At the molecular level such phenotypic changes
are the result of mutational processes acting on either
protein-coding or non-coding DNA sequences. Although
the neutral theory of evolution [1] predicts the vast
majority of mutations to be either deleterious or neutral,
recent years have seen a sharp increase in publica tions
indentifying the action of positive Darwinian selection on
genes in variou s species [2]. The rapidly increasing num-
ber of completely sequenced genomes, along with
improved bioinformatic methodologies for detecting evi -
dence of se lection [3-5], has enabled large-scale scanning
of genes or genetic elements for evidence o f positive
selection. In particular, comparative approaches using
sets of genomes from closely related species, or strains
within a species, have proven powerful in detecting genes
or genetic regions under recent positive selection [6-8].
SNPs are the most abundant source of genetic variation
affecting populations. SNPs found within a protein-coding
region may be classified as synonymous SNPs or non-
synonymous SNPs, depending on whether t he encoded
amino acid is altered in the alternative DNA sequence
variants. Non-synonymous SNPs in coding sequences,
together with SNPs in gene regulatory regions, are
* Correspondence:
1
School of Life Sciences, Södertörn University, SE-141 89 Huddinge, Sweden
Full list of author information is available at the end of the article
Nilsson et al. Genome Biology 2011, 12:R65
/>© 2011 Nilsson et al.; licensee BioMed Central Ltd. This is an open access article distributed under the terms of the Creative Com mons
Attribution License ( which permits unrestricted use, distribution, and reprodu ction in
any medium, provided the original work is properly cited.
believed to have the highest impact on phenotype [9] and
hence they are suitable targets for studies on adaptation.
However, a major ta sk is still to understand which o f the
10 million or so SNPs in the human genome are of func-
tional significance. There is therefore a need for
approaches that help to predict the subcla ss of SNPs that
are more likely to be of adaptive significance. The rele-
vance of this task is underscored by the International
HapMap Proj ect, which uses genetic variation as a tool
to better understand the molecular basis of human disease
as well as the mechanisms underlying pharmaceutical
therapy [10].
Evolvability is often described as an organism’s capacity
to generate heritab le phenotypic variation [11-13]. This
capacity may either e ntail a reduction in the potential
lethality of mutations or a reduction in the number of
mutations required to generate phenotypically novel
traits [14-17]. At the molecular level, non-synonymous
SNPs in a protein-coding gene may result in structural
changes in the encoded protein, which may cause phe no-
typic changes and an increased potential for evolutionary
innovation, either directly or in future environments [15].
Proteins consist of conformationally structured regions,
containing a-helices and b-s heets, as w ell as intri nsically
disordered regions that are conformationally flexible.
Intr insically disordered protein reg ions (IDRs) have been
a rece nt focus of attention [18-21]. IDRs are abundant in
the eukaryotic proteome, with an estimated 50 to 60% of
all Saccharomyces cerevisiae proteins containing at least
one disordered segment comprising more than 30 amino
acid residues [22]. Intere stingly, IDRs o ccur more fre-
quently in eukaryotes than in bacteria or archea, perhaps
suggesting a role in the evolution of eukaryotes [23]. To
our knowledge, the relationship between recent adapta-
tion and the different types of structural domains within
proteins has not been systematically studied.
The budding yeast S. cerevisiae is one of the best-studied
model organisms at the molecular level. It was the first
eukaryotic genome to be fully sequenced [24], and it has a
well-annotated proteome [25]. The relatively small sizes of
fungal genomes, along with recent advances in whole
genome sequencing, have facilitated t he esta blishm ent of
multiple yeast genome sequences [26-29]. From an evolu-
tionary perspective, the short generation time of yeasts
combined with the strong environmental selective pres-
sures to which they are exposed facilitate the detection of
recent selection events in these organisms. Indeed, differ-
ent budding yeast species display a surprisingly high level
of genome diversity that is comparable to that observed
within the family of chordates [27]. The Saccharomyces
Genome Resequencing Project has resulted in genomic
sequences of multiple stra ins of S. cerevisiae and its close
relative, Saccharomyces paradoxus [30]. Studying poly-
morphism and divergence between the genomes of
S. cerevisiae and S. paradoxus strains thus provides an
excellent opportunity to identify genes or genetic regions
likely to be under positive Darwinian selection.
In this study, we performed genome-wide analyses of
SNPs identified in the Saccharomyces Genome Rese-
quencing Project that lie within protein coding genes
and used phylogenetic and population genetic methods
to detect evidence of selection acting either on entire
protein-coding genes or on individual codon sites within
genes. Interestingly, we found a stronger association of
both genes and codons under positive selection with
intrinsically disordered protein regions compared to
regions of regular secondary or tertiary structure.
Furthermore, a higher degree of positive selection was
found to act on proteins belonging to different func-
tional and structural protein categories that are charac-
terized by a high average IDR content. The biological
significance of these findings is discussed in the context
of the structure, function and evolvability of proteins.
Results
The frequency of codon sites under positive selection is
enhanced in protein regions with intrinsically disordered
structure
The Fixed Effects Likelihood (FEL) method was used to
predict codon sites under selection in the coding regions
of 3,746 S. cerevisiae protein coding genes, for which
inter-species alignments could be reliably c onstructed
and for which no recombination events were predicted
in the 37 S. cerevisiae and 27 S. paradoxus genome
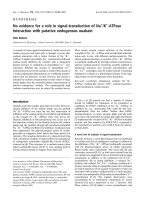
sequences used (Figure 1). One o r more codon sites
were predicted to be under selection in 3,421 of these
genes. As expected, the total number of sites predicted
to be under positive selection (7,561 sites) was consider-
ably lower than the number of sites predicted to be
under negative selection (178,408 sites).
To investigate whether the pattern of selection on indi-
vidual codon sites is correlated w ith the structural con-
text of the encoded amino acids, the frequency of
positively and negatively selected sites in IDRs as well as
structured regions (a-helices and b-strands) was com-
pared. Regions of regular secondary structure and IDRs
were predicted using PSIPRED and VSL2, respectively.
Frequency differences were assessed by a c
2
test. The
ratio of positive to negative s ites was approxi mately
three-fold higher in IDRs compared to regions of regular
secondary structure, for which the ratio was similar in a-
helical and b-strand regions (Figure 2a). To investigate
whether the higher ratio of positive to negative sites in
IDRs was mainly due to an excess of positive sites or a
depletion of negative sites, the mean proportion of posi-
tively and negatively selected codon sites in the three
structural conformation states was investigated. Interest-
ingly, the proportion of negatively selected sites was not
Nilsson et al. Genome Biology 2011, 12:R65
/>Page 2 of 17
significantly lower in IDRs compared to regions of regu-
lar secondary structure, whe reas the proportion of posi-
tively selected sites was almost threefold higher in IDRs
(Figure 2b). We thus conclude that there was a strong
enri chment of positively selected sit es in IDRs compared
to regions of regular secondary structure, whereas the
distribution of negatively selected sites was similar in
regions of structured and disordered conformation.
Simulation experiments hav e suggested that selective
forces might act more strongly on longer IDRs (≥30
amino acid residues) compared to shorter disordered
sequences or secondary structure el ements [31]. F urther,
it has been suggested that selective fo rces affe cting long
IDRs might be similar to those affecting the tertiary
structure domains of proteins [32]. We therefore calcu-
lated the ratio of predicted positive t o negative codon
sites in tertiary structure domains and IDRs that were 30
or more residues in length. Figure 2c shows that the
relative frequency of positive selection in long IDRs is
greater that in regions of tertiary structure. This is due to
an elevated frequency of positively selected codons in the
long IDRs.
To independently test whether the observed frequency
differences were greater than would be expected by
chance, a randomization test was performed. Briefly, the
test entailed sampling a number of selected sites, equiva-
lent to the number of sites found for each of the three
conformational states individually, from the combined
set of selected sites. The number of sites under either
positive or negative select ion in each such sample was
then calculated. The procedure was repeated 10,000
times to obtain an empirical d istribution o f the number
of selected sites expected by chance. The nul l hypo thesis
that the actual number of sites under selection for each
conformational stat e belonged t o the derived distribu-
tions of selected sites was assessed by a t-test. The results
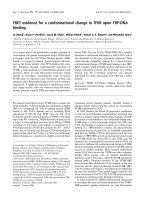
Figure 1 Flow cha rt illust ratin g the ini tial proc essing of t he sour ce data . The diagram show the steps involved in creating multiple
alignments including S. cerevisiae and S. paradoxus strains as well as the number of genes involved at each step. Filtering steps for removal of
uncertain alignments are also shown. See Materials and methods for details.
Nilsson et al. Genome Biology 2011, 12:R65
/>Page 3 of 17
showed a signi ficant (P ≤ 0.001) difference be tween the
observed frequencies of sele cted sites in different confor-
mational states and the empirically generated random
distributions in all cases except in the case of negatively
selected sites in a-helical regions. Figure 2d (le ft panel)
shows the deriv ed distributio ns from each randomization
test along with the observed number of positively and
negatively selected sites (downward-pointing arrowheads)
for IDRs. The figure provid es indep endent su pport f or a
strong enrichment of positively selected sites in IDRs and
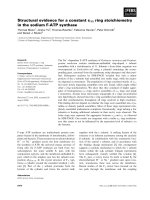
Figure 2 Codon sites under positive selection are over-represented in gene regions encoding intrinsically disordered regions of
proteins. (a) The ratio of positive to negative sites is higher in IDRs than in regions of regular protein structure. The ratio of positive to negative
sites is shown for protein regions predicted to have a-helical (a), b-sheet (b) or intrinsically disordered (IDR) protein conformation. The P-value
shows the significance of the difference between the ratio associated with IDRs in relation to regions of regular structure (a c
2
test was used to
test the null hypothesis that there is no difference between the ratios associated with different protein conformation classes). (b) The proportion
of codons under selection is enhanced in IDRs for positively selected sites but not negatively selected sites. Annotations are as for (a).
Differences between the frequencies of negative sites in regions of different protein conformation were not significant. (c) The ratio of positive
to negative sites is higher in long IDRs than in structured protein domains. The ratio of positive to negative sites is shown for protein regions
within known protein domains (PDB dom) or predicted intrinsically disordered protein regions of at least 30 residues in length (IDR ≥30). The
frequency of positively selected codons in IDR ≥30 and PDB dom is 0.0055 and 0.0011, respectively, while the equivalent frequencies for
negatively selected codons are 0.0728 and 0.0750, respectively. (d) Codons under positive selection are significantly more frequent in IDRs than
expected in relation to an empirically generated random distribution of selected sites. The panels show empirical frequency distributions
(histograms) predicted for a random distribution of positively and negatively selected sites within protein regions with intrinsically disordered
structure (IDR), b-sheet and a-helix conformation, generated by 10,000 randomization trials. The median of each distribution is shown associated
with upward-pointing arrowheads and the observed number of selected sites together with downward-pointing arrowheads. The ratio of the
observed number of sites in relation to the median of the random distribution is shown in the upper right corner of each panel. The ratio is
significantly different from unity in all cases (P ≤ 10
-3
) except for negative sites in a-helical regions.
Nilsson et al. Genome Biology 2011, 12:R65
/>Page 4 of 17
a small but significant depletion of negatively selected
sites in these regi ons. The relative difference between the
number of observed (downward-pointing arrowheads)
and expected (upward-pointing arrowheads) sites under
selection was much greater for positively than for nega-
tively selected sites, as shown by the ratio of the two
values (top right corner in each panel). The enrichment
level for positively selected sites in IDRs is almost
ten-fold higher than the under-representation level of
negatively selected sites in the same regions. Hence, the
distribution was considerably less skewed for negatively
selected sites. The trend was exactly the opposite for
regions with a-helical (right panels) and b-sheet (middle
panels) con formation. Positively selected sites are under-
represented in these regions. Again the extent of positive
site under-representa tion is much greater than the devia-
tion level for neg ative sites, which differ little, if at all,
from the empirically generated value expected for a ran-
dom distribution within the a-helical and b-sheet confor-
mational classes. Based on the proteo me-wide analysis of
codons under selection, we thus concluded that there is a
strong bias in the distrib ution of positively selected sites
between gene regions encoding regular and disordered
protein structure.
We next investigated whether a similar bias in the dis-
tribution of codons under selection could be observed at
the level of intact genes. To this end, a non-overlapping
sliding window of 25 codons was moved across each
aligned gene in the analyzed data set, and the number
of positively selected codon sites within each window
was counted. The predicted IDR content within each
window was also calculated. Each windo w containing at
least one positive site thus generated a data point and
for genes resulting in at least five such data points the
correlation between IDR content and the number of
codons under positive selection was assessed by calcula-
tion of Spearman’ s rank correlation coefficient (P ≤
0.05). Again, the correlation between degree of disorder
and incidence of positive selection was obvious. For the
genes analyzed, a significant positive correlation between
IDR content and positively selected codon sites was
observed in 528 ge nes, whereas a signif icant negative
correlation was found in only 28 genes. These results
thus suggest that the correlation between positively
selected sites and gene regions encoding IDRs can be
extended to the level of intact genes and proteins.
Intrinsically disordered protein regions have a higher
proportion of fixed non-synonymous polymorphisms
Having observed that intr insically disordered prot ein
regions were enriched in codon sites under positive selec-
tion, we next used an alternative approach to investigate
whether enhan ced po sitive sel ection in genes with high
IDR content could be observed at the level of intact
genes. The McDonald-Kreitman test was used to esti-
mate the degree of selection acting on the 3,746 aligned
S. cerevisiae and S. paradoxus protein coding genes by
means of the fixation index (FI; see Materials and meth-
ods for details). Similar to the codon level, a minority of
gen es were predicted to be unde r positive selection (FI >
1; 128 genes under a P-value threshold of 0.05), while a
larger number were predicted to be under negative selec-
tion (FI < 1; 519 genes under a P-value threshold of
0.05). Figure 3a shows the FI as a function of IDR content
for each of the analyzed genes and the equivalent plot for
regular secondary structure regions is shown in Figure
3b. Spearman’ s rank correlation coefficient was calcu-
lated to assess the correlation between secondary struc-
ture content and FI values, and a t-test was used to
determine its statistical significance. Consistent with our
results at the individual codon level, there was a signifi-
cant (P ≤ 10
-18
) tende ncy for FI and IDR content to be
correlated (r
s
=0.28).Anegativecorrelation of similar
magnitude was seen between FI and regular secondary
structure content (r
s
= -0.26 , P ≤ 10
-18
). As a negative
control, we similarly ass essed the level of correlation
between (G+C) content and FI (Figure 3c), and betwee n
(G+C) content and IDR content (Figure 3d). No signifi-
cant correlation was found wit h r
s
values of 0.01 fo r cor-
relation of (G+C) content with both FI and IDR content.
Removal of 63 outliers (genes with a fixation index
deviating more than three standard deviations from the
mean of the entire data set) did not significantly affect
any of the obtained results (data not shown).
A Mann-Whitney U test was also performed in order
to independently test the significance of the correlation
between FI values and IDR content. Genes were sorted
into two equally sized groups according to the level of
their FI value (the median FI value was 0.42 after
removal of outliers). The null hypothesis o f equal sec-
ondary structure content in the resulting d ata sets was
then tested. There was a significantly higher IDR con-
tent in the dataset containing higher FI values (P ≤ 10
-
15
). No significant difference i n FI or IDR content (P >
0.5) was found between subsets when the dataset was
divided in the same way into subsets of high and low (G
+C) content (the median G+C value was 0.42). Thus, we
conclude that there is a higher proportion of fixed non-
synonymous polymorphism in IDRs than in other pro-
tein regions, again suggesting an enhanced level of po si-
tive selection in these regions.
A potential problem with the analyses presented above
is the fact that most genes did not obtain a statistically
significant FI value at the chosen level of significance,
and hence were discarded from the analysis. To assure
that this did not prejudice the overall conclusion, we
performed an alternative, proteome-wide analysis. Three
composite alignments were created by concatenating
Nilsson et al. Genome Biology 2011, 12:R65
/>Page 5 of 17
(a)
(b)
(c)
(d)
(e)
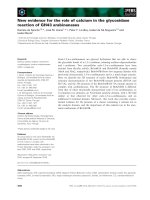
Figure 3 Relative levels of species-specific fixation of variant SNP a lleles in each gene are correlated with the level of intrinsically
disordered region content in the corresponding proteins. (a, b) Scatter plot showing the fixation index (FI) for genes, calculated by the
McDonald-Kreitman test (see Materials and methods), is positively correlated with the fraction of IDR (a) and negatively correlated with the
fraction of regular secondary structure (b) in the corresponding proteins. Spearman’s rank correlation coefficients (r
S
) and associated P-values are
shown. (c, d) The (G+C) content of genes is not correlated with their FI (c) or with the fraction of IDR in the corresponding proteins (d).
Spearman’s rank correlation coefficients (r
S
) and associated P-values are shown. (e) The mean FI corresponding to all IDRs studied is higher than
that for all a-helical regions or b-sheet regions studied. The FI for concatenated tracts of predicted a-helical (a), b-sheet (b) and IDRs are plotted.
Values are shown for IDR predictions using confidence thresholds of 0.8 (strict) or 0.5 (liberal) (see Materials and methods for details). Open bars
designate results obtained for the non-filtered data set while the filled bars designate the data set after removal of outliers (see Materials and
methods for details).
Nilsson et al. Genome Biology 2011, 12:R65
/>Page 6 of 17
protein regions from all 3,746 aligned genes that are
predicted to be a-helix, b-strand or IDR. The overal l FI
was then calculated for each of the three concatenated
alignments. Figure 3e shows the resulting overall FI for
each composite alignment. In accordance with our pre-
vious observations, the overall FI value was close to 1.0
in the IDRs, indicating an overall balance betwee n posi-
tive and negative selection acting within these regions.
These results were very similar whether a strict or a lib-
eral confidence value was used in the I DR predictions
(see Materials and methods). In protein regions with
regular secondary structure, the overa ll FI value was
lower than 1.0, indicating an overall bias towards purify-
ing selection acting on these regions. Thus, the data
support enhanced positive selection in IDRs even when
data from all the gene alignments are studied.
Finally, as an independent assessment of the distribu-
tion bias of positively selected polymorphic sites within
genes, a non-overlapping window of 25 codons was
moved over all the gene alignments, and a regional FI
was calculated within each such window. The cor rela-
tion between the resulting FI and IDR content was esti-
mated by Spearman’s rank c orrelation coefficient. The
number of genes with a positive correlation betwe en
intrinsic disorder and FI (329 genes) was about an order
of magnitude higher than the number of genes where a
negative correlation was observed (39 genes), again sug-
gesting a positive correlation between intrinsic disorder
and degree of positive selection within proteins.
Intrinsically disordered regions are not depleted in
functional sites
Given the higher frequency of positively selected amino
acid-altering substitutions observed in IDRs, we wanted
to further exclude the possibility that this was merely a
consequence of a lower level of functional sites in these
regions. To this end, we compared the distribution of
predicted functional sites between IDRs and non-IDRs
using th e Limacs functional sites index, for which values
show the ratio of functional sitesinIDRsinrelationto
their level in non-IDRs (see Materials and methods).
Although we might have expected most annotated func-
tional domains studied by this method to consist mainly
of regular secondary structure elements, previous studies
have shown that conserved disordered regions occur fre-
quently in annotated protein domains [33]. The mean
IDR content in mapped Pfam domains was shown to be
about 26%, using a confidence value threshol d of 0.5 for
IDR prediction (compared to a content of about 44% for
the entire proteome). Using a more stringent confidence
value threshold (0.8) the equivalent values for I DR con-
tent w ere 7.4% and 26%, respectively. As shown in Fig-
ure 4, the Limacs functional sites index was close to or
in excess of 1.0 for most IDR prediction param eter
settings, suggesting that functional sites are at least as
frequent in IDRs as they are in non-IDRs. Somewhat
higher relative levels of fu nctional sites were detected in
IDRs after filtering the IDR and non-IDR data sets by
removing duplicate examples of Pfam domains that
occur in two or more proteins in order to prevent possi-
blebiasfromPfamdomainsthatarefoundinmany
proteins. The Limacs functional sites index increases for
both the filtered and non-filtered data sets as the strin-
gency for IDR prediction is increased. Thu s, the high
relative identification of Limacs sites in IDRs cannot be
accounted for by their preferential occurrence in falsely
identified IDRs at low stringency levels. Taken together
with the relatively high level of negatively selected
codons in IDRs and the relatively high FI for poly-
morphisms in IDRs, these data provide independent evi-
dence that the high levels of apparent adaptive genetic
variation predicted for IDRs is not a consequence of
reduced negative selection acting on amino acid residues
located in IDRs.
Positively selected sites are over-represented in a subset
of functional protein categories
To determ ine the generality of enhanced positive selec-
tion in IDRs, we next wanted to in vestigate how codon
sites un der positive and negative selection are distribu-
ted between different functiona l classes of proteins. To
this end, we used two alternative protein annotation
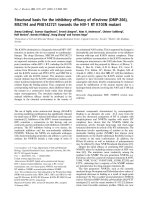
Figure 4 Functional amino acid residues are not under-
represented in intrinsically disordered regions within proteins.
The Limacs functional sites index calculated for mapped Pfam
domains within IDRs is plotted against different confidence value
thresholds used for prediction of IDRs. The mean fraction of
residues predicted to be in IDRs relative to structured regions, at
different prediction threshold values, is indicated by open diamonds
(default threshold used in the study was 0.8). The corresponding
Limacs functional sites index is shown without filtering (filled
squares) or after filtering to remove multiple examples of the same
Pfam domain (filled circles; see Materials and methods for details).
Nilsson et al. Genome Biology 2011, 12:R65
/>Page 7 of 17
schemes from the Munich Information Center for Pro-
tein Sequences (MIPS), FunCat and ProteinCat [34]. A
randomization test was employed to detect whether a
statistically significant excess of selected sites occurred
in any of the subcategories in either catalogue. Figure 5
shows categories significantly enriched in positively
(filled bars) or negatively (o pen bars) select ed residues,
using a P-value thres hold of 0.01. In FunCat (Figure 5a),
statistical support for positively selected residues is
found in proteins involved in both cell growth and mor-
phogenesis, including mating, cell signaling, virulence
and defense, as well as various a spects of nucleic acid
biology, including the replication, repair, recombination
and transcription of DNA. Enrichment of negatively
selected residues was observed for a smaller number of
categories, including conserved metabolic processes,
such as fermentation and detoxification, as well as for
protein folding and stabilization. In ProteinCat (Figure
5b), fewer categories were enriched in positively selected
sites but all are associated with transcription factors.
Most categ ories are enriched in negatively selected resi-
dues and mainly represent different categories of
enzymes. The clearest common conclusion from analysis
of both catalogues is that transcription factors tend to
be enriched in positively selected amino acid residues.
Protein categories with a high propensity for positive
selection have a high average IDR content
Given the correlation between positive selection and
both the IDR content of proteins and their functional
categorization, we were interested to test directly
whether the average IDR content of protein categories is
generally correlated with their content of positively or
negatively selected sites. To investigate this, the major
categories in FunCat and ProteinCat were sorted into
ranks according to their average IDR content (Figure 6).
The ranks of values for FunCat (Figure 6a) an d Protein-
Cat (Figure 6b) categories show clearly that categories
enriched in positively selected sites (filled squares) tend
to have higher average IDR contents while the reverse is
true for categories enriched in negatively selected sites
(open triangles). Transcription factor categories that are
significantly enriched in positively selected sites lie clo-
sest to the top of both category ranks. We conclude that
transcription factors may provide good examples of pro-
teins in which IDRs play an important role in functional
adaptation.
Discussion
Here we show evidence for associat ion betwe en positive
adaptive selection and regions of proteins with a low
intrinsic propensity for secondary structure formation.
This conclusion is based on the study of how genetic
variation within 64 strains of S. cerevisiae and S.
paradoxus affects the amino acid sequence of about
two-thirds of the proteins within the yeast proteome.
Since we cannot reconstruct the evolutionary history of
these strains, it is relevant to discuss issues that influ-
ence the robustness of our conclusions.
Firstly, we have addressed whether the conclusions we
draw could be influenced by the se lection of gene align-
ments for study since we have not studied all genes.
Genes were mainly excluded from the study based on
uncertainty of the alignments. For the analysis shown,
we required a level of 70% amino acid identity in pro-
teins translated from the aligned genes. Reducing this
threshold to 60% did not increase the number of pro-
teins appreciably, probably because many of the low
quality alignments result from incomplete genome
sequences for one or more of the strains. An increase of
the threshold to 80% identity, however, led to the exclu-
sion of a further 800 gene alignments. Importantly, the
use of these different th resholds for selection of gene
alignments for study did not significantly influence the
conclusions drawn.
Secondly, we have used different approaches to iden-
tify evidence of natural selection since each individual
method may be subject to potential drawbacks. While
the accuracy of maximum likelihood methods for identi-
fying codons under selection has been questioned
recently [35,36], the McDonald-Kreitman approach is an
insensitive method for detecting positive selection
because evidence of positive selection is often cancelled
out by negative selection, which is much more common.
Indeed, the recent study by Liti et al.[30]didnotfind
any statistical support f or the existence of individual
genes under positive selection when McDonald-Kreit-
man data were corrected for random effects associated
with multiple testing. We have not corrected the data in
our analysis since the aim was to study the overall asso-
ciation of protein structure with propensity for positive
or negative selection rather than to identify individual
genes under selection. The fact that we identify evidence
for similar patterns of positive and negative selection at
the level of codons using the FEL method a nd at the
level of intact genes or gene regions using the McDo-
nald-Kreitman test strongly supports the conclusion that
the pro pensity for positive selection is enhanced in the
IDRs of proteins. Nowaza et al . [36] have pointed to the
utility of correlating bioinformatic predictions of codon
sites under positive selection with biochemical data. Our
obse rvation that predicted evidence of positive selection
ten ds to correlate with IDRs in p roteins will be a useful
parameter to test in other systems.
Thirdly, we have used several alternative strategies and
statistical tests, including permutation t ests of empiri cal
signi ficance levels, to assess the significance of the asso-
ciations we have observed in the different tests for
Nilsson et al. Genome Biology 2011, 12:R65
/>Page 8 of 17
Figure 5 Specific protein categories are significantly over-represented in their content of codon sites under positive or negat ive
selection. (a) Functional categories of the MIPS FunCat proteins that show significant (P ≤ 0.01) enrichment of codon sites under positive (filled
bars) or negative (open bars) selection. (b) Functional categories of the MIPS ProteinCat proteins that show significant (P ≤ 0.01) enrichment of
codon sites under positive (filled bars) or negative (open bars) selection.
Nilsson et al. Genome Biology 2011, 12:R65
/>Page 9 of 17
Figure 6 Protein categories enriched in codon sites under positive selection tend to have higher average levels of intrinsically
disordered regions compared to categories enriched in sites under negative selection. (a) MIPS FunCat categories are plotted in a rank
according to their IDR content (small open circles). Categories from Figure 5a that are enriched in codon sites under positive (filled squares) or
negative (open triangles) selection are plotted with a larger symbol. (b) MIPS ProteinCat classes, including those enriched in codon sites under
selection (Figure 5b), are plotted as in (a).
Nilsson et al. Genome Biology 2011, 12:R65
/>Page 10 of 17
positive and negative selection. In all cases these tests
provide statistical support for the a ssociation between
positive selection and IDRs in proteins.
Fourthly, we have used alternative approaches to study
the possibility that the increased frequency of positively
selected residues in IDRs is the result of reduced nega-
tive select ion in these regions due to the fact that they
might be less important for protein function. This
hypothesis would fit well with preconceptions about
protein structure that have stated that structured con-
formation correlates with functional signif icance. Most
importantly, however, this explanation of our results is
contradicted by our data, since the frequency of nega-
tively selected codons is not significantly reduced in
IDRs relative to protein regions with a structured con-
formation. Consistently, other recent reports also sug-
gest that IDRs are under negative selection at a level
that may even exceed the level for secondary structure
elements [31,32]. To further address the issue, we used
the Limacs method to independently predict the relative
frequency of functionally import amino acid residues in
IDRs in relation to regions of structured conformation.
The results are consistent with our codon selection data
and show that t he predicted frequency of functionally
important residues is similar in IDRs and regions with
structured conformation.
Other approaches to assess the robustness of our con-
clusion that the IDRs in proteins are particularly suscep-
tible to positive selection are to test whether protein
classes predicted to have high adaptive potential make
biological sense, whether they are generally character-
ized by proteins with high IDR content, as well as
whether such proteins are associated w ith molecular
mechanisms that could explaintheirhigheradaptive
potential. To test whether particular protein cat egories
are enriched in proteins predicted to be under positive
or negative selection, we used the FunCat and Protein-
Cat catalogues of yeast proteins. Several FunCat cate-
gories showed significant over-representation of proteins
pred icted to be under positive selection. These included
functions associated with development, mating, and
morphogenesis that contain known targets for adaptive
selection. Other categories have to do with virulence,
defense and cell signaling as well as many categories
related to DNA functions, including transcr iptio n. Most
of these categories contain many proteins that are
potentially relevant targets for adaptive mutati on. Fewer
FunCat ca tegories showed significant evidence of nega-
tive selection but these include classes containing highly
conserved proteins involved in detoxification, fermenta-
tion and protein folding. The ProteinCat categories that
are significantly enriched in proteins predicted to be
under negative o r positive selection also make sense.
Most of the categories under negative selection contain
enzymes, which are known to be high in structured
regions under negative selection. The three categories
enriched in proteins predicted to be under positive
selection are all categories containing transcription fac-
tors. Individual transcription factors have been sug-
gested to be under positive selec tion previously [37-39].
Furthermore, transcription factors have been shown to
evolve faster than other protein classes in yeast [40]. As
predicted by our model, F unCat and P roteinCat cate-
gories that are over-represented in proteins predicted to
be under positive selection also have a high average IDR
content while the reverse is true for categories asso-
ciated with negative selection.
Our data suggest that the conformational flexibility of
IDRs, which might potentially translate to a functional
flexibility, could represent a generally evolvable charac-
teristic. IDRs might represent a conformational ground
state that provides proteins with an intrinsic ability to
adapt new functionality. According to this view, protei n
regions with regular structure would tend to favor struc-
tural and functional specialization but at a cost in terms
of evolvability. Consistent with this, experimental studies
suggest that naturally occurring proteins are n ot maxi-
mally stable, but rather that they seem to exhibit the
minimal level of stability necessary for the environment
in which they function [41]. Furthermore, in silico stu-
dies have shown that strong selection for structural sta-
bility would be expected to lead to reduced evolution of
novel protein functions [42,43].
A key ques tion is thus whether there is evidence to
support a link between the conformational flexibility of
IDRs and functional flexibility? The widespread involve-
ment of IDRs in interactions between protein partners
involved in a diverse range of biological functions pro-
vides such evidence [44]. Further, IDRs have, as pre-
dicted, been shown to adopt different conformations
upon interaction with different binding partners [21]. It
has long been recognized that alterations affecting gene
regulation prov ide a powerful opportunit y for evo lution
of phenotypic differenc es between organisms and hence
for the adaptation of organisms to new environments
[45]. Much attention has focused on studies of adaptive
changes that affect the sequence of cis-acting regulatory
elements in gene promoters, enhancers or silence rs
[46,47]. However, recent studies have suggested that
mutations in trans-acting components, including tran-
scription factors and co-regulators, are also important
for the evolutionary adaptation of transcription networks
[48-50]. Protein interactions involving transcriptional
componentshavebeensuggestedtoplayaroleinsuch
evolutionary processes [46,51]. Several studies have
shown evidence of adaptive changes in the protein inter-
action domains of transcription factor proteins [37-39]
and previous computational studies have independently
Nilsson et al. Genome Biology 2011, 12:R65
/>Page 11 of 17
shown that tran scription factors have a high IDR co n-
tent [20,52]. Inter estingly, transcription factor activation
domains have been shown to be IDRs [53,54] that inter-
act with other proteins by two-step target-assisted fold-
ing mechanisms in which their intrinsically unstructured
nature plays an important role [55,56].
Conclusions
Taken together with previous knowledge, our results
thusprovidestrongevidencefortheinvolvementof
IDRs in evolutionary adaptation. Such IDRs are some-
times associated with transc ription factors, where they
have been relatively well studied, but it is likely that
IDRs involved in adaptation may b e found in a much
broader range of protein classes. The genome-wide nat-
ure of the study suggests that the conclusions are signif-
icant to most if not all of the proteome. The adaptive
nature of IDRs gives a ne w perspective for understan d-
ing the potential adaptive sign ificance of gene vari ants
that arise in nature and medicine.
Materials and methods
Retrieval of genomic sequences and polymorphism
information
Plain text files containing the S. cerevisiae and S. para-
doxus reference genome sequences, genomic coordinates
of identified SNPs in each of the sequenced isolates (37
S. cerevisiae strains and 27 S. paradoxus strains), and
genomic coordinates of the protein coding genes in S.
cerevisiae we re downloaded on 1 September 2007 from
the Sanger ftp site [57]. The strains studied are listed in
Additional file 1. Only confirmed polymorphisms were
used in the subsequent analyses. Details of synonymous
and non-synonymous SNPs in S. cerevisiae and S. para-
doxus strains are de scribed per protein-coding sequence
and per ch romosome in Additional files 2, 3, 4, 5, 6 and
7.
Retrieval of protein coding genes in S. cerevisiae and S.
paradoxus
The coding sequences of all annotated S. cerevisiae pro-
tein coding genes in the Saccharomyces Genome Data-
base [58] were extracted from the reference genome
sequence, and reverse complemented for genes where
trans cription occurs from the lower s trand. For S. para-
doxus, we retrieved the genomic coordinates of genes
inferred previously based on synteny and sequence simi-
larity of predicted ORFs in t he S. paradoxus genome to
annotated genes in the S. cerevisiae genome [28]. The
corresponding coding sequences were extracted from
the S. paradoxus reference genome sequence and tested
for their coding potential in six possible ORFs using the
sixpack method of the EMBOSS sequence analysis pack-
age [59]. When necessary, the coding sequence was
reverse complemented and/or shifted to yield a transla-
table ORF. No mitochondrial genes were included in the
analysis.
Alignment of orthologous genes
For each S. cerevisiae gene where a S. paradoxus ortho-
logue coul d be inferred, a multiple s equence alignment
was created consisting of all strain orthologues for
which at least one sequence contained at least one SNP
relative to the respective reference genome sequence.
To assure that the align ment did not result in any fr a-
meshifts, translation-assisted alignments were created
using DIALIGN-T [60]. To ensure that subsequent ana-
lyses were not affected by the occurrence of uncertain
alignments, orthologous protein coding gene alignments
were filtered at different stringency threshol ds base d on
the level of sequence identity in the alignments of the
translated sequences and alignments below the filtering
threshold were removed (60%, 4,029 alignments; 70%,
4,001 alignments; 80%, 3,198 alignments). Subsequent
analyses were performed on each of the three datasets
to determine whether the choice of filtering threshold
altered the conclusions drawn from subsequent analyses.
The choice of filtering criteria did not significantly influ-
ence subsequent analysis and results using the align-
ments with ≥ 70% are shown in the paper. Details of the
DNA sequence alignments used in the study are avail-
able on request. The methods used to detect selection
assume that all sites in each gene share the same phylo-
geny [61] and therefore alignments where recombination
events were predicted by the GENECONV method [62]
using the ‘/r’ option (only silent sites analyzed), and cal-
culating global P-values based on Bonferroni-c orrect ed
Karlin-Altschul P-values were removed from the subse-
quent analysis.
Prediction of structured and intrinsically disordered
protein regions
The PSIPRED [63] and VSL2 [64] methods we re used to
predict the occurrence of structured and disordered pro-
tein regions, respectively, in all S. cerevisiae proteins.
The protein-coding DNA sequences used as well as the
protein sequences translated from them are provided in
Additional files 8 and 9, respect ively. The VSL2 method
was among th e best performing in the CASP7 assess-
ment of IDR prediction algorithms [65], and performs
particularly well in predicting short d isordered regions
[64]. Both methods rely on evolutionary information
derived from PSI-BLAST generat ed profiles. For the
PSI-BLAST searches we used a filtered version of the
Uniref90 database (release 12.8) where transmembrane
regions, coiled-coil regions and low-complexity regions
had been removed using the pfilt program [66]. Each
PSI-BLAST search was performed for three iterations,
Nilsson et al. Genome Biology 2011, 12:R65
/>Page 12 of 17
with an E-value threshold of 0.001 for inclusion in a
multi-pass model, against the reduced Uniref90 data-
base. A position-specific scoring matrix was produced
(option -Q) and this was used as input t o the PSIPRED
and VSL2 algorithms. Amino acid residues predicted by
PSIPRED to belong to state ‘helix’ or ‘ extended beta’
with a confidence value equal to or larger than 8 w ere
chosen for subsequent analysis of regular secondary
structures (Additional files 10 and 11). For prediction of
disordered residues, we used both a strict confidence
value threshold of 0.8 and a liberal threshold value of
0.5 (Additional files 12 and 13). An y residue sites for
which predictions of disordered and regular structure
overlapped were removed. Except where stated, the
strict confidence value (0.8) was used for IDR prediction
in the data shown in the paper. The mean fraction of
residues reliably predicted to be in a-helical, b-strand,
and intrinsically disordered conformation was 26%, 6%
and 23%, respectively. Since the sequences studied using
these selection criteria represent only 55% of amino acid
residues, all analyses were also performed using the lib-
eral confidence threshold (0.5) for IDR detection (44%
of residues identified as IDR, 76% of residues included
in analyses). None of the overall conclusions were
affected by use of reduced-stringency IDR prediction
criteria (0.5). We obtained 1,191 protein regions map-
ping to known structured domains in the protein data-
base (PDB) and corresponding to 643 yeast proteins
from the PFAM database (version 25.0) [67].
Phylogenetic test for selection
Amino acid residues under selection in inter-strain/spe-
cies alignments were identified using a codon-based
maximum likelihood method implemented in the HyPhy
software package [68]. Each a lignment was analyzed
separately for codon sites under selection using the FEL
method. A neighbor-joining tree was built for each
alignment under the T ajima-Nei model of nucleotide
substitution [69], and the tree topology along with the
alignment were used as input. The HKY85 model of
nucleotide substitution was used [70]. In the FEL
method, a likelihood ratio test is performed to estimate
the rates of synonymous (a) and non-synony mous (b)
substitution at each codon site. If the synonymous sub-
stitution rate is higher than the non-synonymous rate (a
> b), this is indicative of negative selection, whereas a
higher non-synonymous substitution rate (b > a)indi-
cates the action of positive selection. The default thresh-
old value of P ≤ 0.1 was used to reject the null-
hypothesis of a = b at a codon site.
Population genetic test for selection
To detect genes under selection, the multiple sequence
alignments of all orthologo us protein coding genes were
subjected to the McDonald-Kreitman test [71] as imple-
mented in the MKtest program of the libsequence pack-
age [72]. This test investigates the correlation of
polymorphisms within species and their divergence
between species, and also distinguishes between synon-
ymous and non-synonymous sites. In a sequence having
no evolutionary constraints, the ratio of non-synon-
ymous and synonymous sites that are fixed between spe-
cies (dN/dS) should be roughly equal to the ratio of
non-synonymous and synonymous sites that are poly-
morphic within a species (pN/pS), according to the neu-
tral theory of evolution [73]. We refer to the ratio (dN/
dS)/(pN/pS) as the fixation index (FI). When negative
selection is acting on a locus, non-synonymous muta-
tions are unlikely to become fixed, although they might
still contribute to polymorphism within a species. Thus,
the ratio (dN/dS) is expected to be lower than the ratio
(pN/pS), yielding an FI <1. However, if positive selection
is acting on a locus, non-synonymous mutations are
expected to spread rapidly through the popula tion, thus
having a greater effect on divergence than on poly-
morphism. In t his case, the ratio (dN/dS) is expected to
be higher than the ratio (pN/pS), yielding an FI >1. We
calculated the FI for each gene and performed a Fisher’s
exact t est of the null hypot hesis of indepe ndence
between the two ratios (dN/dS) and (pN/pS). Rejection
of the null hypothesis at the 5% sign ificance level was
taken as an indication of either negative or positive
selection, depending on the FI value (Additional file 14).
The occurrence of slightly deleterious mutations is
known to cause an underestimation of the level of adap-
tive evolution [74], and a frequently used approach to
control for some of the effects of these mutations is to
remove polymorphisms segr egating at low frequencies.
Thus, all SNPs occurring in less than 15% of the strains
within a species were removed, as this has been demon-
strated to be an appropriate threshold [75]. Additionally,
average proteome McDonald-Kreitma n tests were per-
formed by merging all aligned codons encoding amino
acid residues reliably predicted t o be in regions of a-
helical, b-sheet or int rinsically disordered conformation,
and performing the calculations described above on
each of the three resulting composite alignments (Addi-
tional file 15). The (G+C) content of each S. cerevisiae
gene was calculated using the geecee program of the
EMBOSS package.
Prediction and analysis of functionally important amino
acid residues
We applied the Lim acs method [76,77] to predict the
occurrence of functionally important sites in the amino
acid sequence of translated S. cerevisiae genes. Given a
multiple sequence alignment, Limacs uses a template
library for prediction of functionally important sites in the
Nilsson et al. Genome Biology 2011, 12:R65
/>Page 13 of 17
alignment. Since the method is based on known functional
sites in conserved functional domains [77], we constrained
the analysis to mapped Pfam domains [78]. All annotated
Pfam domains were mapped to the translated yeast genes
using reverse position-specific BLAS T (RP S-BLAST).
Domains that mapped to at least one of the yeast proteins
were subjected to analysi s by Limacs to predict the loca-
tion of functional sites. To score positive as a functional
site, sites were required to have a query column versus
template pattern score (QT score) of at least 0.95, a QT Z-
score of at least 1, and randomization scores QRn and
TRn lower than 0.01. The distribution of predicted func-
tional sites in mapped Pfamdomainswasanalyzedfor
residues in regions of intrin sically disordered and regular
conformation, and differences in the distribution were
assessed by a c
2
test,wherea2×2contingencytableof
functional sites in IDRs (LI) and non-IDRs (LnI), and of
non-functional sites in IDRs (nLI) and in non-IDRs (nLnI)
was built. The Limacs functional sites index (LI/nLI)/(LnI/
nLnI) was used to indicate whether there w as a relative
abundance (index above one) or depletion (index below
one) of pre dicted funct ional sites in IDRs compared to
non-IDRs. Predicted functional sites in each gene are listed
in Additional file 16. To ensure the robustness of the
obtained results, the comparison was repeated using var-
ious IDR prediction reliability cutoff values. Furthermore,
to avoid bias from over-represented domains, a conserva-
tive filtering procedure was also applied, in which only
one of the mapped protei n regi ons was anal yzed in cases
where a domain mapped to more than one protein.
Assessment of differences in degree of selection between
protein regions of regular and intrinsically disordered
structure
Spearman’s rank correlation coefficient (r
S
) was calcu-
lated to assess the correlation between secondary struc-
ture content and FI in genes where the McDonald-
Kreitman test rejected the null hypothesis of neutral
evolution. In the same manner, the correlation was
assessed between (G+C) content and secondary struc-
ture content, and between (G+C) content and FI.
Becauseofthelargesamplesize(n), a normal distribu-
tion was assumed and the statistical significance was
determined by calculating z = r
S
√n-1.
The intra-genic correlation betwee n secondary struc-
ture content and FI was assessed for each gene by a
sliding-windo w analysis, where structure content and FI
were calculated within non-overlapping windows of size
25 codons fo r all aligned orthologous genes. Spearman’s
rank correlation coefficient was calculated for the result-
ing data points, indicating the correlation of structure
content and FI for each individual gene. Only informa-
tive windows were analyzed, that is, r egions for which a
FI value could be calculated. If the number of
informative windows from a gene alignment was more
than 30, a normal distribution was assumed and an
approximate z-value was calculated as above. In cases
where the number of informative windows was fewer
than 30 but more than 5, significance was assessed by
consulting a table of pre-calculated c ritical r
S
values. If
the analysis produced five or fewer informative windows,
no correlation analysis was performed on the gene.
The distribution of codon sites predicted to be under
positive or negative selection was likewise assessed between
the IDR, a-helix and b-sheet conformational states. A ser-
ies of 2 × 2 contingency tables was generated describing
the frequencies of two types of codon sites in two different
structure states, and for each table the difference in distri-
bution was assessed by a c
2
test. To independently investi-
gate whether an observed difference i n t he distribution of a
given type of codon in a certain conformational state could
be expected by chance, a randomization procedure was
applied. The number of codon sites, n,ofagiventypeC in
the investigated s tructure state S was counted and summed
over all genes, as was the total number of codon sites, N,in
conformational state S. The randomization test entailed
performing 10,000 re- samples, where N codon sites were
randomly chosen from any gene, and counting the result-
ing number of sites, n’,oftypeC. The observed number of
type C sites, n, in intrinsically disordered regions was then
compared to the simulated distribution o f n’ values, and
the null h ypothesis of equal distribution in disordered
regions and regions with secondary structure was rejected
by a two-tailed t-test (P ≤ 0.001).
The intra-genic correlation between occurrence of type
C sites and secondary struc ture content was assessed for
each gene by a sliding-window analysis, where non-over-
lapping windows of size 25 codons were moved over the
gene, counting the number of type C sites and calculating
the secondary structure content in each window. Spear-
man’s rank correlation coefficient was calculated to assess
the correlation between secondary structure content and
type C codon site distribution, and the statistical signifi-
cance was estimated as described above, discarding win-
dows with no type C codons.
Assessment of differences in degree of selection between
functional categories of proteins
We adopted the MIPS FunCat and ProteinCat annota-
tion schemes [34] to assign each gene i nto one o r more
functional categories. Excess or depletion of codon sites
under positive selection i n a given functional category
was assessed by a randomization test. In a categor y with
asumofN codon sites over all constituent genes, the
observed number of sites under selection, n, was com-
pared to the empirical distribution of the number of
selected sites, which was derived by choosing N codon
sit es from random genes in any functional categ ory and
Nilsson et al. Genome Biology 2011, 12:R65
/>Page 14 of 17
counting the number of sites under selection, n’ ,then
repeating this process 10,000 times. A two-tailed t-test
was performed to estimate if the observed number of
sites under positive selection in a certain category
deviated significantly from the random expectation.
Additional material
Additional file 1: Yeast strain isolates used in the study.
Additional file 2: Non-synonymous SNPs in S. cerevisiae genes
studied. The nature of each amino acid change for each changed amino
acid in each strain is shown for each of 3,639 genes.
Additional file 3: Non-synonymous SNPs in S. paradoxus genes
studied. The nature of each amino acid change for each changed amino
acid in each strain is shown for each of 3,691 genes.
Additional file 4: Synonymous SNPs in S. cerevisiae genes studied.
The identity of each affected amino acid in each affected strain is shown
for each of 3,737 genes.
Additional file 5: Synonymous SNPs in S. paradoxus genes studied.
The identity of each affected amino acid in each affected strain is shown
for each of 3,756 genes.
Additional file 6: Chromosomal location of protein-coding region
SNPs in the different strains of S. cerevisiae. The direction of each
gene as well as the base change in each SNP and its affect on codons
and encoded amino acids is shown.
Additional file 7: Chromosomal location of protein-coding region
SNPs in the different strains of S. paradoxus. The direction of each
gene as well as the base change in each SNP and its affect on codons
and encoded amino acids is shown.
Additional file 8: FastA file containing the ORF DNA sequence of all
analyzed S. cerevisiae genes. Strand, phase, chromosone and genomic
start/finish coordinates are specified in the header line.
Additional file 9: FastA file containing the protein sequence
translated from the ORFs of all analyzed S. cerevisiae genes.
Additional file 10: Fraction of amino acid residues for each protein
that are predicted by the PSIPRED method to adopt a-helical
conformation, using a confidence value threshold of 8.
Additional file 11: Fraction of amino acid residues for each protein
that are predicted by the PSIPRED method to adopt b-sheet
conformation, using a confidence value threshold of 8.
Additional file 12: Fraction of amino acid residues for each protein
that are predicted by the VSL2 method to adopt intrinsically
disordered conformation, using a confidence value threshold of 0.8.
Additional file 13: Fraction of amino acid residues for each protein
that are predicted by the VSL2 method to adopt intrinsically
disordered conformation, using a confidence value threshold of 0.5.
Additional file 14: Fixation index of each investigated protein
coding gene along with the associated P-value. The FI was calculated
using the MKtest program and is defined as the ratio (dN/dS)/(pN/pS).
Additional file 15: Fixation index calculated for the merged aligned
regions in a-helical, b-strand, or intrinsically disordered
conformation from all analyzed proteins, with or without removal
of genes with a fixation index deviating more than three standard
deviations from the mean of the entire data set.
Additional file 16: Amino acid positions of functional sites in each
investigated protein as predicted by the Limacs method for known
pfam domains mapped to the proteins.
Abbreviations
FEL: fixed effects likelihood; FI: fixation index (calculated in the McDonald-
Kreitman test); IDR: intrinsically disordered region; MIPS: Munich Information
Center for Protein Sequences; ORF: open reading frame; SNP: single
nucleotide polymorphism.
Acknowledgements
The authors thank colleagues at Södertörn University and the Karolinska
Institute for helpful discussions. The work was supported by a grant from
the Baltic Sea Foundation and AW is also supported by grants from the
Swedish Research Council and the Swedish Cancer Society.
Author details
1
School of Life Sciences, Södertörn University, SE-141 89 Huddinge, Sweden.
2
Clinical Research Center, Novum Level 5, Department of Laboratory
Medicine and Center for Biosciences, Karolinska Institutet, SE-141 86
Huddinge, Sweden.
Authors’ contributions
JN was involved in the conception and planning of the study, carried out
the bioinformatic studies and was involved in interpretation of results and
drafting the manuscript. MG was involved in the conception and planning
of the study as well as interpretation of results and preparation of the
manuscript. AW was involved in the conception and planning of the study
as well as interpretation of results and writing the manuscript. All authors
read and approved the final manuscript.
Competing interests
The authors declare that they have no competing interests.
Received: 26 January 2011 Revised: 31 May 2011
Accepted: 19 July 2011 Published: 19 July 2011
References
1. Kimura M: Evolutionary rate at the molecular level. Nature 1968,
217:624-626.
2. MacCallum C, Hill E: Being positive about selection. PLoS Biol 2006, 4:e87.
3. Sabeti P, Reich D, Higgins J, Levine H, Richter D, Schaffner S, Gabriel S,
Platko J, Patterson N, McDonald G, Ackerman H, Campbell S, Altshuler D,
Cooper R, Kwiatkowski D, Ward R, Lander E: Detecting recent positive
selection in the human genome from haplotype structure. Nature 2002,
419:832-837.
4. Tang K, Thornton K, Stoneking M: A new approach for using genome
scans to detect recent positive selection in the human genome. PLoS
Biol 2007, 5:e171.
5. Yang Z: PAML 4: phylogenetic analysis by maximum likelihood. Mol Biol
Evol 2007, 24:1586-1591.
6. Chen S, Hung C, Xu J, Reigstad C, Magrini V, Sabo A, Blasiar D, Bieri T,
Meyer R, Ozersky P, Armstrong J, Fulton R, Latreille J, Spieth J, Hooton T,
Mardis E, Hultgren S, Gordon J: Identification of genes subject to positive
selection in uropathogenic strains of Escherichia coli: a comparative
genomics approach. Proc Natl Acad Sci USA 2006, 103:5977-5982.
7. Nielsen R, Bustamante C, Clark A, Glanowski S, Sackton T, Hubisz M, Fledel-
Alon A, Tanenbaum D, Civello D, White T, Sninsky J, Adams M, Cargill M: A
scan for positively selected genes in the genomes of humans and
chimpanzees. PLoS Biol 2005, 3:e170.
8. Petersen L, Bollback J, Dimmic M, Hubisz M, Nielsen R: Genes under
positive selection in Escherichia coli. Genome Res 2007, 17:1336-1343.
9. Ramensky V, Bork P, Sunyaev S: Human non-synonymous SNPs: server
and survey. Nucleic Acids Res 2002, 30:3894-3900.
10. The International HapMap Consortium: The International HapMap Project.
Nature 2003, 426:789-796.
11. Kirschner M, Gerhart J: Evolvability. Proc Natl Acad Sci USA 1998,
95:8420-8427.
12. Pigliucci M: Is evolvability evolvable?. Nat Rev Genet 2008, 9:75-82.
13. Pigliucci M: Do we need an extended evolutionary synthesis?. Evol Int J
Org Evol 2007, 61:2743-2749.
14. Cowen L, Lindquist S: Hsp90 potentiates the rapid evolution of new
traits: drug resistance in diverse fungi. Science 2005, 309
:2185-2189.
15.
Parter M, Kashtan N, Alon U: Facilitated variation: how evolution learns
from past environments to generalize to new environments. PLoS
Comput Biol 2008, 4:e1000206.
16. Wagner A: Robustness, evolvability, and neutrality. FEBS Lett 2005,
579:1772-1778.
Nilsson et al. Genome Biology 2011, 12:R65
/>Page 15 of 17
17. Wagner A: Robustness and evolvability: a paradox resolved. Proc Biol Sci
2008, 275:91-100.
18. Dunker A, Oldfield C, Meng J, Romero P, Yang J, Chen J, Vacic V,
Obradovic Z, Uversky V: The unfoldomics decade: an update on
intrinsically disordered proteins. BMC Genomics 2008, 9(Suppl 2):S1.
19. Fink A: Natively unfolded proteins. Curr Opin Struct Biol 2005, 15:35-41.
20. Lobley A, Swindells M, Orengo C, Jones D: Inferring function using
patterns of native disorder in proteins. PLoS Comput Biol 2007, 3:e162.
21. Wright PE, Dyson HJ: Linking folding and binding. Curr Opin Struct Biol
2009, 19:31-38.
22. Tompa P, Dosztanyi Z, Simon I: Prevalent structural disorder in E. coli and
S. cerevisiae proteomes. J Proteome Res 2006, 5:1996-2000.
23. Bogatyreva NS, Finkelstein AV, Galzitskaya OV: Trend of amino acid
composition of proteins of different taxa. J Bioinformatics Comput Biol
2006, 4:597-608.
24. Goffeau A, Barrell B, Bussey H, Davis R, Dujon B, Feldmann H, Galibert F,
Hoheisel J, Jacq C, Johnston M, Louis E, Mewes H, Murakami Y,
Philippsen P, Tettelin H, Oliver S: Life with 6000 genes. Science 1996,
274:546.
25. Ghaemmaghami S, Huh W, Bower K, Howson R, Belle A, Dephoure N,
O’Shea E, Weissman J: Global analysis of protein expression in yeast.
Nature 2003, 425:737-741.
26. Cliften P, Sudarsanam P, Desikan A, Fulton L, Fulton B, Majors J,
Waterston R, Cohen B, Johnston M: Finding functional features in
Saccharomyces genomes by phylogenetic footprinting. Science 2003,
301:71-76.
27. Dujon B, Sherman D, Fischer G, Durrens P, Casaregola S, Lafontaine I,
Montigny JD, Marck C, Neuvéglise C, Talla E, Goffard N, Frangeul L, Aigle M,
Anthouard V, Babour A, Barbe V, Barnay S, Blanchin S, Beckerich J, Beyne E,
Bleykasten C, Boisramé A, Boyer J, Cattolico L, Confanioleri F, Daruvar AD,
Despons L, Fabre E, Fairhead C, Ferry-Dumazet H, et al: Genome evolution
in yeasts. Nature 2004, 430:35-44.
28. Kellis M, Patterson N, Endrizzi M, Birren B, Lander E: Sequencing and
comparison of yeast species to identify genes and regulatory elements.
Nature 2003, 423:241-254.
29. Rossignol T, Lechat P, Cuomo C, Zeng Q, Moszer I, d’Enfert C: CandidaDB: a
multi-genome database for Candida species and related
Saccharomycotina.
Nucleic Acids Res 2008,
, 36 Database: D557-561.
30. Liti G, Carter D, Moses A, Warringer J, Parts L, James S, Davey R, Roberts I,
Burt A, Koufopanou V, Tsai I, Bergman C, Bensasson D, O’Kelly M,
Oudenaarden Av, Barton D, Bailes E, Nguyen A, Jones M, Quail M,
Goodhead I, Sims S, Smith F, Blomberg A, Durbin R, Louis E: Population
genomics of domestic and wild yeasts. Nature 2009, 458:337-341.
31. Schaefer C, Schlessinger A, Rost B: Protein secondary structure appears to
be robust under in silico evolution while protein disorder appears not
to be. Bioinformatics 2010, 26:625-631.
32. Tompa P, Kalmar L: Power law distribution defines structural disorder as
a structural element directly linked with function. J Mol Biol 2010,
403:346-350.
33. Chen J, Romero P, Uversky V, Dunker A: Conservation of intrinsic disorder
in protein domains and families: I. A database of conserved predicted
disordered regions. J Proteome Res 2006, 5:879-887.
34. Ruepp A, Zollner A, Maier D, Albermann K, Hani J, Mokrejs M, Güldener ITU,
Mannhaupt G, Münsterkötter M, Mewes H: The FunCat, a functional
annotation scheme for systematic classification of proteins from whole
genomes. Nucleic Acids Res 2004, 32:5539-5545.
35. Mayrose I, Doron-Faigenboim A, Bacharach E, Pupko T: Towards realistic
codon models: among site variability and dependency of synonymous
and non-synonymous rates. Bioinformatics 2007, 23:i319-327.
36. Nozawa M, Suzuki Y, Nei M: Reliabilities of identifying positive selection
by the branch-site and the site-prediction methods. Proc Natl Acad Sci
USA 2009, 106:6700-6705.
37. Luo C, Lu X, Stubbs L, Kim J: Rapid evolution of a recently retroposed
transcription factor YY2 in mammalian genomes. Genomics 2006,
87:348-355.
38. Maiti S, Doskow J, Sutton K, Nhim R, Lawlor D, Levan K, Lindsey J,
Wilkinson M: The Pem homeobox gene: rapid evolution of the
homeodomain, X chromosomal localization, and expression in
reproductive tissue. Genomics 1996, 34:304-316.
39. Zhang J, Webb D, Podlaha O: Accelerated protein evolution and origins
of human-specific features: Foxp2 as an example. Genetics 2002,
162:1825-1835.
40. Beskow A, Wright AP: Comparative analysis of regulatory transcription
factors in Schizosaccharomyces pombe and budding yeasts. Yeast 2006,
23:929-935.
41. Arnold F, Wintrode P, Miyazaki K, Gershenson A: How enzymes adapt:
lessons from directed evolution. Trends Biochem Sci 2001, 26:100-106.
42. Bloom J, Wilke C, Arnold F, Adami C: Stability and the evolvability of
function in a model protein.
Biophys J 2004, 86:2758-2764.
43.
Basu M, Carmel L, Rogozin I, Koonin E: Evolution of protein domain
promiscuity in eukaryotes. Genome Res 2008, 18:449-461.
44. Shimizu K, Toh H: Interaction between intrinsically disordered proteins
frequently occurs in a human protein-protein interaction network. J Mol
Biol 2009, 392:1253-1265.
45. King M, Wilson A: Evolution at two levels in humans and chimpanzees.
Science 1975, 188:107-116.
46. Hsia C, McGinnis W: Evolution of transcription factor function. Curr Opin
Genet Dev 2003, 13:199-206.
47. Tirosh I, Barkai N, Verstrepen KJ: Promoter architecture and the
evolvability of gene expression. J Biol 2009, 8:95.
48. Choi JK, Kim YJ: Epigenetic regulation and the variability of gene
expression. Nat Genet 2008, 40:141-147.
49. Tirosh I, Reikhav S, Levy AA, Barkai N: A yeast hybrid provides insight into
the evolution of gene expression regulation. Science 2009, 324:659-662.
50. Wittkopp PJ, Haerum BK, Clark AG: Evolutionary changes in cis and trans
gene regulation. Nature 2004, 430:85-88.
51. Lynch V, Wagner G: Resurrecting the role of transcription factor change
in developmental evolution. Evolution 2008, 62:2131-2154.
52. Liu J, Narayanan B, Oldfield C, Su E, Uversky V, Dunker A: Intrinsic disorder
in transcription factors. Biochemistry 2006, 45:6873-6888.
53. McEwan IJ, Dahlman-Wright K, Ford J, Wright AP: Functional interaction of
the c-Myc transactivation domain with the TATA binding protein:
evidence for an induced fit model of transactivation domain folding.
Biochemistry 1996, 35:9584-9593.
54. Radhakrishnan I, Perez-Alvarado GC, Parker D, Dyson HJ, Montminy MR,
Wright PE: Solution structure of the KIX domain of CBP bound to the
transactivation domain of CREB: a model for activator:coactivator
interactions. Cell 1997, 91:741-752.
55. Ferreira ME, Hermann S, Prochasson P, Workman JL, Berndt KD, Wright AP:
Mechanism of transcription factor recruitment by acidic activators. J Biol
Chem 2005, 280:21779-21784.
56. Hermann S, Berndt KD, Wright AP: How transcriptional activators bind
target proteins. J Biol Chem 2001,
276:40127-40132.
57. Sanger
FTP [ />58. Saccharomyces Genome Database [].
59. Rice P, Longden I, Bleasby A: EMBOSS: the European Molecular Biology
Open Software Suite. Trends Genet 2000, 16:276-277.
60. Subramanian A, Weyer-Menkhoff J, Kaufmann M, Morgenstern B: DIALIGN-
T: an improved algorithm for segment-based multiple sequence
alignment. BMC Bioinformatics 2005, 6:66.
61. Anisimova M, Nielsen R, Yang Z: Effect of recombination on the accuracy
of the likelihood method for detecting positive selection at amino acid
sites. Genetics 2003, 164:1229-1236.
62. Sawyer S: Statistical tests for detecting gene conversion. Mol Biol Evol
1989, 6:526-538.
63. Jones D: Protein secondary structure prediction based on position-
specific scoring matrices. J Mol Biol 1999, 292:195-202.
64. Peng K, Radivojac P, Vucetic S, Dunker A, Obradovic Z: Length-dependent
prediction of protein intrinsic disorder. BMC Bioinformatics 2006, 7:208.
65. Bordoli L, Kiefer F, Schwede T: Assessment of disorder predictions in
CASP7. Proteins 2007, 69(Suppl 8):129-136.
66. Jones D, Taylor W, Thornton J: A model recognition approach to the
prediction of all-helical membrane protein structure and topology.
Biochemistry 1994, 33:3038-3049.
67. PFAM database [ />Pfam25.0/pdbmap.gz].
68. Pond S, Frost S, Muse S: HyPhy: hypothesis testing using phylogenies.
Bioinformatics 2005, 21:676-679.
Nilsson et al. Genome Biology 2011, 12:R65
/>Page 16 of 17
69. Tajima F, Nei M: Estimation of evolutionary distance between nucleotide
sequences. Mol Biol Evol 1984, 1 :269-285.
70. Hasegawa M, Kishino H, Yano T: Dating of the human-ape splitting by a
molecular clock of mitochondrial DNA. J Mol Evol 1985, 22:160-174.
71. McDonald J, Kreitman M: Adaptive protein evolution at the Adh locus in
Drosophila. Nature 1991, 351:652-654.
72. Thornton T: Libsequence: a C++ class library for evolutionary genetic
analysis. Bioinformatics 2003, 19:2325-2327.
73. Kimura M: The Neutral Theory of Molecular Evolution Cambridge: Cambridge
Univeristy Press; 1983.
74. Fay J, Wycoff G, Wu C-I: Positive and negative selection on the human
genome. Genetics 2001, 158:1227-1234.
75. Charlesworth J, Eyre-Walker A: The McDonald-Kreitman test and slightly
deleterious mutations. Mol Biol Evol 2008, 25:1007-1015.
76. Chakrabarti S, Lanczycki C: Analysis and prediction of functionally
important sites in proteins. Protein Sci 2007, 16:4-13.
77. Lanczycki C, Chakrabarti S: A tool for the prediction of functionally
important sites in proteins using a library of functional templates.
Bioinformation 2008, 2:279-283.
78. Finn R, Tate J, Mistry J, Coggill P, Sammut S, Hotz H, Ceric G, Forslund K,
Eddy S, Sonnhammer E, Bateman A: The Pfam protein families database.
Nucleic Acids Res 2008, 36:D281-D288.
doi:10.1186/gb-2011-12-7-r65
Cite this article as: Nilsson et al.: Proteome-wide evidence for enhanced
positive Darwinian selection within intrinsically disordered regions in
proteins. Genome Biology 2011 12:R65.
Submit your next manuscript to BioMed Central
and take full advantage of:
• Convenient online submission
• Thorough peer review
• No space constraints or color figure charges
• Immediate publication on acceptance
• Inclusion in PubMed, CAS, Scopus and Google Scholar
• Research which is freely available for redistribution
Submit your manuscript at
www.biomedcentral.com/submit
Nilsson et al. Genome Biology 2011, 12:R65
/>Page 17 of 17