Báo cáo y học: "Integrated miRNA and mRNA expression profiling of mouse mammary tumor models identifies miRNA signatures associated with mammary tumor lineage" ppt
Bạn đang xem bản rút gọn của tài liệu. Xem và tải ngay bản đầy đủ của tài liệu tại đây (4.99 MB, 17 trang )
Integrated miRNA and mRNA expression profiling
of mouse mammary tumor models identifies
miRNA signatures associated with mammary
tumor lineage
Zhu et al.
Zhu et al. Genome Biology 2011, 12:R77
(16 August 2011)
RESEARCH Open Access
Integrated miRNA and mRNA expression profiling
of mouse mammary tumor models identifies
miRNA signatures associated with mammary
tumor lineage
Min Zhu
1
, Ming Yi
2
, Chang Hee Kim
3
, Chuxia Deng
4
,YiLi
5
, Daniel Medina
6
, Robert M Stephens
2
and
Jeffrey E Green
1*
Abstract
Background: MicroRNAs (miRNAs) are small, non-coding, endogenous RNAs involved in regulating gene
expression and protein translation. miRNA expression profiling of human breast cancers has identified miRNAs
related to the clinical diversity of the disease and potentially provides novel diagnostic and prognostic tools for
breast cancer therapy. In order to further understand the associations between oncogenic drivers and miRNA
expression in sub-types of breast cancer, we performed miRNA expression profiling on mammary tumors from
eight well-characterized genetically engineered mouse (GEM) models of human breast cancer, including MMTV-H-
Ras,-Her2/neu,-c-Myc,-PymT,-Wnt1 and C3(1)/SV40 T/t-antigen transgenic mice, BRCA1
fl/fl
;p53
+/-
;MMTV-cre knock-
out mice and the p53
fl/fl
;MMTV-cre transplant model.
Results: miRNA expression patterns classified mouse mammary tumors according to luminal or basal tumor
subtypes. Many miRNAs found in luminal tumors are expressed during normal mammary development. miR-135b,
miR-505 and miR-155 are expressed in both basal human and mouse mammary tumors and many basal-associated
miRNAs have not been previously characterized. miRNAs associated with the initiating oncogenic event driving
tumorigenesis were also identified. miR-10b, -148a, -150, -199a and -486 were only expressed in normal mammary
epithelium and not tumors, suggesting that they may have tumor suppressor activities. Integrated miRNA and
mRNA gene expression analyses greatly improved the identification of miRNA targets from potential targets
identified in silico.
Conclusions: This is the first large-scale miRNA gene expression study across a variety of relevant GEM models of
human breast cancer demonstrating that miRNA expression is highly associated with mammary tumor lineage,
differentiation and oncogenic pathways.
Background
MicroRNAs (miRNAs) are small (19 to 25 nucleotides),
non-coding, endogenous RNAs that were first discov-
ered in Caenorhabditis elegans during genetic screens
for regulators of developmental timing [1-3]. Altered
expression of miRNAs has been associated with many
human diseases, including cancer [4,5]. Recently,
miRNAs have been shown to play important roles in
tumorigenesis through their altered regulation of genes
involved in cancer development and maintenance. Iorio
et al. [4] described a breast cancer signature composed
of 29 miRNAs that distinguished tumors from normal
tissue with an accuracy of 100%. Several miRNAs - miR-
10b, miR-373, miR-520c, miR-335 and miR-206 - appear
to promote late stages of mammary tumor progression
by impacting critical steps in the metastatic cascade
such as epithelial-to-mesenchymal transition (EMT),
apoptosis, and angiogenesis [6].
* Correspondence:
1
Transgenic Oncogenesis and Genomics Section, Laboratory of Cell Biology
and Genetics, Center for Cancer Research, National Cancer Institute, Building
37, Room 4054, 37 Convent Dr., Bethesda, MD 20892, USA
Full list of author information is available at the end of the article
Zhu et al. Genome Biology 2011, 12:R77
/>© 2011 Zhu et al.; licensee BioMed Central Ltd. This is an open access article distributed under the terms of the Creative Commons
Attribution Lice nse (http://c reativecommons.org/licenses/by/2.0), which permi ts unrestricted use, distribution, and reproduction in
any medium, provided the original work is properly cited.
In addition to mRNA gene expressio n profiling,
miRNA expression analyses of human breast cancers
have furt her demonstrated another laye r of the molecu-
lar diversity of this disease and may potentially be a use-
ful diagnostic and prognostic tool for breast cancer
therapy and treatment. Blenkiron et al. [7] observed that
a subset of miRNAs were differentially expressed in the
subgroups of mammary tumors originally described by
Sorlie et al. [8]: luminal A, luminal B, basal-like, HER2+
and normal-like breast tumor subtypes. Moreover, speci-
fic miRNAs have been associated with clinicopathologi-
cal features of breast tumors, such as grade, stage,
vascular invasion, estrogen receptor (ER), progesterone
receptor, and HER2 status [7,9]. Interestingly, a group of
miRNAs, including miR-221/222, miR-206, miR-18a,
and miR-22, have been reported to be involved in the
regulation of ERa at either the transcriptional or post-
transcriptional level [10,11], thereby presenting attractive
targets for therapeutic intervention in ERa-negative
breast cancer. The molecular distinctions between the
various subtypes of breast cancer are critical since the y
are highly associated with prognosis and response to
therapies. Patients with tumors of a basal, hormone
receptor- and Her2-nega tive phenotype generally have a
poorer prognosis than patients whose tumors express
hormone receptors and are responsive to hormone
therapy.
Genetically engineered mouse (GEM) models have
been designed to emulate genetic alterations found in
human breast cancers. Targeted over-expression of a
particular oncogene or knockout of a specific tumor
suppressor gene in a well defined genetic background
offers particular advantages for studying mammary
tumor progression initiated by genetic aberrations rele-
vant to human brea st cancer [12]. Moreover, integrated
human and mouse gene expression analyses of mam-
mary tumors have revealed that certain mouse tumor
models share important similarities to subsets of human
breast tumors, including proliferation [12] and tumor
subtype signatures [ 13]. In particular, models with loss
of function of p53, Rb or BRCA1 share molecular fea-
tures with the human basal-subtype of breast cancer
[14].
In this study, we have performed global miRNA
expression profiling on eight well-characterized GEM
models of human breast cancer (Table 1), including
mouse mammary tumor virus (MMTV) lo ng terminal
repeat (LTR) promoter driven H-Ras [15], Her2/neu
[16], c-Myc [17], polyoma middle T antigen (PymT)
[18], and Wnt1 [19] transgenic mice; C3(1)/simian virus
40 (SV40) T/t-antigens (C3(1)/Tag) transgenic mice
[20]; p53
fl/fl
;MMTV-cre transplant model mice [21];
and BRCA1
fl/fl
;p53
+/-
;MMTV-cre mice [22]. We have
identified significant differences in miRNA expression
patterns between tumors with luminal or basal-features
and for tumors arising from specific initiating oncogenic
drivers. We further performed an integrated analysis
across all of the mouse mammary tumor samples to
identify miRNAs whose expression correlated with the
inverse expression of mRNA targets predicted in silico.
These analyses h ave identified potential in vivo mRNA
targe ts of specific miRNAs in the context of these mod-
els of m ammary cancer. To our knowledge, this is the
first large-scale analysis of miRNA expression in multi-
ple GEM models of mammary cancer and suggests that
miRNA expression patterns strongly reflect the lineage
subtype of the tumor.
Results
miRNAs are differentially expressed among GEM
mammary tumors
A custom miRNA microarray platform was used to gen-
erate miRNA expression profiles of the eight GEM mod-
els of human breast cancer, including 42 primary
tumors from individual mice and 5 normal mammary
glands from 17.5-day-pregnant female mice (Table 1).
Since mammary tumors are composed primarily of
epithelial cells, we chose to use pregnant mammary
glands that are highly enriched for mammary epithelial
cells, which are much less represented in virgin mouse
mammary glands that contain a very high component of
fat cells.
Since the p53
fl/fl
;MMTV-cre and BRCA1
fl/fl
;p53
+/-
;
MMTV-cre tumors were derived from mice with differ-
ent strain backgrounds compared to the other models in
the FVB/N background (Table 1), we initially deter-
mined whether significant differences in miRNA were
associated with the various background strains. We
identified 22 miRNAs that are differentially expressed in
17.5-day-pregnant mammary glands from FVB, Balb/C
and 129B6/FVB mouse strains (Additional file 1). Hier-
archical clustering of the expre ssion of these miRNAs
across all of the mouse mammary tumor models indi-
cated that the expression levels of the 22 miRNAs in the
tumors were not related to the background strain of the
mouse (Additional file 2).
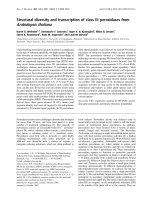
Unsupervised hierarchical cluster analysis of miRNA
gene expression data separated the mouse tumors and
normal mammary gland tissues into several clusters th at
were associated with specific tumor m odels (Figure 1).
Tumors from the p53
fl/fl
;MMTV-cre transplant, C3(1)/
Tag and BRCA1
fl/fl
;p53
+/-
;MMTV-cre models formed
one major cluster (cluster I). However, the p53
fl/fl
;
MMTV-cre transplant and C3(1)/Tag models shared the
greatest similarities in miRNA expression patterns (clus-
ter Ia); the BRCA1
fl/fl
;p53
+/-
;MMT V-cre model clustered
separately (cluster Ib). In contrast, tumors from four of
the five MMTV promoter-driven transgenic mice
Zhu et al. Genome Biology 2011, 12:R77
/>Page 2 of 16
(MMTV-H-Ras, MMTV-PymT, MMTV-Her2/neu and
MMTV-Wnt1) formed a second major cluster (cluster
II). Furthermore, the normal mammar y gland tissues
from pregnant FVB mice clustered with this group of
tumors, suggesting that they may share similar molecu-
lar features related to their lineage of origin. Interest-
ingly, a group of human breast tumors has been
classified as having a ‘normal’ subtype with similarities
in a gene signature found in normal breast epithelium
[7,23]. Within cluster II, MMTV-Wnt1 and MMTV-
Her2/neu each formed separate clusters, whereas normal
mammary glands, MMTV-H-Ras and 2/6 MMTV-PymT
tumors clustered together. A subcluster containing four
ofthefiveMMTV-c-Myc tumors and four of the six
MMTV-PymT tumors was separated from the remaining
three subgroups in cluster II.
These results suggest that the miRNA expression pat-
terns are largely determined by the tumor lineage since
the tumors identified in cluster I have been associated
with the basal tumor phenotype, whereas the tumors in
cluster II have been associated with a phenotype that is
clearly distinguished from basal tumors and displays
some luminal features (Additional file 3). The inclusion
of the normal mammary tissue samples into cluster II
further supports the association of this cluster with a
luminal phenotype.
Validation of miRNA expression
A subset of miRNAs that were identified to be differen-
tially expressed among the mouse models by microarray
analysis was selected for further validation. Real-time
RT-PCR was performed to assess miRNA expression in
samples from the various tumor models. Comparison of
expression levels b etween the miRNA microarray data
and the PCR results demonstrated a strong correlation
between the two platforms for miR-107, -10b, -193,
-200b, -494, -505, -7a, and let7f; a modest association
for miR-30b, -412; and weak or no association with
miR-135b, -155, and -301 (Additional file 4). The poor
correlation for some of the miRNAs may be due to dif-
ferences in sensitivities between the assays, PCR pri-
mers, alternative 3’ modifications of miRNAs that could
significantly influence the s ensitivity of the PCR assays
or the robustness of the probes on the array.
miRNA features are associated with mammary tumor
differentiation
We performed an analysis of miRNA express ion data to
identify miRNAs that were differentially expressed (P ≤
0.01, false discovery rate (FDR) ≤ 0%) between the
mouse basal-type (C3(1)/Tag, p53
fl/fl
;MMTV-cre and
BRCA1
fl/fl
;p53
+/-
;MMTV-cre) and luminal-type (MMTV-
H-Ras,-Her2/neu,-c-Myc,-PymT, and -Wnt1, excluding
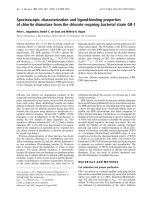
the normal samples) mammary tumors. As depicted in
the heatmap in Figure 2, multiple miRNAs are distinctly
expressed between the basal-like and luminal-type mam-
mary tumors. The normal m ammary gland tissue sam-
ples also clustered with the luminal-type mammary
tumors.
A total of 122 miRNAs (430 pr obes) were highly
expressed in the basal-like mammary tumors compared
to the luminal-type mammary tumors. Seventy-three
miRNAs(257probes)werehighlyexpressedinthe
luminal- type but not in the basal-like mammary tumors
(Additional file 5). Table 2 lists the top 20 miRNAs that
were highly expressed in the basal-like and luminal-type
mammary tumors.
miRNAs associated with the initiating oncogenic event
Analysis of 334 unique miRNAs (that are each repre-
sented by fo ur probes on the microarray chip) d emon-
strated that despite di fferent genetic drivers used to
initiate tumorigenesis, several mouse models share very
similar miRNA expression profiles (Figure 1). In order
Table 1 Summary of mouse mammary tumor models
Model Number of tumors Promoter Strain Reference
Basal
C3(1)/SV40 T/t-antigens 5 C3(1) FVB [20]
p53
fl/fl
;MMTV-cre transplant 7 MMTV Balb/C [21]
BRCA1
fl/fl
;p53
+/-
;MMTV-cre 5 MMTV 129B6/FVB [22]
Luminal
MMTV-H-Ras 5 MMTV FVB [15]
MMTV-Her2/neu 5 MMTV FVB [16]
MMTV-c-Myc 5 MMTV FVB [17]
MMTV-PyMT 6 MMTV FVB [18]
MMTV-Wnt1 4 MMTV FVB [19]
MMTV: mouse mammary tumor virus promoter, often expressed in virgin mammary gland epithelium, induced with lactation; often expressed at ectopic sites (for
example, lymphoid cells, salivary gland, others). C3(1): 5’ flanking region of the C3(1) component of the rat prostate steroid bindin g protein, expressed in
mammary ductal cells and at low levels in other tissues. PyMT: polyoma middle T antigen.
Zhu et al. Genome Biology 2011, 12:R77
/>Page 3 of 16
to further define miRNA features that are associated
with specific oncogenes or oncogenic pathways, and to
determine the fundamental differences in miRNA
expression between the normal mammary gland s and
mammary tumo rs, we compared the miRNA expression
profi les across all of the murine tumor models and nor-
mal mammary glands.
miRNA expression v alues we re converted to z-scores
representing the relative expression of each miRNA probe
compared to all probes on the array. Model-specific
miRNAs were then identified as those most highly
expressed among all the samples with a z-score > 0.75, but
with no more than two samples from any of the other
models having their miRNA expression z-scores higher
than the median for the model being evaluated. This algo-
rithm identified clusters of miRNAs that are most highly
expressed in one but not all of the other mouse models.
The expression of these miRNAs, therefore, may be
relate d to the initiatin g oncogenic event and may poten-
tially contribute to mammary tumor initiat ion or
Cluster I Cluster II
Ia
Ib
p53
;MMTV-cre transplant
c3(1) SV40 T/t-antigens
Brca1
;p53
;MMTV-cre
MMTV-c-Myc
MMTV-PymT
MMTV-Her2
Normal mammary
MMTV-Hras
MMTV-Wnt1
fufl
fvfl
Figure 1 Unsupervised hierarchical clustering analysis of miRNA gene expression of 41 ma mmary tumors derived from 8 genetically
engineered mouse models and samples of 5 normal mammary glands from 17.5-day-pregnant FVB/N mice. The heatmap shows the
expression of 1,336 mouse miRNAs at the probe level. Heatmap colors represent relative miRNA expression as indicated in the color key.
Zhu et al. Genome Biology 2011, 12:R77
/>Page 4 of 16
progression (Figure 3). A list of model-specific miRNAs is
provided in Additional file 6 for all of the GEM models
except for BRCA1
fl/fl
;p53
+/-
;MMTV-cre, where no model-
specific miRNAs were identified. In addition, we identified
a list of miRNAs that are highly expressed only in the nor-
mal mammary gland tissues, but not in any o f the tumor
models (Additional file 6).
Identification of potential mRNA targets of miRNAs
miRNA recognizes its target mRNA by binding to a 6-
to 8-mer ‘seed’ sequence located on the 3’ UTR of the
mRNA. Several computational algorithms have been
developed in predicting the potential miRNA targets
based on the ‘seed’ sequence, and the three commonly
used algorithms are TargetScan, miRanda and PicTar,
available through the Sanger miRBase. However, these
computer algorithms generate a large portion of false
positive miRNA targets. In order to identify potential
genes whose mRNAs might be targeted by specific
miRNAs, we performed an inverse correlation analysis
at the probe level between the expression of a specific
miRNA and the expression levels of all the predicted
mRNA targets of the miRNA by TargetScan for all of
the mammary tumors and normal tissues. This
approach identified candidate miRNA target genes that
are down-regulated at the transcriptional level and are
inversely correlated with the expression of the miRNA
in the same corresponding samples. Our analysis
yielded putative target mRNAs for a subset of the
model-specific miRNAs (Additional file 7), basal-like
and luminal-type specific miRNAs (Additional file 8).
Only a small subset of the total TargetScan predicted
genes were identified as potential miRNA target genes
by this a nalysis. For instance, the expression of only 19
out of 156 TargetScan predicted targets were inversely
correlated with the expression of miR-10b, and 9 out
of 101 for miR-412 (Table 3). Similarly, as shown in
Table4,only12outof245predictedtargetswere
found to show an inverse correlation with expression
of miR-494.
Basal
Luminal
p53 ;MMTV-cre transplant
c3(1) SV40 T/t-antigens
Brca1 ;p53;MMTV-cre
MMTV-c-Myc
MMTV-PymT
MMTV-Her2
Normal mammary
MMTV-Hras
MMTV-Wnt1
fufl
fvfl
Figure 2 Hierarchical clustering analysis of basal- and luminal-specific miRNA gene expression among mouse mammary tumor
subtypes. miRNAs that distinguished basal from luminal tumor subtypes were identified and used in this hierarchical clustering of all tumor
samples. A color-coded matrix below the dendrogram identifies each sample: red, basal like; green, luminal. The normal mammary samples were
then integrated into the heatmap for comparison.
Zhu et al. Genome Biology 2011, 12:R77
/>Page 5 of 16
Furthermore, we plotted the global distribution of the
Pearson correlation coefficients between an miRNA of
interest and either all mRNAs that are probed by the
Affymetrix array ch ip (430A 2.0) or only th ose mRNAs
that are predicted targets of the miRNA. For instance,
for miRNAs miR-10b, miR-412 and miR-494 , the distri-
bution curv e of the correlation coefficients for all
mRNAs and that for target mRNAs are notably differ-
ent, with the latter showing a distinct shift that extended
towards negative Pearson correlation coefficient s (Addi-
tional file 9). This pattern is a departure from a normal
distribution and indicates that the tissue transcript levels
of a subs et of mRNAs, which have a predicted miRNA
targ et sequence in the 3’ UTR, are reduced by miR-10b,
miR-412 and miR-494, respectively. Such a shift in pat-
terns indicates an enrichment for the corresponding
negatively correlated mRNAs within the predicted tar-
gets(morelikelytobethe‘tr ue’ targets of these miR-
NAs) of these d ifferentially expressed miRNAs, which
were statistically significant as assessed by Fisher’sexact
test (see Materials and methods).
Over-expression of candidate miRNA results in inhibition
of its target mRNAs in breast cancer cells
In order to determine the functional relationship
between an miRNA and its potential targets identified
by the miRNA-mRNA inverse correlation analysis, we
selected two miRNAs, miRNA- 494 and miRNA-412 , for
further analysis.
Expression of miR-494 was highly associated with the
c-Myc transgenic model (Table 3), and with the luminal-
type mammary tumors (Table 4). Moreover, all four
probes on the array for miR-494 have 12 predicted tar-
get genes in common. These 12 target genes were a na-
lyzed using Ingenuity Pathway Analysis software
(Ingenuity Systems, Inc., Redwood City, CA, USA). Core
pathway analysis revealed that 4 of these 12 target genes
- Bmi1 [24,25], Birc4 [26], Bmpr2 [27] and Ptpn12
[28,29] - have been fo und to be significantly deregulated
in cancer (Additional file 10). Expression of miR-412
(one probe) was shown to be highly associated with C3
(1)/Tag tumors and nine potential target genes (Table
3). The expression of four miR-412 probes was also
associated with basal-like tumors (Table 4) and four pre-
dicted target genes, including Bmpr1a, Foxo3 and Spry4
(Additional file 8). These genes have been associated
with breast cancer tumorigenesis [30-33]. Additionally,
Bmpr1a is a predicted target for all of the four miR-412
probes.
We transfected two mouse mammary tumor cell lin es,
M6 and DB7, with lentivirus expressing miR-494 and
miR-412, respectively. M6 cells were derived from a pri-
mary C3(1)/Tag tumor [34] and express low levels of
miR-494, but relatively high levels of miR-412. DB7 cells
were derived from a primary MMTV-PymT tumor [35]
and express low levels of miR-412 but relatively high
levels of miR-494. M6 cells stably expressing miR-494
(M6-miR-494) or scrambled miRNA (M6-scramble) and
Table 2 Differentially expressed miRNAs among
mammary tumor subtypes
Tumor
subtype
mmu-
miRNA
Fold
change
t-Test P-
value
Chromosome
Basal 448 8.0 3.11E-14 X
201 7.2 7.48E-12 X
687 7.6 9.75E-12 14
463 7.2 1.05E-11 X
713 8.3 4.90E-11 13
490 9.6 7.22E-11 6
323 7.2 1.15E-10 12
137 7.1 1.35E-10 3
688 8.4 1.17E-09 15
302b* 9.2 1.58E-09 3
295 7.7 2.58E-09 7
592 7.0 4.08E-09 6
412 9.7 7.13E-08 12
681 7.2 8.24E-08 12
464 7.5 1.59E-07 15
718 8.0 2.05E-07 X
217 7.6 2.52E-07 11
465a-5p 8.6 2.82E-07 X
701 8.7 4.95E-07 5
693-5p 11.0 1.43E-06 17
Luminal 106a 10.8 1.21E-15 X
106b 12.2 6.70E-15 5
805 12.4 2.10E-14 MT
191 9.9 9.20E-12 9
30c 14.4 4.19E-11 4
26a 12.6 5.51E-11 9
19b 15.7 1.11E-10 X
30b 13.7 2.80E-10 15
30a 13.4 3.23E-10 1
30d 10.4 4.64E-10 15
146b 17.6 7.42E-10 19
148a 18.6 1.35E-09 6
193 13.1 2.78E-09 11
141 20.9 2.95E-09 6
195 14.8 3.25E-09 11
26b 15.1 1.16E-07 1
200a 13.4 6.03E-07 4
182 13.2 8.78E-06 6
30e 9.8 1.46E-05 4
200b 13.8 2.38E-03 4
The highly expressed top 20 miRNAs that are associated with either basal-like
or luminal-type mammary tumors. mmu-miR-302b* designated in the miR9.0
release is currently named mmu-miR-302b in the miR17.0 release, but the
sequence has not changed [54].
Zhu et al. Genome Biology 2011, 12:R77
/>Page 6 of 16
DB7 cells stably expressing miR-412 (DB7-miR-412) or
scrambled miRNA (DB7-scramble) were established
using puromycin selection and fluorescence activated
cell sorting (FACS) sorting for red fluorescence protein
(RFP) expression. Increased expression of miR-494 and
miR-412 was confirmed in the M6-miR-494 (Additional
file 10) and DB7-miR-412 cells compared to control
cells expressing scrambled miRNA. No miR-412 was
detectable in control DB7 cells by quantitative RT-PCR
after 40 cycles whereas miR-412 was detectable in DB7-
miR-412 cells at threshold cycle 31. A 1.9-fold increase
in miR-494 expression was identified in M6-miR-494
cells compared to control M6 cells (P =0.009;Addi-
tional file 11).
Quantitative real-time PCR revealed that expression of
Birc4 was significantly reduced in M6-miR-494 cells but
p53 ;MMTV-cre transplant
c3(1) SV40 T/t-antigens
Brca1 ;p53;MMTV-cre
MMTV-c-Myc
MMTV-PymT
MMTV-Her2
Normal mammary
MMTV-Hras
MMTV-Wnt1
fufl
fvfl
Figure 3 Heatmap of GEM-specific miRNA expression signatures associated with eigh t GEM models and normal mammary glands.In-
house z-score-based methods are used with P-value < 0.001, FDR by permutation less than or close to 1%, and FDR-BH (false discovery rate-
Benjamini and Hochberg) < 5% as described in Materials and methods.
Zhu et al. Genome Biology 2011, 12:R77
/>Page 7 of 16
not in control cells (P =0.004;Figure4a).However,
there was no detectable change at the transcript level
for Bmi1 and Ptpn12 in these cells (Additional file 12).
Expression of Bmpr1a was decreased 1.5-fold in DB7-
miR-412 cells compared to that of control cells (P =
0.02; Figure 4b). However, increased expression at the
transcript level was observed for Foxo3a and Spry4 in
these cells (Additional file 13).
Discussion
Genome-wide miRNA expression analyses and func-
tional studies have revealed important roles for these
small regulatory molecules in breast cancer biology.
This study of miRNA expression in relevant GEM mod-
els of human breast cancer provides the opportunity to
distinguish miRNA expres sion patterns in a supervised
manner according to the known molecular alterations
that induce tumor formation and characteristics of the
tumor phenotype. The miRNA expression patterns can
be further interpreted based upon our previous studies
that have delineated gene expression patterns for these
sameGEMmodels[13,14].Thisisthefirstlarge-scale
miRNAgeneexpressionstudyacrossavarietyofGEM
models of human breast cancer and strongly suggests
Table 3 Model-specific miRNAs with their potential mRNA
targets
GEM model Model-specific
mmu-miRNA
Number of
miRNA probes
Number of
target genes
MMTV-c-Myc 494 4 12
685 1 8
699 1 10
MMTV-H-Ras 182 1 32
200c 3 28
30b 4 99
MMTV-Wnt1 106b 4 26
130a 1 35
15a 1 65
19b 4 19
22 4 22
301 1 10
335 2 4
MMTV-PyMT 7214
MMTV-Her2/
neu
193 3 8
C3(1)/SV40 T/
t-antigens
412 1 9
Normal
mammary
10b 3 19
148a 4 41
150 1 4
199a 1 19
486 4 2
By applying an integrated miRNA-mRNA correlation analysis, mRNA targets
are identified for a list of miRNAs associated with normal mammary tissues
and individual GEM models. PyMT, polyoma middle T antigen.
Table 4 Basal- or luminal-like miRNAs with their potential
mRNA targets
Tumor
subtype
mmu-
miRNA
Number of miRNA
probes
Number of target
genes
Basal 150 1 4
219 1 7
222 1 15
375 4 3
412 4 4
505 2 13
689 4 2
Luminal 100 4 6
101a 1 60
101b 2 61
106a 2 19
106b 4 28
130a 1 35
141 1 15
148a 4 41
152 4 40
15a 1 65
17-5p 3 29
182 1 33
193 3 8
19b 4 19
200b 4 23
200c 4 26
20a 4 33
22 4 22
26a 4 75
26b 4 59
27a 1 11
28 4 7
30a-5p 4 66
30b 4 100
30c 4 111
30d 4 85
30e 2 9
429 3 25
494 4 12
685 1 8
7125
709 3 14
By applying an integrated miRNA-mRNA correlation analysis, mRNA targets
are identified for a list of basal- and luminal-like miRNAs.
Zhu et al. Genome Biology 2011, 12:R77
/>Page 8 of 16
that a primary determinant of miRNA expression is the
lineage of the tumor (that is, b asal versus luminal), sup-
porting the previous report that altered miRNA expres-
sion is confined to sp ecific epithelial cell subpopulations
in human breast cancer [36].
We chose to analyze these eight GEM mammary
tumor models since they have been designed to initiate
tumorigenesis through different molecular pathways that
are quite relevant to human breast cancer. We identified
miRNAs that are associated with specific models or that
are commonly deregulated in all of the mammary
tumors models. Unlike similar studies involving human
patient samples, genomic analyses of GEM models may
be performed in defined genetic backgrounds, which
3.5
3
2.5
2
1.5
1
0.5
0
M6/scramble
M6/miR-494
P = 0.008
P = 0.01
DB7/scramble
DB7/miR-412
2
1.5
1
0.5
0
(a)
(b)
Fold change
Fold change
Figure 4 Over-expression of (a) miR-494 and (b) miR-412 inhibits expression of Birc4 and Bmpr1a, respectively. M6 cells and DB-7 cells
were transduced with lentivirus expressing miR-494 and miR-412, respectively. Control cells were transduced with lentivirus expressing
scrambled miRNA. Following infection, cells were FACS sorted for RFP and RNA was extracted. RT-PCR was then performed to examine the
expression of Birc4 in M6 cells and Bmpr1a in DB-7 cells. The error bar represents the standard deviation.
Zhu et al. Genome Biology 2011, 12:R77
/>Page 9 of 16
greatly reduces variability in expression due to genetic
variation as is often the case in human studies. The
results of this study have demonstrated that miRNA
expression profiling can classify GEM models according
to luminal or basal subtypes and that relatively few miR-
NAs are expressed in a model-specific manner despite
different initiating oncogenic drivers used in the design
of the models. Although these results strongly suggest
that the miRNA expression patterns primarily reflect the
state of tumor cell differentiation (luminal versus basal),
more subtle distinctions in miRNA expression can be
identified in the different models.
The differential expression of miRNAs among the
eight murine models resulted in their segregation into
several clusters. One major cluster included the p53
-/-
transplant and C3(1)/SV40 T/t-antigen GEM models.
These two models both devel op mammary tumors wit h
basal features, suggesting that the associated miRNAs
reflect the phenotype of the basal tumor lineage. Both
of these model systems share mechanistic similarities
through the loss of p53 function. SV40 Tag sequesters
p53 by forming a Tag-p53 complex, thus inactivating
p53 tumor suppressor function leading to abnormal ities
in cell cycle regulation, apoptotic response, genome
instability and tumorigenesis [37]. These findings sug-
gest that a common mechanism of miRNA deregulation
maybeinvolvedinp53-mediated tumorigenesis.
Although clustered within the basal group of tumors,
the BRCA1
-/-
p53
+/-
model forms an independent cluster,
which may indicate that these tumors express distinct
molecular features as has been suggested previously
[13].
Another major cluster of tumors includes four of the
MMTV-promoter driven GEM models - MMTV-H-Ras,
MMTV-PymT, MMTV-Her2/neu, and MMTV-Wnt1-
that develop mammary tumors with more luminal fea-
tures . Interestingly, there was some overlap between the
miRNA expression patterns between these mouse mam-
mary tumors with luminal features and the normal
mammary gland, further suggesting that the miRNA
expression pattern of these tumors is related to a lumi-
nal phenotype. This is consistent with a previous report
that a cluster of lumin al breast cancer miRNAs may be
involved in the control of normal mammary gland
development and become deregulated in breast cancer
[38]. Nevertheless, our findings that the MMTV-driven
tumors cluster with normal mammary glands also sug-
gest that the MMTV LTR may target expression to a
mammary cell lineage with luminal characteristics.
Mammary epithelial cells in the pregnant mammary
gland are in a state of increased proliferatio n and differ-
entiation. This may also contribute to the clustering of
the normal pregnant glands with the MMTV promoter-
driven tumors.
We identified a signature of 122 miRNAs that are
associated with the basal-like mammary tumors, and a
signature of 73 miRNAs associated with the luminal-
type mammary tu mors. Blenkiron et al. [7] reported 38
miRNAs that are differentially expressed among human
basal-like, HER2+, luminal A, luminal B or normal-like
tumor subtypes, and these miRNAs have been shown to
be involved in mammary gland development [38].
Importantly, we find that several of these miRNAs are
consistent with our findings in the GEM models. Three
miRNAs associated with human b asal-type tumors
(miR-135b, miR-505 and miR-155), and seven miRNAs
associated with human luminal type tumors (let-7a, let-
7f, miR-100, miR-130a, miR-152, miR-214 and miR-29b)
are similarly expressed in mouse basal-like and luminal-
type tumors, respectively. This suggests that the expres-
sion of these miRNAs may be evolutionarily conserved
during mammary tumor differentiation. Therefore, the
mouse models described may p rove useful for under-
standing tumor lineage specification and how miRNAs
play a role in this process.
ManyofthemiRNAsthatwehaveidentifiedtobe
associated with luminal type GEM tumors have been
shown to be expressed at various stages of normal mur-
ine mammary gland development. Avril-Sassen et al.
[38] identified seven miRNA clusters with distinct pat-
terns of expression during mouse mammary gland
development. Many of the m iRNAs we have identified
as being primarily expressed in luminal type GEM mam-
mary tumors are found in two of t hese miRNA clusters.
miR-193, -30b, -30c, -26a, and -26b are highly expressed
during early deve lopment, ges tation and late involution;
miR-141, -200a, -148a, and -146b a re highly expressed
during gestation, lactation, and early and late involution.
These results suggest that the various mouse luminal-
type tumors induced by the MMTV LTR-targeted
expression of oncogenes maintain specific luminal
miRNA expression patterns, although the cells have
become tumorigenic. Interestingly, the mRNA expres-
sion patterns of several oncogene-induced GEM tumor
models driven by the MMTV LTR also cluster together
despite utilizing oncogenes that function in different
oncogenic pathways. This suggests that the MMTV LTR
in these models may be targeting a particular mammary
luminal epithelial cellular compartment at a specific
stage of differentiation, resulting in tumors that share
many similarities in miRNA and mRNA expression.
Several of the miRNAs that we have identified as
beingspecificfortheluminal-type GEM tumors (miR-
141, -200a and -200b) have been shown to repress an
EMT [39-41]. miR-141 inhibits EMT in part through
targeting of transforming growth factor-b2. miR-200a
has been shown to repress EMT through targeting of b-
catenin. The miR-200 family has also been shown to
Zhu et al. Genome Biology 2011, 12:R77
/>Page 10 of 16
target SIP1 and ZEB1, which are mediators of EMT.
Thus, expression of m iR-141, -200a and -200b in lumi-
nal tumors is in keeping with maintenance of the lumi-
nal phenotype.
Comparison of miRNA expression of normal mam-
mary epithelium from glands harvested at day 17.5 of
gestation to th e GEM tumors identified several miRNAs
that were primarily expressed only in the normal epithe-
lium. Interestingly, we identified five miRNAs - miR-
10b, -148a, -150, -199a and -486 - that are down-regu-
lated in all of the mammary tumors compared to n or-
mal mammary gland tissue irrespective of the initiating
genetic lesion. Four of these miRNAs - miR-10b, -148a,
-150, -199a - have been implicated in mouse mammary
gland development [38]. One of these, miR-10b, has
been shown to be down-r egulated in human breast car-
cinoma compared to normal breast tissue. miR-10b,
which targets HOXD10, was additionally shown to be
down-regulated in all the breast carcinomas from metas-
tasis-free patients [42]. miR-199a functions as an onco-
suppressor targeting the oncogene Met,therefore
impairing Met-mediated invasive growth of cells [43].
miR-150 has been shown to negatively regulate the
expression of the Myb oncogene [44]. These findings
suggest that the loss of some or all of these miRNAs
may be important for tumor development. miR-486,
also expressed in normal epithelium, has been shown to
be down-regulated in mammary cancer. Together, these
data suggest that these miRNAs might function as
tumor suppressors or regulate cellular differentiation
and become deregulated during mammary tumor
development.
Interestingly, although we identified many miRNAs
whose expression was observed in basal type tumors,
few of these miRNAs have been previously character-
ized. Thus, these basal GEM mammary tumor mode ls
may offer an important opportunity to delineate the
functions of these less well studied basal-associated
miRNAs.
Relativ ely few miRNAs were identif ied as being speci-
fically expressed in particular GEM models. miR-22 was
found to be primarily expressed in MMTV-Wnt1
tumors. miR-22 has previously been shown to be over-
expressed in progenitor cells [45]. This would be in
keeping with earlier studies that have suggested that
MMTV-Wnt1 tumors are enriched for cells with stem
cell characteristics [46-49]. Three miRNAs were found
to be highly expressed in the c-Myc model, including
miR-494, miR-699 and mi R-685. Among them, miR-494
is highly associated with the luminal-type of mammary
tumors, suggesting a potential role for miR-494 in c-
Myc-mediated oncogenic signaling and in mammary
tumor differentiation. miR-494 is highly expressed in
human retinoblastoma [50]. It also negatively regulates
PTEN gene expression at the translational level in
human bronchial epithelial cells induced by anti-benzo
(a)pyrene-trans-7,8-dihydrodiol-9,10-epoxide (anti-
BPDE) and functions as a micro-oncogene in carcino-
genesis [51].
Furthermore, by using an integrated miRNA and
mRNA gene expression analysis, we demonstrated in
vivo that the expre ssion of miRNAs can be associated
with the inverse expression of a subset of predicted tar-
get mRNAs in mammary gland tumors, leading to a
more focused set of miRNAs to functionally validate.
Since computational prediction of miRNA targets is
inconsistent across different algorithms and usually
identifies hundred s of potential targets, our approach of
identifying an inverse correlation betwe en miRNA and
mRNA significantly reduces the number of potential
candidates. However, it must be remembered that this
analysis does not consider inhibition of protein transla-
tion by miRNA, which has been considered the primary
mode of action of miRNAs. T herefore, additional
miRNA targets need to be considered at the protein
level. However, whether miRNA works primarily
through inhibition of translation or transcription
remains controversial [52].
Real-time RT-PCR demonstrated that the expression
of Birc4 was reduced in mammary tumor epithelial cells
that over-expressed miR-494. However, further analyses
will confirm that miR-494 targets the putative mRNA
sequence in the 3’ UTR of Birc4. miR-412 was the only
miRNA associated specifically with the C3(1)Tag model,
and is also highly associated with the basal-like mam-
mary tumors. Real-time RT-PCR demonstrated that
overexpression of miR-412 reduces expression of
Bmpr1a. Identification of the mRNA target in the 3’
UTR of Bmpr1 will validate this finding. Bmpr1a is a
type 1A bone morphogenetic protein receptor, but its
functional role in breast cancer has not been defined.
Decreased expression of Bmpr1b predicts poor prog-
nosis in breast cancer patients and leads to increased
cell proliferation of breast cancer cells in vitro, suggest-
ing the tumor suppressor role of the Bmpr family in
breast cancer carcinogenesis [53]. Therefore, inhibition
of Bmpr1a expression by miR-412 could be involved in
tumor initiation or progression of the C3(1) Tag and
basal models.
Conclusions
miRNA expression patterns in GEM models provides
novel new insights into the associations between
miRNA expression, mammary tumor subtypes and
oncogenic drivers. Ongoing functional studies will deter-
mine the biologic roles that these miRNAs play in mam-
mary epithelial differentiation, tumor suppression and
oncogenesis.
Zhu et al. Genome Biology 2011, 12:R77
/>Page 11 of 16
Materials and methods
Animals
All the transgenic mice studied were of the FVB strain
background except that p53
-/-
and BRCA 1
-/-
p53
+/-
knockout mice were of the Balb/C and 129B6/FVB
bac kground, respectively. All the mice were housed and
cared for in accordance with National Institutes of
Health guidelines under an approved animal protocol.
Tumors were harvested at t he 0.5 to 1 cm stage, fixed
in 4% (w/v) paraformaldehyde for histology, and the
remainder snap frozen in liquid nitrogen. Tumors from
four to seven individual mice were analyzed for each
mouse model. Mammary glands from normal pregnant
female mice at 17.5 days of pregnancy were also col-
lected from the FVB, Balb/C and 129B6/FVB strains.
miRNA cloning and lentivirus packaging
miR-412 and miR-494 were PCR amplified from C57/B6J
mouse genomic DNA. The PCR fragment containing the
miRNA stem loop sequence plus both the upstream and
downstream flanking genomic sequence was then cloned
into the plemiR lentiviral vector (Openbiosystems,
Huntsville, AL, USA). The primers used were: miR-412,
5’ - TCG ACT CGA GCA ACT TTG CAT CTG GAG
GAC -3’ and 3’- TCG AAC GCG TTG AGC GTT GAT
ACT G AG AAA AGA T -5’ ; miR-494, 5’ -TCG ACT
CGA GCA CAG GGG TTT TGG TTG C -3’ and 3’ -
TCG AAC GCG TGG GCT GAG TCC TGA TGC -5’.
Lentivirus plemiR-miR412 and plemiR-miR494 were
prepared in 293T cells u sing the third-generation lenti-
virus packaging system.
Cells and lentivirus infection
M6 and DB7 are mouse mammary tumor epithelial cell
lines: M6 cells are derivative of primary tumors devel-
oped from C3(1)/SV40 T/t-antigen transgenic mice;
DB7 cells are derivative of primary tumors developed
from MMTV-PymT transgenic mice. Cells were trans-
duced with plemiR lentivirus expressing miR-494, miR-
412, or plemiR_scramble lentivirus as co ntrol. Following
transduction, cells were grown in culture under puromy-
cin (1 μg/ml) selection, and subsequently were sorted
for RFP expression by FACS.
RNA extraction
The total RNA containing the miRNA species were
extracted from tumor samples using a mirVana miRNA
Isolation kit (Ambion, Austin, TX, USA). The RNA
quality and yields were analyzed using Agilent Bioanaly-
zer and Nanodrop. Each RNA sample was then divided
into two aliquots that were applied either for the
miRNA microarray or the Affymetrix mRNA
microarray.
miRNA microarray
The miRNA microarray chip (LMT_miRNA_v2 micro-
array) was designed using the Sanger miR9.0 database
[54] and manufactured by Agilent Technologies as cus-
tom-synthesized 8 × 15k microarrays. The array con-
tains 1,667 unique mature miRNA sequences across all
species, among them 334 unique miRNAs for mouse.
Each mature miRNA is represented by + and - (reverse
complement) strand sequences, and each with four
replicate probes. In addition, the array contains both
positive and negative controls, and other controls such
as probes to Actin, GAPDH, HSP70, and LINE elements.
The mature miRNA sequences were incorporated into
60-mer long oligonucleotide probes with a linker
sequence on the 3’ end to remove the miRNA sequences
away from the glass slide surface. The linker sequence
was a proprietary sequence from Agilent that has mini-
mal homology to any sequence in the GenBank.
Total RNA (1 μg) containing the miRNAs was
labeled using the miRCURY ™ LNA microRNA Array
Labeling kit (Exiqon, Woburn, MA, USA). The 3’ end
of the total RNA was enzymatically labeled with the
Hy3 and/or Hy5 fluorescent dye (Exiqon) by incubat-
ing with T4 RNA ligase at 0°C for 1 hour followed by
an enzyme inactivation step of 65°C for 15 minutes.
The labeled RNA was subsequently used for hybridiza-
tion onto the microarrays without the need for column
purification.
The fluorescence-labeled miRNAs were incubated
with a 2 × hybridization buffer and 10 × blocking buf-
fer (both from Agilent). The samples were subse-
quently heated to 99°C for 3 minutes, snap-cooled on
ice, and centrifuged for 5 minutes before being added
onto the microarray printed on glass slides and hybri-
dized for 16 hours at 47°C inside the Agilent hybridi-
zation rotating oven. After the 16-hour incubation
overnight, the glass slides containing the microarrays
were washed with Agilent wash buffers 1 (room tem-
perature) and 2 (at 37°C) and then dried with the Agi-
lent stabilization and drying solution. The washed and
dried slides were scanne d using the Agilent scanner.
The Feature Extraction program was used to extract
the spot intensities.
Gene expression microarray
Total RNA (1 μg) was reverse transcribed with T7-
oligo(dT) primer and labeled with biotin using Affyme-
trix One Cycle Target L abeling kit following the manu-
facturer’ s protocol. RNA was then labeled and
hybridized to the mouse genome 430A 2.0 GeneChip
(Affymetrix) and scanned on an Affymetrix GeneChip
scanner 3000. Data were collected using Affymetrix
GCOS software.
Zhu et al. Genome Biology 2011, 12:R77
/>Page 12 of 16
miRNA microarray data analysis
miRNA gene expression data normalization
The gProcessSignal values of probes designed for mouse
miRNAs were feature extracted using the GE2 protocol
(Agilent) with exclusion of internal control probes, non-
mouse probes, and all negative strand probes. A global
median normalization procedure was applied to the
gProcessSignal values of the selected probes across all
arrays. The normalized data were further filtered using
MAS5 detection calls (’ P’ (Present), ‘M’ (Marginal), or
‘A’ (Absent)) to eliminate prob es with ‘P’ or ‘ M’ in less
than three samples in the entire dataset.
Unsupervised hierarchical clustering
Heatmaps and hierarchical clustering were performed
using TM4 MeV from TIGR [55] or the Partek Geno-
mic Suite [56] using z-scores transformed from the ori-
ginal normalized values.
Identification of basal-luminal specific miRNAs
For comparison of basal and luminal model samples,
differential miRNA were derived using SAM (signifi-
cance analysis of microarray) [57] under cutoff P ≤ 0.01
and FDR ≤0%. The normal mammary samples were
then integrated into the heatmap for comparison. After
selection of basal-luminal differentially expressed miR-
NAs, the transformed z-scores of these selected miRNAs
were visualized and displayed in the form of heatmaps
using TM4 MeV from TIGR [55] or the Partek Geno-
mic Suite [56].
Identification of mammary cancer model-specific miRNAs
Model-specific miRNA signatures were derived from in-
house z-score-based methods. Briefly, all probe signal
intensity values were transformed into z-scores. The
mousemodel-specificexpressionofanmiRNAwas
defined as the miRNAs with z-scores > 0.75 within the
particular model, and with the median z-score of the
particular model higher than the third highest ranked z-
scores of pooled samples of all other models. P-values
and FDRs were derived from sample-labeling permuta-
tion or directly based on the Benjamini and Hochberg
method (FDR-BH) [58]. t-Test P-values and related
FDRs were also reported for the two-class comparisons
of the particular model versus other models. The P-
values for feature selection were generally less than
0.001 and the FDR by permutation test less than or
close to 1% and FDR-BH < 5%. We observed that these
methods, in fact, performed better than an ANOVA-
based approach, probably due to the fact that the sam-
ple size is limited for each model and our methods are
more stringent and conservative. Our method resulted
in a more conservative model-specific pattern. After
selection of model-specific miRNA signatures, the trans-
formed z-scores of these selected miRNAs were visua-
lized and displayed in the form of heatmaps using TM4
MeV from TIGR [55] or the Partek Genomic Suite [56].
miRNA-mRNA negative correlation and enrichment
analysis
mRNA array data were normalized using GC-RMA of
the Partek Genomic Suite [56]. The normalized data
were further filtered using MAS5 detection calls for
probes designated as ‘ P’ (present) or ‘M’ (Marginal) in
less than three samples from all of the samples analyzed.
Basal-luminal differential miRNAs and model-specific
miRNA signatures were derived as described above.
Analysis to identify negative correlations between
miRNA and mRNA expression was done using an in-
house R script. Briefly, normalized miRNA and mRNA
data were sample-matched for all samples with both
miRNA and mRNA array data. Then for each miRNA
(either differential miRNA between basal and luminal or
model-specific signature miRNA), Pearson c orrelation
coefficients were computed for all mRNAs. The pre-
dicted target mRNAs of the particular miRNA were
selected from the TargetScan database [54], and the
Pearson correlation coefficients between the particular
miRNA and its predicted target mRNAs were computed
as well. For each miRNA, a 2 × 2 contingency table was
created for all mRNAs (whether a mRNA has negative
correlation with the intended miRNA or not versus
whether it is a predicted target of the intended miRNA
or not), which was used to assess the enrichment level
of the negative correlated mRNAs (cor relation < 0 and
P-value of correlation ≤0.001) within predicted targets
of the intended miRNA using Fisher’ s exact test. If the
P-value of Fisher’ s exact test is less than 0.05, the
miRNA is considered to have a significant number of
mRNA targets with negative correlation with it and it
was selected as a significant miRNA in this screening
procedure. Then for each significa nt miRNA, the distri-
bution of correlation coefficients (cor) for both target
mRNAs and all mRNAs was also plotted to confirm the
significant left shift of the distribution curve of the tar-
get mRNAs towards the negative correlation side com-
pared to the curve for all mRNAs. The shift of the
distribution plots between the target mRNAs and all
mRNAs indicates enrichment of the target mRNAs
(Fisher P < 0.05).
Double immunofluorescence assay
Paraffin-embedded sections (5 μm thick) were processed
using sequential immunostaining for cytokeratin 14
(K14) and cytokeratin 18 (K18) using standard proce-
dures. Briefly, slides were deparaffinized followed by
antigen retrieval, and blocked with serum. Slides were
then incubated overnight with rabbit a-cytokeratin 14
(1:20,000; PRB-155P, Covance, provided by Dr SH
Yuspa, NIH) at 4°C, blocked with avidin/biotin (Vector
Labs #SP-2001, Burlingame, CA, USA) followed by incu-
bation with sheep a-cytokeratin 18 (1:800, #PH504, The
Zhu et al. Genome Biology 2011, 12:R77
/>Page 13 of 16
Binding Site, San Diego, CA, USA) overnight at room
temperature. Slides were then stained for 30 minutes
with biotin-conjugated donkey a-rabbit (1:100; Abcam
#AB6801, Cambridge, MA, USA) and rabbit a-sheep
(1:100; Vector Labs #BA-6000) secondary antibody, fol-
lowed by streptavidin-conjugated Alexa fluor-594 or
-488 (1:100; Invitrogen #s S11227 and S11223, Carlsbad,
CA, USA), respectively. Slides were also counter-stained
with DAPI.
Quantitative real-time RT-PCR for miRNAs
Taqman miRNA assays (Applied Biosystems, Carlsbad,
CA, USA) were performed to measure the expression of
miRNAs following the manufa cturer’ sprotocol.For
miRNAs miR-30b, -412 and -505, SYBR-based miScript
miRNA assays (Qiagen, Valencia, CA, USA) were per-
formed to measure their expression following the manu-
facturer’s protocol. The relative quantification of mature
miRNA expression was normalized to the expression of
endogenous mouse snoRNA-202.
Quantitative real-time RT-PCR for gene expression
Total RNA was isolated as mentioned above. First-
strand cDNA was synthesized using the SuperScript III
First-Strand synthesis system (Invitrogen). Quantitative
real-time RT-PCR was then performed using iQ SYBR
Green supermix (Bio-Rad, Hercules, CA, USA) in tripli-
cates (MyiQ single-color real-time PCR detection sys-
tem, Bio-Rad). The relative quantification of gene
expression was normalized to the expression of the
endogenous gene GAPDH.
Primer sequences were: GAPDH,5’ - CAT GGC CTT
CCG TGT TCC TA-3’ and 3’-GCGGCACGTCAG
ATC CA -5’; Cycophilin, 5’-TGCTGGACCAAACAC
AAA CG-3’ and 3’ -CCA TCC AGC CAT TCA GTC
TTG-5’; Bmpr1a,5’- AAC GCT TGC GGC CAA TC -3’
and 3’- GAC ATT AGC TTC AAA ACT GCT CGA A
-5’ ; Bmi1, Mm_Bmi1_1_SG, #QT00165298 (Qiagen);
Spry4, Mm_Spry4_1_SG, #QT00263844 (Qiagen); Birc4,
#VMPS-383 (); Foxo3a,
#VMPS-28 ().
GEO submission of microarray data
Data have been depo sited with the Gene Expression
Omnibus: miRNA gene expression raw data (before nor-
malization) [GSE23978]; miRNA gene expression raw
data of normal mammary gland tissues from different
mouse genetic background [GSE23977]; mRNA gene
expression raw data [GSE23938].
Additional material
Additional file 1: Figure S1 - miRNA gene expression profile of
normal mammary gland tissues from different mouse genetic
backgrounds. The miRNAs of the normal mammary glands are
compared to those of the C3(1)/Tag mammary tumors as a control.
Additional file 2: Figure S2 - unsupervised hierarchical clustering of
the 22 differentially expressed miRNA genes identified in Additional
file 1over 41 mammary tumors derived from 8 genetically
engineered mouse models and 5 normal mammary tissues. The
heatmap shows the expression of miRNAs at the probe level. Heatmap
colors represent relative miRNA expression as indicated in the color key.
Additional file 3: Figure S3 - double-immunofluorescence staining
of mouse samples for basal/myoepithelial and luminal cytokeratins.
Normal mammary gland and mammary tumors from the indicated
mouse models are stained for cytokeratin 18 (K18; green) and cytokeratin
14 (K14; red).
Additional file 4: Figure S4 - correlation of miRNA microarray data
with quantitative RT-PCR miRNA expression data. Shown are the
pairwise scatter plots for individual miRNAs. The y-axis of the plot shows
the log2 intensity of the microarray data, whereas the x-axis shows the
-delta cycle threshold (CT) value of the RT-PCR results. Each dot in the
plot represents one sample from individual tumor models or normal
mammary tissues. Person correlation coefficients (r) and P-values are
calculated.
Additional file 5: miRNAs that are highly associated with basal- and
luminal- mammary tumor subtypes.
Additional file 6: miRNAs that are highly associated with individual
genetically engineered mouse models and normal mammary
tissues.
Additional file 7: Genetically engineered mouse model-specific
miRNAs and their potential mRNA targets.
Additional file 8: Basal- or luminal-like miRNAs and their potential
mRNA targets.
Additional file 9: Figure S5 - analysis of the inverse relationship
between transcript levels of miRNAs and their putative target
mRNAs in mouse mammary tissues. Global distribution of the Pearson
correlation coefficients between mRNAs and (a) miR-10b, (b) miR-412
and (c) miR-494. The dotted curves show the distribution of the
correlation coefficients for all mRNAs. The solid curves show the
correlation coefficients for only those mRNAs that are predicted targets
of miR-10b, miR-412 or miR-494.
Additional file 10: Figure S6 - Ingenuity Pathway Analysis™™ of the
potential target genes of miR-494. Twelve of the mRNA target genes
of miR-494 from Table 3 were input into Ingenuity (Ingenuity Systems,
Inc.), and core analysis was then performed to retrieve the target genes’
association with cancer and disease.
Additional file 11: Figure S7 - overexpression of miR-494 in M6 cells
as determined by quantitative real-time RT-PCR. M6 cells were
transduced with plemiR lentivirus expressing miR-494. Control cells were
M6 cells and M6 cells transduced with plemiR lentivirus vector. Following
infection, cells were FACS sorted for RFP and RNA was extracted. Real-
time RT-PCR was then performed to examine the expression of miR-494
in these cells.
Additional file 12: Figure S8 - overexpression of miR-494 in M6 cells
does not alter expression of Bmi1 or Ptpn12 determined by
quantitative real-time RT-PCR. M6 cells were transduced with plemiR
lentivirus expressing miR-494. Control cells were M6 cells, M6 cells
transduced with plemiR lentivirus vector, and M6 cells transduced with
lentivirus expressing scrambled miRNA. Following infection, cells were
FACS sorted for RFP and RNA was extracted. Real-time RT-PCR was then
performed to examine the expression of Bmi1 (top) and Ptpn12 (bottom)
in these cells. P-value (Bmi1: M6_miR494 versus M6_scramble) = 0.06; P-
value (Ptpn12: M6_miR494 versus M6_scramble) = 0.0502.
Additional file 13: Figure S9 - increased expression of Foxo3a and
Spry4 by miR-412 in DB7 cells. DB7 cells were transduced with plemiR
lentivirus expressing miR-412. Control cells were DB7 cells, DB7 cells
transduced with plemiR lentivirus vector, and DB7 cells transduced with
lentivirus expressing scrambled miRNA. Following infection, cells were
FACS sorted for RFP and RNA was extracted. Real-time RT-PCR was then
performed to examine the expression of Foxo3a and Spry4 in these cells.
Zhu et al. Genome Biology 2011, 12:R77
/>Page 14 of 16
P-value (Foxo3a: DB7_miR412 versus DB7_scramble) = 0.125; P-value
(Spry4: DB7_miR412 versus DB7_scramble) = 2.75E-06.
Abbreviations
EMT: epithelial-to-mesenchymal transition; ER: estrogen receptor; FACS:
fluorescence activated cell sorting; FDR: false discovery rate; GEM: genetically
engineered mouse; LTR: long terminal repeat; miRNA: microRNA; MMTV:
mouse mammary tumor virus; PCR: polymerase chain reaction; PyMT:
polyoma middle T antigen; RFP: red fluorescence protein; RT-PCR: reverse
transcription PCR;UTR: untranslated region.
Acknowledgements
We thank Dr Kent Hunter for generously providing MMTV-PymT mouse
mammary tumor samples, Dr Peter Blumberg for critically reading the
manuscript, and Mary Albaugh for technical assistance with animal handling.
This work was supported in part by the National Institutes of Health
intramural program, Center for Cancer Research, NCI.
Author details
1
Transgenic Oncogenesis and Genomics Section, Laboratory of Cell Biology
and Genetics, Center for Cancer Research, National Cancer Institute, Building
37, Room 4054, 37 Convent Dr., Bethesda, MD 20892, USA.
2
Advanced
Biomedical Computing Center, NCI-FCRDC, Building 430, Room 127, 1050
Boyles Street, Frederick, MD 21702, USA.
3
Laboratory of Molecular
Technology, NCI-FCRDC, 915 Toll House Ave, Frederick, MD 21702, USA.
4
Mammalian Genetics Section, National Institute of Diabetes and Digestive
and Kidney Diseases, NIH, 10 Center Dr., Bethesda, MD 20892, USA.
5
Lester
and Sue Smith Breast Center, Baylor College of Medicine, One Baylor Plaza,
Houston, TX 77030, USA.
6
Department of Molecular and Cellular Biology,
Baylor College of Medicine, One Baylor Plaza, Houston, TX 77030, USA.
Authors’ contributions
MZ contributed to the design and conception of the experiments,
conducted molecular biology experiments, analyzed and interpreted data
and drafted the manuscript. CHK performed the microarray experiments and
helped with quality control and analysis. MY and RS normalized the data
and performed all statistical analyses. CD and DM provided tumor tissue
samples that they had characterized. JEG conceived of the project and
participated in its design, helped to analyze and interpret the data and draft
the manuscript. All authors have read and approved the manuscript for
publication.
Competing interests
The authors declare that they have no competing interests.
Received: 4 February 2011 Revised: 29 April 2011
Accepted: 16 August 2011 Published: 16 August 2011
References
1. Ambros V: A hierarchy of regulatory genes controls a larva-to-adult
developmental switch in C. elegans. Cell 1989, 57:49-57.
2. Chalfie M, Horvitz HR, Sulston JE: Mutations that lead to reiterations in
the cell lineages of C. elegans. Cell 1981, 24:59-69.
3. He L, Hannon GJ: MicroRNAs: small RNAs with a big role in gene
regulation. Nat Rev Genet 2004, 5:522-531.
4. Iorio MV, Ferracin M, Liu CG, Veronese A, Spizzo R, Sabbioni S, Magri E,
Pedriali M, Fabbri M, Campiglio M, Menard S, Palazzo JP, Rosenberg A,
Musiani P, Volinia S, Nenci I, Calin GA, Querzoli P, Negrini M, Croce CM:
MicroRNA gene expression deregulation in human breast cancer. Cancer
Res 2005, 65:7065-7070.
5. Volinia S, Calin GA, Liu CG, Ambs S, Cimmino A, Petrocca F, Visone R,
Iorio M, Roldo C, Ferracin M, Prueitt RL, Yanaihara N, Lanza G, Scarpa A,
Vecchione A, Negrini M, Harris CC, Croce CM: A microRNA expression
signature of human solid tumors defines cancer gene targets. Proc Natl
Acad Sci USA 2006, 103:2257-2261.
6. Hurst DR, Edmonds MD, Welch DR: Metastamir: the field of metastasis-
regulatory microRNA is spreading. Cancer Res 2009, 69:7495-7498.
7. Blenkiron C, Goldstein LD, Thorne NP, Spiteri I, Chin SF, Dunning MJ,
Barbosa-Morais NL, Teschendorff AE, Green AR, Ellis IO, Tavare S, Caldas C,
Miska EA: MicroRNA expression profiling of human breast cancer
identifies new markers of tumor subtype. Genome Biol 2007, 8:R214.
8. Sorlie T, Perou CM, Tibshirani R, Aas T, Geisler S, Johnsen H, Hastie T,
Eisen MB, van de Rijn M, Jeffrey SS, Thorsen T, Quist H, Matese JC,
Brown PO, Botstein D, Eystein Lonning P, Borresen-Dale AL: Gene
expression patterns of breast carcinomas distinguish tumor subclasses
with clinical implications. Proc Natl Acad Sci USA 2001, 98:10869-10874.
9. Lowery AJ, Miller N, Devaney A, McNeill RE, Davoren PA, Lemetre C,
Benes V, Schmidt S, Blake J, Ball G, Kerin MJ: MicroRNA signatures predict
oestrogen receptor, progesterone receptor and HER2/neu receptor
status in breast cancer. Breast Cancer Res 2009, 11:R27.
10. Chen JQ, Russo J: ERalpha-negative and triple negative breast cancer:
molecular features and potential therapeutic approaches. Biochim
Biophys Acta 2009, 1796:162-175.
11. Di Leva G, Gasparini P, Piovan C, Ngankeu A, Garofalo M, Taccioli C,
Iorio MV, Li M, Volinia S, Alder H, Nakamura T, Nuovo G, Liu Y, Nephew KP,
Croce CM: MicroRNA cluster 221-222 and estrogen receptor alpha
interactions in breast cancer. J Natl Cancer Inst 2010, 102:706-721.
12. Desai KV, Xiao N, Wang W, Gangi L, Greene J, Powell JI, Dickson R, Furth P,
Hunter K, Kucherlapati R, Simon R, Liu ET, Green JE: Initiating oncogenic
event determines gene-expression patterns of human breast cancer
models. Proc Natl Acad Sci USA 2002, 99:6967-6972.
13. Herschkowitz JI, Simin K, Weigman VJ, Mikaelian I, Usary J, Hu Z,
Rasmussen KE, Jones LP, Assefnia S, Chandrasekharan S, Backlund MG, Yin Y,
Khramtsov
AI, Bastein R, Quackenbush J, Glazer RI, Brown PH, Green JE,
Kopelovich L, Furth PA, Palazzo JP, Olopade OI, Bernard PS, Churchill GA,
Van Dyke T, Perou CM: Identification of conserved gene expression
features between murine mammary carcinoma models and human
breast tumors. Genome Biol 2007, 8:R76.
14. Deeb KK, Michalowska AM, Yoon CY, Krummey SM, Hoenerhoff MJ,
Kavanaugh C, Li MC, Demayo FJ, Linnoila I, Deng CX, Lee EY, Medina D,
Shih JH, Green JE: Identification of an integrated SV40 T/t-antigen cancer
signature in aggressive human breast, prostate, and lung carcinomas
with poor prognosis. Cancer Res 2007, 67:8065-8080.
15. Tremblay PJ, Pothier F, Hoang T, Tremblay G, Brownstein S, Liszauer A,
Jolicoeur P: Transgenic mice carrying the mouse mammary tumor virus
ras fusion gene: distinct effects in various tissues. Mol Cell Biol 1989,
9:854-859.
16. Bouchard L, Lamarre L, Tremblay PJ, Jolicoeur P: Stochastic appearance of
mammary tumors in transgenic mice carrying the MMTV/c-neu
oncogene. Cell 1989, 57:931-936.
17. Leder A, Pattengale PK, Kuo A, Stewart TA, Leder P: Consequences of
widespread deregulation of the c-myc gene in transgenic mice: multiple
neoplasms and normal development. Cell 1986, 45:485-495.
18. Guy CT, Cardiff RD, Muller WJ: Induction of mammary tumors by
expression of polyomavirus middle T oncogene: a transgenic mouse
model for metastatic disease. Mol Cell Biol 1992, 12:954-961.
19. Tsukamoto AS, Grosschedl R, Guzman RC, Parslow T, Varmus HE: Expression
of the int-1 gene in transgenic mice is associated with mammary gland
hyperplasia and adenocarcinomas in male and female mice. Cell 1988,
55:619-625.
20. Maroulakou IG, Anver M, Garrett L, Green JE: Prostate and mammary
adenocarcinoma in transgenic mice carrying a rat C3(1) simian virus 40
large tumor antigen fusion gene. Proc Natl Acad Sci USA 1994,
91:11236-11240.
21. Jerry DJ, Kittrell FS, Kuperwasser C, Laucirica R, Dickinson ES, Bonilla PJ,
Butel JS, Medina D: A mammary-specific model demonstrates the role of
the p53 tumor suppressor gene in tumor development. Oncogene 2000,
19:1052-1058.
22. Xu X, Wagner KU, Larson D, Weaver Z, Li C, Ried T, Hennighausen L,
Wynshaw-Boris A, Deng CX: Conditional mutation of Brca1 in mammary
epithelial cells results in blunted ductal morphogenesis and tumour
formation. Nat Genet 1999, 22:37-43.
23. Lu J, Getz G, Miska EA, Alvarez-Saavedra E, Lamb J, Peck D, Sweet-
Cordero A, Ebert BL, Mak RH, Ferrando AA, Downing JR, Jacks T, Horvitz HR,
Golub TR: MicroRNA expression profiles classify human cancers. Nature
2005, 435:834-838.
24. Honig A, Weidler C, Hausler S, Krockenberger M, Buchholz S, Koster F,
Segerer SE, Dietl J, Engel JB: Overexpression of polycomb protein BMI-1
Zhu et al. Genome Biology 2011, 12:R77
/>Page 15 of 16
in human specimens of breast, ovarian, endometrial and cervical cancer.
Anticancer Res 2010, 30:1559-1564.
25. Jagani Z, Wiederschain D, Loo A, He D, Mosher R, Fordjour P, Monahan J,
Morrissey M, Yao YM, Lengauer C, Warmuth M, Sellers WR, Dorsch M: The
Polycomb group protein Bmi-1 is essential for the growth of multiple
myeloma cells. Cancer Res 2010, 70:5528-5538.
26. Aird KM, Ghanayem RB, Peplinski S, Lyerly HK, Devi GR: X-linked inhibitor
of apoptosis protein inhibits apoptosis in inflammatory breast cancer
cells with acquired resistance to an ErbB1/2 tyrosine kinase inhibitor.
Mol Cancer Ther 2010, 9:1432-1442.
27. Cassar L, Nicholls C, Pinto AR, Li H, Liu JP: Bone morphogenetic protein-7
induces telomerase inhibition, telomere shortening, breast cancer cell
senescence, and death via Smad3. Faseb J 2009, 23:1880-1892.
28. Espejo R, Rengifo-Cam W, Schaller MD, Evers BM, Sastry SK: PTP-PEST
controls motility, adherens junction assembly, and Rho GTPase activity
in colon cancer cells. Am J Physiol Cell Physiol 2010, 299:C454-C463.
29. Streit S, Ruhe JE, Knyazev P, Knyazeva T, Iacobelli S, Peter S, Hoefler H,
Ullrich A: PTP-PEST phosphatase variations in human cancer. Cancer
Genet Cytogenet 2006, 170:48-53.
30. Bonifaci N, Gorski B, Masojc B, Wokolorczyk D, Jakubowska A, Debniak T,
Berenguer A, Serra Musach J, Brunet J, Dopazo J, Narod SA, Lubinski J,
Lazaro C, Cybulski C, Pujana MA: Exploring the link between germline and
somatic genetic alterations in breast carcinogenesis. PLoS One 2010, 5:
e14078.
31. Taniguchi K, Ishizaki T, Ayada T, Sugiyama Y, Wakabayashi Y, Sekiya T,
Nakagawa R, Yoshimura A: Sprouty4 deficiency potentiates Ras-
independent angiogenic signals and tumor growth. Cancer Sci 2009,
100:1648-1654.
32. Wang J, Thompson B, Ren C, Ittmann M, Kwabi-Addo B: Sprouty4, a
suppressor of tumor cell motility, is down regulated by DNA
methylation in human prostate cancer. Prostate 2006, 66:613-624.
33. Yang JY, Hung MC: A new fork for clinical application: targeting forkhead
transcription factors in cancer. Clin Cancer Res 2009, 15:752-757.
34. Holzer RG, MacDougall C, Cortright G, Atwood K, Green JE, Jorcyk CL:
Development and characterization of a progressive series of mammary
adenocarcinoma cell lines derived from the C3(1)/SV40 Large T-antigen
transgenic mouse model. Breast Cancer Res Treat 2003, 77:65-76.
35. Borowsky AD, Namba R, Young LJ, Hunter KW, Hodgson JG, Tepper CG,
McGoldrick ET, Muller WJ, Cardiff RD, Gregg JP: Syngeneic mouse
mammary carcinoma cell lines: two closely related cell lines with
divergent metastatic behavior. Clin Exp Metastasis 2005, 22:47-59.
36. Sempere LF, Christensen M, Silahtaroglu A, Bak M, Heath CV, Schwartz G,
Wells W, Kauppinen S, Cole CN: Altered MicroRNA expression confined to
specific epithelial cell subpopulations in breast cancer. Cancer Res 2007,
67:11612-11620.
37. Bocchetta M, Eliasz S, De Marco MA, Rudzinski J, Zhang L, Carbone M: The
SV40 large T antigen-p53 complexes bind and activate the insulin-like
growth factor-I promoter stimulating cell growth. Cancer Res
2008,
68:1022-1029.
38. Avril-Sassen S, Goldstein LD, Stingl J, Blenkiron C, Le Quesne J, Spiteri I,
Karagavriilidou K, Watson CJ, Tavare S, Miska EA, Caldas C: Characterisation
of microRNA expression in post-natal mouse mammary gland
development. BMC Genomics 2009, 10:548.
39. Gregory PA, Bert AG, Paterson EL, Barry SC, Tsykin A, Farshid G, Vadas MA,
Khew-Goodall Y, Goodall GJ: The miR-200 family and miR-205 regulate
epithelial to mesenchymal transition by targeting ZEB1 and SIP1. Nat
Cell Biol 2008, 10:593-601.
40. Gregory PA, Bracken CP, Bert AG, Goodall GJ: MicroRNAs as regulators of
epithelial-mesenchymal transition. Cell Cycle 2008, 7:3112-3118.
41. Wright JA, Richer JK, Goodall GJ: microRNAs and EMT in mammary cells
and breast cancer. J Mammary Gland Biol Neoplasia 2010, 15:213-223.
42. Ma L, Teruya-Feldstein J, Weinberg RA: Tumour invasion and metastasis
initiated by microRNA-10b in breast cancer. Nature 2007, 449:682-688.
43. Migliore C, Petrelli A, Ghiso E, Corso S, Capparuccia L, Eramo A,
Comoglio PM, Giordano S: MicroRNAs impair MET-mediated invasive
growth. Cancer Res 2008, 68:10128-10136.
44. Persson M, Andren Y, Mark J, Horlings HM, Persson F, Stenman G:
Recurrent fusion of MYB and NFIB transcription factor genes in
carcinomas of the breast and head and neck. Proc Natl Acad Sci USA
2009, 106:18740-18744.
45. Ibarra I, Erlich Y, Muthuswamy SK, Sachidanandam R, Hannon GJ: A role for
microRNAs in maintenance of mouse mammary epithelial progenitor
cells. Genes Dev 2007, 21:3238-3243.
46. Shackleton M, Vaillant F, Simpson KJ, Stingl J, Smyth GK, Asselin-Labat ML,
Wu L, Lindeman GJ, Visvader JE: Generation of a functional mammary
gland from a single stem cell. Nature 2006, 439:84-88.
47. Li Y, Welm B, Podsypanina K, Huang S, Chamorro M, Zhang X, Rowlands T,
Egeblad M, Cowin P, Werb Z, Tan LK, Rosen JM, Varmus HE: Evidence that
transgenes encoding components of the Wnt signaling pathway
preferentially induce mammary cancers from progenitor cells. Proc Natl
Acad Sci USA 2003, 100:15853-15858.
48. Liu BY, McDermott SP, Khwaja SS, Alexander CM: The transforming activity
of Wnt effectors correlates with their ability to induce the accumulation
of mammary progenitor cells. Proc Natl Acad Sci USA 2004, 101:4158-4163.
49. Vaillant F, Asselin-Labat ML, Shackleton M, Forrest NC, Lindeman GJ,
Visvader JE: The mammary progenitor marker CD61/beta3 integrin
identifies cancer stem cells in mouse models of mammary
tumorigenesis. Cancer Res 2008, 68:7711-7717.
50. Zhao JJ, Yang J, Lin J, Yao N, Zhu Y, Zheng J, Xu J, Cheng JQ, Lin JY, Ma X:
Identification of miRNAs associated with tumorigenesis of
retinoblastoma by miRNA microarray analysis. Childs Nerv Syst 2009,
25:13-20.
51. Liu L, Jiang Y, Zhang H, Greenlee AR, Han Z: Overexpressed miR-494
down-regulates PTEN gene expression in cells transformed by anti-
benzo(a)pyrene-trans-7,8-dihydrodiol-9,10-epoxide. Life Sci 86:192-198.
52. Guo H, Ingolia NT, Weissman JS, Bartel DP: Mammalian microRNAs
predominantly act to decrease target mRNA levels. Nature 2010,
466:835-840.
53. Bokobza SM, Ye L, Kynaston HE, Mansel RE, Jiang WG: Reduced expression
of BMPR-IB correlates with poor prognosis and increased proliferation of
breast cancer cells. Cancer Genomics Proteomics 2009, 6:101-108.
54. miRBase [ />55. TM4 Mev [].
56. Partek Genomic Suite [].
57. Tusher VG, Tibshirani R, Chu G: Significance analysis of microarrays
applied to the ionizing radiation response. Proc Natl Acad Sci USA 2001,
98:5116-5121.
58. Benjamini Y, Hochberg Y: Controlling the false discovery rate-a practical
and powerful approach to multiple testing. J R Stat Soc B Stat Methodol
1995, 57:287-300.
doi:10.1186/gb-2011-12-8-r77
Cite this article as: Zhu et al.: Integrated miRNA and mRNA expression
profiling of mouse mammary tumor models identifies miRNA signatures
associated with mammary tumor lineage. Genome Biology 2011 12:R77.
Submit your next manuscript to BioMed Central
and take full advantage of:
• Convenient online submission
• Thorough peer review
• No space constraints or color figure charges
• Immediate publication on acceptance
• Inclusion in PubMed, CAS, Scopus and Google Scholar
• Research which is freely available for redistribution
Submit your manuscript at
www.biomedcentral.com/submit
Zhu et al. Genome Biology 2011, 12:R77
/>Page 16 of 16