Báo cáo y học: "Multivariate explanatory model for sporadic carcinoma of the colon in Dukes’ stages I and IIa"
Bạn đang xem bản rút gọn của tài liệu. Xem và tải ngay bản đầy đủ của tài liệu tại đây (291.67 KB, 8 trang )
Int. J. Med. Sci. 2009, 6
43
I
I
n
n
t
t
e
e
r
r
n
n
a
a
t
t
i
i
o
o
n
n
a
a
l
l
J
J
o
o
u
u
r
r
n
n
a
a
l
l
o
o
f
f
M
M
e
e
d
d
i
i
c
c
a
a
l
l
S
S
c
c
i
i
e
e
n
n
c
c
e
e
s
s
2009; 6(1):43-50
© Ivyspring International Publisher. All rights reserved
Research Paper
Multivariate explanatory model for sporadic carcinoma of the colon in
Dukes’ stages I and IIa
J.M. Villadiego-Sánchez
1
, M. Ortega-Calvo
2
, R.
Pino-Mejías
3
, A. Cayuela
4
, P. Iglesias-Bonilla
2
, F. Gar-
cía-de la Corte
2
, J.M. Santos-Lozano
2
, and José Lapetra-Peralta
2
1. 061 Accident and Emergency Service. Huelva. Spain.
2. Department of Family Medicine, Primary Care Division of Seville and CIBER Fisiopatologia Obesidad y Nutrición
(CB06/03). Instituto de Salud Carlos III. Spain.
3. Department of Statistics and Operations Research. University of Seville. Spain.
4. Research Support Unit. Virgen del Rocio University Hospital. Seville. Spain.
Correspondence to: Manuel Ortega-Calvo. Avda. de la Cruz del Campo Nº 36.Bl.1 2ºA. 41005 - Sevilla (Spain). Email:
Received: 2008.09.10; Accepted: 2009.01.29; Published: 2009.01.30
Abstract
Objective: We obtained before an explanatory model with six dependant variables: age of
the patient, total cholesterol (TC), HDL cholesterol (HDL-C), VLDL cholesterol (VLDL-C),
alkaline phosphatase (AP) and the CA 19.9 tumour marker. Our objective in this study was
to validate the model by means of the acquisition of new records for an additional analysis.
Design: Non-paired case control study.
Setting: Urban and rural hospitals and primary health facilities in Western Andalusia and
Extremadura (Spain).
Patients: At both the primary care facilities and hospital level, controls were gathered in a
prospective manner (n= 275). Cases were prospective and retrospective manner collected
on (n=126).
Main outcome measures: Descriptive statistics, logistic regression and bootstrap analysis.
Results: The AGE (odds ratio 1.02; 95% CI 1.003-1.037) (p= 0.01), the TC (odds ratio
0.986; 95% C.I. 0.980-0.992) (p< 0.001) and the CA 19.9 (odds ratio 1.023; 95% C.I. 1.012-
1.034) (p<0.001) were the variables that showed significant values at logistic regression
analysis and bootstrap. Berkson’s bias was statistically assessed.
Conclusions: The model, validated by means of logistic regression and bootstrap analysis,
contains the variables AGE, TC, and CA 19.9 (three of the original six) and has a level 4 over
5 according to the criteria of Justice et al. (multiple independent validations) [Ann. Intern.
Med.1999; 130: 515].
Key words: Multivariate explanatory model, non-paired case control study, sporadic carcinoma
Introduction
Since publication of the work of Rose et al. [1] on
the relationship between plasma cholesterol and ma-
lignant neoplasia of the colon, there have been multi-
ple bibliographical references for and against this as-
sociation [2-12]. Presently, it is not possible to confirm
a clear relationship between the appearance of spo-
radic colorectal carcinoma (SCRC) and the diminution
of the plasma cholesterol or some of its fractions, nor
have different groups of patients (genetically or
clinically) been discriminated with SCRC and the ex-
Int. J. Med. Sci. 2009, 6
44
istence of the said lipid marker. An abundance of bib-
liographic sources in favour of the prognostic value of
tumour markers, both in pre-clinical and therapeutic
phases, exists [13-17]. Carcinoembryonic antigen
(CEA) is a glycoprotein normally present in plasma in
very small amounts (on the order of nanograms) that
increases in the presence of occult adenocarcinomas.
Its usefulness in colorectal carcinoma [13-14] is well
described both in the diagnostic phase and in clinical
follow up [15]. CA 19.9 is a tumour-associated antigen
that is present in tissues that contain mucin or in the
circulation, and that is located in the sialylated Lewis
A blood group antigen [16-18]. The individuals with
the Lewis a-b genotype cannot synthesize this antigen
(an approximated 5% of the general population).It
was first used for the diagnosis and follow up of car-
cinoma of the pancreas, but its usefulness has also
been demonstrated in SCRC [17-18]. Elevated values
have also been observed in cases of stomach carci-
noma, carcinoma of the gall bladder and/or biliary
tract, and hepatomas. Up until now it has not been
considered as a valid instrument of SCRC screening
because of its low sensitivity. It should be useful, in-
deed, an instrument that mix these three plasmatic
markers (cholesterol or its fractions, CEA and CA
19.9) at early SCRC stages. We published a work pre-
viously on the relationships that could exist between
both types of substances at the time of the clinical
appearance of SCRC [18]. We obtained an explanatory
model with six dependent variables: age of the pa-
tient, total cholesterol (TC), HDL cholesterol (HDL-C),
VLDL cholesterol (VLDL-C), alkaline phosphatase
(AP) and the CA 19.9 tumour marker. Our objective in
this article has been to validate the model by means of
the acquisition of new records for an additional
analysis.
PATIENTS AND METHODS
The study was designed as a non-paired case
control study. The new cases and controls has been
collected over a period of approximately three years
from both urban and rural hospitals and health cen-
ters in Western Andalusia and Extremadura (Spain).
The investigators who collected information in the
health centers (primary care controls) were family
doctors with more than three years work in their re-
spective facilities.
The investigators who collected at the hospital
level (cases and controls) were specialists and training
residents in internal medicine, neurology, allergy, and
clinical pharmacology, and also family doctors in
training o recycling periods. The objectives of the in-
vestigation were explained to all participating physi-
cians and they were provided with record sheets that
contained the exclusion and inclusion criteria.
At both the primary care and hospital level,
controls were gathered in a prospective manner. Only
one hospital control (Virgen del Rocío University
Hospital) was retrospective. The primary care con-
trols were collected in the following health centers:
Pilas (Seville-Rural), Camas (Seville-Rural), Huerta
del Rey (Seville-Urban) and Mérida (Badajoz-Rural).
The cases pertaining to this new sampling were gath-
ered in a retrospective manner from the archives of
the Virgin Macarena and Virgin del Rocío Hospitals of
Seville, the General Hospital of Mérida and also from
the Juan Ramon Jiménez Hospital in Huelva by con-
sulting clinical histories, chosen in a random manner,
over a period of five years (2000-2004).
The inclusion and exclusion criteria used in this
part of the study were the same as for the first part of
the investigation [18]. The diagnostic criteria for in-
clusion of the cases were positive endoscopy and bi-
opsy; those of exclusion were the existence of remote
metastasis, a severe dislipaemia, coexistence with
another neoplasia, hereditary polyposis syndrome,
hereditary non polyposis colorectal cancer, intestinal
inflammatory disease, non-epithelial neoplasias and
the immunodeficiency disorders. Consequently
Dukes’ stage IIA was the maximum SCRC stage seen
[18].
For the controls, the inclusion criterion was the
absence of SCRC. The exclusion criteria were any type
of malignant neoplastic disease, existence of
pre-malignant colorectal lesions, a severe disorder of
lipid metabolism and the immunodeficiency disor-
ders. Neither colonoscopies nor opaque enemas were
performed in the controls. Two years after the selec-
tion of the controls in primary care, a complete tele-
phone follow-up was conducted to determine if any
controls had developed SCRC in the clinical phase.
The total cholesterol was measured using the
TECHNICON RA system. The HDL cholesterol was
measured by the precipitant method. In the original
sample [18], LDL cholesterol was calculated using the
Friedewald formula [LDL = TC – HDL – TG/5]
(where TG = Triglycerides). The VLDL was also cal-
culated using the Friedewald formula [VLDL =
TG/5]. The TG levels were determined by means of
colorimetric enzymatic test consisting of enzymatic
hydrolysis of the TG and the later measurement of
glycerol by means of colorimetry [18]. CA 19.9 (sialy-
lated Lewis blood group carbohydrate antigen) was
determined means of a “sandwich” technique similar
to that used in the measurement CEA [13, 17-18].
The information gathered in this article dates
from 1992 until 2004. The definitive sample size (n =
401) was obtained by uniting the original sample [18]
Int. J. Med. Sci. 2009, 6
45
with the multicenter sample gathered in this valida-
tion work. Quality control was carried out by two
different investigators with special interest in the re-
cords gathered by the different collaborators. The fruit
of that qualitative examination was the rejection of a
total of 9 controls and 3 cases at the defining moment
of the construction of the data package. The funda-
mental cause was the lack of fulfilment of the inclu-
sion criteria. The assembly of the previous data
package with a total of 93 records (53 cases and 40
controls) in DBase IV format was combined with the
new data package in an EXCEL format and with a
total of 308 records was made. The package in EXCEL
format was exported to SPSS format for its later sta-
tistical analysis, and the quality controls were also
made at this stage.
Statistical analysis
An initial study was made on the set of records
to obtain centralization and dispersion measures. Ex-
cessive values were considered as outliers; they were
included in the final quality control because they
could not be excluded based on the eligibility criteria.
A normality study of the quantitative variables in the
combined sample was carried out, including both the
controls and the cases, by means of the Kolmo-
gorov-Smirnov test [19]. A bivariate analysis was
made by means of the Mann-Whitney U- test [19]. A
logistic regression (LR) analysis was carried out and
did not determine a departure from the model ob-
tained in our previous study [18], with the fact of be-
ing case or control as dependent variable and the
variables age in years (AGE), total cholesterol (TC),
HDL fraction (HDL), VLDL fraction (VLDL), alkaline
phosphatase (AP), and the CA 19.9 marker as predic-
tors [20]. Sample size was taken into account [21]. A
first analysis was made on the “raw” data package.
The selection of variables was always backward. In
the variables in which lost information surpassed
20%, we decided to impute values by means of the
SPSS Program (linear interpolation).
Validity
We tried “to repeat” the observational analysis
of our previous study [18] with the application of
non-conditional LR to the new data package to vali-
date it in accordance with the criteria of Justice et al
[22]. In order to appreciate if Berkson’s bias [23] (in-
ternal validity) [24] influenced our observations and
results, we designed a double study with LR, first
constructing a statistical model with the controls
gathered in primary care and the cases, and later, by
constructing another model with the controls gath-
ered in the hospitals and with the same cases. Finally,
both models would be compared. If Berkson’s bias
existed and following the ideas of Feinstein et al, the
controls gathered in primary care would tend to ele-
vate the odds ratio (OR) in a structural manner in the
designs of cases and controls [23]. As a final step in
the validity study, a “bootstrap” analysis was applied
to the complete sample of cases and controls [25-26].
By means of program R the following computer algo-
rithm was applied: 1) Generation of 2000 “bootstrap”
samples. 2) For each sample, a model of LR was ad-
justed by means of backwards selection, calculating
the area under the receiver operating characteristic
curve (ROC). 3) Summary of each one of the set of
2000 “bootstrap” coefficients [25-26].
RESULTS
The final sample was composed of a total of 401
elements (126 cases and 275 controls; control/case
ratio = 2.18; prospective / retrospective ratio = 4.41).
Men accounted for 188 (46.9%) and women 213
(53.1%) of the patients (Pearson’s Chi-square test; p >
0.05). The centers of origin are shown in Table 1. There
were no significant differences when contrasting sex
and center of origin (Pearson’s Chi-square test;
p>0.05). The descriptive statistic is gathered in Table
2.
Table 1. Reference Centers. Data Reference Centers: 1.
Pilas Health Center (Seville), 2. Mérida Health Center,
General Hospital of Mérida (Badajoz). 3. Camas Health
Center (Seville). 4. Virgen Macarena University Hospital
(VMUH) (Seville) 5. Juan Ramon Jiménez Hospital (Huelva).
6. Huerta del Rey Health Center (Seville). 7. Virgen del
Rocío University Hospital (VRUH) (Seville).
Center Total
1 2 3 4 5 6 7
control 60 36 14 114 32 18 1 275 Var.
case
Case 0 12 0 64 5 0 45 126
Total 60 48 14 178 37 18 46 401
NOTE: The Pilas Health Center had the VRUH as a hospital refer-
ence center and the Huerta del Rey Health Center had VRUH and
VMUH.
Table 2. Estimators of Centralization and Dispersion of
Continuous Variables.
N Mini
mum
Maxi-
mum
Average Mean Stan-
dard Error
Standard
deviation
AGE 401 24 94 63.42 .744 14.890
TC 399 81 313 197.70 2.140 42.737
HDL 346 17 176 45.65 .925 17.202
LDL 191 38 235 131.68 2.508 34.656
VLDL 228 10 216 54.90 3.617 54.623
TG 264 25 566 121.21 4.276 69.482
AP 357 29 500 154.67 4.292 81.104
CA19_9 380 .1 162.0 19.938 1.2423 24.2168
AGE-age in years; TC- total cholesterol; HDL-high density lipo-
protein; LDL-low density lipoprotein; VLDL-very low density
lipoprotein; TG-triglycerides; AP-alkaline phosphatase.
Int. J. Med. Sci. 2009, 6
46
The values obtained for the Kolmo-
gorov-Smirnov test (study of normality of continuous
variables) are shown in Table 3.
Table 3. Normality Analysis of the Continuous Variables.
Kolmogorov-Smirnov test for a sample.
N Normal Parameters
(a,b)
Z of Kol-
mogoro &
Smirnov
Sig. asin-
totic.
(bilateral)
Media Standard
deviation
AGE 401 63.42 14.890 1.496 * .023
TC 399 197.70 42.737 .649 .794
HDL 346 45.65 17.202 2.227 * .000
LDL 191 131.68 34.656 1.075 .198
VLDL 228 54.90 54.623 4.664 * .000
TG 264 121.21 69.482 2.543 * .000
AP 357 154.67 81.104 1.146 .145
CA19_9 380 19.938 24.2168 4.035 * .000
a. The distribution of contrast is Normal.
b. Calculated from the data.
AGE-age in years; TC- total cholesterol; HDL-high density lipo-
protein; LDL-low density lipoprotein; VLDL-very low density
lipoprotein; TG-triglycerides; AP-alkaline phosphatase. (* signifi-
cant values – non normal variables - see discussion).
Table 4 shows the application of the
Mann-Whitney U-test to the continuous variables to
study differences between the distributions between
the cases and controls. The adjustment of the
non-conditional logistic regression model, on the total
data set, is shown in Table 5. The same type of analy-
sis, but with the primary care and hospital controls
are shown in Tables 6 and 7, respectively. The inter-
action [CA 19.9 x AGE] is in Table 8. The “bootstrap”
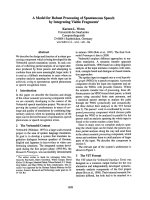
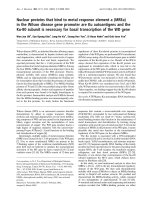
analysis is shown in Figures 1 and 2. The HDL, LDL,
and VLDL variables were dealt with by imputed val-
ues (HDL-1, VLDL-1 and LDL-1) because the loss of
information was superior to 20% (linear interpolation
- SPSS).
Table 4. Statistics of contrast (a) for comparison of con-
tinuous variables, according to whether cases or controls.
Mann-Whitney U-test Sig. asintotic. (bilateral)
AGE 14285.500 * .005
TC 10815.500 .* 000
HDL 7097.000 * .000
LDL 1835.000 .* 000
VLDL 2881.500 .* 000
TG 7779.500 .154
AP 14037.000 .702
CA19_9 10417.500 * .000
AGE-age in years; TC- total cholesterol; HDL-high density lipo-
protein; LDL-low density lipoprotein; VLDL-very low density
lipoprotein; TG-triglycerides; AP-alkaline phosphatase. (* signifi-
cant values).
Table 5. Final Model Adjusted with Raw Values.
B Wald Degree
of free-
dom (df)
Sig. Exp(B) 95.0% C.I. for
EXP(B)
Lower Upper
Step
1(a)
AGE .020 5.563 1 .018 * 1.020 1.003 1.037
TC -.014 19.695 1 .000 * .986 .980 .992
CA19_9 .023 17.946 1 .000 * 1.023 1.012 1.034
Constant .073 .009 1 .926 1.076
AGE-age in years; TC- total cholesterol. (* odds ratios).
Table 6. Logistic regression made with hospital cases and
controls of primary care.
95.0% C.I. for
EXP(B)
B S.E. Wald df Sig. Exp(B)
Lower Upper
AGE .035 .010 11.420 1 .001 * 1.036 1.015 1.057
TC -.017 .004 17.891 1 .000 * .983 .975 .991
CA19_9 .045 .010 19.738 1 .000 * 1.046 1.026 1.067
Step
1(a)
Constant .267 .973 .075 1 .784 1.306
AGE-age in years; TC- total cholesterol. (* odds ratios).
Table 7. Logistic regression made with hospital cases and
controls.
95.0% C.I. for
EXP (B)
B S.E. Wald df Sig. Exp
(B)
Lower Upper
AGE .013 .009 1.888 1 **
.169
*
1.013
.994 1.032
TC -.012 .003 12.475 1 .000 *
.988
.982 .995
CA19.9 .015 .005 7.393 1 .007 *
1.015
1.004 1.026
Step
1(a)
Constant .892 .887 1.011 1 .315 2.440
AGE-age in years; TC- total cholesterol. (* odds ratios). (** non
significant values – Berkson´s biass assessment – Feinstein et al.
1986. [23]).
Table 8. Logistic regression with the variable interaction
(CA19.9 x AGE). Cases and controls of primary care and
hospital.
95.0% C.I. for
EXP (B)
B S.E. Wald df Sig. Exp
(B)
Lower Upper
AGE .049 .013 14.486 1 .000 *
1.051
1.024 1.078
CA19.9 .129 .036 12.687 1 .000 *
1.138
1.060 1.222
TC -.013 .003 18.409 1 .000 *
.987
.981 .993
CA19.9xAGE .002 .001 9.391 1 .002 *
.998
.997 .999
Step
1(a)
Constant -
2.035
1.064 3.656 1 .056 *
.131
AGE-age in years; TC- total cholesterol. (* odds ratios).
Int. J. Med. Sci. 2009, 6
47
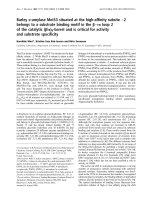
Figure 1. 2000 bootstrap values of Area under the ROC
Curve.
Figure 2. 2000 bootstrap coefficients. AGE-age in years;
TC- total cholesterol; TG-triglycerides; AP-alkaline phos-
phatase; LDL-low density lipoprotein; VLDL-very low den-
sity lipoprotein; HDL-high density lipoprotein.
DISCUSSION
We have made an investigation to try to vali-
date a multivariate explanatory model of the diagno-
sis of SCRC in Dukes’ stages I and IIa using
non-conditional logistic regression and “bootstrap”
analyses. The original model with six variables was
published [18] and was the departure point for the
accomplishment of this work. The new sample size
was included 401 elements and was composed of 126
cases and 275 controls. The design was non-paired. A
total of 308 new records pertain to the validation
phase of the work. The original sample was gathered
entirely in the Virgen Macarena University Hospital
of Seville (VMUH) from 1992 to 1995 in a prospective
manner. From the validation phase, 11 cases and 74
controls of the sample also pertain to this center. The
new cases were compiled in a retrospective manner
from the general archives of clinical histories, always
respecting the inclusion criteria (period 2000-2004),
and the new controls were gathered in a prospective
manner in the Internal Medicine Service during 2003.
From 2001 to 2003, the rest of the cases and controls in
this investigation were collected in the centers of ori-
gin (Table 1). Therefore, the time limits of our data
collection were from 1992 to 2004. Throughout this
time, the inclusion and exclusion criteria were scru-
pulously respected. The general ratio of prospective /
retrospective elements was 4.41/1, which we found
acceptable. Each health center and each hospital were
connected to each other in such a way that the users of
the primary care centers were admitted in the tertiary
care centers, thereby fulfilling a precept of
case-control studies. The ratio between these was 2.18
controls for each case, which has a level of acceptable
internal efficiency with regard to design.
The descriptive results of the complete data
package are shown in Table 2. Among them, it is pos-
sible to highlight the arithmetic means of the cases
that are lower than those of the controls with regard
to the lipid variables referred to, except for the
triglycerides. After the application of the Kolmo-
gorov-Smirnov test, it was possible to consider the
variables: TC (n = 399), LDL (n = 191), and AP (n =
357) as normal (Table 3). For the rest of the variables,
the null hypothesis of normal distribution was re-
jected [19].
There was no significant difference in the dis-
tribution by sex between the cases and the controls
(Pearson’s Chi-Square test, p = 0.20). Neither was
there a significant difference found in the distribution
by sex and reference centers (Pearson’s Chi-Square
test, p = 0.26). We believe that these results show the