Báo cáo y học: " Differential patterns of intronic and exonic DNA regions with respect to RNA polymerase II occupancy, nucleosome density and H3K36me3 marking in fission yeast" pps
Bạn đang xem bản rút gọn của tài liệu. Xem và tải ngay bản đầy đủ của tài liệu tại đây (3.15 MB, 12 trang )
RESEARC H Open Access
Differential patterns of intronic and exonic DNA
regions with respect to RNA polymerase II
occupancy, nucleosome density and H3K36me3
marking in fission yeast
Brian T Wilhelm
1,2*
, Samuel Marguerat
1
, Sofia Aligianni
1,3
, Sandra Codlin
1
, Stephen Watt
1,4
and Jürg Bähler
1
Abstract
Background: The generation of mature mRNAs involves interconnected processes, including transcription by RNA
polymerase II (Pol II), modification of histones, and processing of pre-mRNAs through capping, intron splicing, and
polyadenylation. These processes are thought to be integrated, both spatially and temporally, but it is unclear how
these connections manifest at a global level with respect to chromatin patterns and transcription kinetics. We
sought to clarify the relationships betw een chromatin, transcription and splicing using multiple genome-wide
approaches in fission yeast.
Results: To investigate these functional interdependencies, we determined Pol II occupancy across all genes using
high-density tiling arrays. We also performed ChIP-chip on the same array platform to globally map histone H3 and
its H3K36me3 modification, complemented by formaldehyde-assisted isolation of regulatory elements (FAIRE).
Surprisingly, Pol II occupancy was higher in introns than in exons, and this difference was inversely correlated with
gene expression levels at a global level. Moreover, introns showed distinct distributions of histone H3, H3K36me3
and FAIRE signals, similar to those at promoters and terminators. These distinct transcription and chromatin
patterns of intronic regions were most pronounced in poorly expressed genes.
Conclusions: Our findings suggest that Pol II accumulates at the 3’ ends of introns, leading to substantial
transcriptional delays in weakly transcribed genes. We propose that the global relationship between transcription,
chromatin remodeling, and splicing may reflect differences in local nuclear environments, with highly expressed
genes being associated with abundant processing factors that promote effective intron splicing and transcriptional
elongation.
Background
Generation of mature mRNA transcripts requires com-
plex and interconnected processes that involve opening
of the local chromatin structure around the DNA region
to be transcribed, binding and transcription by RNA
polymerase II (Pol II), and processing of the pre-
mRNAs, including the splicing of the non-coding
introns [1,2]. Protein production is streamlined at sev-
eral levels of gene expression, including coordinated
transcription and translation [3]. Moreover, there is
some evidence for functional coupling between tran-
scription and pre-mRNA processing [4-6].
We have previously reported that, in f ission yeast
(Schizosaccharomy ces pombe), highly transcribed genes
tend to be most efficiently spliced while lowly tran-
scribed g enes are less efficiently spliced [7]. The reason
for this unexpected global coordination between tran-
scription and splicing is not known. Moreover, Pol II-
directed transcription is controlled by permissive or
repressive chromatin modifications but in turn also
affects such modifications [8]. Splicing is initiated co-
transcriptionally in a chromatin context, which ra ises
the possibility of a functio nal relat ionship bet ween
* Correspondence:
1
Department of Genetics, Evolution and Environment and UCL Cancer
Institute, University College London, Darwin Building, Gower Street, London
WC1E 6BT, UK
Full list of author information is available at the end of the article
Wilhelm et al. Genome Biology 2011, 12:R82
/>© 2011 Wilhelm et al.; licensee BioMed Central Ltd. This is an open access article distri buted under the terms of the Creative Co mmons
Attribution License ( which permits unrestricted use, distribution, and reproduction in
any medium, provided the original work is prop erly cited.
splicing and the local chromatin environment. In addi-
tion to controlling the accessibility of DNA to the basal
transcriptional machinery, there is evidence that chro-
matin structure can influence the co-transcriptional spli-
cing of immature transcripts [9-11]. Notably, differential
marking of introns and exons has recently been reported
in several organisms [12,13], although the mechanism
and functional consequences of such marking are not
clear.
We applied multiple genome-scale approaches in fis-
sion yeast to clarify the relationships between chromatin,
transcription and splicing. Introns, besides promoter and
terminator regions, were relatively depleted of histones
andalsoshoweddistinctchromatin patterns. Unexpect-
edly, Pol II occupancy was much higher in intronic than
in exonic DNA regions, most notably in lowly expressed
genes. This differential marking of introns at the DNA
level suggests that Pol II stalls at the 3’-ends of intronic
regions, leading to substantial accumulation in the
introns of lowly transcribed genes. We speculate that
these patterns reflect a functional coupling between tran-
scription, chromatin remodeling, and splicing, and that
only highly transcribed genes are embedded in processive
environments such as ‘ transcription factories’ ,where
abundant processing factors promote effective intron
splicing and transcriptional elongation.
Results and disc ussion
Experimental approach
In order to unc over any connections between transcrip-
tion, intron splicing, and chromatin marks in rapidly
growing fission yeast cells, we determined global Pol II
occupancy using chromatin immunoprecipitation on
microarray (ChIP-chip) experiments. Furthermore, we
applied ChIP-chip experiments to analyze the global dis-
tributions of histone H3 and lysine 36 trimethylation of
histone H3 (H3K36Me3), a modification that is enriched
in the body of actively transcribed genes [14]. In addi-
tion, to verify the histone H 3 occupancy and reveal
genomic regions that are relatively protein free, we
applied formaldehyde-assisted isolation of regulatory ele-
ments (FAIRE) [15,16]. We used the same high-density
Affymetrix tiling array platform for all these genome-
wide approaches (Materials and methods).
Distinct Pol II occupancy and chromatin patterns in
promoter and terminator regions
The 5’ ends of genes, corresponding to the nucleosome-
free regions of promoters, had high FAIRE signals in fis-
sion yeast (Figure 1). These results are consistent with
the originally published results in human [15]. Figure 2
shows the average patterns for the differen t chromatin-
and transcription-related features across intron-less and
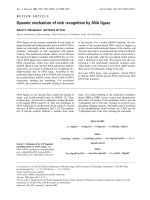
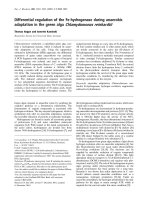
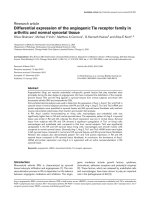
Figure 1 An example of FAIRE, Pol II ChIP-chip, and expression data. The top and bottom panels with green points depict expression data
for the upper and lower strand, respectively, obtained from random-primed RNA hybridized to Affymetrix tiling arrays with each point
representing a single probe. The second and fourth panels show annotated genes in the region around sec21 (SPAC57A7.10c), with exons
numbered underneath the gene. The third panel shows a 5 probe running average of Pol II signals (black points) or FAIRE signals (pink/red
points). The horizontal red line shows the 85% percentile line for all FAIRE probe signals, with probes above this cut-off colored red and those
below colored pink. Note that FAIRE and Pol II signals are not strand-specific.
Wilhelm et al. Genome Biology 2011, 12:R82
/>Page 2 of 12
intron-containing genes. Peaks of Pol II enrichment were
evident in the promoter regions o f genes, reflecting the
accumulation of Pol II before transcription elongation
[17,18]. Moreover, these regions showed high FAIRE sig-
nals, but relativ e depletion of histone H3 and, even more
so, for its H3K36Me3 modification (Figure 2).
Gene promoters are known to contain nucleosome-
free regions [19-21]. Notably, we found that the 3’ ends
of genes, corresponding to the terminator regions, also
show Pol II enrichment, low histone H3 density and
high FAIRE signal (Figures 2 and 3). While the nucleo-
some-free regions i n promoters have been well charac-
terized, a similar depletion of nucleosomes in terminator
regions is not as well defined. A recent report in bud-
ding yeast shows depletion of nucleosomes at the 3’ end
of transcribed genes, and this depletion is coupled to
(a)
(b)
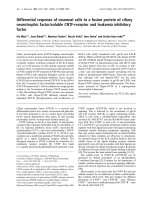
FAIRE, H3, RNA Poll II and H3K36(Me)3 IP signal across average unspliced gene
FAIRE, H3, RNA Pol II and H3K36(Me)3 IP signal across average spliced gene
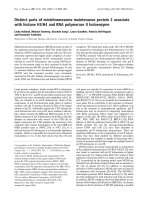
Figure 2 Profiles of tr anscription- and chromatin-related patterns acros s average spliced and unspliced genes. (a) Average unspliced
gene profiles for FAIRE (red), histone H3 (blue), H3K36me3 (green, normalized for H3 signals), and Pol II (black) signals from Affymetrix tiling
arrays. Promoter and terminator regions are taken as 400 bp up- and downstream of the start and stop codons, respectively, and divided into 10
bins of 40 bp each, while the coding regions were divided into 20 bins of equal size. Black vertical lines separate different gene sections, and
each plotted point represents the average of all probes that fall into the respective location bin. Color-coded scales for FAIRE (F) and Pol II (P)
signals are shown on the left y-axis of the graph, while the scales for histone H3 (H) and H3K36me3 (K) are shown on the right y-axis. (b)
Average spliced gene profiles for FAIRE (red), histone H3 (blue), H3K36me3 (green), and Pol II (black) signals from Affymetrix tiling arrays as in (a).
Wilhelm et al. Genome Biology 2011, 12:R82
/>Page 3 of 12
transcriptional activity [22].Ourfindingsarealsocon-
sistent with reports in mammalian cells that describe
pausing of Pol II in terminator regions [23,24]. The start
and end of introns showed lower levels of H3 occupancy
(Figure 2b). This pattern might result from a ‘ looped’
arrangement of exons and introns analogous to that
proposed for the human BRCA1 gene [25]. Although
this exon-intron pattern is not reflected in FAIRE, the
overall patterns support the notion that nucleosome
density is likely the major determinant for the FAIRE
signals.
Gene expression levels affect Pol II occupancy and
chromatin patterns across genes
We next assessed the effects of transcript levels on the
observed Pol II- and chromatin-related patterns across
gen es. To t his end, we sorted all genes with measurabl e
expression on Affymetrix chips into decile ranked
groups, with the first decile representing the 10% most
highly expressed genes, and so on. Average expression
values for unspliced and spliced genes were calculated
for each data set and for each expression bin and
plotted either relative to the values in each bin (Figure
3) to highlight the range within each expression group
or on a single scale according to the range of values of
theentiredataset(Figure4)toshowtheabsolute
enrichment. This analysis revealed that gene expression
levels strongly influence the Pol II- and chromatin-
related patterns. Coherent differences depending on
expression level group were apparent (Figure 4): the
most highly expressed genes showed the highest Pol II
occupancy (Figure 4a), but the lowest density of histone
H3 (Figure 4b), and the highest levels of H3K36me3
modification (after correcting for nucleosome density;
Figure 4c). Glover-Cutt er et al . [26] made similar obser-
vations of inverse enrichment between Pol II and
nucleosomes, which could reflect displacement of
nucleosomes by Pol II. The Pol II patterns were also
apparent at the level of highly or lowly expre ssed single
genes (Additional file 1).
(a)
(b)
(c)
(d)
RNA Pol II ChIP across average spliced gene
H3 ChIP across average spliced gene
H3K35 ChIP across average spliced gene
FAIRE across average spliced gene
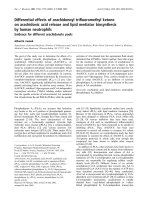
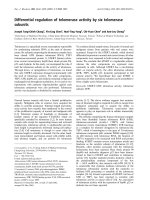
Figure 3 Profiles of tr anscrip tion and chromatin-relat ed patterns as a function of gene expression . (a-d) Probe signals for Pol II (a),
histone H3 (b), H3K36me3 (c), and FAIRE (d) were used to generate average spliced gene profiles that were grouped into ten ranked bins based
on Affymetrix expression data. Scales for the relative data range from each expression bin were used to generate the plots. Identical data plotted
on the same absolute y-scale for all expression bins is presented for average spliced and unspliced genes in Figure 4. The color bar at bottom
depicts average expression levels of bins (red, high expression; green, low expression), and black vertical lines within each box demarcate
different sections within the average gene.
Wilhelm et al. Genome Biology 2011, 12:R82
/>Page 4 of 12
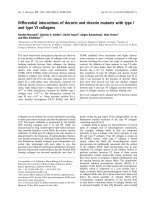
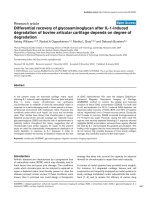
Figure 4 Profiles of transcription and chromatin-related patterns as a function of gene expression. (a-d) Probe signals for Pol II (a),
histone H3 (b), H3K36me3 (c), and FAIRE (d) were used to generate average spliced gene profiles that were grouped into ten ranked bins
based on Affymetrix expression data. Average values for each bin within each expression group were plotted on the same absolute scale for
each experiment type. For panel (a), the background level of RNA Pol II enrichment was estimated by calculating the average signal from all
probes (152,253) that fell outside of binned regions for analysis. This background average is shown as a horizontal blue solid line. Because some
atypically large untranslated regions and novel annotated regions will also contribute signal to this value, a second average (horizontal blue
dotted line) is shown where the top 10% of probes by signal (15,226) are removed. The red-to-green color bar at the bottom of the figure
depicts average expression levels of bins (red, high expression; green, low expression), and black vertical lines within each box demarcate
different sections within the average gene.
Wilhelm et al. Genome Biology 2011, 12:R82
/>Page 5 of 12
Expression level-dependent differences in Pol II pro-
moter patterns were also apparent: only lowly expressed
genes showed promoter regions with higher levels of Pol
II enrichment relative to downstream exonic regions,
while highly expressed genes had more Pol II in exonic
regions (Figure 3a). While Pol II is known to pause on
promoters of some genes [17,18], a global and gradated
relationship between g ene expression level and Pol II
enrichment at promoters has not been reported pre-
viously. Unlike the promoter-associated accumulation,
the increased Pol II occupancy at the terminator region
showed little d ifference with varying expression levels
(Figure 3). Our data show that Pol II behavior in termi-
nator regions is less dependent on expression level than
in promoter regions. The enrichment of Pol II in the
terminator region could reflect the time required for the
release of Po l II from the DNA and/or interactions
between promoter and terminator regions [25,27,28].
Distinct chromatin patterns in intronic regions
To our surprise, intronic regions showed distinct pat-
terns with respect to the chromatin-related features.
The overall H3 occupancy was lower in introns than in
surrounding exons, and it dropped even lower in exon-
intron junctions at both 5’ and 3’ ends of introns (Figure
2b). A pattern of decreasing nucleosome occupancy at
exon-intron bou ndaries has also been described in other
organisms [29,30]. Accordingly, the FAIRE signals were
substantially higher in i ntrons than in exons, similar to
the promoter and terminator regions (Figures 2b and
5a). This effect of increased FAIRE signals was not
dependentonintronpositionwithingenes(Figure6b).
The differential patterns were not caused by sequence
bias between introns and exons because the
hybridization signals were normalized using genomic
DNA signals (or input signals for ChIP-chip experi-
ments) to correct for hybridization differences due to
GC content [7,31]. Moreover, within average introns, we
observed higher P ol II and FAIRE signals towards the 3’
ends of introns (Figure 2b). This effect did not reflect
any sequence disparity: a GC content comparison of 25-
bp sequences (the length of one microarray probe) at
either end of i ntrons revealed no significant differences
(p = 0.48).
Finally, we also detected significantly lower densities
of the H3K36me3 modification (normalized for histone
H3 density) within introns compared to surrounding
exons (Figures 2b and 5c). Other papers have also
reported such differential marking of introns and exons
for the H3K36me3 modification in worms and humans
[12,29,30]. This modification is enriched within t he
ORFs of transcribe d genes an d is c atalyzed by the his-
tone methyltransferase Set2 [32,33], which is conserved
in fission yeast [14]. The H3K36me3 modification
depends on the interaction of Set2 and the terminus of
Pol II [34]; it is possible that the altered transcription
kinetics that we detect in intronic regions interferes
with H3K36me3 marking. It has been reported that Pol
II in human cells is more enriched in exons t han in
introns, the reverse from our data [29]. A possible
explanation for th is discrepancy is that, in the previous
study, any signals that fall within a 400-bp window (cen-
tered on the exon) are associated with that exon. Given
the small average size of human exons ( approximately
200 bp), extended intronic sequen ces on either side of
exons would have been included with the exons for the
analysis. If Pol II pauses at the 3’ end of introns, as indi-
cated by the Pol II and FAIRE enrichments in the much
Figure 5 Violin plots of FAIRE and Pol II signals. (a-c) Violin plot s (combining box plot an d kernel density plot) show the uni- modal
distribution of signals for probes entirely within introns and exons (spliced genes) or entirely within coding regions (unspliced genes) for FAIRE
(a), Pol II occupancy (b), and H3K36me3 ChIP-chip signals (c). The median signal for probes in exons is shown by the dashed horizontal line.
Signal differences (shown on the y-axis) between introns and exons (indicated by the bar and asterisk) are significantly different (P-value < 2.2 ×
10
-16
; Welch two sample t-test).
Wilhelm et al. Genome Biology 2011, 12:R82
/>Page 6 of 12
Figure 6 FAIRE/Pol II occupancy signals for introns and exons by position. (a, b) Box plots showing signal distributions for Pol II occupancy
(a) and FAIRE (b) in spliced genes by exon or intron number (E1 for exon1, I1 for intron1, and so on). The average signal for each intron
position was compared to the average signal for each previous exon in order to assess statistical significance. Box widths are proportional to the
number of probes in each class and position tested. Signals in exon/intron sets (marked with lines and symbols) are significantly different (*P <
2.2 × 10
-16
,
§
P < 7.2 × 10
-7
,
†
P < 5.6 × 10
-13
,
‡
P < 0.0007,
+
P < 6.7 × 10
-09
; Welch two sample t-test).
Wilhelm et al. Genome Biology 2011, 12:R82
/>Page 7 of 12
smaller fission yeast introns (typically < 100 bp), this
may not have been detected in human [29]. Of course,
it is also possible that Pol II progression across exonic
and intronic regions differs between fission yeast and
human genes.
Intronic transcription and chromatin are affected by gene
expression levels
As described a bove for other gene regions, we also
assessed the effects of transcript levels on the observed
Pol II- a nd chromatin-related patterns ac ross intronic
regions (Figures 3 and 4). The introns of lowly
expressed genes showed more pronounced drops i n
H3K36me3 modification signals relative to neighboring
exons (Figure 3c). Strikingly, the relative difference in
Pol II enrichments in introns compared to exons was
directly related to the expression level of genes: the
ratios of intronic to exonic Pol II occupancy levels
increased with decreasing gene expression (Figure 7a).
The same effect was evident when plotting the p-values
of t-tests of the intron and exon signals for each expres-
sion bin against expression bin numbers (Figure 7b).
These data, which cannot be explained by biased intron
size as a function of gene expression (Additional fil e 2),
demonstrate that with decreasing gene expressi on, there
is decreasing H3K36me3 modification a nd increasing
Pol II a ccumulation within intronic regions relat ive to
exonic regions.
Pol II enrichment in intronic regions
In accordance with the FAIRE signals, Pol II occupancy
was also significantly higher on average in intronic
regions than in exonic regions (Figures 2b and 5b). Con-
sistent results were obtained from Pol II occupancy and
quantitative real time PCR data of single genes (Addi-
tional files 1 and 3). This increased Pol II signal was not
dependentonintronpositionwithingenes(Figure6b).
The average intron of spliced genes t hus showed a pat-
tern of Pol II enrichment similar to the promoter and
terminator regions, raising the possibility that Pol II also
accumulates in intronic regions. Notably, the Pol II and
FAIRE signals increased throughout intronic regions
and peaked towards the 3’ ends of introns (Figure 3a, d).
We therefore propose that Pol II actually accumulates at
the 3’ end of introns before resuming transcription.
Given that Pol II accumulation was most pronounced in
the most lowly expressed genes (Figures 3a and 7 ), any
pausing seems to mostly affect genes that are poorly
transcribed. Anti-sense transcription is unlikely to cause
Pol II accumulation in introns as only 11 of 372 anti-
sense transcripts actually overlap with introns and none
reside entirely within introns [7].
Analyzing the processivity of Pol II, it has been noted
tha t transcription does not continuously progress at the
highest possible speed [35]. Pol II enrichment in introns
could be related to observations that transcriptional
speed can play a role in influencin g alternative splicing
oftranscripts[36].Weenvisagetwo,notmutually
exclusive, possibilities why Pol II is enriched on int rons.
First, certain chromatin remodeling factors required to
displace nucleosomes could be limiting. Recent studies
havenotedthatexonscontainwellpositionednucleo-
somes relative to introns [29,30,37]. A s udden ‘ road
block’ of nu cleosomes at the end of introns m ight cause
Pol II to slow down or pause. Alternatively, or in addi-
tion, Pol II enrichment in introns could be directly
linked to co-transcriptional splicing and could reflect
the time required for splicing to finish before transcrip-
tion can resume. Although we hav e not investigated the
dynamics of the Pol II enrichmen t, evidence exists for a
kinetic link betwe en transcription and splicing [38],
where cellular treatment to pause elongating Pol II
Figure 7 Inverse relationship between gene expression and Pol
II accumulation in introns. (a) The ratios between average Pol II
occupancy in upstream (blue) and downstream (green) exons
relative to average Pol II occupancy in introns (in log
2
values) are
plotted as a function of expression bins. (b) Pol II occupancy signals
from intron and exon probes for each expression group were used
for a Welch two sample t-test, and the resulting P-value is plotted
against the expression bins. The increasing significance of the P-
values is inversely correlated with the gene expression level.
Wilhelm et al. Genome Biology 2011, 12:R82
/>Page 8 of 12
results in increased co-transcriptional splicing. Some
RNA processing or export factors are known to be asso-
ciated with intronic regions [39]. Moreover, we have
previously observed a global coordination between tran-
scriptional and splicing efficiencies, with increased tran-
scription leading to increa sed splicing in two genes
tested [7].
Conclusions
We concl ude that intronic regio ns in f ission yeast show
patterns distinct from exonic regions with respect to
several transcription- and chromatin-related features
analyzed here, and that these patterns are related in
large part to the transcrip tional activities of genes.
Furthermore, our data suggest that Pol II accumulates
at the 3’ end of introns, most notably in lowly expressed
genes.
Intriguing studies in budding yeast have recently
reported splicing-related pausing of Pol II during tran-
scription [40-42]. Carillo Oesterreich et al. [42] fou nd
that Pol II pauses after the last intron to allow sufficient
time for splicing before transcriptional terminatio n.
Alexander and co-workers [41] demonstrate that Pol II
accumulates transiently at the 3’ ends of introns on two
reporter genes, which coincides with splicing factor
recruitment and the detection of spliced mRNA. This
pausing is tied to productive splicing and is accompa-
nied by phosphorylation of the paused Pol II. The
authors propose that transcri ptional pausing is enforced
by a checkpoint that is linked to co-transcripti onal spli-
cing [41].
Our data confirm and extend these findings in several
respects. First, we provide evidence for intronic Pol II
enrichment in fission yeast, which is only distantly
related to budding yeast and contains many more
introns (approximately 5,000 versus approximately 300
introns), suggesting that this phenomenon is conserved
throughout eukaryotes. Second, we provide global data
for all genes and introns, indicating that Pol II enrich-
ment in introns is a general phenomenon. Third, we
show that Pol II enrichment is linked to gene expression
levels: the relative difference in Pol II enrichment in
introns compared to exons is most pronounced in the
lowly transcribed genes and becomes weaker in more
highly transcribed genes. Moreover, the lowly tran-
scribed genes also show the largest drop in H3K36me3
modification within intronic regions. These findings are
consistent with differential H3K36me3 marking of intro-
nic regions reflecting disrupted local chromatin struc-
ture caused by Pol II accumulation and splicing, which
could interfere with H3K36me3 marking by Set2. On
the other hand, it is possible that the differential
H3K36me3 marking provides a favorable chromatin
context for splicing to occur.
The global coordination between transcriptional and
splicing efficiencies [7] and the inverse relationship
between Pol II pausing and gene expression levels have
important implications for current models of transcrip-
tion and splic ing. We propose that hig hly expressed
genes out-compete lowly expressed genes for limiting
splicing factors, leading to increased Pol II accumulation
in the introns of lowly expressed genes. Transcription
has been shown to take place in ‘transcription factories’
[43-46], and we speculate that only the highly tran-
scribed g enes are embedded in the processive environ-
ments of such factories, where abundant processing and
splicing factors promote effective intron splicing and
thus transcriptional elongation. Recent findings in fis-
sion yeast reveal that highly expressed genes associate
with each other in the nucleus [47]. So if actively
expressed genes either create, or are recruited to, highly
processive transcription factories, all the steps required
to generate mature mRNAs could be completed more
efficiently and in a coordinated manner. Further investi-
gations will define the precise mechanisms of the strik-
ing coordination between transcription, chromatin and
splicing, and the functional importance of Poll II paus-
ing within introns.
Materials and methods
Yeast strains and experimental conditions
Wild-type fission yeast cells (972 h
-
) were grown in rich
yeast extract media at 32°C before being harvested for
all experiments at exponential phase (approximately 5 ×
10
6
cells/ml).
ChIP-chip methods
Chromatin immunoprecipitions were performed, in bio-
logical duplicate, as described [7] using an antibody spe-
cific for the Pol II carboxy-terminal domain (CTD)
(4H8, Abcam Cambridge, UK), histone H3 (ab1791,
Abcam) or H3K36me3 (ab9050, Abcam). The two Pol II
ChIP-chip experiments analyzed here were those
reported by [7]. The w hole cell extract was prepared
using a Fastprep machine with glass beads to break cells
after fixation, and the resulting lysate was sonicated to
an average size of approximately 150 bp using the bior-
uptor (3 × 5’ , 30 s on, 30 s off). The immunoprecipi-
tated material and input control were amplified in two
steps as described [48]. During the second step, dUTPs
were added t o the PCR mix for subsequent fragmenta-
tion of the products. Fragmentation and l abelling of the
amplified products were performed using the Gene-
Chip
®
WT Double-Stranded DNA terminal labelling kit
(Affymetrix Santa Clara, CA, USA). The duplicated
immunoprecipitated samples and corresponding input
material were hybridized on four separate Affymetrix
GeneChip
®
S. pombe Tiling 1.0FR arrays. The log
2
Wilhelm et al. Genome Biology 2011, 12:R82
/>Page 9 of 12
signalsoftheprobesontheinputarraysweresub-
tracted from the log
2
signals of the Pol II arrays and the
biologica l repl icates were averaged. The H3K36me3 sig-
nals were normalized for the histone H3 signals.
FAIRE methods
Biological triplicates of FAIRE were performed essentially
as described [15]. Briefly, yeast cells were fixed with for-
maldehyde in medium at a final concentration of 1%.
Cells were left to incubate for 10 minutes at room tem-
perature before being sp un down, washe d once with
water, and resuspended in the same lysis buffer as for
ChIP with protease inhibitors (mini-complete EDTA free
tablets, Roche Applied Science , Welwyn, UK). Cells were
broken using glass beads and a Fastprep machine (20 sec-
onds at 6.0 m/s) and then sonicated using a Bioruptor
(Diagenode, Liège, Belgium) with 6 minutes total time
(15 s on, 30 s off). DNA was phenol/chloroform extracted
twice, and the resulting material was RNAse treated for
20 minutes before re-precipitating. The resulting DNA
was then labeled according to standard Affymetrix proto-
cols. The log
2
FAIRE signals were normalized by sub-
tracting the average signal of three genomic DNA
hybridizations to correct for GC bias.
Probe mapping for bulk signal differences
For analyzing differences in Pol II, histone H3 and
H3K36me3 ChIP or FAIRE sig nals in introns and exons,
25-bp Affymetrix probes were mapped back to the S.
pombe genome (GeneDB). Probes where the entire 25
bp length fell within an intron or exon were classed as
‘intron probes’ or ‘exon probes’, res pect ively. All probes
that fell entirely within the ORF of unspliced genes were
used for calculating the signal of unspliced genes.
Average gene calculations
Every annotated S. pombe gene (downloaded from Gen-
eDB) was divided into three parts, the promoter, c oding,
and terminator regions; in the case of spliced genes, the
ORF was further divided into exons and introns. For
both unspliced and spliced genes, 400-bp regions
upstream of the start of the ORF and downstream of the
end of the ORF were taken as the promoter and termina-
tor, respectively. These 400-bp windows were divided
into ten bins of 40 bp each, and Affymetrix probes were
assigned to bins depending on where their midpoint fell
(13th base pair). For the ORFs of unspliced genes, the
lengths of ORFs were divided into 20 bins of equal size,
with Affymetrix probes being as signed to bins based on
their midpoint position. For spliced genes, each intron
and exon was first divided into 10 or 20 bins of equal
size, respectively, with probes assigned to bins based on
their midpoint. In order to calculate an average of every
exon-intron-exon junction without counting probes
multiple times, the last t en bins of every upstream exon,
the ten bins of every intron, and the first ten bins of
every downstream e xon were used to average probe sig-
nals from the various experiments. Probes falling in the
first ten bins of every first exon and the last ten bins of
every last exon were averaged to create the first and last
ten bins for upstream and downstream exons,
respectively.
Average gene calculations by expression group
Replicate gene expression data colle cted previously [7]
from Affymetrix Yeast 2 .0 Genechip
®
arrays were first
filtered for undetectable signal (< 1; 480 of 5,296 genes
excluded) and then sorted in to spliced and u nspliced
genes (2,218 and 2,598 genes, respectively). Lists of
spliced/un spliced genes were then ranked in descending
order and split into 10 equal groups (approximately 220
and 260 genes per group for spliced and unspliced
genes, respective ly). Average gene profile calcula tions
were then performed as described above for genes
within each expression bin.
Accession numbers
All micro array data u sed have been submitted to
ArrayExpress under the accession number E-TABM-946.
Additional material
Additional file 1: Single-gene examples of Pol II occupancy. (a-f)
Affymetrix tiling array data for RNA Pol II is shown for three genes
(SPAC13G7.11 (a), SPBC1773.01 (b), SPCC126.05c (c)) with low expression
(ranked 2,447,1,666, and 2,310 out of 4,816, respectively, according to
Affymetrix expression data) and three genes (SPBC4F6.18c (d),
SPAC17G6.06 (e), SPCC24B10.09 (f)) with high expression (ranked 216, 90,
and 56 out of 4,816, respectively, from data as above). Additional
annotated features are shown (expression rankings are SPAC13G7.12c
(3,307), SPBC1773.02c (2,764), SPCC126.04c (2,123), SPCC126.06 (2,591),
SPBC4F6.17c (1,944), SPAC17G6.05c (4,227), SPAC17G6.07c (811),
SPCC24B10.08c (3,300), SPCC24B10.10c (3,376)) and the range of absolute
values of RNA Pol II signals (as previously calculated [7]) are shown on
the left side of each panel. Introns within genes shown are indicated by
red lines.
Additional file 2: Expression level of spliced genes is not biased by
intron size. A scatterplot showing the size of each intron in the
annotated S. pombe genome and the corresponding gene expression
level (according to previously published Affymetrix microa rray data [7]).
Additional file 3: Validation of Pol II occupancy in single genes by
quantitative PCR.
Abbreviations
bp: base pair; ChIP-chip: chromatin immunoprecipitation on microarray;
FAIRE: formaldehyde-assisted isolation of regulatory elements; H3K36Me3:
lysine 36 trimethylation of histone H3; ORF: open reading frame; PCR:
polymerase chain reaction; Pol II: RNA polymerase II.
Acknowledgements
We thank Charalampos (Babis) Rallis for helpful discussions, Josette-Renée
Landry for comments on the manuscript and Raphaëlle Lambert for
technical assistance. BTW was supported by Sanger Postdoctoral and
Wilhelm et al. Genome Biology 2011, 12:R82
/>Page 10 of 12
Canadian NSERC Fellowships, and SM was supported by a Fellowship for
Advanced Researchers from the Swiss National Science Foundation. This
research was funded by Cancer Research UK and by PhenOxiGEn, an EU FP7
research project.
Author details
1
Department of Genetics, Evolution and Environment and UCL Cancer
Institute, University College London, Darwin Building, Gower Street, London
WC1E 6BT, UK.
2
Institut de Recherche en Immunologie et en Cancérologie
(IRIC), 2900 boulevard Édouard-Montpetit, Montréal, H3C 3J7, Canada.
3
Salk
Institute for Biological Studies, San Diego, CA 92186-5800, USA.
4
Cancer
Research UK Cambridge Research Institute, Li Ka Shing Centre, Cambridge,
CB2 0RE, UK.
Authors’ contributions
BTW, SM and JB designed and supervised the research and discussed the
results; BTW, SM, and SC all performed experiments with help from SW and
SA. BTW analyzed the data with the help of JB and SM and drafted the
manuscript with revisions by SM and JB. All authors have read and approved
the final manuscript.
Received: 10 March 2011 Revised: 7 July 2011
Accepted: 22 August 2011 Published: 22 August 2011
References
1. Moore MJ, Proudfoot NJ: Pre-mRNA processing reaches back to
transcription and ahead to translation. Cell 2009, 136:688-700.
2. Perales R, Bentley D: “Cotranscriptionality": the transcription elongation
complex as a nexus for nuclear transactions. Mol Cell 2009, 36:178-191.
3. Lackner DH, Beilharz TH, Marguerat S, Mata J, Watt S, Schubert F, Preiss T,
Bahler J: A network of multiple regulatory layers shapes gene expression
in fission yeast. Mol Cell 2007, 26:145-155.
4. Kornblihtt AR, de la Mata M, Fededa JP, Munoz MJ, Nogues G: Multiple
links between transcription and splicing. RNA 2004, 10:1489-1498.
5. Pandit S, Wang D, Fu XD: Functional integration of transcriptional and
RNA processing machineries. Curr Opin Cell Biol 2008, 20:260-265.
6. Hicks MJ, Yang CR, Kotlajich MV, Hertel KJ: Linking splicing to Pol II
transcription stabilizes pre-mRNAs and influences splicing patterns. PLoS
Biol 2006, 4:e147.
7. Wilhelm BT, Marguerat S, Watt S, Schubert F, Wood V, Goodhead I,
Penkett CJ, Rogers J, Bahler J: Dynamic repertoire of a eukaryotic
transcriptome surveyed at single-nucleotide resolution. Nature 2008,
453:1239-1243.
8. Berger SL: The complex language of chromatin regulation during
transcription. Nature 2007, 447:407-412.
9. Sims RJ, Millhouse S, Chen CF, Lewis BA, Erdjument-Bromage H, Tempst P,
Manley JL, Reinberg D: Recognition of trimethylated histone H3 lysine 4
facilitates the recruitment of transcription postinitiation factors and pre-
mRNA splicing. Mol Cell 2007, 28:665-676.
10. Allemand E, Batsche E, Muchardt C: Splicing, transcription, and chromatin:
a menage a trois. Curr Opin Genet Dev 2008, 18:145-151.
11. Luco RF, Allo M, Schor IE, Kornblihtt AR, Misteli T: Epigenetics in alternative
pre-mRNA splicing. Cell 2011, 144:16-26.
12. Kolasinska-Zwierz P, Down T, Latorre I, Liu T, Liu XS, Ahringer J: Differential
chromatin marking of introns and expressed exons by H3K36me3. Nat
Genet 2009, 41:376-381.
13. Spies N, Nielsen CB, Padgett RA, Burge CB: Biased chromatin signatures
around polyadenylation sites and exons. Mol Cell 2009, 36:245-254.
14. Morris SA, Shibata Y, Noma K, Tsukamoto Y, Warren E, Temple B, Grewal SI,
Strahl BD: Histone H3 K36 methylation is associated with transcription
elongation in Schizosaccharomyces
pombe. Eukaryot Cell 2005,
4:1446-1454.
15. Giresi PG, Kim J, McDaniell RM, Iyer VR, Lieb JD: FAIRE (formaldehyde-
assisted isolation of regulatory elements) isolates active regulatory
elements from human chromatin. Genome Res 2007, 17:877-885.
16. Giresi PG, Lieb JD: Isolation of active regulatory elements from eukaryotic
chromatin using FAIRE (formaldehyde assisted isolation of regulatory
elements). Methods 2009, 48:233-239.
17. Guenther MG, Levine SS, Boyer LA, Jaenisch R, Young RA: A chromatin
landmark and transcription initiation at most promoters in human cells.
Cell 2007, 130:77-88.
18. Krumm A, Hickey LB, Groudine M: Promoter-proximal pausing of RNA
polymerase II defines a general rate-limiting step after transcription
initiation. Genes Dev 1995, 9:559-572.
19. Lee CK, Shibata Y, Rao B, Strahl BD, Lieb JD: Evidence for nucleosome
depletion at active regulatory regions genome-wide. Nat Genet 2004,
36:900-905.
20. Yuan GC, Liu YJ, Dion MF, Slack MD, Wu LF, Altschuler SJ, Rando OJ:
Genome-scale identification of nucleosome positions in S. cerevisiae.
Science 2005, 309:626-630.
21. Lantermann AB, Straub T, Stralfors A, Yuan GC, Ekwall K, Korber P:
Schizosaccharomyces pombe genome-wide nucleosome mapping reveals
positioning mechanisms distinct from those of Saccharomyces cerevisiae.
Nat Struct Mol Biol 2010, 17:251-257.
22. Fan X, Moqtaderi Z, Jin Y, Zhang Y, Liu XS, Struhl K: Nucleosome depletion
at yeast terminators is not intrinsic and can occur by a transcriptional
mechanism linked to 3’-end formation. Proc Natl Acad Sci USA 2010,
107:17945-17950.
23. Enriquez-Harris P, Levitt N, Briggs D, Proudfoot NJ: A pause site for RNA
polymerase II is associated with termination of transcription. EMBO J
1991, 10:1833-1842.
24. Gromak N, West S, Proudfoot NJ: Pause sites promote transcriptional
termination of mammalian RNA polymerase II. Mol Cell Biol 2006,
26:3986-3996.
25. Tan-Wong SM, French JD, Proudfoot NJ, Brown MA: Dynamic interactions
between the promoter and terminator regions of the mammalian
BRCA1 gene. Proc Natl Acad Sci USA 2008, 105:5160-5165.
26. Glover-Cutter K, Kim S, Espinosa J, Bentley DL: RNA polymerase II pauses
and associates with pre-mRNA processing factors at both ends of genes.
Nat Struct Mol Biol 2008, 15:71-78.
27. Dye MJ, Gromak N, Proudfoot NJ: Exon tethering in transcription by RNA
polymerase II. Mol Cell
2006, 21:849-859.
28.
O’Sullivan JM, Tan-Wong SM, Morillon A, Lee B, Coles J, Mellor J,
Proudfoot NJ: Gene loops juxtapose promoters and terminators in yeast.
Nat Genet 2004, 36:1014-1018.
29. Schwartz S, Meshorer E, Ast G: Chromatin organization marks exon-intron
structure. Nat Struct Mol Biol 2009, 16:990-995.
30. Tilgner H, Nikolaou C, Althammer S, Sammeth M, Beato M, Valcarcel J,
Guigo R: Nucleosome positioning as a determinant of exon recognition.
Nat Struct Mol Biol 2009, 16:996-1001.
31. David L, Huber W, Granovskaia M, Toedling J, Palm CJ, Bofkin L, Jones T,
Davis RW, Steinmetz LM: A high-resolution map of transcription in the
yeast genome. Proc Natl Acad Sci USA 2006, 103:5320-5325.
32. Strahl BD, Grant PA, Briggs SD, Sun ZW, Bone JR, Caldwell JA, Mollah S,
Cook RG, Shabanowitz J, Hunt DF, Allis CD: Set2 is a nucleosomal histone
H3-selective methyltransferase that mediates transcriptional repression.
Mol Cell Biol 2002, 22:1298-1306.
33. Krogan NJ, Kim M, Tong A, Golshani A, Cagney G, Canadien V, Richards DP,
Beattie BK, Emili A, Boone C, Shilatifard A, Buratowski S, Greenblatt J:
Methylation of histone H3 by Set2 in Saccharomyces cerevisiae is linked
to transcriptional elongation by RNA polymerase II. Mol Cell Biol 2003,
23:4207-4218.
34. Li B, Howe L, Anderson S, Yates JR, Workman JL: The Set2 histone
methyltransferase functi ons through the phosphorylated carboxyl-
terminal domain of RNA polymerase II . JBiolChem2003,
278:8897-8903.
35. Darzacq X, Shav-Tal Y, de Turris V, Brody Y, Shenoy SM, Phair RD, Singer RH:
In vivo dynamics of RNA polymerase II transcription. Nat Struct Mol Biol
2007, 14:796-806.
36. de la Mata M, Alonso CR, Kadener S, Fededa JP, Blaustein M, Pelisch F,
Cramer P, Bentley D, Kornblihtt AR: A slow RNA polymerase II affects
alternative splicing in vivo. Mol Cell 2003, 12:525-532.
37. Andersson R, Enroth S, Rada-Iglesias A, Wadelius C, Komorowski J:
Nucleosomes are well positioned in exons and carry characteristic
histone modifications. Genome Res 2009, 19:1732-1741.
38. Listerman I, Sapra AK, Neugebauer KM: Cotranscriptional coupling of
splicing factor recruitment and precursor messenger RNA splicing in
mammalian cells. Nat Struct Mol Biol 2006, 13:815-822.
39. Swinburne IA, Meyer CA, Liu XS, Silver PA, Brodsky AS: Genomic
localization of RNA binding proteins reveals links between pre-mRNA
processing and transcription. Genome Res 2006, 16:912-921.
40. Andersen PK, Jensen TH: A pause to splice. Mol Cell
2010, 40:503-505.
Wilhelm et al. Genome Biology 2011, 12:R82
/>Page 11 of 12
41. Alexander RD, Innocente SA, Barrass JD, Beggs JD: Splicing-dependent
RNA polymerase pausing in yeast. Mol Cell 2010, 40:582-593.
42. Carrillo Oesterreich F, Preibisch S, Neugebauer KM: Global analysis of
nascent RNA reveals transcriptional pausing in terminal exons. Mol Cell
2010, 40:571-581.
43. Mitchell JA, Fraser P: Transcription factories are nuclear subcompartments
that remain in the absence of transcription. Genes Dev 2008, 22:20-25.
44. Osborne CS, Chakalova L, Brown KE, Carter D, Horton A, Debrand E,
Goyenechea B, Mitchell JA, Lopes S, Reik W, Fraser P: Active genes
dynamically colocalize to shared sites of ongoing transcription. Nat
Genet 2004, 36:1065-1071.
45. Osborne CS, Chakalova L, Mitchell JA, Horton A, Wood AL, Bolland DJ,
Corcoran AE, Fraser P: Myc dynamically and preferentially relocates to a
transcription factory occupied by Igh. PLoS Biol 2007, 5:e192.
46. Cook PR: A model for all genomes: the role of transcription factories. J
Mol Biol 2010, 395:1-10.
47. Tanizawa H, Iwasaki O, Tanaka A, Capizzi JR, Wickramasinghe P, Lee M, Fu Z,
Noma K: Mapping of long-range associations throughout the fission
yeast genome reveals global genome organization linked to
transcriptional regulation. Nucleic Acids Res 2010, 38:8164-8177.
48. Bernstein BE, Humphrey EL, Liu CL, Schreiber SL: The use of chromatin
immunoprecipitation assays in genome-wide analyses of histone
modifications. Methods Enzymol 2004, 376:349-360.
doi:10.1186/gb-2011-12-8-r82
Cite this article as: Wilhelm et al.: Differential patterns of intronic and
exonic DNA regions with respect to RNA polymerase II occupancy,
nucleosome density and H3K36me3 marking in fission yeast. Genome
Biology 2011 12:R82.
Submit your next manuscript to BioMed Central
and take full advantage of:
• Convenient online submission
• Thorough peer review
• No space constraints or color figure charges
• Immediate publication on acceptance
• Inclusion in PubMed, CAS, Scopus and Google Scholar
• Research which is freely available for redistribution
Submit your manuscript at
www.biomedcentral.com/submit
Wilhelm et al. Genome Biology 2011, 12:R82
/>Page 12 of 12