Rising Above the Gathering Storm Energizing and Employing America for a Brighter Economic Future phần 8 potx
Bạn đang xem bản rút gọn của tài liệu. Xem và tải ngay bản đầy đủ của tài liệu tại đây (888.75 KB, 58 trang )
Copyright © National Academy of Sciences. All rights reserved.
Rising Above the Gathering Storm: Energizing and Employing America for a Brighter Economic Future
/>382 RISING ABOVE THE GATHERING STORM
and engineers has increased steadily and substantially in the last decade.
9
The proportion of foreign-born doctorates remaining in the United States
for at least 2 years after receiving their degrees increased from 49% for the
1989 cohort to 71% for the larger 2001 cohort.
10
Stay rates were highest among engineering, computer-science, and
physical-science graduates. Stay rates also varied dramatically among gradu-
ate students from the top source countries—China (96%), India (86%),
Taiwan (40%), and Korea (21%). Decisions to stay in the United States
appear to be strongly affected by conditions in the students’ home coun-
tries, primarily the unemployment rate, the percentage of the labor force
that works in agriculture, and per capita GDP.
11
COSTS AND BENEFITS OF INTERNATIONAL MOBILITY
Skilled migrants contribute to the US economy as technicians, teachers,
and researchers and in other occupations in which technical training is de-
sirable (see Table IS-1). Some research suggests that they generate economic
gains by contributing to industrial and business innovation, resulting in a
net increase in real wages for both citizen and immigrant workers. One
study, for example, found that the immigration of skilled workers added to
local skills rather than substituting for them.
12
The authors’ econometric
analyses suggest that a 10% increase in the number of international gradu-
ate students would raise university patent grants by 6% and nonuniversity
patent grants by 4%. The authors concluded that bureaucratic hurdles in
obtaining student visas may impede innovation if they decrease the inflow
of international graduate students.
Foreign-born and foreign-educated scientists and engineers have made
a disproportionate number of “exceptional” contributions to the S&E en-
9
Although international student is usually taken to mean a student on a temporary visa, the
figures sometimes include students on both temporary and permanent visas to compensate for
the large number of Chinese students in the 1990s who became permanent residents by special
legal provisions. This issue is discussed in greater detail by Finn (see next footnote), who finds
the stay rate for those on temporary and permanent visas almost the same.
10
M. G. Finn. Stay Rates of Foreign Doctorate Recipients from US Universities, 2001. Oak
Ridge, TN: Oak Ridge Institute for Science and Education, 2003. The stay rate was defined as
remaining in the United States for at least 2 years after receipt of the doctorate, but Finn
estimates that these rates do not fall appreciably during the first 5 years after graduation.
11
D. L. Johnson. Relationship Between Stay Rates of PhD Recipients on Temporary Visas
and Relative Economic Conditions in Country of Origin. Working Paper. Oak Ridge, TN:
Oak Ridge Institute for Science and Education, 2001.
12
G. Chelleraj, K. E. Maskus, and A. Mattoo. The Contribution of Skilled Immigration and
International Graduate Students to US Innovation. Working Paper 04-10. Boulder, CO: Uni-
versity of Colorado, 2004.
Copyright © National Academy of Sciences. All rights reserved.
Rising Above the Gathering Storm: Energizing and Employing America for a Brighter Economic Future
/>APPENDIX D 383
terprise of the United States.
13
Since 1990, almost half the US Nobel laure-
ates in science fields were foreign-born; 37% received their graduate educa-
tion abroad. The large number of foreign-born scientists and engineers
working in the United States who were educated abroad suggests that the
United States has benefited from investments in education made by other
countries.
Many people believe that emigration of technically skilled individuals—
often called a “brain drain”—is detrimental to the country of origin. How-
ever, the concept of brain drain may be too simplistic inasmuch as it ignores
the many benefits of emigration, including remittances, international collabo-
rations, the return of skilled scientists and engineers, diaspora-facilitated in-
ternational business, and a general investment in skills caused by the prospect
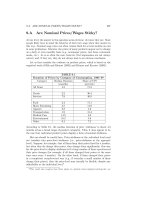
TABLE IS-1 Number of Foreign Born in US S&E Occupations, by
Degree and Field, 2000
Number of Foreign-Born in US S&E Occupations, 2000
Mathematics
and
All Life Computer Physical Social
S&E Engineering Sciences Sciences Sciences Sciences
All college-educated 816,000 265,000 52,000 370,000 92,000 37,000
Bachelor’s degree 365,000 132,000 6,000 197,000 21,000 9,000
Master’s degree 291,000 100,000 10,000 146,000 21,000 14,000
Professional degree 25,000 5,000 8,000 6,000 4,000 2,000
Doctoral degree
a
135,000 28,000 28,000 21,000 46,000 12,000
a
In 2001, 57% of those who were foreign-born S&E doctorate holders were US citizens.
NOTE: Data are from US Census 2000 5% Public Use Microdata Samples (PUMS) and in-
clude all S&E occupations other than postsecondary teachers, because field of instruction was
not included in occupation coding for the 2000 census.
SOURCE: The National Academies. Policy Implications of International Graduate Students
and Postdoctoral Scholars in the United States. Washington, DC: The National Academies
Press, 2005. Table 1-5.
13
P. E. Stephan and S. G. Levin. Foreign Scholars in US Science: Contributions and Costs. In
R. Ehrenberg and P. Stephan, eds. Science and the University. Madison, WI: University of
Wisconsin Press, 2005. The authors use six criteria to indicate “exceptional” contributions
(not all contributions) in S&E: individuals elected to the National Academy of Sciences (NAS)
and/or National Academy of Engineering (NAE), authors of citation classics, authors of hot
papers, the 250 most cited authors, authors of highly cited patents, and scientists who have
played a key role in launching biotechnology firms.
Copyright © National Academy of Sciences. All rights reserved.
Rising Above the Gathering Storm: Energizing and Employing America for a Brighter Economic Future
/>384 RISING ABOVE THE GATHERING STORM
of emigration.
14
As the R&D enterprise becomes more global, some observ-
ers propose that “brain drain” be recast as “brain circulation”
15
and include
the broader topics of the international circulation of thinkers, knowledge
workers, and rights to knowledge.
16
Such a discussion would include issues
of local resources; many countries lack the educational and technical infra-
structure to support advanced education, so aspiring scientists and engineers
have little choice but to seek at least part of their training abroad, and in
many instances such travel is encouraged by governments. Supporting the
concept of brain circulation is the finding that ethnic networks developed in
the United States by international students and scholars help to support
knowledge transfer and economic development in both the United States and
the sending country.
17
In other countries, migration for employment, particularly for highly
skilled workers, remains a core concern.
18
European Union (EU) countries,
especially those with developed S&E capacity, have implemented strategies
to facilitate retention and immigration of the technically skilled. Several
Organisation for Economic Co-operation and Development (OECD) coun-
tries have relaxed their immigration laws to attract high-skilled students
and workers.
19
Some are increasing growth in their international student
populations and are encouraging these students to apply for resident status.
Point-based immigration systems for high-skilled workers, while not wide-
spread, are starting to develop.
20
Canada, Australia, and New Zealand use
14
D. Kapur and J. McHale. Sojourns and Software: Internationally Mobile Human Capital
and High-Tech Industry Development in India, Ireland, and Israel. In A. Arora and A.
Gambardella, eds. From Underdogs to Tigers: The Rise and Growth of the Software Industry
in Israel, Ireland and India. Oxford, UK: Oxford University Press, 2005.
15
Organisation for Economic Co-operation Development. International Mobility of the
Highly Skilled. Policy Brief 92 2002 01 1P4. Washington, DC: OECD, 2002. Available at:
/>16
B. Jewsiewicki. The Brain Drain in an Era of Liberalism. Ottawa, ON: Canadian Bureau
for International Education, 2003.
17
W. Kerr. “Ethnic Scientific Communities and International Technology Diffusion.” Work-
ing Paper. 2004. Available at: />18
OECD members countries include Australia, Austria, Belgium, Canada, the Czech Repub-
lic, Denmark, Finland, France, Germany, Greece, Hungary, Iceland, Ireland, Italy, Japan, Ko-
rea, Luxembourg, Mexico, The Netherlands, New Zealand, Norway, Poland, Portugal, the
Slovak Republic, Spain, Sweden, Switzerland, Turkey, the United Kingdom, and the United
States.
19
K. Tremblay. “Links Between Academic Mobility and Immigration.” Symposium on In-
ternational Labour and Academic Mobility: Emerging Trends and Implications for Public
Policy, Toronto, October 22, 2004.
20
Organisation for Economic Co-operation Development. Trends in International Migra-
tion: 2004 Annual Report. Paris: OECD, 2005. See for more
information on immigration policies in English-speaking countries and the European Union.
Copyright © National Academy of Sciences. All rights reserved.
Rising Above the Gathering Storm: Energizing and Employing America for a Brighter Economic Future
/>APPENDIX D 385
such systems to recruit highly skilled workers. The United Kingdom has been
doing so since 2001, and the Czech Republic set up a pilot project that started
in 2004. In 2004, the European Union Justice and International Affairs council
adopted a recommendation to facilitate the immigration of researchers from
non-EU countries, asking member states to waive requirements for residence
permits or to issue them automatically or through a fast-track procedure and to
set no quotas that would restrict their admission. Also, the European Commis-
sion has adopted a directive for a special admissions procedure for third-world
nationals coming to the EU to perform research.
RECENT TRENDS IN GRADUATE SCHOOL ENROLLMENT
Declines in international student applications for entry to US graduate
schools have stimulated considerable discussion and more than a few warn-
ings that our national S&E capacity may have begun to weaken. In 2002,
the National Science Foundation noted a decrease in first-time full-time
S&E graduate enrollments among temporary residents, by about 8% for
men and 1% for women.
21
At the same time, first-time full-time S&E
graduate-student enrollment increased by almost 14% for US citizens and
permanent residents—15% for men and more than 12% for women (see
Figure IS-1).
More recent surveys by the Council on Graduate Schools showed dra-
matic decreases in applications among international students for the 2003
academic year but much smaller decreases in admissions. Applications and
admissions for domestic students did not change appreciably during this
period, whereas enrollments decreased by 5%. There appear to be much
smaller effects on applications for the 2004 academic year (see Table IS-2).
These declines were partly in response to the terrorist attacks of Sep-
tember 11, 2001, after which it became clear to everyone that the issuance
and monitoring of visas are as important to graduate education as the train-
ing experience. Even more so, however, the declines reflect increasing glo-
bal competition for graduate students amid the globalization of S&E edu-
cation and research.
RISING GLOBAL CAPACITY FOR HIGHER EDUCATION
Given the fast-rising global tide of S&E infrastructure and training, it
would be surprising if the S&E education and research enterprise currently
dominated by the United States did not begin to change into a more global
21
National Science Foundation. Graduate Enrollment in Science and Engineering Fields
Reaches New Peak; First-Time Enrollment of Foreign Students Declines. NSF 04-326. Arling-
ton, VA: National Science Foundation, 2004.
Copyright © National Academy of Sciences. All rights reserved.
Rising Above the Gathering Storm: Energizing and Employing America for a Brighter Economic Future
/>386 RISING ABOVE THE GATHERING STORM
network of scientific and economic strength. Indeed, there is considerable
evidence that that process has begun. Students have been leaving their home
countries in search of academic opportunities abroad for thousands of
years.
22
For scientists and engineers, the trend gained importance with the
rise of universities and the need for formal training unavailable at home. As
early as the late 19th century, many Americans were drawn abroad to Ger-
man universities to gain expertise in fast-growing new technical fields.
23
In
the following decades, that trend gradually reversed as US universities
gained technical strength and attracted both faculty and students. US uni-
versities also benefited from an influx of educated refugees fleeing war-torn
Europe during and after World War II.
Now, even while the United States can boast of 17 of the world’s top 20
universities,
24
the US share of the world’s S&E graduates is declining rap-
TABLE IS-2 Applications, Admissions, and Enrollments of International
Graduate Students, by Field, 2002-2003
Physical
Total Engineering Life Sciences Sciences
Applications –28% (–5%)
a
–36% (–7%) –24% (–1%) –26% (–3%)
Admissions –18% –24% –19% –17%
Enrollments –6% –8% –10% +6%
a
Available data for the 2005 academic year are shown in parentheses.
SOURCE: H. Brown. Council of Graduate Schools Finds Decline in New International Gradu-
ate Student Enrollment for the Third Consecutive Year. Washington, DC: Council of Gradu-
ate Schools, November 4, 2004.
22
W. I. Cohen. East Asia at the Center: Four Thousand Years of Engagement with the
World. New York: Columbia University Press, 2001.
23
D. E. Stokes. Pasteur’s Quadrant: Basic Science and Technological Innovation. Washing-
ton, DC: Brookings Institution, 1997. Pp. 38-41. Stokes explains the effect of this export and
re-importation of S&E talent on US universities: “This tide, which was at a flood in the 1880’s,
reflected the lack of an American system of advanced studies adequate to the needs of a rising
industrial nation, and was a standing challenge to create one. The efforts to fill this gap in
American higher education were generously supported by America’s economic expansion, par-
ticularly by the private individuals who had acquired great wealth in the decades after the Civil
War, many of whom had gained a vision of what might be done from their studies in the
German universities.”
24
Shanghai’s Jiao Tong University Institute of Higher Education. “Academic Ranking of
World Universities.” 2004. Available at: The
ranking emphasizes prizes, publications, and citations attributed to faculty and staff, as well as
the size of institutions. The Times Higher Education supplement also provides international
comparisons of universities.
Copyright © National Academy of Sciences. All rights reserved.
Rising Above the Gathering Storm: Energizing and Employing America for a Brighter Economic Future
/>APPENDIX D 387
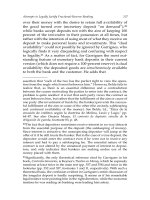
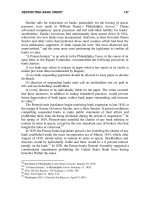
idly. European and Asian universities have increased degree production
while the number of students obtaining US graduate degrees has stagnated
(see Figure IS-4). Other interesting notes:
• The percentage of foreign students on OECD campuses rose by
34.9% on average between 1998 and 2002 and by 50% or more in the
Czech Republic, Iceland, Korea, New Zealand, Norway, Spain, and Swe-
den. In absolute terms, more than 450,000 new individuals crossed borders
to study in an OECD country during this short period, raising the number
of foreign students enrolled on OECD campuses to 1,781,000. K. Tremblay.
“Links Between Academic Mobility and Immigration.” Symposium on In-
ternational Labour and Academic Mobility: Emerging Trends and Implica-
tions for Public Policy, Toronto, October 22, 2004.
• In 2000, the EU was ahead of the United States and Japan in the
production of S&E graduates. As a proportion of PhDs per 1,000 popula-
tion aged 25-34 years, the EU-15 had an average of 0.56, the United States
had 0.48 and Japan had 0.24. However, the emigration of EU-15 S&E
graduates is creating a restriction for European R&D. In the late 1990s, the
European S&E workforce accounted for 5.4 per thousand workers vs 8.1
per thousand in the United States and 9.3 in Japan. European Commission.
Towards a European Research Area. Science, Technology, and Innovation,
Key Figures 2002. Brussels: European Commission, 2002. Pp. 36-38. Avail-
able at: />• Two independent estimates indicate that of the 60% of academic
postdoctoral scholars who hold temporary visas, about four-fifths have non-
US doctorates, which means that half of all US academic postdoctoral schol-
ars have non-US doctorates.
25
Of postdoctoral scholars on temporary visas,
almost 80% had earned their PhDs outside the United States. Of those with
non-US PhDs, the highest number came from China (25%), followed by
India (11%), Germany (7%), South Korea (5%), Canada (5%), Japan (5%),
the UK (4%), France (4%), Spain (2%), and Italy (2%). The United States
is benefiting from an inflow of postdoctoral scholars who have received
graduate support and training elsewhere.
As countries develop knowledge-based economies, they seek to reap
more of the benefits of international educational activities, including strong
positive effects on gross domestic product (GDP) growth.
26
Emerging econo-
25
Estimates based on the NSF Survey of Doctorate Recipients 2001, the NSF Survey of
Graduate Students and Postdocs 2001, and the 2004 Sigma Xi National Postdoctoral Survey.
Available at: .
26
The Conference Board of Canada. The Economic Implications of International Educa-
tion for Canada and Nine Comparator Countries: A Comparison of International Education
Copyright © National Academy of Sciences. All rights reserved.
Rising Above the Gathering Storm: Energizing and Employing America for a Brighter Economic Future
/>388 RISING ABOVE THE GATHERING STORM
0
5,000
10,000
15,000
20,000
25,000
30,000
1975
1978
1981
1984
1987
1990
1993
1996
1999
Number of Doctorates
United States
Germany
United Kingdom
Japan
China
India
South Korea
Taiwan
FIGURE IS-4 S&E doctorate production, by selected country, 1975-1999.
SOURCE: Based on National Science Board. Science and Engineering Indicators
2004. NSB 04-01. Arlington, VA: National Science Foundation, 2004. Appendix
Tables 2-38 and 2-39.
mies have coupled education-abroad programs with strategic investments
in S&E infrastructure—in essence pushing students away to gain skills and
creating jobs to draw them back. Other countries, particularly in Europe,
are trying to retain their best students and also to increase quality and open
international access to their own higher educational institutions.
VISA AND IMMIGRATION POLICY
A growing challenge for policy-makers is to reconcile the flow of people
and information with security needs. Policies and regulations, particularly
those governing visas and immigration, can disrupt the global movement of
individuals and therefore the productivity of scientists and engineers. In
turn, this can affect a nation’s economic capabilities.
The repercussions of the terror attacks of September 11, 2001, have
included security-related changes in federal visa and immigration policy.
Other immigration-related policies relevant to international student flows
are international reciprocity agreements and deemed-export policies. Policy
changes intended to restrict the illegal movements of an extremely small
Activities and Economic Performance. Ottawa, ON: Department of Foreign Affairs and
International Trade, 1999. Also see A. Saxenian. Silicon Valley’s New Immigrant Entrepre-
neurs. San Francisco: Public Policy Institute, 1999. Available at: />PUBLICATIONS/wrkg15.PDF.
Copyright © National Academy of Sciences. All rights reserved.
Rising Above the Gathering Storm: Energizing and Employing America for a Brighter Economic Future
/>APPENDIX D 389
population have had a substantial effect on international graduate students
and postdoctoral scholars already in the United States or contemplating a
period of study here.
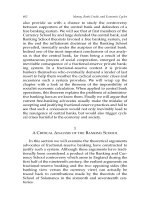
Changes in visa and immigration policies and structures had a rapid
and adverse effect on student mobility. Nonimmigrant-visa issuance rates
decreased, particularly for students (see Figure IS-5). Implementation of the
student-tracking system, the Student and Exchange Visitor Information Sys-
tem (SEVIS), and enhanced Visas Mantis security screening led to closer
scrutiny and longer times for visa processing, in some cases causing stu-
dents to miss classes or to turn to other countries for their graduate train-
ing.
27
After intense discussions between the university community and
government agencies,
28
some of these policies have been adjusted to reduce
effects on student mobility (see Figure IS-6 and Box IS-1). However, unfa-
vorable perceptions remain, and international sentiment regarding the
United States and its visa and immigration processes is a lingering problem
for the recruitment of international students and scholars.
RECOMMENDATIONS
To maintain its leadership in S&E research, the United States must be
able to recruit the most talented people worldwide for positions in academe,
industry, and government.
29
The United States therefore must work to attract
the best international talent while seeking to improve the mentoring, educa-
tion, and training of its own S&E students, including women and members of
underrepresented minority groups. This dual goal is especially important in
light of increasing global competition for the best S&E students and scholars.
Federal actions that have been recommended include the following:
• Create new nonimmigrant-visa categories for doctoral-level graduate
students and postdoctoral scholars, whether they are coming to the United
States for formal educational or training programs or for short-term research
collaborations or scientific meetings.
30
The categories should be exempted
27
See, among many examples: “A Visa System Tangled in Red Tape and Misconceived Secu-
rity Rules Is Hurting America.” The Economist, May 6, 2004; C. Alphonso. “Facing Security
Hurdles, Top Students Flock to Canada.” The Globe and Mail, February 22, 2005.
28
“Statement and Recommendations on Visa Problems Harming America’s Scientific, Eco-
nomic, and Security Interests,” February 11, 2004, signed by 22 scientific, engineering, and
academic leaders.
29
The National Academies. Policy Implications of International Graduate Students and
Postdoctoral Scholars in the United States. Washington, DC: The National Academies Press,
2005.
30
Ibid.
Copyright © National Academy of Sciences. All rights reserved.
Rising Above the Gathering Storm: Energizing and Employing America for a Brighter Economic Future
/>390 RISING ABOVE THE GATHERING STORM
F1 Visas
0
50,000
100,000
150,000
200,000
250,000
300,000
350,000
1999
2000
2001
2002
2003
2004
Fiscal Year
0
5
10
15
20
25
30
Adjusted Refusal Rate
Issued
Refusals
Overcome
Total
Refused
Adjusted
Refusal
Rate
J1 Visas
0
50,000
100,000
150,000
200,000
250,000
300,000
350,000
1999
2000
2001
2002
2003
2004
Fiscal Year
0
5
10
15
20
25
30
Adjusted Refusal Rate
Issued
Refusals
Overcome
Total
Refused
Adjusted
Refusal
Rate
Visa Workload Visa Workload
FIGURE IS-5 Visa workload and outcomes, by visa type, 1999-2004.
NOTE: Report of the Visa Office is an annual publication of the US Department
of State, published by the Bureau of Consular Affairs. Recent editions are available
at: The adjusted refusal rate is calculated
with the following formula: (Refusals – Refusals Overcome/Waived)/(Issuances +
Refusals – Refusals Overcome/Waived).
A steep decline in visa issuances began in 2001 and continued through 2003. J-visa
issuances, mostly to Europeans, followed roughly the same pattern, with a larger rise
in the 1990s and a smaller downturn after 2001. To date, the downturn has reflected
an increased denial rate more than a decreased application rate. As seen in the figure,
the refusal rate for J-visa applicants rose steadily from 2000 through 2003. The
adjusted refusal rate for F-visa applicants peaked in 2002. In 2004, denial rates had
decreased considerably and were approaching 1999 levels.
SOURCE: United States Department of State, Bureau of Consular Affairs. Report of
the Visa Office: Multi Year Reports (1992-2004). Washington, DC: US Department
of State, 2004. Available at: />Copyright © National Academy of Sciences. All rights reserved.
Rising Above the Gathering Storm: Energizing and Employing America for a Brighter Economic Future
/>APPENDIX D 391
FIGURE IS-6 Visas Mantis Security Advisory Opinion (SAO) workload, FY 2004.
SOURCE: Data presented to Committee on Science, Engineering, and Public Policy’s
Committeee on Policy Implications of International Graduate Students and
Postdoctoral Scholars in the United States on October 12, 2004, by Janice Jacobs,
deputy assistant secretary of visas affairs, US Department of State.
0%
20%
40%
60%
80%
100%
October
December
February
April
June
August
No decision at 45 days
Decision within 45 days
Decision within 30 days
Fraction of Total Cases
from the 214b provision whereby applicants must show that they have a
residence in a foreign country that they have no intention of abandoning.
• Allow international students, scholars, scientists, and engineers to
renew their visas in the United States.
31
• Negotiate visa reciprocity agreements between the United States and
key sending countries, such as China, to extend visa duration and to permit
multiple entries.
27,28
• In the case of deemed-export controls, clear students and scholars to
conduct research and use equipment required for such research through the
visa process.
32
• Implement a points-based immigration policy, similar to that of
Canada or the United Kingdom, in which US graduate education and S&E
skills count toward obtaining US citizenship.
33
31
“Recommendations for Enhancing the US Visa System to Advance America’s Scientific
and Economic Competitiveness and National Security Interests,” May 18, 2005, signed by the
National Academies presidents and 38 higher education and business organizations.
32
Association of American Universities. “Revision and Clarification of Deemed Export Regu-
latory Requirements,” submitted to the Bureau of Industry and Security, US Department of
Commerce, June 27, 2005.
33
Organisation for Economic Co-operation and Development. Trends in International Mi-
gration: 2004 Annual Report. Paris: OECD, 2005. See appendix for information on existing
immigration policies.
Copyright © National Academy of Sciences. All rights reserved.
Rising Above the Gathering Storm: Energizing and Employing America for a Brighter Economic Future
/>392 RISING ABOVE THE GATHERING STORM
BOX IS-1
VISA UPDATE
In 2002, a new antiterrorist screening process called Visas Condor
was added for nationals of US-designated state sponsors of terrorism
a
that initially overloaded the Security Advisory Opinion (SAO) interagency
process and slowed Mantis clearances.
b
The problem of extended wait-
ing times for clearance of nonimmigrant visas flagged by Mantis has for
the most part been addressed successfully.
c
By August 2004, the pro-
portion of Visas Mantis visitors cleared within 30 days had risen substan-
tially, and fewer than 15% took more than 30 days. The Visas Mantis
process
d
is triggered when a student or exchange-visitor applicant in-
tends to study a subject covered by the Technology Alert List (TAL). The
express purpose of the TAL, originally drawn up as a tool for preventing
proliferation of weapons technology, is to prevent the export of “goods,
technology, or sensitive information” through such activities as “gradu-
ate-level studies, teaching, conducting research, participating in ex-
change programs, receiving training or employment.”
e
Initially, Mantis
procedures were applied on entry and each re-entry to the United States
for persons studying or working in sensitive fields. In 2004, SAO clear-
ance was extended to 1 year for those who were returning to a US gov-
ernment-sponsored program or activity and performing the same duties
or functions at the same facility or organization that was the basis for the
original Mantis authorization.
f
In 2005, the US Department of State ex-
tended the validity of Mantis clearances for F-, J-, H-, L-, and B-visa
categories. Clearances for F-visas are valid for up to 4 years unless the
student changes academic positions. H, J, and L clearances are valid for
up to 2 years unless the visa holder’s activity in the United States
changes.
g
a
Countries designated section 306 in 2005: Iran, Syria, Libya, Cuba, North Korea, and
Sudan. See />b
Government Accountability Office. Border Security: Improvements Needed to Reduce
Time Taken to Adjudicate Visas for Science Students and Scholars. GAO-04-371. Washing-
ton, DC: Government Accountability Office, 2004. In April-June 2003, applicants waited an
average of 67 days for completion of security checks associated with visa applications.
c
Government Accountability Office. Border Security: Streamlined Visas Mantis Program
Has Lowered Burden on Science Students and Scholars, but Further Refinements Needed.
GAO-05-198. Washington, DC: Government Accountability Office, 2005.
d
The Visa Mantis program was established in 1998 and applies to all nonimmigrant
visas, including student (F), exchange-visitor (J), temporary-worker (H), intracompany-trans-
feree (L), business (B-1), and tourist (B-2).
e
See for an overview of the Visas Mantis and
Condor programs.
f
See Department of State cable, 04 State 153587, No. 22: Revision to Visas Mantis
Clearance Procedure. Available at: />g
“Extension of Validity for Science-related Interagency Visa Clearances.” Media Note
2005/182. US Department of State, February 11, 2005. Available at: />pa/prs/ps/2005/42212.htm.
Copyright © National Academy of Sciences. All rights reserved.
Rising Above the Gathering Storm: Energizing and Employing America for a Brighter Economic Future
/>APPENDIX D 393
ANNEX 1
Existing High-Skilled Immigration Policies in OECD Countries
34
Migration for employment, particularly for high-skilled workers, remains
a core concern for OECD member countries.
35
EU countries, especially those
with developed S&E capacity, have implemented strategies to facilitate reten-
tion and immigration of the technically skilled. Several OECD countries have
relaxed their immigration laws to attract high-skilled students and workers.
Some are increasing growth in their international-student populations and
encouraging these students to apply for resident status.
36
(1) Points-Based Immigration for High-Skilled Workers
Points systems, while not widespread, are starting to develop. Canada,
Australia, New Zealand, and the United Kingdom use such systems to
recruit highly skilled workers. The Czech Republic set up a pilot project
that started in 2004. In 2004, the EU Justice and International Affairs
council adopted a recommendation to facilitate researchers from non-EU
countries, which asks member states to waive requirements for residence
permits or to issue them automatically or through a fast-track procedure
and to set no quotas that would restrict their admission. Permits should
be renewable and family reunification facilitated. The European Commis-
sion has adopted a directive for a special admissions procedure for third-
world nationals coming to the EU to perform research. This procedure
will be in force in 2006.
• Canada has put into place a points-based program aimed at fulfill-
ing its policy objectives for migration, particularly in relation to the
labor-market situation. The admission of skilled workers depends
more on human capital (language skills and diplomas, professional
skills, and adaptability) than on specific abilities.
37
Canada has also
34
Unless otherwise noted, policies listed are from an overview presented in: Organisation
for Economic Co-operation and Development. Trends in International Migration: 2004 An-
nual Report. Paris: OECD, 2005.
35
OECD members countries include Australia, Austria, Belgium, Canada, the Czech Repub-
lic, Denmark, Finland, France, Germany, Greece, Hungary, Iceland, Ireland, Italy, Japan, Ko-
rea, Luxembourg, Mexico, The Netherlands, New Zealand, Norway, Poland, Portugal, the
Slovak Republic, Spain, Sweden, Switzerland, Turkey, the United Kingdom, and the United
States.
36
K. Tremblay. “Links Between Academic Mobility and Immigration.” Symposium on In-
ternational Labour and Academic Mobility: Emerging Trends and Implications for Public
Policy, Toronto, October 22, 2004.
37
Applicants can check online their chances to qualify for migration to Canada as skilled
workers. A points score is automatically calculated to determine entry to Canada under the
Skilled Worker category. See Canadian Immigration Points Calculator Web site at http://
www.workpermit.com/canada/points_calculator.htm.
Copyright © National Academy of Sciences. All rights reserved.
Rising Above the Gathering Storm: Energizing and Employing America for a Brighter Economic Future
/>394 RISING ABOVE THE GATHERING STORM
instituted a business-immigrant selection program to attract inves-
tors, entrepreneurs, and self-employed workers.
• Germany instituted a new immigration law on July 9, 2004. Among
its provisions, in the realm of migration for employment, it encour-
ages settlement by high-skilled workers, who are eligible immedi-
ately for permanent residence permits. Family members who accom-
pany them or subsequently join them have access to the labor market.
Like Canada, Germany encourages the immigration of self-employed
persons, who are granted temporary residence permits if they invest
a minimum of 1 million euros and create at least 10 jobs. Issuance of
work permits and residence permits has been consolidated. The Of-
fice for Foreigners will issue both permits concurrently, and the La-
bor Administration subsequently approves the work permit.
• UK
38
The UK Highly Skilled Migrant Programme (HSMP) is an immi-
gration category for entry to the UK for successful people with sought-
after skills. It is in some ways similar to the skilled migration pro-
grams for entry to Australia and Canada. The UK has added an MBA
provision to the HSMP. Eligibility for HSMP visas is assessed on a
points system with more points awarded in the following situations:
– Preference for applicants under 28 years old.
– Skilled migrants with tertiary qualifications.
– High-level work experience.
– Past earnings.
– In a few rare cases, HSMP points are also awarded if one has an
achievement in one’s chosen field.
– One may also score bonus points if one is a skilled migrant seeking to
bring a spouse or partner who also has high-level skills and work
experience.
• Australia encourages immigration of skilled migrants, who are as-
sessed on a points system with points awarded for work experience,
qualifications, and language proficiency.
39
Applicants must demon-
strate skills in specific job categories.
(2) Business Travel
• Asia-Pacific Economic Cooperation (APEC) has instituted the Busi-
ness Travel Card Scheme designed to liberalize trade and stimulate
economic growth. The scheme facilitates travel for business people
38
The UK Highly Skilled Migrant Programme Web page also has a points calculator. See
/>39
See points calculator at: />Copyright © National Academy of Sciences. All rights reserved.
Rising Above the Gathering Storm: Energizing and Employing America for a Brighter Economic Future
/>APPENDIX D 395
traveling for short periods to participating countries (in 2004, APEC
had 16 member countries, including China). Travel is possible be-
tween participating countries after submission of a single application,
which is filtered by the applicant’s home country and forwarded to all
the participating countries for precertification. Cardholders are
checked against police records in their own country as well as against
warning lists in participating countries. Approved travelers get cards
valid for 3 years that provide special access to fast-track lanes at air-
ports. In 2004, there were over 5,000 cards in circulation.
(3) Student Visas Many OECD countries are determined to attract a larger
number of international students. In addition to developing special programs
and streamlining application processes, some countries have signed bilateral
agreements while others have decided to offer job opportunities to graduates.
• Canada Students no longer require study permits for stays of less
than 6 months.
• France Since 1999, it has been possible to obtain a 3- to 6-month
visa for short-term studies without registration.
(4) Work Permits for International Students and Spouses
• Canada
40
A new off-campus work program allows international stu-
dents at public postsecondary institutions to work off campus, ex-
tending the previous policy enacted earlier in 2005 that allowed stu-
dents to work on campus while in Canada on a student visa.
• Germany Since 2003, international students have been allowed to
work 180 half-days per year without a work permit.
• Austria Since 2003, students can work half-time to finance their studies.
(5) Permit to Stay After Graduation to Find a Job
• Canada
41
As of May 16, 2005, a new policy allows certain students
to work in their field of study for up to 2 years after graduation.
Previously, international students were allowed to stay only 1 year
after graduation to work in Canada.
40
Office of Science and Technology. “Canada: Immigration Policy Change Widens Door for
Foreign Students and Scholars.” Bridges 6(July 13, 2005). Available at: http://bridges.
ostina.org.
41
Ibid.
Copyright © National Academy of Sciences. All rights reserved.
Rising Above the Gathering Storm: Energizing and Employing America for a Brighter Economic Future
/>396 RISING ABOVE THE GATHERING STORM
• Germany International students may remain in Germany for 1 year
after the end of their studies to seek employment.
• UK
42
Foreign students at UK universities graduating from specific
engineering, physical-sciences and mathematics courses are now per-
mitted to stay in the UK for 1 year after graduation to take up em-
ployment.
43
The Science and Engineering Graduate Scheme was
launched on October 25, 2004, and is now fully operational. This
new immigration category allows non-European Economic Area na-
tionals who have graduated from UK higher or further education
establishments in certain mathematics, physical-sciences, and engi-
neering subjects with a 2.2 degree or higher to remain in the UK for
12 months after their studies to pursue a career. Only those who
have studied approved programs are eligible to apply to remain un-
der the scheme. The scheme was first announced in the UK 2003
budget as an incentive to encourage foreign students to study in these
fields in the UK and to be an asset to the workplace after graduation
by relieving the shortages of engineering, physical-sciences, and
mathematics graduates in the UK. Applicants must
– Have successfully completed a degree course with second-class hon-
ors (2.2) or higher, a master’s course or PhD on the relevant list of
Department for Education or skills-approved physical-sciences,
mathematics, and engineering courses at a UK institution of higher
or further education.
– Intend to work during the period of leave granted under the
scheme.
– Be able to maintain and accommodate themselves and any depen-
dents without recourse to public funds.
– Intend to leave the UK at the end of their stay (unless granted leave
as a work-permit holder, high-skilled migrant, business person, or
innovator).
42
UK Home Office “Working in the UK” Web page. Available at: kingin
theuk.gov.uk/working_in_the_uk/en/homepage/schemes_and_programmes/graduate_students.
html.
43
The scheme was highlighted in Sir Gareth Roberts’ review, “The Supply of People with
Science, Technology, Engineering and Mathematics Skills” (see />research-gc/roberts-transferable-skills/roberts-recommendations.doc), that the UK was suffer-
ing from a shortage of engineering, mathematics, and physical sciences students at university
and skilled workers in the labor market. This shortage could do serious damage to the UK’s
future economical growth. There is currently a reported shortage in sectors such as research
and development and financial services for mathematics, science, and engineering specialists.
Copyright © National Academy of Sciences. All rights reserved.
Rising Above the Gathering Storm: Energizing and Employing America for a Brighter Economic Future
/>397
SUMMARY
The complementary goals of balance and adequacy in federal funding
for science and technology require both diversity and cohesion in the
nation’s R&D system. Diversity fosters creativity, creates competition
among people and ideas, brings new perspectives to problems, and fosters
linkages among sectors. Cohesion helps ensure that basic research is not
squeezed out by more immediate needs and that the highest quality research
is supported.
Federal actions that could improve the balance of federal science and
technology (FS&T) funding include the following:
• Create a process in Congress that examines the entire FS&T budget
before the total federal budget is aggregated into allocations to appropria-
tions committees and subcommittees.
• Establish a stronger coordinating and budgeting role for the Office
of Science and Technology Policy to promote cohesion among federal R&D
agencies.
• Maintain the diversity of FS&T funding in terms of sources of fund-
ing, performers, time horizons, and motivations.
• Balance funding between basic and applied research and across fields
of research to stimulate innovative cross-disciplinary thinking.
This paper summarizes findings and recommendations from a variety of recently published
reports and papers as input to the deliberations of the Committee on Prospering in the Global
Economy of the 21st Century. Statements in this paper should not be seen as the conclusions of
the National Academies or the committee.
Achieving Balance and Adequacy in
Federal Science and Technology Funding
Copyright © National Academy of Sciences. All rights reserved.
Rising Above the Gathering Storm: Energizing and Employing America for a Brighter Economic Future
/>398 RISING ABOVE THE GATHERING STORM
• Protect funding for high-risk research by setting aside a portion of
the R&D budgets of federal agencies for this purpose.
• Maintain a favorable economic and regulatory environment for capi-
talizing on research—for example, by using tax incentives to build stronger
partnerships among academe, industry, and government.
• Encourage industry to boost its support of research conducted in
colleges and universities from 7 to 20% of total academic research over the
next 10 years.
Two important goals can help policy-makers judge the adequacy of
federal funding for FS&T. First, the United States should be among the
world leaders in all major areas of science. Second, the United States should
maintain clear leadership in some areas of science. The recent doubling of
the budget of the National Institutes of Health—and other recent increases
in R&D funding—acknowledge the tremendous opportunities and national
needs that can be addressed through science and technology. Similar oppor-
tunities exist in the physical sciences, engineering, mathematics, computer
science, environmental science, and the social and behavioral sciences—
fields in which federal funding has been essentially flat for the last 15 years.
Among the steps that the federal government could take to ensure that
funding for science and technology is adequate across fields are these:
• Increase the budget for mathematics, the physical sciences, and engi-
neering research by 12% a year for the next 7 years within the research
accounts of the Department of Energy, the National Science Foundation,
the National Institute for Standards and Technology, and the Department
of Defense.
• Return federal R&D funding to at least 1% of US gross domestic
product.
• Make the R&D tax credit permanent to promote private support for
research and development, as requested by the Administration in the fiscal
year (FY) 2006 budget proposal.
Support for a new interdisciplinary field of quantitative science and tech-
nology policy studies could shed light on the complex effects that scientific
and technologic advances have on economic activities and social change.
A Century of Science and Technology
In 1945, in his report Science—The Endless Frontier, Vannevar Bush
proposed an idea that struck many people as far-fetched.
1
He wrote that the
1
V. Bush. Science—The Endless Frontier. Washington, DC: US Government Printing Office,
1945.
Copyright © National Academy of Sciences. All rights reserved.
Rising Above the Gathering Storm: Energizing and Employing America for a Brighter Economic Future
/>APPENDIX D 399
federal government should fund the research of scientists without knowing
exactly what results the research would yield—an idea that flatly contra-
vened the US government’s historical practice.
2
Despite the misgivings of many policy-makers, the US government even-
tually adopted Bush’s idea. The resulting expansion of scientific and techno-
logical knowledge helped produce a half-century of unprecedented techno-
logic progress and economic growth. New technologies based on increased
scientific understanding have enhanced our security, created new industries,
advanced the fight against disease, and produced new insights into ourselves
and our relationship with the world. If the 20th century was America’s cen-
tury, it also was the century of science and technology.
Since 1950, the federal government’s annual support for research and
development (R&D) has grown from less than $3 billion to more than
$130 billion—more than a 10-fold expansion in real terms.
3
Today, about
1 in every 7 dollars in the federal discretionary budget goes for R&D. Per-
formers of federal R&D include hundreds of colleges and universities and
many thousands of private companies, federal laboratories, and other non-
profit institutions and laboratories. These institutions produce not only new
knowledge but also the new generations of scientists and engineers who are
responsible for a substantial portion of the innovation that drives changes
in our economy and society.
Major priorities within the federal R&D budget have shifted from the
space race in the 1960s to energy independence in the 1970s to the defense
buildup of the 1980s to biomedical research in the 1990s. In the 1990s, the
nation’s R&D system also began to encounter challenges that it had not faced
before. The end of the Cold War, an acceleration of economic globalization,
the rapid growth of information technologies, new ways of conducting re-
search, and very tight federal budgets led to thorough re-evaluations of the
goals of federal R&D. Though Vannevar Bush’s vision remains intact, the
R&D system today is much more complex, diversified, and integrated into
society than would have been imagined 60 years ago.
In this decade, the challenges to the R&D system have intensified. In-
ternational competitors are now targeting service sectors, including R&D,
just as they have targeted manufacturing sectors in the past. Global devel-
opment and internationalization, new trade agreements, and the rapid flow
of capital are reshaping industries so quickly that policy-makers barely have
time to respond. Similarly, workplace technologies and demands change so
quickly that workers must be periodically retrained to remain competitive.
2
A. H. Dupree. Science in the Federal Government: A History of Policies and Activities, 2nd
ed. Baltimore, MD: Johns Hopkins University Press, 1986.
3
National Science Foundation, National Science Board. Science and Engineering Indicators
2000. Arlington, VA: National Science Foundation, 2000.
Copyright © National Academy of Sciences. All rights reserved.
Rising Above the Gathering Storm: Energizing and Employing America for a Brighter Economic Future
/>400 RISING ABOVE THE GATHERING STORM
Throughout modern economies, advantages accrue to individuals, govern-
ments, and companies that are adaptable, forward-looking, knowledgeable,
and innovative.
At the beginning of the 21st century, the United States stands at a cross-
roads. The only way for this nation to remain a high-wage, high-technology
country is to remain at the forefront of innovation. Achieving this goal will
require that the nation remain a leader in the scientific and technological
research that contributes so heavily to innovation.
ACHIEVING BALANCE IN FEDERAL SCIENCE AND
TECHNOLOGY FUNDING
Federal funding for science and technology in the United States histori-
cally has been balanced along several dimensions—between research and
development, between defense and nondefense R&D, between academic
and nonacademic R&D performers, and so on. Much of this balance arises
in a de facto manner from the independent actions of a wide range of array
supporters and performers. But some is the consequence of explicit policy
decisions by the executive and legislative branches.
In the 1995 report Allocating Federal Funds for Science and Technol-
ogy, a committee of the National Research Council laid out five broad
principles designed in part to help the federal government achieve the proper
balance of R&D funding:
4
• Make the allocation process more coherent, systematic, and
comprehensive.
• Determine total federal spending for federal science and technology
based on a clear commitment to ensuring US leadership.
• Allocate funds to the best projects and people.
• Ensure that sound scientific and technical advice guides allocation
decisions.
• Improve federal management of R&D activities.
The report recommended that
• The President present an annual comprehensive FS&T budget, in-
cluding areas of increased and reduced emphasis. The budget should be
sufficient to serve national priorities and foster a world-class scientific and
technical enterprise.
• Departments and agencies make FS&T allocations based on clearly
4
National Research Council, Committee on Criteria for Federal Support of Research and
Development. Allocating Federal Funds for Science and Technology. Washington, DC: Na-
tional Academy Press, 1995.
Copyright © National Academy of Sciences. All rights reserved.
Rising Above the Gathering Storm: Energizing and Employing America for a Brighter Economic Future
/>APPENDIX D 401
articulated criteria that are congruent with those used by the Executive
Office of the President and by Congress.
• Congress create a process that examines the entire FS&T budget
before the total federal budget is disaggregated into allocations to appro-
priations committees and subcommittees.
• The President and Congress ensure that the FS&T budget is suffi-
cient to allow the United States to achieve preeminence in a select number
of fields and perform at a world-class level in other major fields.
The Executive Branch responded by providing, as part of the President’s
budget submission, an analysis of the FS&T budget that encompasses fed-
eral funds spent specifically on scientific and technological research pro-
grams, the development and maintenance of the necessary research infra-
structure, and the education and training of scientists and engineers. In
addition, the White House Office of Management and Budget (OMB) and
Office of Science and Technology Policy (OSTP) issue a joint budget memo-
randum that articulates the President’s goals for the upcoming budget year
to aid them in the preparation of agency budgets before submission to OMB.
Analysis of this budget reveals trends in the support of scientific and
technologic research that the broader category of R&D obscures. For ex-
ample, in the president’s FY 2006 budget request, federal R&D would be
up 1% from $131.5 billion to $132.3 billion. But FS&T would be down
1%, from $61.7 billion to $60.8 billion (see Figures R&D-1 and R&D-2).
5
(The director of OSTP has pointed out that it can be misleading to compare
proposed budgets with enacted budgets because the latter can contain funds
specified by Congress for research projects that were not included in the
President’s budget.
6
)
Congress has not yet adopted a process that entails an overall consider-
ation of the scientific and technological research supported by the federal
government.
7
Subcommittees in both the House and Senate still consider
portions of the federal R&D budget separately without deliberations or
hearings on the broad objectives of S&T spending. At a minimum, the use
of a common budget classification code could allow Congress more easily
to address science and technology programs in a unified manner.
Overall consideration of the FS&T budget could reiterate the importance
of basic research and of diversity among research supporters and performers.
5
Office of Management and Budget. Budget of the United States Government, Fiscal Year
2006. Washington, DC: US Government Printing Office, 2005.
6
John Marburger, speech to the 20th Annual AAAS Forum on Science and Technology
Policy, April 21, 2005.
7
J. Bingaman, R. M. Simon, and A. L. Rosenberg. “Needed: A Revitalized National S&T
Policy.” Issues in Science and Technology (Spring 2004):21-25.
Copyright © National Academy of Sciences. All rights reserved.
Rising Above the Gathering Storm: Energizing and Employing America for a Brighter Economic Future
/>402
FIGURE R&D-1 Federal research and development spending, in millions of dollars, for all R&D and for basic research, by agency,
2004-2006.
SOURCE: Executive Office of the President. Budget of the United States Government, Fiscal Year 2006, Part Two: Analytical
Perspectives. Washington, DC: US Government Printing Office, 2005. P. 66. Available at: />FY06RDChapterFinal.pdf.
2004
Actual
2005
Estimate
2006
Proposed
Dollar Change:
2005 to 2006
Percent Change:
2005 to 2006
By Agency
Defense 65,462 70,422 70,839 417 1%
Health and Human Services 28,047 28,752 28,80755
NASA 10,574 10,990 11,527 537 5%
Energy 8,779 8,629 8,528 –101 –1%
National Science Foundation 4,160 4,082 4,194 112 3%
Agriculture 2,222 2,415 2,039 –376 –16%
Homeland Security 1,053 1,185 1,467 282 24%
Commerce 1,137 1,134 1,013 –121 –11%
Transportation 661 748 808 60 8%
Veterans Affairs 866 784 786 2
Interior 627 615 582 –33 –5%
Environmental Protection Agency 661 572 569 –3 –1%
Other 1,089 1,243 1,145 –98 –8%
Total 125,338 131,571 132,304 733 1%
Basic Research
Defense 1,358 1,513 1,319 –194 –13%
Health and Human Services 14,780 15,124 15,246 122 1%
NASA 2,473 2,368 2,199 –169 –7%
Energy 2,847 2,887 2,762 –125 –4%
National Science Foundation 3,524 3,432 3,480 481%
Agriculture 829 851 788 –63 –7%
Homeland Security 68 85 112 27 32%
Commerce 43 58 71 13 22%
Transportation 20 38 4138%
Veterans Affairs 347 315 315
Interior 37 3630 –6–17%
Environmental Protection Agency 113 66 70 4 6%
Other 149 155 175 20 13%
Subtotal 26,588 26,928 26,608 –320 –1%
Copyright © National Academy of Sciences. All rights reserved.
Rising Above the Gathering Storm: Energizing and Employing America for a Brighter Economic Future
/>APPENDIX D 403
FIGURE R&D-2 Federal research and development spending, in millions of dollars,
by agency, for applied research, development, facilities, and equipment, 2004-2006.
SOURCE: Executive Office of the President. Budget of the United States Government,
Fiscal Year 2006, Part Two: Analytical Perspectives. Washington, DC: US
Government Printing Office, 2005. P. 67. Available at: />budget/2006/FY06RDChapterFinal.pdf.
2004
Actual
2005
Estimate
2006
Proposed
Dollar Change:
2005 to 2006
Percent Change:
2005 to 2006
Applied Research
Defense 4,351 4,851 4,139 –712 –15%
Health and Human Services 13,007 13,274 13,410 136 1%
NASA 3,006 2,497 3,233 736 29%
Energy 2,693 2,760 2,709 –51 –2%
National Science Foundation 266 279 276 –3 –1%
Agriculture 1,055 1,093 942 –151 –14%
Homeland Security 247 346 399 53 15%
Commerce 828 825 763 –62 –8%
Transportation 349 423 494 71 17%
Veterans Affairs 476 430 433 3 1%
Interior 538 530 495 –35 –7%
Environmental Protection Agency 423 365 386 21 6%
Other 599 562 553 –9 –2%
Subtotal 27,838 28,235 28,232 –3
Development
Defense 59,701 63,903 65,331 1,428 2%
Health and Human Services 41 54 28 –26 –48%
NASA 3,189 3,727 3,511 –216 –6%
Energy 1,992 1,846 1,959 113 6%
National Science Foundation
Agriculture 159 157 146 –11 –7%
Homeland Security 481 599 746 147 25%
Commerce 152 149 90 –59 –40%
Transportation 279 269 254 –15 –6%
Veterans Affairs 43 39 38 –1 –3%
Interior 49 4654 8 17%
Environmental Protection Agency 125 141 113 –28 –20%
Other 324 495 396 –99 –20%
Subtotal 66,535 71,425 72,666 1,241 2%
Facilities and Equipment
Defense 52 155 50 –105 –68%
Health and Human Services 219 300 123 –177 –59%
NASA 1,906 2,398 2,584 186 8%
Energy 1,247 1,136 1,098 –38 –3%
National Science Foundation 370 371 438 67 18%
Agriculture 179 314 163 –151 –48%
Homeland Security 257 155 210 55 35%
Commerce 114 102 89 –13 –13%
Transportation 13 18 191
Veterans Affairs N/A
Interior 3 33
Environmental Protection Agency N/A
Other 17 31 21 –10 –32%
Subtotal 4,377 4,983 4,798 –185 –4%
Especially when budgets are tight, basic research can be displaced by the
more immediate needs of applied research and technology development. In
fact, less than half of all federal R&D funding is allocated for basic and
applied research (see Figure R&D-3). The FS&T budget has increased since
2000, but these increases are primarily due to increases in funding of the
National Institutes of Health (NIH). Nondefense-related R&D funding has
Copyright © National Academy of Sciences. All rights reserved.
Rising Above the Gathering Storm: Energizing and Employing America for a Brighter Economic Future
/>404 RISING ABOVE THE GATHERING STORM
80%
10%
10%
Non-R&D
Research
$54 Billion
Federal R&D Spending
Including Facilities and
Equipment $123 Billion
Federal Science
and Technology
Budget $59 Billion
FIGURE R&D-3 Funding concepts in FY 2004 budget proposal.
SOURCE: National Science Board. Science and Engineering Indicators 2004. NSB
04-01. Arlington, VA: National Science Foundation, 2004. Figure 4-12.
60
50
40
30
20
10
0
1976
1978
1980
1982
1990
1992
1994
1996
1998
2000
2002
2004
2006
1984
1986
1988
DHS Nondefense
NIH
Nondefense, R&D
Minus NIH, DHS
FIGURE R&D-4 Selected trends in nondefense R&D, FY 1976-FY 2006, in billions
of constant FY 2005 dollars.
SOURCE: American Association for the Advancement of Science. Chart: Selected
Trends in Nondefense R&D: FY 1976-2006. Washington, DC: American Association
for the Advancement of Science, 2005. Available at: />trnon06c.pdf.
Copyright © National Academy of Sciences. All rights reserved.
Rising Above the Gathering Storm: Energizing and Employing America for a Brighter Economic Future
/>APPENDIX D 405
been stagnant in recent years (see Figure R&D-4). Recently, the FS&T bud-
get has been declining since the charge to double NIH funding has been com-
pleted (see Figure R&D-5). Recent Department of Defense (DOD) budgets
offer another example—ever the last decade, the resources provided for basic
research by the DOD have declined substantially.
8
Recent trends show that
while defense R&D budgets have been increasing overall, the amount of re-
sources allocated to science research in DOD is decreasing (see Figures R&D-
6A and B). This lack of support for basic research could have major conse-
quences for the development of necessary future military capabilities.
Allocating Federal Funds for Science and Technology also recom-
mended that:
• R&D conducted in federal laboratories focus on the objectives of
the sponsoring agency and not expand beyond the assigned missions of the
laboratories. The size and activities of each laboratory should correspond
to changes in mission requirements.
• FS&T funding generally favor academic institutions because of their
flexibility and inherent quality control and because they link research to
education and training in science and engineering.
• FS&T budget decisions give preference to funding projects and
people rather than institutions. That approach will increase the flexibility in
responding to new opportunities and changing conditions.
• Competitive merit review, especially that involving external review-
ers, be the preferred way to make awards, because competition for funding
is vital to maintain the high quality of FS&T programs.
• Evaluations of R&D programs and of those performing and spon-
soring the work also incorporate the views of outside evaluators.
• R&D be well managed and accountable but not micromanaged or
hobbled by rules and regulations that have little social benefit.
Diversity cannot be an excuse for mediocrity. People, projects, and in-
stitutions need to be reviewed to ensure that they are meeting national needs
in science and technology. Open competition involving evaluation of merit
by peers is the best-known mechanism to maintain support for the highest-
quality projects and people. Quality also can be maintained by knowledge-
able program managers who have established external scientific and techni-
cal advisory groups to help assess quality and to help monitor whether
agency needs are being met.
Possible actions for the federal government to maintain the diversity
8
National Research Council, Committee on Department of Defense Basic Research. Assess-
ment of Department of Defense Basic Research. Washington, DC: The National Academies
Press, 2005.
Copyright © National Academy of Sciences. All rights reserved.
Rising Above the Gathering Storm: Energizing and Employing America for a Brighter Economic Future
/>406
70,000
60,000
50,000
40,000
30,000
20,000
10,000
0
Total Budget
(millions of dollars)
2000
actual
2001
actual
2002
actual
2003
actual
2004
actual
2005
estimate
2006
proposed
Other Departments
Dept of Agriculture
Dept of Defense
Dept of Energy
NSF
NASA
NIH
FIGURE R&D-5 Federal science and technology (FS&T) budget, in millions of dollars, FY 2000-FY 2006.
SOURCE: Based on data in several editions of Executive Office of the President. Budget of the United States Government, Part Two:
Analytical Perspectives. Washington, DC: US Government Printing Office, 2005. Chapter 5. For research and development in the FY
2006 budget, see Table 5-3. Available at: />