Recent Advances in Mechatronics - Ryszard Jabonski et al (Eds) Episode 1 Part 8 pot
Bạn đang xem bản rút gọn của tài liệu. Xem và tải ngay bản đầy đủ của tài liệu tại đây (3.11 MB, 40 trang )
2. Analysis of thermographic images
During continuous object observation with the use of a thermographic de-
vice, a sequence of thermographic images in time t can be recorded. On the
basis of acquired series of thermograms, multidimensional thermographi-
cal signal ST(T(x,y),t) can be defined. If we consider a concept of conven-
tional real time partition into “micro” (dynamic) and “macro” (exploata-
tion) time [1], often applied in diagnostics, then a thermographic signal can
be definied in these both domains.
Taking into account “micro” and “macro” time concepts, analysis process
of thermographic signals can be divided into two stages. The first stage is
connected with thermogram analysis and feature estimation. It enables de-
termination of diagnostic signals in “micro” and/or “macro” time.
The second stage of analysis refers to analysis of diagnostic signals which
were determined at the first stage. For this purposes classical signal analy-
sis methods can be applied.
In the article the first stage of analysis of thermographic signal was pre-
sented. At this stage the most important task is analysis of thermogram
series and acquisition of diagnostic features. Features are necessary for
determination of diagnostic signals and thus a machine technical state.
Two simple methods of thermograms analysis were proposed. Common
operation which was applied in both methods was the application of
thresholding and estimation of binary images with the use of a measure of
an area above the threshold level which was established experimentally.
The measure area was treated as a diagnostic feature, and a diagnostic sig-
nal was built on the basis of its values. Thresholding was applied to two
kinds of images: in the first method recorded thermograms were directly
thresholded, in the second method an image of magnitude of Fourier spec-
tra determined from recorded thermograms with the use of 2D Fourier
transform were thresholded and estimated.
In order to verify proposed methods of analysis of thermogram series, an
active diagnostic experiment was carried out. The aim of the experiment
was acquisition of thermographic signals. An investigated object was a
single-phase commutaotor motor, whose technical state was estimated as
sufficient.
As a result of diagnostic experiments series of thermograms recorded dur-
ing the object operation in different technical states were obtained. Differ-
ences in thechnical states were simulatated by changing of motor load and
rotational speed.
264 M. Fidali
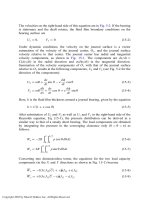
In order to verify the first method of analysis recorded thermograms were
thresholded with the use of different values of upper threshold and next
relative area A
th
of a region above the threshold level was computed for
each image. A reference area A
ref
was whole image. Functions presenting
variation of this area versus index of recorded images for different thresh-
olds were presented in Fig. 1. In figure binary images were shown. These
images correspond to values of the maximum area.
a)
1 2 3 4 5 6 7 8 9 10 11
5
10
15
20
25
30
35
Próg: 30
o
C
Index obrazu
Pole powierzchni A
th
/A
tot
[%]
b)
1 2 3 4 5 6 7 8 9 10 11
0
0.2
0.4
0.6
0.8
1
1.2
1.4
1.6
1.8
Próg: 50
o
C
Index obrazu
Pole powierzchni A
th
/A
tot
[%]
c)
1 2 3 4 5 6 7 8 9 10 11
0
0.05
0.1
0.15
0.2
0.25
0.3
0.35
Próg: 70
o
C
Index obrazu
Pole powierzchni A
th
/A
tot
[%]
d)
1 2 3 4 5 6 7 8 9 10 11
0
0.005
0.01
0.015
0.02
0.025
0.03
0.035
0.04
0.045
0.05
Próg: 90
o
C
Index obrazu
Pole powierzchni A
th
/A
tot
[%]
Fig. 1. Plots of a relative area values of thresholded thermographic images with
thresholds a) 30°C, b) 50°C, c) 70°C, d) 90 °C and binary images correspond to
maximum values of the area
The analysis of determined functions of an estimated diagnostic parameter
indicates that it is possible to observe changes of thermal state of objects
(Fig. 1b) and detect sudden thermal phenomena such as electric arc ob-
served in image no. 7 (Fig. 1d).
In case of application of the second proposed method, images recorded
during experiment were transformed to spectra with the use of 2D Fourier
transform. In Fig. 2 there are presented exemplary magnitudes of Fourier
spectrum estimated on the basis of thermograms recorded at the beginning
265Application of analysis of thermographic images to machine state assessment
of object operation (Fig. 2a), during operation in the moment of occurring
of electric arc between commutator and one of carbon brushes (Fig. 2b)
and at the end of machine observation when, in the bearing and commuta-
tor regions higher temperature caused by bearing seizing and commutation
effect occurred (Fig. 2c).
a)
b)
c)
Fig. 2. Magnitudes of Fourier spectra of thermograms recorded during machine
operation in different technical states.
Observations of determined Fourier images indicate differences as results
of changes of machine technical state.
Similarly as in the first method, in the second one, determined Fourier im-
ages were thresholded and for each binary image, a relative area was de-
termined. In Fig.3 a function of changes of the relative area versus indexes
of binary images was presented. Determined function indicates that images
created as a result of Fourier transform can be useful in a process of de-
termination of changes of machine technical state during its operation.
1 2 3 4 5 6 7 8 9 10 11
4
6
8
10
12
14
16
18
Index obrazu
Pole powierzchni A
th
/A
tot
[%]
Fig. 3. Function of relative area values computed from binary images of magni-
tude Fourier spectra of thermographic images
266 M. Fidali
Conclusions
In the article preliminary results of research whose aim was verification of
a proposed concept of evaluation of a technical state of an object on the
basis of results of analysis of sequence of termographic images were pre-
sented. Thermograms recorded during an active diagnostic experiment
were analyzed. One of proposed methods was based on images computed
with the use of 2D Fourier transform and such images were also processed.
One stated that such kinds of images can be also a source of information
about a diagnostic state thus can be processed with the use of different im-
age processing methods. Thermographic as well as Fourier images were
thresholded and such diagnostic features as the area of region above the
threshold was used to determine diagnostic signals.
The analysis of determined diagnostic signals indicates possibilities of ap-
plication of proposed methods of thermogram analysis to determination of
one dimensional diagnostic signal. The proposed concept can be used for
identification of changes of technical states during machine operation.
Results indicate that continuation of research in this area is necessary. Fu-
ture research will be focused on determination of a set of diagnostic fea-
tures which can be useful for classification of machine technical state.
References
[1] W. Cholewa “Method of machine diagnostics with application of
fuzzy sets” Zeszyty Naukowe Nr 764. Politechnika Śląska, Gliwice
1983. (in polish)
[2] C. R. Gonzales,. P. Wintz “Digital Image Processing” Addison-
Wesley Publishing Company 1987.
[3] H. Madura “Thermographic measurements in practice” Agencja wy-
dawnicza PAK, Warszawa 2004. (in polish)
[4] W. Minkina “Thermovision measurements. Devices and methods”
Wydawnictwo Politechniki Częstochowskiej. Częstochowa 2004. (in
polish)
[5] Z. Wróbel, R. Koprowski „Thermographic image processing” Proce-
edings of VI krajowej konferencji Termografia i termometria w pod-
czerwieni. Ustroń 2004. (in polish)
267Application of analysis of thermographic images to machine state assessment
µ
g
µ
The use of nonlinear optimisation algorithms
in multiple view geometry
Maciej Jawiski, Barbara Putz
Institute of Automatic Control and Robotics,
Warsaw University of Technology,
ul. w. Andrzeja Boboli 8, 02-525 Warszawa
Abstract
Search for optimal parameter set is a key point of stereovision algorithms
and of other geometric computer vision algorithms performing scene re-
construction that use multiple views of a given scene. Optimisation algo-
rithm must be robust and converge with high probability to one of the local
minimum of a cost function. The paper discusses the use of nonlinear op-
timisation algorithms in viewing parameter estimation in reconstruction.
1. Introduction
Theory and practice of computer vision algorithms have evolved much
during last decade. Scene reconstruction is now possible from pictures
taken from uncalibrated cameras. It was not possible ten years ago, when
process of camera calibration involved calculation of 11 parameters of
each camera, from which epipolar geometry was computed. Because cam-
era parameters changed during the robot was moving, it was not possible
to perform dynamic reconstruction.
Comprehensive information on reconstruction using multiple view ge-
ometry can be found in monograph [4]. Stereovision systems are the most
popular; basic reconstruction scheme with the use of data aquired from two
views is pointed below :
1. Compute fundamental matrix F, representing the intrinsic projec-
tive geometry between two views and satisfying the relation x'
T
Fx=0
for any pair of corresponding points x and x' in the two images
2. Calculate camera projective matrix using epipolar constraint
3. For each of interest points in each image calculate its position in
3D scene.
2/5
In order to meet efficiency requirements, optimisation algorithm
used in reestimation of fundamental matrix F, repeated many times from
all point correspondences in step 1 must be robust. The well known basic
optimisation methods like steepest descent method, Newton’s method and
Gauss-Newton methods are not efficient enough for solving reconstruction
problems. To achieve fast and stable convergence, more advanced methods
should be used.
2. Damped methods
In damped methods step length is controlled by damping parame-
ter
µ
. Example of damped method is the Levenberg-Marquardt method
[2], which is modification of Gauss-Newton method, introducing damping
parameter. Damping parameter may
µ
may be given by the user, or cal-
culated using some equation, most often in the form of
}{max
)0(
0 iii
a
τµ
=
, where
τ
is a parameter provided by user, and
)0(
ii
a
are
the elements of Hessian matrix. In the Levenberg-Marquardt method step
length and step direction are calculated simultaneously, by solving equa-
tion:
ghIJJ
LM
T
−=+ )(
µ
where
g
is the gradient of F(x),
I
is an identity matrix, J - Jacobian ma-
trix,
µ
is the damping parameter,
LM
h
is the current step. By introducing
Jacobian-based Hessian matrix approximation, the method requires only
one-order partial derivatives.
For large values of
µ
factor
µ
I dominates the left-hand side of
equation and algorithm behaves like steepest descent algorithm which
converges slowly; for small values of
µ
factor J
T
J dominates and algo-
rithm behaves like Gauss-Newton algorithm.
The Levenberg-Marquardt method has become the standard of non-
linear least-squares routines due its simplicity and efficiency; see Numeri-
cal Recipes or [10]. It works very well in practise and is quite suitable for
minimisation with respect to a small number of parameters, like stereovi-
sion based reconstruction [6,7].
Damped methods can be implemented as a model-trust regions metods
described below.`
269e use of nonlinear optimisation algorithms in multiple view geometry
3/5
3. Trust region algorithms
The trust region methods [1,7] are characterized by two main concepts – a
model function L approximating given cost function F, and trust region
∆
.
In the trust region methods it is assumed that model function is accurate in
area of a trust region
∆
. The step length is controlled directly by trust re-
gion radius, as opposed to damped methods. Quality of the model is evalu-
ated by so called gain-ratio, dependent on parameter vector and the step in
current iteration.
One of trust regions methods is the Dog Leg optimization algorithm,
where the choose between the gradient descent step (if the Cauchy point
lies outside the trust region), the Gauss-Newton step (if it lies inside the
trust region) or combination of these - toward the intersection of the trust
region with the line from Cauchy point to Gauss-Newton point - is per-
formed, with the use of descent direction J
T
ε and Hessian matrix J
T
J. Im-
portant feature of Dog Leg version described in [7] is that normal equa-
tions can be computed only once for every successful iteration.
4. Specialized methods
Some methods may take advantage of problem’s properties. In general
case optimisation contained in this algorithms do not give better conver-
gence, but when applied to some class of problems, they can make altered
methods more efficient. Example of such method is sparse Levenberg-
Marquardt method [2, 11], which uses sparse structure of parameters ma-
trix in reconstruction problems from two views. In this case the Jacobian
matrix has special form [4]:
where A
i
and B
i
are partial derivatives of
i
X
ˆ
on a and b
i
respectively,
i
X
ˆ
denotes the estimated value of i-th measured point with its parameter vec-
tor b
i
, a is a vector of camera parameters.
With the sparseness assumption, each iteration of algorithm re-
quires computation time linear in n, the number of parameters. Without
sparsness assumption the central step of algorithm has the complexity n
3
in
270 M. Jaźwiński, B. Putz
4/5
the number of parameters. Analogously one can use sparse LM in the tri-
focal or quadrifocal tensor optimisation and in the multiple image bundle
adjustment, taking advantage of the lack of interaction between parameters
of the different cameras [4]. But Dog Leg algorithm can also benefit from
sparse structure of Jacobian matrix in calculating descent direction and
Hessian matrix. Thus when performing bundle adjustment in multiple view
geometry, Dog Leg tends to be the best algorithm [6,7].
The interesting example of using sparse Levenberg-Marquardt
method is presented in [9]. The reconstruction scheme of 3D NURBS
curves is performed directly from its stereo images. The reconstruction of
3D curve is converted into control points and weights of NURBS repre-
sentation of the curve, accordingly bypassing point-to-point correspon-
dence matching. The Jacobian matrix has a sparse and simple form that
allows efficient and stable Levenberg-Marquardt iteration.
5. Combined methods – new optimisation techniques
Some of more advanced algorithms tend to be hybrid algorithms,
although this relation is not straightfoward. One example of hybrid
method is algorithm presented by Madsen, and described in more detail in
[8]. It combines Levenberg-Marquardt method with Quasi-Netown’s
method, starting with Levenberg–Marquardt method, and switching to
Quasi–Newton, if algorithm detects that cost function is significantly non-
zero. Research is performed also on methods that use other techniques.
One example of such research is work of Heyden, Würtz and Peters [5].
Simple evolutionary algorithm used to back Levenberg-Marquardt optimi-
sation gave improvement in the quality of reconstruction. Evolutionary
algorithm may be used to perform optimisation data before or after optimi-
sation by Levenberg-Marquardt algorithm.
Interesting result of research are published in [3], where evolution-
ary algorithm, which normally uses Gauss-Newton step, or gradient-
descent step, was implemented to use both methods and choose better re-
sult. Test results show that this led not only to improvement in conver-
gence time, but also in quality of optimisation result.
Tests performed by authors show, that approach used in [3] for select-
ing step length, applied to Dog Leg algorithm, don’t give any significant
improvement compared to Levenberg-Marquardt, or standard Dog Leg, in
problems, where these algorithms should be used. For small scale prob-
lems enhanced Dog Leg algorithms gave better results then standard Dog
Leg, but worse than Levenberg-Marquardt. For large scale problems (as
BA) results were worse than obtained using standard Dog Leg algorithm.
271e use of nonlinear optimisation algorithms in multiple view geometry
5/5
6. Conclusion
An overview of available algorithms, with knowledge of each algo-
rithm pros and cons, is required in order to choose the best optimisation
algorithm for the given problem. For example, when performing bundle
adjustment, Dog Leg tends to be the best algorithm, as it can too benefit
from sparse structure of Jacobian matrix. For small scale problems, like
stereovision based reconstruction, Levenberg–Marquardt seems to be the
best algorithm. Supplementing optimisation algorithms with evolutionary
algorithms may result in more precise or robust reconstruction.
References
[1] Berghen F. V.: "CONDOR: a constrained, non-linear, derivate-free
parallel optimizer for continous, high computing load, noisy objective
functions", 2003-2004.
[2] Frandsen P.E., Jonasson K., Nielsen H.B. and Tingleff O.: "Uncon-
strained Optimization", 3rd Edition, DTU, 2004.
[3] Gnosh A., Tsutui S., “Advances in evolutionary computing. Theory
and applications”, Nat. Comp. Series, Springer-Verlag 2003, 45-95.
[4] Hartley R., Zisserman A.: “Multiple View Geometry in Computer Vi-
sion”, Second Edition, Cambridge Univ. Press 2006, UK.
[5] Heyden L., Würtz R.P., Peters G.: „Supplementing bundle adjustment
with evolutionary algorithms”. International Conference on Visual In-
formation Engineering - VIE 2006, 533-536, Bangalore, India.
[6] Jawiski M., Putz B.: „Evaluation of the Levenberg-Marquardt and
the Dog Leg optimization algorithms for small scale problems”. Paper
accepted for 13h IEEE International Conference MMAR 2007.
[7] Lourakis, M.L.A. Argyros, A.A.: "Is Levenberg-Marquardt the most
efficient optimization algorithm for implementing bundle adjust-
ment?". ICCV 2005, Tenth IEEE Conf. on Comp. Vision, 1526-1531.
[8] Madsen K., Nielsen H.B., Tingleff O.: "Methods for non-linear least
squares problems". Technical University of Denmark, April 2004.
[9] Xiao Y.J., Li Y.F.: “Optimized stereo reconstruction of free-form
space curves based on a nonuniform rational B-spline model”. J.of
the Opt. Society of America A, vol. 22, no.9, Sept. 2005, 1746-1762.
[10]
levmar: Levenberg-
Marquardt nonlinear least squares algorithms in C/C++.
[11]
sba: A Generic Sparse Bun-
dle Adjustment C/C++ Package Based on the Lev Marq. Algorithm.
272 M. Jaźwiński, B. Putz
Modeling and Simulation Method of Precision
Grinding Processes
B. Bałasz (a) , T. Królikowski (a)
(a) Koszalin Universtity of Technology
Department of Fine Mechanics ul. Raclawicka 15-17
Koszalin, 75-016, Poland
Abstract
Grinding is very complex process depending on large number of correlated
factors. In precise grinding it is very important to select optimal conditions
and to preserve stable conditions during the process. The model of grind-
ing process comprise usually a few elementary models: model of a grain,
model of a grinding wheel topography, model of surface roughness, model
of the process kinematics, model of a chip formation, forces and energy,
thermal and vibration. The author of this paper undertook a study on de-
veloping algorithms and programs for complex simulation of grinding
process. This paper presents assumptions, schemes, examples of models,
and results of the advanced kinematic-geometrical model of grinding proc-
esses.
1. Introduction
The efficiency and quality of abrasive machining processes has a decisive
influence on the costs and quality of elements produced as well as whole
products. The machining potential of abrasive tools is used insufficiently.
One of more important reasons for an insufficient use of the machining
potential is a slow development of new abrasive tools – development work
focuses more on the improvement of the known technologies and not so
much on the creation of new abrasive tools. Also, due to high costs of re-
search into tools from ultra-hard materials concerning new tools, such re-
search has not made a sufficient progress. As a solution to the problem of
second group of parameters a modeling and computer simulation of grind-
ing process is one of the possible answer [1, 2, 3].
2. Fundamentals of the modeling and simulation
Models of the process geometry where developed based on the experimen-
tal results of microcutting process carried out with a single grain. The aim
of the experiments was to obtain the conditions for chip formation accord-
ing to grain shape, depth of cut and value of cutting speed for different
type of the grains and machined material. To achieve that objectives the
experimental stand has been developed, based on plane grinding machine
equipped with grinding tool with a grip for mounting a single grain (cp.
figure 1a), material sample mounted on dynamometer (cp. figure 1b), what
enables the measurement of grinding forces during cutting. The results of
each experiment where gathered in databases for father analysis.
Fig. 1. Experimental stand for microcutting process: a) grinding tool with single
grain, b) material specimen
Each material sample after cutting experiment was measured with pro-
filometer in order to obtain the data on depth of cut, size of pile-ups and
deviation of that on the length of the cut. A microscopic pictures of a
grains and the scratches made by a cutting edges identified on the grains
were also obtained with the use of scanning electron microscope (cp. fig-
ure 2).
Fig. 2 SEM-pictures of the grain and scratches made by single grain during micro-
cutting
274 B. Bałasz, T. Królikowski
3. Modular simulation system
The objective of the research was to developed a modular system capable
of providing simulation of machining processes with ability of flexible
adaptation of different grinding process types regarding different grains
type and size, models of grinding wheels (grain concentration, grains ar-
rangement on surface), kinematics of processes. To achieve its flexibility
simulation system was divided into four subsystems responsible for com-
pletion tasks connected with modeling, simulation computation, data man-
agement and simulation data analyzes. The diagram of simulation system
module was presented on figure 3.
Fig. 3. Modules of the grinding simulation system
3.1. Modeling subsystem
The model of grinding process comprise usually a few elementary models:
model of a grain, model of a grinding wheel topography, model of surface
roughness, model of the process kinematics, model of a chip formation,
forces and energy. Grains are generated with application of a two-
dimensional elastic neuron network for the generation of the surfaces of
abrasive grains with macro-geometric parameters set. In the neuron model
developed, the output parameters are the number of the grain vertices, the
apex angle and the vertex radius [4]. As a result of the work of the system,
a random model of a grain with set parameters is obtained. The neuron
model developed is used as a generator of the surface of the model of abra-
sive grains in the system of modeling and simulation of grinding proc-
esses. With every generated grain there is associated vector of grain pa-
275Modeling and simulation method of precision grinding processes
rameters, describing temporal states of the grain during the whole process
(e.g. number of contacts with workpiece material, volume of removed ma-
terial, normal and tangential forces etc.). After grain generation, the work-
ing surface of the grinding wheel is generated by positioning a single
grains with distribution of chosen model for grinding wheel type surface
Thanks to that, the characteristic of behavior of contact during the process
could be thoroughly discovered. On generated surface the model of the
bond is placed on. As a completion to this task, models of grain displace-
ment and removal and the dressing process are also elaborated.
3.2. Simulation subsystem
The structure of that subsystem is based on discrete time simulation. Dur-
ing the simulation grains moves over grinding zone with step of one mi-
crometer and on the basis of grinding wheel velocity v
s
and workpiece ve-
locity v
ft
time step is determined. In each time step the calculation of indi-
vidual grains contact causing material profile modification take place and
results are saved in the database. In order to reduce demand for computer
memory, only grains and material profiles moving through grinding zone
are read from databases and beyond the zone are released to databases.
3.3. Data management subsystem
The role of this subsystem is the manage the data created during the mod-
eling, simulation and analyzes. The four databases were created for stor-
ing: objects of the grains, objects of the grinding tools, objects of material
profiles before processing and simulation data, materials profile after proc-
essing and results of analyzes. A large number of data for simulation
comes form outer sources, also the simulated data must be available out-
side simulation system , therefore a large number of procedure for import-
ing and exporting data to different data formats (e.g. txt, csv, xml, sur)
have been written as well.
3.4 Data analyzes subsystem
Data obtained during simulations are being analyzed with functions cre-
ated in data analyzes subsystem. The most significant analyzes concern:
the grain activity and its load, the average cut layers, flotation of single
grain depth of cut along the grinding zone, and the influence of grains
276 B. Bałasz, T. Królikowski
shape, size and arrangement on afore mentioned phenomena. Various data
analysis methods have been implemented, range from dynamic sql-queries,
statistical inference to data mining (eg. decision trees, clustering, time se-
ries, logistic regression).
4. Conclusion
The developed models of grinding processes reveals features which en-
ables designing a new models of grinding tools with optimal grains shape
and size, and its orientation on the grinding tool surface. The optimization
process is feasible due to possibility of the models to carry out the simula-
tion within a vast range of process parameters variability and exact gather-
ing data concerning individual contact of grains. The innovation solution
of presented models depends on isolation of individual grains during the
simulation process and analyzing the phenomena in the grinding zone in
relation to single grain. The most significant analyzes concern: the grain
activity and its load, the average cut layers, flotation of single grain depth
of cut along the grinding zone, and the influence of grains shape, size and
arrangement on afore mentioned phenomena.
References
[1] Bałasz B., Królikowski T., Kacalak W.: Method of Complex Simula-
tion of Grinding Process. Third International Conference On Metal Cutting
And High Speed Machining, Metz, France 2001, pp. 169-172
[2] Bałasz B. Królikowski T.: Utility of New Complex Grinding Process
Modeling Method. PAN Koszalin 2002, pp. 93-109
[3] Królikowski T., Bałasz B., Kacalak W.: The Influence of Micro- And
Macrotopography of the Active Grinding Surface on the Energy Consump-
tion in the Grinding Process. 15th European Simulation Multiconference,
Prague, Czech Republic 2001, pp. 339-341
[4] Szatkiewicz T., Bałasz B., Królikowski T.: Application of an elastic
neural network for the modeling of the surfaces of abrasive grains. Artifi-
cial Neural Networks in Engineering ANNIE 2005, ASME Press, New
York 2005, pp. 793-800.
ACKNOWLEDGEMENTS
This work was supported by grant: KBN Nr 4 T07D 033 28 form Polish
Ministry of Science and Higher Education
277Modeling and simulation method of precision grinding processes
Determination of DC micro-motor characteristics
by electrical measurements
P. Horváth (a)*, A. Nagy (b)
(a) Széchenyi University, Egyetem tér 1.
Gyır, H-9026, Hungary
(b) Széchenyi University, Egyetem tér 1.
Gyır, H-9026, Hungary
Abstract
It is generally difficult to carry out and measure breaking moments pre-
cisely in the mNm range. Instead of traditional methods using brake and
additional mechanical elements to determine torque vs. angular velocity
characteristics of micro-motors this paper suggest a new procedure based
on purely electrical measurements. Theoretical background of the measur-
ing procedure is discussed detailed. The suggested method is shown in the
case of a RF300E DC micro-motor.
1. Introduction
The design process of a control system requires some knowledge about all
parts of the system, including actuators. Small size DC motors are still of-
ten used in mechatronic systems as actuators. Their parameters must be
determined experimentally. This process usually needs a brake to load the
motor. Testing of even regular size motors can cause problems, because
application of a brake needs additional mechanical parts (clutch, disc) to
be fixed to the motor shaft. Fitting accuracy, additional weight and damp-
ing may all influence both the static and the dynamic behaviour of the mo-
tor. Measuring the braking moment with sufficient accuracy-especially at
extremally low-power motors-can cause the core of the problem.
An ingenious idea can be found in [1], where eddy-current clutch and a
DC motor with known characteristics, as a brake has been applied.
u
u
u
u
The aim of this paper is to present a parameter identification
method without application of additional mechanical parts.
2. Modeling a DC motor
The dynamic model of DC motors is known well in literature [2] (Fig.1).
The electrical part models the resistance R and inductance L of the arma-
ture winding. Motor constant k serves to calculate the back electromotive
force owing to the motion of the coil in electromagnetic field.
R L
u
b emf
u
T
m
ω
b
i
M
F
ω
M
L
Fig. 1. Dynamic model of a DC motor
The free-body diagram of the mechanical part involves the mass- moment
of inertia
J
, combined damping moment consisting of velocity-
proportional
bω
and constant Coulomb-type
M
F
friction parts, driving
torque
T
m
=k
⋅
i
and the external load
M
L
. On the basis of the model two
equations can be written:
3. The effect of Coulomb-friction
Damping law is the weakest point of the model, so the effect of the Cou-
lomb-type friction on the dynamic behaviour must be analyzed theoreti-
cally. Let us consider a free run-out of the rotor without excitation and ex-
ternal load, assuming the initial condition
ω
(0)=
ω
0
. In this case electrical
part has no effect to the motion of the rotor, so (2) becomes simple:
)3(Mb
dt
d
J
F
−=ω+
ω
)2(MMbki
dt
d
J
)1(k
dt
di
LiRu
LF
−−ω−=
ω
ω++=
279Determination of DC micro-motor characteristics by electrical measurements
Ignoring the details of the solution the following result occurs:
)4(
b
M
)t
J
b
exp()
b
M
(
FF
0
−−+ω=ω
Fig. 2. depicts the shape of the theoretical run-out curve with Coulomb,
velocity-proportional as well as combined friction moment.
0
ω
bM
F
C
o
u
l
o
m
b
Velocity-
proportional
Combined
t
t
STOP
ω
Fig. 2. Free run-out of rotor applying different type of damping
3. Parameter identification
The model describing the operation of a DC motor has the following un-
known parameters:
R
,
L
,
k
,
b
,
M
F
and
J
. Some of the parameters, such as
R
and
L
can be determined by standard methods (R=11,52
). Determination
of the other parameters needs due considerations.
3.1. Motor constant
At stationary condition
ω
=constant the steady-state armature constant i
SS
does not change, consequently the inductivity has no effect. Expressing
motor constant from (1) we get
)5(
Riu
k
SS
SS
−
−
ω
−
=
Measuring steady-state angular velocity
ω
S-S
happened by a commercial
optical revolution-meter constructed originally to ball bearings. Motor con-
280 P. Horváth, A. Nagy
stant has been calculated at various angular velocities and it really proved
to be constant (k
≈
0,00785 Vs/rad).
3.2. Friction moment
Determination of the Coulomb-type friction moment occurs at starting
phase of the unloaded motor. Motor current is increased from zero until the
motor just begins to rotate (i
0
≈
0,0135 A). At this instance the driving
moment is equal to the friction moment (M
F
≈
0,000106 Nm):
)6(Mki
F0
=
3.3. Viscous damping coefficient
This measurement happens at stationary condition, when there is no inertia
effect. Velocity proportional damping coefficient can be expressed from
(2):
)7(
)ii(kMki
b
SS
0SS
SS
FSS
−
−
−
−
ω
−
=
ω
−
=
Viscous damping coefficient has been calculated at various angular veloci-
ties and proved to be constant (b
≈
7,2·10
-8
Nms/rad).
3.4. Mass-moment of inertia
This is the most sophisticated task of the parameter identification process,
to which dynamic measurement is necessary.We investigated the free run-
out of the unloaded motor from
ω
=
ω
0
to
ω
=0. Close to the stopping the
viscous damping is negligible, so (2) can be written as
)8(M
dt
d
J
F
−=
ω
Instead of measuring the
ω
=
ω
(t) time-history we apply the following pro-
cedure. The motor runs with stationary angular velocity
ω
0
when we cut
the input voltage. The motor starts operating as a generator and the oscillo-
scope with high input impedance measures the back emf which is propor-
tional to the angular velocity. The run-out diagram of the investigated
RF300E DC micro-motor can be seen in Fig.3. Even though the curve is
)4(
b
M
)t
J
t
281Determination of DC micro-motor characteristics by electrical measurements
noisy due to the commutation, fortunately near stopping the tangent of the
curve d
ω
/dt can be drawn precisely (t
STOP
≈
1,03 s). Applying (8) the mass-
moment of inertia can be calculated (J
≈
1,9·10
-7
kgm
2
).
Fig. 3. Run-out curve for measuring mass-moment inertia
4. Conclusions
This paper presented a new method to identify parameters of DC micro-
motors without applying additional mechanical parts. Results of the inves-
tigation showed (Fig. 3), that Coulomb-type friction is significant com-
pared to velocity proportional damping, so it must be taken into considera-
tion. The method outlined above can be applied at regular size DC motors
too. By means of parameters determined above, static or dynamic charac-
teristics of DC motors can be drown by known methods.
References
[1 A. Huba, A. Halmai: Berührunslose Drehmomentenmessung für extrem
kleine Drehmomente, Periodica Politechnica, TU Budapest, 1987,
Vol.31.pp.2-3
[2] G. F. Franklin, J.D. Powell: Feedback control of dynamic systems, Ad-
dison-Wesley, Stanford, 1992.
282 P. Horváth, A. Nagy
Poly-optimization of coil
in electromagnetic linear actuator
Paweł Piskur, MSc
(a) ,
Wojciech Tarnowski, Prof. Dr. Habilit.,
(b)
(a) (b)
Control Engng Dept
Technical University, Koszalin, 75-620 Poland
Abstract
The main advantages of the electromagnetic linear actuators are the simple
design structure, the fast response for input signal, a possibility to achieve
a high linear acceleration and a low cost of maintenance [4][5]. Moreover,
a linear motion is a natural output, so there is no need of any mechanical
transmission.
On the other hand, the main drawbacks are: low energy efficiency and a
need of the great current impulse source.
In the present paper an optimization of the actuator design is considered.
The overall criteria are the maximal energy efficiency ratio and the mini-
mal mass and volume of the actuator for the required kinetic energy of the
core. These criteria may be transformed into design variables; in the pre-
sent work we adapt two specific criteria:
- coil inductance (to be minimal);
- electromagnetic force (to be maximal).
A mathematical model for the two-criteria optimization is elaborated, and
a poly-optimization is completed.
The final result is a set of Pareto optimal solutions [1], which makes possi-
ble to draw out some more general conclusions on a design of the actuator.
1. Introduction
Electromagnetic actuators are commonly used for various purposes [3],
however the main drawback is the low energetic efficiency. The efficiency
is here understood as a ratio of the kinetic energy of the core at the outlet
to the electric supply energy delivered to the coil.
In the case of gun actuator, there is a set of coils, displayed by series.
However, in this paper for a preliminary analysis there is only one coil sys-
tem under consideration .
2. Object of poly-optimization
The system consists of one cylindrical coil and a ferromagnetic moving
coaxial core (see Fig. 1), under normal atmospheric pressure. The coil is
supplied by a constant voltage impulse of finite time. The goal of the sys-
tem is to accelerate the core to a maximal kinetic energy.
3. Optimization criteria
The main functional criterion is a power efficiency η, what implies that for
a demanded kinetic energy of the core, a system may be light and of lim-
ited dimensions, what concerns also an electric supply.
What more, an important parameter is the outlet velocity of the core: if one
demands a high speed, also the current in the coil must quickly increase.
To achieve it by a constant voltage, a small inductance is necessary
(see Eqn. 1-3). Thus we decide to adopt the coil inductance L as another
optimality criterion.
x(10)
y(10)
x(1)
y(10)
x(10)
y(1)
coil
ferromagnetic moving core
a)
b) c)
Fig. 1 Object of poly-optimization: the core and the coil; three exemplary
design versions: a) x=1, y=10, b) x=10, y=10, c) x=10, y=1
4. Mathematical Model
Symbols
z - windings number [-]; u(t) - supply voltage of the coil [V];
i(t) - current in the coil [A]; d - core displacement [mm]
R - Ohm resistance of the coil [Ω]; R - Coil winding radius [mm];
r
µµ
0
- relative permeability [H/m];
ρ
- electrical conductivity [Ωm];
284 P. Piskur, W. Tarnowski
t – time [s]; v - velocity of the iron core [m/s]; m – mass [kg]
A - average area of the cross – sectional magnetic flux [mm
2
];
Power effectiveness:
%100
SUPPLY
KINETIC
E
E
=
η
; (1)
where:
∫
=
=
=
1
0
)()(
tt
t
SUPPLY
dttituE
; (2)
)1()(
λ
t
e
R
u
ti
−
−=
; (3)
R
L
=
λ
; (4)
2
r
l
R
π
ρ
=
; (5)
Inductance L
2
0 r
z S
L
length
⋅
= µ µ
; (6)
where z and S are functions of x and y, and length is the y.
;
2
1
2
mvE
KINETIC
=
(7)
∫
= Fdt
m
v
1
; (8)
;)(
1
2
11
22
2
0
dttiz
d
A
m
v
r
∫
=
µµ
(9)
dttiz
d
AE
rKINETIC
2
22
2
0
)(
1
2
1
2
1
∫
=
µµ
; (10)
)(
1
2
1
22
2
0
tiz
d
AF
r
µµ
=
; (11)
where F is electromagnetic force, d and z are functions of x and y.
285Poly-optimization of coil in electromagnetic linear actuator
Decision variables
Arbitrarily was decided that dimensions of the coil x and y are to be the
decision variables (see Fig. 1); remaining arguments of formulas are taken
to be constant.
Constraints
Current density in a coil:
6
max
2
2
i
A
3,66 10
d
m
4
ρ ≤ = ⋅
π⋅
; (12)
max
x y 0,7 i z
⋅ ⋅ρ⋅ = ⋅
; (13)
Supply power
SUPPLY NOM
E E≤
, where:
NOM
E
is a nominal (catalogue)
power of the supply unit.
5. Solution of the poly-optimization problem
The main computation problem is, that the inductance L is a function of
the coil parameters and of the current position of the core s and its pa-
rameters, as well. This relation is strongly nonlinear, and changing in time.
An analytical form could be found as a rough approximation. So we have
decided to use a MES method [6], and realize computations step by step,
for discrete points of time and the core position s.
0
50
100
150
200
250
300
350
400
0 50 100 150 200 250 300 350 400 450
coil inductance*10^-10[H]
electromagnetic force *10^-4[N]
x(1)y(1)
x(1)y(2)
x(10)y(10)
x(2)y(5)
x(3)y(10)
x(2)y(10)
x(8)y(2
)
x(5)y(2
)
x(3)y(2)
x(10)y(2
)
x(1)y(5)
x(1)y(8
)
x(2)y(1)
x(3)y(1)
x(5)y(1)
x(8)y(1)
x(10)y(1)
x(1)y(10
)
x(5)y(10)
x(10)y(3)
x(8)y(4)
x(2)y(3)
x(2)y(2)
286 P. Piskur, W. Tarnowski
Fig. 2 All discrete solutions, the Pareto optimal solutions (left-upper edge)
and recommended Pareto solutions (in the ellipse)
To find the optimal solution(s) we adopt a full decision space survey tech-
nique [2]. The length x(i) and the outer radius y(j) of the coil was varied in
the range [5,…, 50 mm], with 5 mm step.
Results are shown in Fig. 2.
6. Conclusions and final remarks
Although the Pareto – poly-optimal solutions comprise larger set, a practi-
cal meaning have the solutions in the ellipse (Fig. 3), with the high value
of the force.
As a continuation of the poly-optimization efforts, we include the voltage
control signal as an important decision function.
The poly-optimal approach has been a powerful tool to examine the prob-
lem in a broad context.
Various optimization techniques should be tested, for example the Genetic
Algorithms.
Acknowledgements
This work was supported by ZPORR (Zintegrowany Program Operacy-
jny Rozwoju Regionalnego)
References
[1] W. Tarnowski “Symulacja i optymalizacja w Matlab’ie” ,WSM, Gdy-
nia, 2001.
[2] A. Jastriebow, M. Wyciślik „Optymalizacja – teoria, algorytmy i ich
realizacja w Matlab’ie”, Wydawnictwo Politechniki Świętokrzyskiej,
Kielce, 2004.
[3] D.Howe “Magnetic actuators” Sensors and Actuators 81 (2000) p. 268-
274.
[4] Comsol “Electromagnetic Module – User’s Gide”
287Poly-optimization of coil in electromagnetic linear actuator
Characterization of Fabrication Errors in
Structure Geometry for Microtextured Surfaces
D. Duminica (a), G. Ionascu (a), L. Bogatu (a), E. Manea (b), I. Cernica
(b)
(a) “POLITEHNICA” University, 313, Splaiul Independentei,
Bucharest, 060042, Romania
(b) Institute of Microtechnology, Str. Erou Iancu Nicolae 32 B,
Bucharest, 077190, Romania
Abstract
The high accuracy, high resolution and freedom in choice of shapes make
the etched silicon wafers an interesting alternative to study the effect of
surface material and texture.
Well-defined surface textures were produced by UV photolithography and
anisotropic etching of silicon wafers. The patterns included squares placed
in a rectangular grid and parallel grooves of different sizes. The characteri-
zation of textured surfaces was also performed. The microstructure geome-
try errors were identified and statistically quantified.
1. Introduction
It is well known that the tribological performance of materials is highly
dependent on the surface topography [1,2].
The monocrystalline silicon micromachining allows the obtaining of vari-
ous shape cavities, using for this purpose the wet chemical erosion, selec-
tive, anisotropic and with shape influence by controlled doping of the
processed material [3].
Silicon crystallizes in keeping with cubic system and it has the diamond
structure. Its elementary cell is an octahedron limited by the family of
planes {111}, explaining the angles formed by the tapered walls of the
cavities with the planes (100)/(110)/(111) on which the wafers are cut.
Consequently, the anisotropic chemical erosion creates on a wafer surface
cut on the plane (100) cavities having the contour of a square or rectangle