Understanding And Applying Machine Vision Part 7 potx
Bạn đang xem bản rút gọn của tài liệu. Xem và tải ngay bản đầy đủ của tài liệu tại đây (515.33 KB, 25 trang )
Page 187
Figure 8.19
Erosion operation
(courtesy of ERIM).
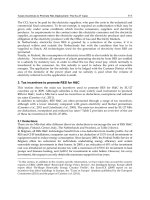
Figure 8.20
Duality of dilation and erosion
(courtesy of ERIM).
Page 188
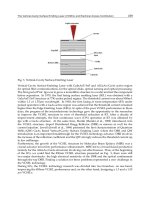
Figure 8.21
Mathematical morphology in processing of PC board images
(courtesy of General Scanning/SVS).
The results of the first operation-closing are depicted in Figure 8.22(b). A difference image is shown in Figure 8.22(c).
A threshold is taken on the difference image [Figure 8.22(d)]. Filtering based on shape takes place to distinguish the
noise from the scratch; that is, the detail that can fit in a structured element in the shape of a ring is identified in Figure
8.22(e) and subtracted [Figure 8.22(f)]. Figure 8.22(g) depicts the segmented scratch displayed on the original image.
Figure 8.22a–g
Morphology operating on a scratch on manifold
(courtesy of Machine Vision International).
Page 189
Figure 8.22
Continued.
Page 190
Figure 8.22
Continued.
Page 191
Figure 8.22
Continued.
Page 192
8.4—
Coding/Feature Extraction
Feature extraction is the process of deriving some values from the enhanced and/or segmented image. These values,
the features, are usually dimensional but may be other types such as intensity, shape, etc. Some feature extraction
methods require a binary image, while others operate on gray scale intensity or gray scale edge-enhanced images. The
methods described below are grouped into three sections: miscellaneous scalar features, including dimensional and
gray level values; shape features; and pattern matching extraction.
8.4.1—
Miscellaneous Scalar Features
Pixel Counting
For simple applications, especially part identification and assembly verification, the number of white pixels in a given
window is enough to derive the desired result. This operation, finding the number of pixels above a threshold within a
window, is called ''pixel counting." It is a very widely used technique and runs very quickly on most systems.
Often pixel counting is used for tasks other than the main application problem such as threshold selection (as already
described), checking part location, verifying the image, etc.
Edge Finding
Finding the location of edges in the image is basic to the majority of the image-processing algorithms in use. This can
be one of two types: binary or enhanced edge. Binary-edge-finding methods examine a black-and-white image and fred
the X-Y location of certain edges. These edges are white to black, or black-to-white transitions. One technique requires
the user to position scan lines, or tools ("gates") in the image (Fig. 8.23). The system then finds all edges along the
tools, and reports their X-Y coordinates.
Figure 8.23
Edge finding, circles are edge locations found.
Page 193
These gates operate like a one-dimensional window, starting at one end and recording coordinates of any transitions.
Many times they can be programmed to respond to only one polarity of edge, or only edges "n" pixels apart, or other
qualifiers. Like windows, some systems allow orientation at angles, while others do not.
Because they are one-dimensional, and also because the video is binarized, any edge data collected using gates should
be verified. This verification can be done by using many different gates and combining the results by averaging,
throwing out erratic results, etc. Other features are often used to verify binary edge data such as pixel counting.
Gray-scale edge finding is very closely tied with gray-scale edge enhancement; in fact, usually the two are combined
into one operation and are not available as two separate steps. Generally, the edge-enhanced (gradient) picture is
analyzed to find the location of the maximum gradient, or slope.
This is identified as the "edge." The set of coordinates of these edge points are taken as features and used as inputs for
classification. Sometimes, the edge picture is thresholded to create a binary image so that the edges are "thick." A
"thinning" or "skeletonizing'' algorithm is then used to give single pixel wide edges. The first method, finding gradient,
gives the true edge but usually requires knowing the direction of the edge (at least approximately). The second method,
thresholding the gradient and thinning, may not find the true edge location if the edge is not uniform in slope. The error
is usually less than one pixel, depending on the image capture setup; and, thus, thresholding the gradient image is a
very common gray-scale edge locating method.
There are systems that use algorithms that produce edge location coordinates directly from the gray scale data, using
algorithms that combine filters, gradient approximations, and neighborhood operations into one step. These are usually
tool-based (or window-based) systems. Many even 'learn" edges by storing characteristics such as the strengths of the
edge, its shape and the intensity pattern in the neighborhood. These characteristics can be used to ensure that the
desired edge is being found during run-time.
8.4.2—
Shape Features
Some computationally more intensive image analysis systems are based on extracting geometric features. One such
approach (developed at Stanford Research Institute International) involves performing global feature analysis (GFA)
on a binary picture. In this case, the features are geometric: centroid, area, perimeter, and so on. In GFA, no inferences
are made about the spatial relationships between features, and generally the parts are isolated.
Generally, operations are performed on the "raw" (unprocessed) video data (filtering) and preprocessed images (run
length encoding) (Figure 8.24). Decisionmaking and control is the function of the microprocessor.
Page 194
Figure 8.24
Run length encoded image.
Figure 8.25
Thresholded segmentation.
Page 195
An enhancement of this approach involves segmentation based on either threshold gray scale or edges. In thresholded
gray scale, a threshold (Figure 8.25) is set, and if the pixel gray level exceeds the threshold, it is assigned the value 1.
If it is less than the threshold, it is assigned the value 0. An operator during training can establish the threshold by
observing the effect of different thresholds on the image of the object and the data in the image sought. The threshold
itself is a hardware or software setting.
A pixel gray value histogram (Table 4. 1) analysis display can provide the operator with some guidance in setting the
threshold. In some systems, the threshold is adaptive; the operator sets its relative level, but the setting for the specific
analysis is adjusted based on the pixel gray scale histogram of the scene itself.
Once thresholded, processing and analysis is based on a binary image. An alternative to thresholded segmentation is
that based on regions, areas in an image whose pixels share a common set of properties; for example, all gray scale
values 0–25 are characterized as one region, 25–30, 30–40, and so on, as others.
TABLE 8.1 Uses for Histograms
Binary threshold setting
Multiple-threshold setting
Automatic iris control
Histogram equalization (display)
Signature analysis
Exclusion of high and low pixels
Texture analysis (local intensity spectra)
SRI analysis is a popular set of shape feature extraction algorithms. They operate on a binary image by identifying
"blobs" in the image and generating geometrical features for each blob. Blobs can be nested (as a part with a hole; the
part is a blob, and the hole is a blob also). SRI analysis has several distinct advantages: the features it generates are
appropriate for many applications; most features are derived independent of part location or orientation, and it lends
itself well to a "teach by show" approach (teach the system by showing it a part).
SRI, or "connectivity" analysis as it is often called, requires a binary image. However, it only deals with edge points,
so often the image is "run-length" encoded prior to analysis. Starting at the top left of the screen (Figure 8.26), and
moving across the line, pixels are counted until the first edge is reached. This count is stored, along with the "color" of
the pixels (B or W), and the counter is reset to zero. At the end of the line, one should have a set of 'lengths" that add
up to the image size (shown below), 0 = black, 1 = white.
Page 196
These set of like pixels are called runs, so we have encoded this line of binary video encoded by the length of the runs;
hence, "run-length encoding." Run-length encoding is a simple function to perform with a hardware circuit, or can be
done fairly quickly in software.
Figure 8.26
Shape features.
Each line in the image is run-length encoded, and the runs are all stored. The runs explain about the objects in the
scene. The image in Figure 8.26 may appearas:
-20W 15B 65W
-20W 17B 65W
-20W 10B 1W 5B 65W
-20W 10B 3W 5B 63W
-20W 10B 5W 5B 26W 5B 30W
-20W 10B 7W 5B 22W 9B 28W
-20W 10B 9W 5B 19W 11B 27W etc.
Note how the left "blob" split into two vertical sections. Similarly, as one works down the image, some blobs may
"combine" into one. The keys to SRI are the algorithms to keep track of blobs and sub-blobs (holes), and to generate
features from the run lengths associated with each blob. From these codes many features can be derived. The area of a
blob is the total of all runs in that blob.
By similar operations, the algorithms derive:
Maximum X, Y
Minimum X, Y
Page 197
Centroid X, Y Orientation angle
Length Width
Second moments of inertia Eccentricity ("roundness")
Minimum circumscribed rectangle Major and minor axes
Maximum and minimum radii, etc
Figure 8.27
Connectivity/blob analysis
(courtesy of International Robotmation Intelligence).
Page 198
Figure 8.28
Geometric features used to sort chain link
(courtesy of Octek).
Figures 8.27 and 8.28 are examples of the SRI approach. It is apparent that knowing all these features for every blob in
the scene would be enough to satisfy most applications. For this reason, SRI analysis is a powerful tool. However, it
has two important drawbacks that must be understood.
1. Binary image - the algorithms only operate on a binary image. The binarization process must be designed to produce
the best possible binary image under the worst possible circumstances. Additionally, extra attention needs to be paid to
the image-verifying task. It is easy for the SRI analysis to produce spurious data because of a poor binary image.
2. Speed - because it (typically) examines the whole image, and because so many features are calculated during
analysis, the algorithms tend to take more time than some other methods. This can be solved by windowing to restrict
processing, and by only selecting the features necessary to be calculated. Most SRI-based systems allow unnecessary
features to be disabled via a software switch, cutting processing time.
Some systems using SRI have a "teach by show" approach. In the teach mode, a part is imaged and processed. In
interactive mode, the desired features are stored. At run time, these features are used to discriminate part types, to
reject non-conforming parts, or to find part position. The advantage is that the features are found directly from a
sample part, without additional operation interaction.
Page 199
8.4.3—
Pattern Matching
Pattern matching is also called "correlation, pattern recognition, or template matching" - a mathematical process for
identifying the region in an image that "looks most like" a given reference subimage. The reference subimage, or
"template," is overlaid on the image at many different locations. At each, goodness of match is evaluated. The location
with the best is recorded, and the process is complete. Notice that process is inherently robust since it uses all the
information in the image. Note, however, that a "match'' operation, involving the template and part of the subimage,
must be performed for each location in the image; this is a very time-consuming task. Many considerations discussed
below involve ways of reducing this time.
Binary
For the case of a binary image and template, the match process is fairly simple. The total number of different pixels is
evaluated; the smaller this number, the better the match. If one XORs the image and the template, white results where
the pixel values are different, black where they were same (see Fig. 8.29).
Figure 8.29
Binary image and template.
Page 200
Figure 8.30
Location 1. Total number of pixels = 25, number of black pixels = 21,
match % = 21/25 × 100% = 84%.
Figure 8.31
Location 2. Number of black pixels = 13, match % = 13/25 × 100% = 52% match.
Page 201
Figure 8.32
Evaluation of percent match at each
location and matrix formed.
Evaluate the match at several different locations in the recording each with its location. For location #1: template pixel
(0, 0) at image pixel (0, 0) (see Fig. 8.30).
Now shift the template one pixel to the right. For location #2: template pixel (0, 0) (see Fig. 8.31). Notice that one can
only shift the reference four more pixels to the right. The number of different displacements in one dimension is equal
to the size of the image, minus the size of the template in that dimension, plus one. Mathematically, the number of
different locations possible for an m × n image and an i × j template is: (md-i+l)
*
(n-j+1).
If this process is continued exhaustively, evaluating the percent match at each location and forming a matrix of the
results, Figure 8.32 is obtained.
From this, the best match is at (4, 5) in the image. This is the pixel in the image that corresponds to pixel (0, 0) in the
plate. Therefore, this is also an offset that can be added at any pixel coordinates in the template to find their location in
the image. This simple example brings out several points:
A full XOR and pixel counting operation must be done at each offset. If a match is tried at every possible location
(exhaustive search), the time requirements are considerable.
100% match occurs only for an exact match. The closer the match, the higher the percentage.
Two unrelated patterns (random noise) will match to about 50%, using this quality calculation (XOR and count). The
only way to get 0% match would be to
Page 202
have a reverse image (for example, a white cross on a black field). What useful information is obtained from the
pattern matching process?
Most importantly:
1. Location of the template in the image.
2. The quality of match between the image and the template.
The location can be used for several things. In robot guidance applications, the part's X-Y coordinates are often the
answer to the application problem. For most inspection systems, the material handling does not hold part position
closely enough. Pattern matching can be used to find the part's location, which is then used to direct other processing
steps. For instance, often the location found by pattern matching will relocate a set of windows so that they fall over
certain areas of the part.
The quality of match can be used to verify the image. If the quality is lower than expected, something may be wrong
with the part (mislocated, damaged, etc.) or the image (bad lighting or threshold). Also, more than one pattern
matching process may occur, each using a reference corresponding to a different number. The reference that gives the
best match is the same part number as the image; this can be used to sort mixed parts.
In reality, parts can not only translate (X and Y), but rotate (0). Therefore, a third variable must be introduced. At each
location (X and Y), the template must be rotated through 360 degrees, and the match at each angle evaluated. This
gives the system the ability to find parts at any orientation, as well as any position. However, the computational speed
is quite substantial for an exhaustive search approach. Assuming that the match is evaluated at each location (every
pixel) and at every angle (1 degree increments), we must make [(assume 256 × 256 image, 64 × 64 template) = (256 -
64 + 1) (256 - 64/1) 360] = 13.4 million match operations, each one 64 × 64!
The most common approach for solving this problem is to use a "rough search" first, followed by a "fine search." The
"rough search'' may only examine every tenth pixel in X and Y, and every 30 degrees in 0. This would call for
Then, starting at the "most promising" point(s) found by the rough search, a fine search is conducted over a limited
area. This search uses increments of 1 pixel and the smallest angle increment. The best match thus found is the final
result. For most images used, this procedure works very well. However, this provides a guide to selecting a reference.
To aid the rough search, the template should contain some large features (of course, they should be unambiguous - so
they are not confused with undesired features). For the fine search, some small, sharp details should be in the template
also.
Page 203
Figure 8.33
Running template through image.
The search is an interesting problem, since it calls for some interpolation to lay the rotated template (Fig. 8.33). An
often-used technique is binary pattern matching of edge pictures. In this case, both the template and the image have
been edge enhanced and thresholded (but usually not skeletonized). This allows pattern recognition to be used on
scones that cannot be binarized simply. Normalization of the gray scale images or auto-thresholding of the edge may
be necessary to get consistent edge pictures
In Figure 8.33 the template was given. In practice the template is loaded during a "teaching phase". A part is imaged by
the system and a nominal (0,0) point chosen. The appropriate size subimage is extracted from the image (or its image)
and stored in memory as the template. Usually the teach phase allows matching with the part to check the template,
loading of multiple references for part-sorting applications, and viewing of the reference for further verification.
Sometimes the system allows "masking" of irrelevant portions of the template. For instance, if the part may or may not
have a hole in a certain location, and one does not want its presence or absence to affect the quality of the match, it can
be "masked" out; pattern matching will then consider only the rest of the template.
Gray-Scale Pattern Matching
This operation is similar to binary pattern matching, except that the part and the template contain gray-scale values.
The measure of goodness of fit is then based on the difference between pixel values. A "square root of the sum of
squares" quantity is appropriate, for instance:
Page 204
The denominator term is included to "normalize" the result. Without this, the index would be the lowest where the
image had the lowest gray levels, not where the pattern match was the best.
A quantity of this type involves a lot of computation. When the rotation variable 0 is included, it becomes challenging
to use this technique in industrial image processing for "full frame" searches. Gray scale pattern matching is used by
several systems, however, in the following manner. At "teach time," several small windows are laid on the image
(typically 7 × 7). Around each of these, a larger window is defined. The contents of each small window are stored as
references. At run time, the system will search within each large window for its appropriate reference pattern. Then
when each has been found, the offsets from nominal are combined to yield the part's true position (offset from nominal
at teach time). If the search window is kept fairly small (40 × 40), the run time is not excessive.
8.5—
Image Analysis/Classification/Interpretation
For some applications, the features, as extracted from the image, are all that is required. Most of the time, however,
one more step must be taken; classified interpretation.
The most important interpretation method is conversion of units. Rarely will dimensions in "pixels" or "gray levels" be
appropriate for an industrial application. As part of the software, a calibration procedure will define the conversion
factors between vision system units and real world units. Most of the time, conversion simply requires scaling by these
factors. Occasionally, for high accuracy systems, different parts of the image may have slightly different calibrations
(the parts may be at an angle, etc.). In any case, the system should have separate calibration factors in X and Y.
Sometimes, especially in process control applications, the dimensional output must be converted again into units of
control signal (stepper motor pulses, pulse rate, control voltage, etc.).
Reference points and other important quantities are occasionally not visible on the part, but must be derived from
measurable features. For instance, a reference point may be defined by the intersection of two lines (as the "bend
point" of a tube, defined by the axes of the tube on either side of the bend). To derive the location of this point, enough
points must be measured to define the two lines (Fig. 8.23) and find their intersection by geometry.
Another common indirect measurement is to locate the center of a circle by finding points on its perimeter. Most
systems have fast methods for doing this. In fact, indirect measurement calculations should present no problem to an
experienced applications engineer.
An almost trivial classification step is a good/bad test. This consists of some logical combination of the measured
dimensions and some preset limits. For instance, if the measured length is between 3.3 and 3.5, AND the diameter is
no more than 0.92, the part is good; otherwise, it is bad. Any system that performs a
Page 205
good/bad check of this type should also make the measured dimensions available. During system setup and debug, it
will be necessary to see the quantities. It is extremely difficult to verify the image processing performance of a system
that says only "good" or "bad."
Error checking, or image verification, is a vital process. By closely examining the features found, or extracting
additional features, test the image itself to verify that it is suited to the processing being done. Since features are being
checked, it can be considered a classification or interpretation step. Without this, features could have incorrect values
because the part is mislocated, upside down or missing, because a light has burned out, because the lens is dirty, etc. A
philosophy of "fail-safe" programming should be adopted; that is, any uncertainty about the validity of the image or the
processing should either reject parts or shut down the process. This is vital in inspection applications, where errors
could lead to bad parts being passed. This is imperative in the process control, process verification, and robot guidance,
where safety is at risk. Unfortunately, error-checking procedures are usually specific to a certain type of image; general
procedures are not available. However, here are some possibilities:
Pattern matching - too low of a quality index suggests that something has changed.
Pixel counting windows - one on a known bright spot to check lights; one on a known area of the part to check
presence.
Histogramming - smoothing of the histogram may indicate poor focus; shift will show changes in light level; distortion
or smoothing may be due to dirt on lens or sensor malfunction.
Redundant feature extraction - if two quantities should be similar and are not, something is not right.
Edge counts - a tool of window that sees too few or too many edges may indicate part movement, dirty part or lighting
problems.
8.6—
Decision-Making
Decision-making, in conjunction with classification and interpretation, is characterized as heuristic, decision theoretic,
syntactic or edge tracking.
8.6.1—
Heuristic
In this case, the basis of the machine vision decision emulates how humans might characterize the image:
Intensity histogram
Black-white/black-white transition count
Pixel counts (Figure 8.34, 8.35, and 8.36)
Background/foreground pixel maps
Background/foreground pixel counts
Average intensity value
Page 206
Figure 8.34
Pixel map
(courtesy of General scanning/SVS).
Figure 8.35
Pixel counting measuring technique
(courtesy of Automated Vision
Systems).
Page 207
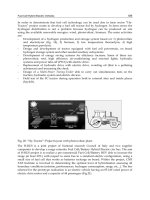
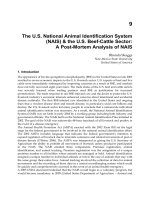
Figure 8.36
Using multiple camera based vision system to gage large objects
(courtesy of General Motors).
Delta or normalized image intensity pixel maps
X number of data points, each representing the integration of intensity over some area in the picture row/column totals.
Often companies that offer these products refer to the representation so established as a "fingerprint" or template. Some
companies have executed these programs in hardware and, consequently, can handle some decision-making at
throughputs as high as 3000 per minute.
These systems typically operate in a "train by showing" technique. During training (sometimes called learning), a
range of acceptable representative products is shown to the system, and the representation, which is to serve as a
standard, is established. The representation may be based on a single object or on the average of the images from many
objects, or may include a family of known good samples, each creating a representation standard to reflect the
acceptable variables.
In the operating mode, decision-making is based on how close the representation from the present object being
examined compares to the original or standard representation(s). A "goodness-of-fit" criterion is established during
training
Page 208
to reflect the range of acceptable appearances the system should be tolerant of. If the difference between the
representation established from the object under test and the standard exceeds the "goodness-of-fit" criteria, it is
considered a reject. Significantly, the decision may be based on a combination of criteria (pixel counts and transition
count, for example). The goodness-of-fit criteria then becomes based on statistical analysis of the combination of each
of the "fit" criteria.
Decision-making, in conjunction with these approaches, can be either deterministic or probabilistic. Deterministic
means that given some state or set of conditions, the outcome of a function or process is fully determined with 100%
probability of the same outcome. Probabilistic means that a particular outcome has some probability of occurrence
(100%), given some initial set.
A major reason these techniques work in imagery stems from the fact that imagery is highly redundant. Changes in
images as a function of spatial coordinates is generally slow, and more often than not, neighboring pixels look very
much like each other.
Some of these systems have an ability to compensate for translation and rotation errors to account for positional
uncertainty. Some will employ simple timing analysis-start processing when transition is first detected, for example.
This can compensate for both horizontal and vertical translation, but not rotation.
Translation, as well as rotation compensation, is generally obtained using correlation techniques as described in the
pattern matching section (Figures 8.37 and 8.38). Significantly, in some applications, it may be the objective to
determine the extent of rotation to be able to feed the information back to the machine to compensate accordingly for
the next operation. Such is the case with wire bonders and die slicers in microelectronics manufacturing. In this
instance, X, Y and theta data are fed back to the machine to make corrections before operating on the semiconductor
chip or silicon wafer.
Although systems exist capable of providing some translation and rotational compensation before representation
extraction to eliminate position as a variable, such systems are bound by requiring that the object always remain in the
field of view. By expanding the field of view to make the system tolerant of positional uncertainty, one does sacrifice
the size detail such a system can reliably detect, or as the basis of a decision.
Many of these type systems base their representation on threshold images. Recognizing that the encoded value of each
pixel is based on the average intensity value across the pixel, because of sampling and part variables, there is inherent
uncertainty associated with the decision of which region to identify a pixel with, especially along the boundaries.
Consequently, these systems generally have some uncertainty related to what constitutes "good."
The "goodness-of-fit" criterion must be tolerant of this scene-to-scene interpretation variation. The fit criteria can be
established by experimenting with comparing the range of representations established from routine production items.
One inherent weakness systems may be that to be forgiving of acceptable vari-
Page 209
Figure 8.37
One tactic for correcting for translation positional uncertainty
(courtesy of Inex Vision Systems).
Figure 8.38
Correlation routine used to compensate for rotation and
translation positional uncertainty
(courtesy of Inex Vision Systems).
Page 210
ables, the "goodness-of-fit" criterion becomes too lenient, and the escape rate for defective products becomes
excessive. Alternatively, by establishing the fit too tightly, the incidence of false rejects will increase, a condition that
may be equally intolerable in a production environment. As a general rule, systems based on heuristic decision analysis
techniques are most successful where significant contrast changes represent the basis of the decision. The gray scale
shade difference should exceed 10% and, ideally, 20%. Where backlighting is possible, these systems can be very
effective. Where contrast can be achieved by inferring data from the distortion due to structured lighting, these
techniques can also be effective. In these instances, the contrast stems from the use of filtering techniques to isolate the
decision on the structured light-HeNe laser light (632.8 nanometers), for example.
8.6.2—
Decision Theoretic
Decision theoretic analysis is frequently associated with the SRI set of techniques. Decisions are made based on
comparisons of the feature (Table 8.2) vector created from the specific geometric features selected upon which to base
the decision during training, for example area and perimeter (Table 8.2). In these "decision-theoretic" approaches,
objects are represented by N features (Figure 8.28) or an N-dimensional feature vector, and the decision is based on a
distance measure in vector space (Figure 8.39). These techniques are especially well suited to recognition, verification,
and location analysis.
8.6.3—
Syntactic Analysis
The ability to make decisions based on pieces of an object is usually based upon "syntactic" analysis, unlike the
decision theoretic approach. In this case, the object is represented as a string, a tree, or a graph of pattern primitives
and their
Figure 8.39
Decision vector and pattern recognition paradigm: nearest neighbor
method.
Page 211
TABLE 8.2 Prototype Development
Moments
General moment
Y-1 ,-
j
X, N, Y, M, 1, J = 0,1,2, Where each (X, Y) pixel is either black
(1) or white (0)
Zero Moment
Area = M
00
=N =Number of black cells
First Moments
X centroid = X = M
01
/M
00
= Σ
i
X
i
Y centroid = Y = M
01
/M
00
= Σ
j
Y
j
Second moments
M20 = (Σ
l
X
2
) Y
2
, M
02
= (Σ
j
Y
2
)X
2
, M
11
= (Σ
l
Σ
j
XY) - XY
Angle = 1/2 + tan
-1
(2M
11
/(M
02
-M
20
))
Magnitude = 1/{2(M
20
+ M
02
) + [(M
02
- M
20
)
2
- 4M
11
2]1/2}
Sixth moments
M
06
, M
15
, M
24
, M
60
Area Algorithm
Binary threshold area = number of pixels that are white (or black)
Area = N = ΣP(X, Y)D
l
D
l
= 1 if pixel is white
D
l
= 0 if pixel is black
Whenever a white pixel is met, the counter is incremented by 1. Alternatively, the counter
increments every pixel between threshold edges. If gray scale is used, D
l
becomes the gray scale
value itself. This is sometimes called the zero moment.
Max-min Algorithm
Once the centroid is known, the object perimeter is scanned and each edge pixel position is
subtracted from the centroid value. The first such value is stored in two counters (max and min).
Each subsequent perimeter value is compared to these counts and if it is larger, it replaces the max
count. If it is smaller, it replaces the min count.
Centroid Algorithm
The two centroids X and Y are first moments and are sometimes referred to as the mean. Similarly,
second, third, and fourth moments are analogous to standard deviation, skew, and kurtosis.
X = Σ
l
X
l
/A Y = Σ
j
Y
j
/A
Each time a white pixel is encountered, its X coordinate and its Y coordinate are added to the
centroid count. After the count is complete, it is divided by the area.
Min R Max for Orientation Calculation
This feature is like the semimajor axis feature, but it is completely general rather than specific to
ellipses. It may also be used to calculate part orientation. It is assumed that all parts can be stored or
referenced with their max R direction parallel to the Y axis. The max R is known by its two end
points (centroid and perimeter). These numbers can be used to calculate the relative orientation.
Min R Max for Determination of Handedness
(continues)
Page 212
(table continued from previous page)
When the direction of max R is calculated and aligned to the Y axis and the direction of min R is calculated and if the min R
directions of both the image and the standard are in the same direction, the object is right handed. If the directions are opposed,
the object is left-handed. Thus, the attributes of only one of an enantiomorphic pair need to be stored.
relationships. Decision-making is based on a parsing procedure. Another way to view this is as local features analysis
(LFA) - a collection of local features with specified spatial relationships between various combinations thereof. Again,
these primitives can be derived from binary or gray scale images thresholded or edge processed.
For example, three types of shape primitives include curve, angle and line that together can be used to describe a
region. Image analysis involves decomposing the object into its primitives, and the relationships of primitives results in
recognition. The primitive decision-making can be performed using decision theoretic or statistical techniques.
An easy example involves finding a square in an image. It is known that a square has four corner points equidistant
from each other. A corner point in a square has two contiguous points that are at right angles to it. A system based on
syntactic analysis would first find all the points satisfying the definition of a corner point [Figure 8.40(a)] and then find
all the points whose relation to each other satisfies the equidistant syntax [Figures 8.40 (b) and 8.40 (c)].
Figure 8.40a–c
Example of syntactic analysis
(courtesy of RVSI/Itran).
Page 213
Figure 8.40
Continued.
Page 214
8.6.4—
Edge Tracking
In addition to geometric feature extraction of boundary images, image analysis can be conducted by edge tracking;
when the edge is detected, it is stored as a link of edge points. Alternatively, line encoding and connectivity analysis
can be conducted. That is, the location of edge points detected is stored and line fitting is performed.
Decision-making is then based on comparison of line segments directly or based on probability theory. Line segment
descriptions of objects are called structural descriptions. The process of comparing them to models to fred the most
similar model is called structural pattern recognition.
8.7—
A Word about Gray Scale
Gray scale processing is a much overused term in machine vision. Gray levels are physical measurements that
represent the integration of many properties: hue, saturation, lightness, texture, illumination, shadows, viewpoint,
surface reflectance, surface orientation, filter properties, sensor sensitivity nonuniformity, and so on. All companies
that offer products that encode pixel sites into a digital value corresponding to brightness refer to their systems as ''gray
scale" systems. In many instances, the next operation involves using an established threshold to assign all brightness
values above a certain level to one region and all those below to another. In other words, binary picture processing is
what actually takes place. If based on adaptive thresholding, it may be appropriate to consider such a system a gray
scale system; otherwise it is actually a binary system.
Some gray scale systems establish a representation based on the gray scale content (the average gray value in the scene
or in the window), a histogram of the grays values, Fourier coefficients based on the gray values, and so on. Deviations
from the standard representations based on contrast changes are detected.
Some products develop adges based on gray scale gradients The edge segmentation that ensues becomes the basis upon
which to model the scene; geometric features can be extracted on models based on, for example, line vectors and can
be the basis of the representation stored. In these systems each of the eight (in the case of a 256-shade system) arrays
of bits is stored in its own individual RAM memory bit plane (Figure 8.41)
In Addition to video noise (present in virtually all imaging sensors) contributing to a vision system's inability repeat
precisely its data when a system is presented the same scene, is a phenomenon often referred to as spatial quantization.
This stems from the fact that scene edged are not precisely merged with the arrays pixel pattern of the sensor. Subtle
subpixel variations in the position of the scene can cause major variations in the gray levels of the pixels located along
the edges. Keeping this in mind, where edges are by definition places where the image gray levels cross a binarization
threshold, thresholding amplifies adge variations, causing uncertainly in the perimeter of an object. Gray scale
processing
Page 215
Figure 8.41
Analog-to-digital conversion for gray scale.
Figure 8.42
Pipeline architecture.
Page 216
algorithms, while also sensitive to edge variations, tend to normalize them or at least not amplify variations.
While systems based on gray scale analysis are computationally more expensive, they are more tolerant of contrast
variations within an object and from object to object as well as those due to shadows, lighting, and so on. Gray scale
boundary descriptive (edge) techniques also lend themselves to analyzing touching and overlapping parts as well as
flexible objects or objects with several stable positional states as long as the necessary structured elements or pieces of
the object can be recognized.
Each approach offers advantages in certain applications. Where contrast is available upon which to base a decision,
techniques involving, for example, binary representations and average gray values, can be effective. Typically,
assembly verification can be performed with these approaches. Where the decision must be based on low contrast and
the representation based on edges is essential, gray scale gradient techniques will be required. Gaging with reasonable
accuracy requirements usually benefit from systems that employ these approaches.
8.8—
Summary
In summary, image-processing procedures include image enhancement, feature extraction and image analysis/
classification. Enhancement is generally performed to remove unwanted clutter or noise. It may involve a variety of
techniques from simple image frame averaging to spatial, temporal, median, or other filtering. As suggested, feature
extraction may involve histograms, segmentation, masking (structuring an element), line thinning, and so on. Image
analysis/classification may involve region labeling, line segment labeling, histogram, pixel counts, and
SO on.
The steps associated with image acquisition and image enhancement as described herein are called the "iconic"
processing steps as they deal with pictorial data, or at least a gray value digital representation. Image analysis and
image coding or classification are sometimes referred to as the symbolic processing stage since they deal with a
representation of the features extracted from an image rather than with the image itself. Symbolic phases include
recognition of objects and object attributes, and interpretation of the relationship between attributes.
Systems that are more tolerant of contrast and part registration generally perform more computationally expensive
preprocessing, processing, and analysis. While much of this could be done in software, the time would be prohibitive
for many shop-floor applications. Consequently, many commercial systems are based on creative approaches in the
following:
Custom hardware (edge, correlation, convolution, histogram, etc.)
Algorithm-driven architectures using floating-point processors
Memory-driven architectures that minimize need to access data from memory
Page 217
Tailored instruction sets (edge detection, histogram, etc.)
Data flow computers with multitasking capabilities
Parallel computer architectures using array processors or multiprocessors
These can obtain gains of 1000–100,000 in operations per pixel.
Pipeline architectures (Figure 8.42) are those in which the image moves into the processor and the various operations
are performed sequentially. After each operation is performed, it is moved to the next operator, and the next image
moves into the original operator. A processed image comes out of the pipeline every frame (once the first cycle of
operators is completed), but the time lapse between entering and leaving the pipeline can be tens of seconds.
A parallel-pipeline architecture is one in which the image enters the pipeline, and many different operators work on the
image simultaneously.