In vitro and ex vivo effect of hyaluronic acid on erythrocyte flow properties pps
Bạn đang xem bản rút gọn của tài liệu. Xem và tải ngay bản đầy đủ của tài liệu tại đây (636.42 KB, 7 trang )
Luquita et al. Journal of Biomedical Science 2010, 17:8
/>The cost of publication in Journal of Biomedical Science
is bourne by the National Science Council, Taiwan.
Open Access
RESEARCH
© 2010 Luquita et al; licensee BioMed Central Ltd. This is an Open Access article distributed under the terms of the Creative Commons
Attribution License ( which permits unrestricted use, distribution, and reproduction in
any medium, provided the original work is properly cited.
Research
In vitro
and
ex vivo
effect of hyaluronic acid on
erythrocyte flow properties
A Luquita*
1
, L Urli
1
, MJ Svetaz
2
, AM Gennaro
3
, ME Giorgetti
1
, G Pistone
1
, R Volpintesta
4
, S Palatnik
4
and M Rasia
1
Abstract
Background: Hyaluronic acid (HA) is present in many tissues; its presence in serum may be related to certain
inflammatory conditions, tissue damage, sepsis, liver malfunction and some malignancies. In the present work, our
goal was to investigate the significance of hyaluronic acid effect on erythrocyte flow properties. Therefore we
performed in vitro experiments incubating red blood cells (RBCs) with several HA concentrations. Afterwards, in order
to corroborate the pathophysiological significance of the results obtained, we replicated the in vitro experiment with ex
vivo RBCs from diagnosed rheumatoid arthritis (RA) patients, a serum HA-increasing pathology.
Methods: Erythrocyte deformability (by filtration through nucleopore membranes) and erythrocyte aggregability (EA)
were tested on blood from healthy donors additioned with purified HA. EA was measured by transmitted light and
analyzed with a mathematical model yielding two parameters, the aggregation rate and the size of the aggregates.
Conformational changes of cytoskeleton proteins were estimated by electron paramagnetic resonance spectroscopy
(EPR).
Results: In vitro, erythrocytes treated with HA showed increased rigidity index (RI) and reduced aggregability, situation
strongly related to the rigidization of the membrane cytoskeleton triggered by HA, as shown by EPR results. Also, a
significant correlation (r: 0.77, p < 0.00001) was found between RI and serum HA in RA patients.
Conclusions: Our results lead us to postulate the hypothesis that HA interacts with the erythrocyte surface leading to
modifications in erythrocyte rheological and flow properties, both ex vivo and in vitro.
Background
Elevated seric hyaluronic acid (HA) is a feature of certain
inflammatory conditions, notably rheumatoid arthritis and
scleroderma, and also accompanies tissue damage, sepsis,
liver malfunction and some malignancies [1-8].
Additionally, the employment of HA is currently sug-
gested in the therapy of arthritis, arthrosis, psoriasis, and it
is also included in treatments with cosmetic products [9-
12].
Being HA a macromolecule present in plasma, it could
interact with the red blood cell (RBC) surface, as it happens
with albumin. In a previous work [13] we have demon-
strated that albumin adsorption impairs erythrocyte rheol-
ogy in a concentration-dependent fashion increasing the
erythrocyte rigidity index (RI). Such facts lead us to
hypothesize that the reduction in erythrocyte deformability
(RI increase) observed in serum HA-increasing pathologies,
could be due to HA interaction with RBC surface which
contributes to the impaired flow properties observed in
these pathologies [14,15].
We therefore conducted this study to investigate the sig-
nificance of serum HA effect on erythrocyte flow proper-
ties.
We performed in vitro experiments incubating RBCs
from healthy donors with several HA concentrations. After-
wards, in order to corroborate the obtained results, we
selected a serum HA-increasing pathology and replicated
the experiment ex vivo with RBCs from those patients. We
chose rheumatoid arthritis RA patients because in an earlier
paper we demonstrated a reduction in erythrocyte RI that is
in close correlation with the Disease Activity Score (DAS
28-4) index during the clinical remission of the process
[16].
* Correspondence:
1
Cátedra de Física Biológica, Facultad de Ciencias Médicas, Universidad
Nacional de Rosario, Santa Fe 3100, 2000 Rosario, Argentina
Luquita et al. Journal of Biomedical Science 2010, 17:8
/>Page 2 of 7
Methods
The Ethics Committee of the Facultad de Ciencias Médicas,
Universidad Nacional de Rosario, Argentina approved the
study protocol, and all participants signed an informed con-
sent according to the recommendations of the Declaration
of Helsinki [17].
Blood sample collection and laboratory assays
Blood samples of RA patients were obtained by venipunc-
ture and separated in 2 aliquots. One of them was collected
in tubes containing EDTA and assigned to determine hae-
matimetric indexes, plasmatic protein concentration and
rheological parameters. The other was collected in a dry
tube and centrifuged 5 min at 5000 RPM in order to obtain
serum for the serum concentration of HA.
a) Haematimetric indexes: Erythrocyte count was
assessed by a hæmocytometer and hæmoglobin by the
cyanmetahæmoglobin method. From these values, MCV
and MCHC were calculated.
b) Plasmatic immunoglobulin concentration: by radial
immunodiffusion.
c) Fibrinogen concentration: by commercial kinetic test
kit (Boehringer Mannheim, Germany).
d) HA assay: by an ELISA commercial test kit (CHUGAI
quantitative test Kit), using HABP (HA Binding Protein) as
capture molecule [18].
Haemorheological assays
a) Rigidity index (RI)
Whole blood from RA patients was centrifuged at 5000
RPM for 5 minutes, plasma and buffy coat were separated
and the erythrocytes were washed twice with PBS (0.12 M
NaCl, 0.03 M H
2
KPO
4
/HNa
2
PO
4
with 2 mg/ml glucose).
Washed RBCs were resuspended (10% hæmatocrit) in
PBS with bovine albumin (0.25%) (Sigma Chemical Co.,
St.Louis, MO, USA) in order to prevent erythrocyte aggre-
gation.
Erythrocyte filtration was performed in a computerized
instrument using the Reid et al. technique [19]. Briefly, a
10% suspension of washed erythrocytes was passed
through a polycarbonate filter, 5 μm pore size (Nucleopore
Corp. USA), using a negative filtration pressure of 10 cm
H
2
O. The flow time required for 1 ml of RBC suspension to
pass through the filter was measured. Results were
expressed as the rigidity index (RI) that is an estimation of
erythrocyte rigidity (inverse of erythrocyte deformability)
[20], defined as:
Where: Tb: time of passage of the cell suspension
through the filter; Ts: time of passage of an equal volume of
PBS; Htc: hæmatocrit (10%).
The erythrocyte deformability measurements are in
accordance to the International Committee for Standardiza-
tion in Haematology [21].
b) Erythrocyte aggregation
This parameter was measured in whole blood at native
hæmatocrit. An instrument [22] assembled as a model
designed by Tomita et al. [23] was used. In brief, it consists
of a densitometer head that detects light transmission
changes in whole blood during the aggregation process that
follows a disaggregating agitation [24].
The registered data were analyzed with a mathematical
model allowing us to determine two parameters: 2k
2
n
0
,
which stands for the initial rate of the process, and s
0
/n
0
,
which estimates aggregation intensity and average rouleaux
size at process completion.
c) Erythrocyte membrane fluidity
Erythrocyte membrane fluidity was estimated by electron
paramagnetic resonance spectroscopy (EPR) using liposol-
uble spin labels 5, 12 and 16- doxyl stearic acid (5-, 12-,
and 16-SASL, Sigma Chemical Co., St. Louis, MO, USA),
which sense the mobility of the acyl chains at different
depths in the lipid leaflet of the RBC membrane [25]. The
EPR spectra were obtained at 25 ± 1°C in a Bruker ER-200
spectrometer operating at X band (9800 MHz).
In the case of erythrocytes from RA patients, membrane
fluidity was assessed using the parallel component of the
nitrogen hyperfine tensor of 5-SASL (T
//
) as a representa-
tive parameter of lipid chain rigidity. Thus, increased T
//
values are indicative of decreased membrane fluidity [26].
In the case of cells incubated in vitro with HA, we evalu-
ated S
5
, S
12
and S
16
order parameters at different depths of
the lipid bilayer, from the spectra of 5, 12 or 16-SASL. As
in the previous case, increased S parameters indicate
decreased membrane fluidity.
HA purification
HA was purified from other acid mucopolysaccharides by
ecteola cellulose chromatography [27] and eluted with 0.05
N HCl. HA concentration in the eluate was colorimetrically
determined, through estimation of the glucuronic acid con-
tent, by using carbazole in sulphuric medium [28].
The elution solution was neutralized to pH 7.4 with 0.05
N NaOH
In vitro experiments
- Erythrocyte incubation in hyaluronic acid solutions and RI
determination
Blood samples were obtained from healthy adults by veni-
puncture and collected in tubes containing EDTA (1,146
mg/ml, Sigma Chemical Co., St.Louis, MO, USA) as anti-
coagulant. Each sample was fractioned in 5 aliquots (1 ml).
The first sample (control; n = 6) was additioned with 1 ml
of neutralized elution solution and the other ones with 1 ml
of purified HA in rising concentrations, yielding the follow-
RI Tb Ts Ts Htc=− ×()/()/100
Luquita et al. Journal of Biomedical Science 2010, 17:8
/>Page 3 of 7
ing final nominal concentrations (μg/ml): [HA
1
] = 50;
[HA
2
] = 87; [HA
3
] = 109; [HA
4
] = 190 (n = 6). After 30
min incubation at 37°C, serum HA concentration ([HA]s)
and erythrocyte RI were determined for each sample in a
similar way as for RA patients.
- Reversibility of HA-erythrocyte interaction
In order to test the reversibility of HA-erythrocyte interac-
tion, RI was determined again in erythrocytes of each sam-
ple after washing twice with PBS.
-Aggregability determination in erythrocytes incubated in HA
Blood samples were divided into two fractions; one of them
was added with purified HA to reach a final concentration
similar to that found in serum of RA patients, [HA] = 109
μg/ml (HA group; n = 15), and the other one was added
with the same volume of the the neutralized elution solution
(control group; n = 15). Both aliquots were incubated for 30
min at 37°C. Afterwards, serum concentration of HA was
determined and erythrocyte aggregability was measured as
described previously.
EPR spin label studies of the cytoskeleton proteins in
haemoglobin-free erythrocyte membranes In order to
obtain haemoglobin-free erythrocyte membranes, RBC's
from regular donors were subjected to hypotonic lysis in
sodium phosphate buffer 5 mM, pH 8 (for 30 min at 4°C)
and the pellet was thoroughly washed [29]. The membrane
samples were subdivided into two fractions. One of them
(HA group; n = 6) was added with purified HA to reach
concentrations similar to those found in serum of RA
patients, and the same volume of the elution solution was
added to the other fraction (control group; n = 6). Both
media had been previously neutralized to pH 7.4.
Both aliquots were incubated with the spin label 4-
maleimido-Tempo (Mal-Tempo, Sigma Chemical Co.,
St.Louis, MO, USA), at a concentration of 30-50 μg per mg
of protein, in the dark, at 4°C for 1 h.
The protein-specific spin-label Mal-Tempo is known to
bind covalently to cysteine sulfhydryl groups of cytoskele-
ton membrane proteins. W/S parameter, estimated from the
Mal-Tempo EPR spectrum [29], reflects two types of mem-
brane protein SH-binding sites for the spin label: strongly
and weakly immobilized sites (S and W sites, respectively).
Changes in the W/S parameter are indicative of conforma-
tional changes in the cytoskeleton proteins.
Ex vivo experiments
-RA Patients
One hundred female RA patients attending an outpatient
service at the Departamento de Reumatologia, Universidad
Nacional de Rosario, Argentina, were included in the pres-
ent study (mean age 48 ± 17 yr).
The patients were part of a follow-up study recruited
between the years 2000 and 2003 [13]. RA diagnosis was
established following the American College of Rheumatol-
ogy criteria [30-32]. Patients with cardiovascular or liver
disease, cancer, chronic infectious diseases, HIV positive
serology or diabetes mellitus as well as heavy smokers (>20
cigarettes/day) and patients who were under medication
that could alter hæmorheological blood properties, were
dismissed. The laboratory process has been described pre-
viously [13]. The clinic activity of the disease was evalu-
ated by means of the Disease Activity Score (DAS 28-4)
[33].
Controls
The control group consisted of 40 female non-smoker
healthy volunteers, age-matched (mean: 43 ± 12 yr).
Statistical analysis
The Kruskal-Wallis' test was performed considering vari-
ables; RI: RI after washes; afterwards Mann-Whitney's U
test was applied as post hoc one. Wilcoxon's test was per-
formed between RI and RI after washes for each group.
Data are presented as median and 95% confidence interval
(Figure 1).
Comparisons for aggregation parameters (2k
2
n
0
and s
0
n
0
)
between HA and control groups were performed by Stu-
dent's t-test for paired data. Values are presented as mean ±
standard deviation (Table 1).
Differences in cytoskeleton protein conformation and in
lipid chain ordering at different levels of the membrane
between control and HA treated erythrocytes, assesed by
EPR, were analized using Wilcoxon test for paired data.
Results are expressed as median and 95% confidence inter-
val (Table 2).
The correlation between RI and [HA]s in RA patients was
estimated using Pearson product-moment correlation coef-
ficient. Values were presented as mean ± standard deviation
(Table 3).
Pearson product-moment correlation coefficient was also
used to analyze the dependence of RI with [IgG], [IgM],
MHCM, T
//
and fibrinogen concentration in RA patients.
Results
In vitro experiments
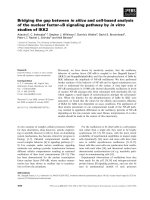
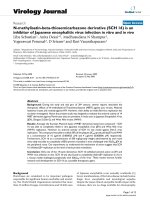
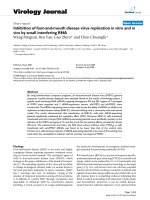
Figure 1 shows that the rigidity index is significantly
increased after incubation with HA at all the measured
[HA] range. There is a remarkable good correlation
between RI and [HA]s (r
s
: 0.996, p < 0.00001). Figure 1
also shows that after two washings, RI returns to control
values. Thus, it can be postulated that HA reduces erythro-
cyte deformability reversibly and in a concentration depen-
dent manner.
Regarding aggregation properties, the results presented in
Table 1 indicate a significant decrease in the parameter
2k
2
n
0
in erythrocytes incubated with HA, while no differ-
ences in the parameter s
0
/n
0
are observed. This means that
the presence of HA in the incubation medium diminishes
Luquita et al. Journal of Biomedical Science 2010, 17:8
/>Page 4 of 7
the erythrocyte aggregation rate, without significantly mod-
ifying the size of the aggregates.
Table 2 shows that the order parameters S, calculated
from the EPR spectra of liposoluble spin labels, do not
exhibit significant differences between HA group and con-
trol group, indicating that the fluidity of the lipid bilayer is
not altered as a consequence of the presence of HA. Con-
versely, the W/S parameter, calculated from the spectra of
Mal-Tempo, was significantly diminished in the HA group.
This suggests that incubation with HA introduces changes
in the conformation of the cytoskeletal protein spectrin.
Figure 1 Rigidity Index (RI) of erythrocytes incubated in vitro with variable HA concentrations, and reversibility of HA effect. In vitro effect of
several.hyaluronic acid (HA) concentrations on rigidity index (RI). Each sample was fractioned in 5 aliquots (1 ml). The first sample (control; n = 6) was
additioned with 1 ml of neutralized elution solution and the other ones with 1 ml of purified HA in raising concentrations, yielding the following final
nominal concentrations (μg/ml): [HA
1
] = 50; [HA
2
] = 87; [HA
3
] = 109; [HA
4
] = 190 (n = 6). As can be seen, after two washings, RI returns to control values.
Data: median, C.I.
95%
: confidence interval. (n = 6). RI: Kruskal Wallis' test: H = 27.87; p < 0.0001. Post hoc tests were performed with Mann-Whitney's U
between groups, p < 0.05. RI after wash: Kruskal Wallis' test n.s.
0 50 100 150 200
0
5
10
15
20
25
30
35
RBC incubated in HA
RBC washed after incubation
Rigidity Index
[HA] (Pg/ml)
Table 1: Erythrocyte aggregability in the presence of HA and its control (n = 15)
2k2n0 s0/n0
Control 1.98 ± 0.14 1.867 ± 0.015
HA Group 1.29** ± 0.21 1.866 ± 0.004
Data: mean ± standard deviation.
Degree of significance of the difference between groups: ** p < 0.01
Luquita et al. Journal of Biomedical Science 2010, 17:8
/>Page 5 of 7
Ex vivo experiments
Previous analysis [16] performed on erythrocytes from
active RA patients (DAS 28-4 > 2,6) showed a good corre-
lation between disease activity and serum HA concentration
[HA]s (Pearson product-moment correlation coefficient (r)
DAS 28-4 vs. [HA]s: 0.87, p < 0.0001). Table 3 shows that
erythrocytes from the active RA patients have a rigidity
index significantly higher than those of the control group,
together with a significantly increased [HA]s.
Subsequent correlation analyses were performed between
erythrocyte RI and intrinsic and extrinsic parameters. It was
found that RI has a significant correlation with [HA]s (r:
0.77 p < 0.00001), while it does not correlate either with
lipid bilayer rigidity (T
//
) or with internal viscosity (evalu-
ated through MCHC). Also, there was no significant corre-
lation between RI and plasma proteins, namely, IgG (r:
0.32, p > 0.05) and IgM (r: 0.33, p > 0.05), and fibrinogen
(r: 0.12, p > 0.05), which might be adsorbed on cell surface
modifying the membrane rheology.
Discussion
Erythrocyte rigidity is a determining factor concerning flow
resistance, especially in microcirculation, where RBCs
must pass through capillaries of a diameter lower than the
cells. Even in macrocirculation, rigidity is a factor of flow
resistance, thus contributing to the hiperviscosity syn-
drome.
HA is a glycosaminoglycan a high molecular weight
polysaccharide that, similarly to albumin, could interact
with the erythrocyte surface. Our hypothesis was that this
interaction could lead, in the same way that albumin does,
to a reduction in the flexibility of the membrane. The verifi-
cation of this hypothesis demanded to establish a correla-
tion between RI values and HA medium concentration.
When blood from healthy donors was incubated with sev-
eral HA concentrations it was corroborated that HA caused
a significant decrease in erythrocyte deformability (increase
in RI) in a concentration-dependent manner and reversibly-
- this effect was reverted by washing the treated cells.
In an earlier paper [16] we have demonstrated that RBC's
from RA patients presented a considerably increased RI. In
the same paper [16] it was corroborated that RI is a reliable
indicator for RA activity, given its significant correlation
with DAS 28-4 score.
Experiments performed on blood from RA patients in dif-
ferent levels of activity of the disease showed that HA was
the only plasma factor that significantly affected deform-
ability; moreover, the expected correlation between RI val-
ues and [HA]s was found (r: 0.77, p < 0.00001). The
discrepancy of RI values in erythrocytes of RA patients
Table 2: HA effect on cytoskeleton protein conformation and on lipid chain order at different levels
[HA] μg/ml W/S
S5 S12 S16
Control < 10 3.20
(3.10 3.30)
0.693
(0.685 0.703)
0.525
(0.524 0.527)
0.230
(0.228 0.230)
HA Group 103
(100-105)
2.65*
(2.60 2.70)
0.690
(0.677 0.707)
0.521
(0.520 0.524)
0.229
(0.225 0.233)
W/S: ratio of the spectral amplitudes of Mal-Tempo attached to strongly and weakly immobilized sulfhydryl groups.
S
5
, S
12
and S
16
: 5, 12 or 16- doxyl stearic acid spin labels.
Data: median, C.I.
95%
: confidence interval. (n = 6).
Degree of significance of the difference between groups: * p < 0.05
Table 3: Rigidity index and hyaluronic acid concentration in patients with active Rheumatoid Arthritis and their controls
[HA]s (μg/ml) RI
Controls (n = 40) 20.0 ± 9.0 7.0 ± 0.8
RA Patients (n = 100) 155.80 ± 44.0 11.0 ± 1.3
P < 0.00001 < 0.001
[HA]s: serum concentration of hyaluronic acid; RI: rigidity index; RA: rheumatoid arthritis.
Luquita et al. Journal of Biomedical Science 2010, 17:8
/>Page 6 of 7
(Table 3) with those of erythrocytes incubated with similar
HA levels in the in vitro experiment (Figure 1) should be
attributed to the presence in plasma of pathology dependent
factors affecting the erythrocyte rheology.
One of the techniques classically employed in RA diag-
nosis is erythrocyte sedimentation rate (ESR). This value
estimates mainly the rise in erythrocyte aggregation. Roule-
aux formation depends on medium and cell factors. Conse-
quently, its increase may be explained by the rise in
fibrinogen and/or globulin concentration and/or to the mod-
ification of the erythrocyte surface properties.
In our in vitro experiments, it was observed that HA-
treated RBCs showed a lower aggregation rate (Table 1),
i.e., a lower tendency to form rouleaux in comparison to
controls. This fact implies that the increased ESR in blood
from RA patients could only be attributed to modifications
in plasma proteins and not to cell factors [33].
It has been proved that albumin the smallest and most
important plasma protein is adsorbed on the erythrocyte
surface [13] and, unlike globulins and fibrinogen, hinders
the aggregation process. The corroboration that HA pre-
sented a similar behaviour to that of albumin constitutes a
further support for the claimed hypothesis.
EPR spectroscopy allowed us to investigate the effects
caused by the in vitro interaction of HA with RBC mem-
brane. As shown in Table 2, order parameters did not
change significantly, indicating that the fluidity of the lipid
bilayer was not altered as a consequence of HA incubation.
On the contrary, the parameter W/S, calculated from the
spectrum of a protein spin label, revealed that HA produces
alterations in the spectrin structure of the membrane
cytoskeleton increasing the amount of strongly immobi-
lized sites. This result suggests that the increase in erythro-
cyte rigidity is related to a stiffening of the cytoskeleton.
However, as HA only interacts with the outer erythrocyte
surface, we postulate that HA interaction results in a protein
organizational perturbation that is translated to spectrin in
the inner membrane surface.
Conclusions
Our experiments lead us to accept the hypothesis that HA
interacts with the erythrocyte surface, giving place to modi-
fications in erythrocyte rheological and flow properties.
Considering that HA is increased in inflammatory pro-
cesses and other malignancies, and that it is employed in
pharmacologic and cosmetic treatments, in all these cases
we claim that the effect of HA upon erythrocytes and thus
on circulatory function should not be disregarded; in fact,
special attention should be paid to this matter.
Abbreviations
RA: rheumatoid arthritis; HA: hyaluronic acid; RI: rigidity index; DAS: Disease
Activity Score; HIV: human immunodeficiency virus; EDTA: ethylenediaminetet-
raacetic acid; ESR: erythrocyte sedimentation rate; RBC: red blood cell; PBS:
phosphate buffered saline; MCV: mean corpuscular volume; MCHC: mean cor-
puscular hæmoglobin concentration; EPR: electron paramagnetic resonance
spectroscopy; SH: sulfhydryl groups; [HA]s: serum concentration of hyaluronic
acid; T
//
: nitrogen hyperfine tensor; S
5
, S
12
and S
16
: EPR order parameters deter-
mined using 5, 12 or 16- doxyl stearic acid spin labels.
Competing interests
The authors declare that they have no competing interests.
Authors' contributions
AL: acquisition, analysis and interpretation of data of haemorheological assays
in RA patients and HA purification by ecteola cellulose chromatography. Also
involved in drafting the manuscript, revising it critically and in giving final
approval of the version to be published. LU: acquisition, analysis and interpre-
tation of data of laboratory assays in RA patients. MJS: Blood sample collection
in RA patients and HA assay by an ELISA commercial test kit. AMG: acquisition,
analysis and interpretation of data of erythrocyte membrane fluidity estimated
by electron paramagnetic resonance spectroscopy (EPR). MEG: acquisition,
analysis and interpretation of data of erythrocyte aggregation of the in vitro
experiments. GP: acquisition, analysis and interpretation of data of erythrocyte
deformability of the in vitro experiments. RV and SP: protocol design and
obtention of the consent de RA patients. Determiantion of the clinic activity of
the disease, evaluated by means of the Disease Activity Score (DAS 28-4). MR:
involved in drafting the manuscript and revising it critically, and giving final
approval of the version to be published. All authors read and approved the
final manuscript.
Acknowledgements
We are grateful to Dr. Fumiaki Tacahashi, and Dr. Adriana Dusso for the dona-
tion of the ELISA commercial test kit ("CHUGAI" quantitative test Kit). To Dr.
Maria del Carmen Fernández and Dr. Digna Caferra for the technical support in
the Hyaluronic acid (HA) purification, to Juan Carlos Calvo for his suggestions
on the work topic and to M. Eugenia Mangialavori for her collaboration in the
translation.
Author Details
1
Cátedra de Física Biológica, Facultad de Ciencias Médicas, Universidad
Nacional de Rosario, Santa Fe 3100, 2000 Rosario, Argentina,
2
Sección
Inmunidad Celular, Department of Bioquímica Clínica, Universidad Nacional de
Rosario, Facultad de Cs. Bioquímicas y Farmacéuticas, Suipacha 531, 2000
Rosario, Argentina,
3
Facultad de Bioquímica y Ciencias Biológicas, Universidad
Nacional del Litoral (UNL) and INTEC (CONICET-UNL), Güemes 3450, 3000 Santa
Fe, Argentina and
4
Área Reumatología, Cátedra de Reumatología, Facultad de
Ciencias Médicas, Universidad Nacional de Rosario, Santa Fe 3100, 2000
Rosario, Argentina
References
1. Berg S, Brodin B, Hesselvik F, Laurent TC, Maller R: Elevated levels of
plasma hyaluronan in septicemia. Scand J Clin Invest 1988, 48:727-32.
2. Cooper EH, Forbes MA: Serum hyaluronic acid levels in cancer. Br J
Cancer 1988, 58:668-669.
3. Engstram-Laurent A, Hallgren R: Circulating hyaluronate in rheumatoid
arthritis: relationship to inflammatory activity and the effect of
corticosteroid therapy. Ann Rheum Dis 1985, 44:83-8.
4. Kovacs IB, Sowemimo-Coker SO, Kirby JDT, Turner P: Altered behaviour of
erythrocytes in scleroderma. Clin Sci (Lond) 1983, 65(Suppl 5):515-9.
5. Majeed M, McQueen F, Yeoman S, McLean L: Relationship between
serum hyaluronic acid level and disease activity in early rheumatoid
arthritis. Ann Rheum Dis 2004, 63:1166-8.
6. Ninomiya T, Yoon S, Hayashi Y, Sugano M, Kumon Y, Seo Y, Shimizu K,
Kasuga M: Clinical significance of serum hyaluronic acid as a fibrosis
marker in chronic hepatitis C patients treated with interferon-α:
Histological evaluation by a modified histological activity index
scoring system. J Gastroenterol Hepatol 1998, 13(Suppl 1):68-74.
7. Turan Y, Bal S, Gurgan A, Topac H, Koseoglu M: Serum hyaluronan levels
in patients with knee osteoarthritis. Clin Rheum 2007, 26(Suppl
8):1293-1298.
8. Wilkinson CR, Bower LM, Warren C: The relationship between
hyaluronidase activity and hyaluronic acid concentration in sera from
Received: 10 November 2009 Accepted: 12 February 2010
Published: 12 February 2010
This article is available from: 2010 Luquita et al; licensee BioMed Central Ltd. This is an Open Access article distributed under the terms of the Creative Commons Attribution License ( which permits unrestricted use, distribution, and reproduction in any medium, provided the original work is properly cited.Journa l of Biome dical Scie nce 2010, 17:8
Luquita et al. Journal of Biomedical Science 2010, 17:8
/>Page 7 of 7
normal controls and from patients with disseminated neoplasm. Clin
Chim Acta 1996, 256:165-173.
9. Rosenthal MA, Gibbs P, Brown TJ, Wong S, Uren S, Ellis A, Li L, Heldin P, Fox
RM: Fox Phase I and Pharmacokinetic Evaluation of Intravenous
Hyaluronic Acid in Combination with Doxorubicin or 5-Fluorouracil.
Chemotherapy 2005, 51:132-141.
10. Necas J, Bartosikova L, Brauner P, Kolar J: Hyaluronic acid (hyaluronan): a
review. Vet Med 2008, 53(Suppl 8):397-411.
11. Pons-Guiraud A: Hyaluronic Acid: administration & dosage. Ann
Dermatol Venereol 2008, 135(Suppl 1):1S27-34.
12. Zhang L, Underhill CB, Chen L: Hyaluronan on the Surface of Tumor Cells
Is Correlated with Metastatic Behavior. Cancer Research 1995,
55:428-433.
13. Luquita A, Gennaro AM, Rasia M: Influence of adsorbed plasmatic
proteins on erythrocyte rheological properties: in vitro and ex vivo
studies. Pflugers Arch 2001, 443:78-83.
14. Baskurt OK, Gelmont D, Meiselman HJ: Red Blood Cell Deformability in
Sepsis. Am J Respir Crit Care Med 1998, 157(Suppl 2):421-427.
15. Horii K, Kubo S, Hirohashi K, Kinoshita H: World Changes in Erythrocyte
Deformability after Liver Resection for Hepatocellular Carcinoma
Associated with Chronic Liver Disease. World J Surg 1999, 23(Suppl
1):85-90.
16. Luquita A, Urli L, Dominighini A, Svetaz MJ, Gennaro AM, R Volpintesta,
Palatnik S, Rasia M: Hæmorheological Variables as a Rheumatoid
Arthritis activity indicator. Clin Hemorheol Microcir 2004, 30:9-17.
17. The International Response to Helsinki VI - The WMA's Declaration of Helsinki
on Ethical Principles for Medical Research Involving Human Subjects, as
adopted by the 52nd WMA General Assembly, Edinburgh, October 2000 .
18. Golberg RL: Enzime-linked inmunosorbent assay for hyaluronate using
cartilage proteglycan and antybody to keratan sulphate. Analyt
Biochem 1988, 174:448-458.
19. Reid HL, Barnes AJ, Lock PJ, Dormandy JA, Dormandy TL: A sample
method for measuring erythrocyte deformability. J Clin Pathol 1976,
29:855-8.
20. Jones JG, Adams RA, Evans SA: Bulk filtration through micropore
membranes for analysing blood cell rheology in clinical research. Clin
Hemorheol 1994, 14:149-69.
21. International Committee for Standardization in Haematology: Expert
panel on blood rheology. Clin Hemorheol 1986, 6:439-52.
22. Bertoluzzo SM, Bollini A, Rasia M, Raynal A: Kinetic model for erythrocyte
aggregation. Blood Cells Mol Dis 1999, 25:338-48.
23. Tomita M, Gotoh F, Tanahashi N, Turcani P: Whole blood red blood cell
aggregometer for human and feline blood. Am J Physiol 1986,
251:H1205-10.
24. Brooks DE, Greig RG, Janzen J: Mechanisms of erythrocyte aggregation.
In Erythrocyte Mechanics and Blood Flow Edited by: Cokelet GR, Meiselman
HJ, Brook DE. New York; Alan R. Liss Inc; 1980:119-40.
25. Campbell ID, Dwek DA: Biological Spectroscopy Menlo Park, CA: Benjamin/
Cummings; 1984.
26. Cassera MB, Silber AM, Gennaro AM: Differential effects of cholesterol on
acyl chain order in erythrocyte membranes as a function of depth from
the surface. An electron paramagnetic resonance (EPR) spin label
study. Biophys Chem 2002, 99:117-27.
27. Greiling H, Herbertz T, Stuhlsatz HW: Chromatographische
Untersuchungen über die mucopolysaccharidverteilung mi hyalinen
Knorpel. Physiol Chem 1964, 336:149-62.
28. Greiling H: Hyaluronic acid. In Methods of enzymatic analysis Edited by:
Bergmeyer HU. New York: Academic Press; 1974:1158-64.
29. Fung LWM, Johnson M: Multiple motions of the spectrin-actin complex
in the saturation transfer EPR time domain. J Magn Reson 1983,
51:233-244.
30. Arnett FC, Edworthy SM, Bloch DA, McShane DJ, Fries JF, Cooper NS,
Healey LA, Kaplan SR, Liang MH, Luthra HS: The American Rheumatism
Association 1987 revised criteria for the classification of rheumatoid
arthritis. Arthritis Rheum 1988, 31:315-324.
31. Harrison BJ, Symmons DPM, Barrett EM, Silman AJ: The performance of
the 1987 ARA classification criteria for rheumatoid arthritis in a
population based cohort of patients with early inflammatory arthritis.
J Rheumatol 1998, 25:2324-2330.
32. Van der Heijde DM, Jacobs JW: The original "DAS" and the "DAS28" are
not interchangeable. Arthritis Rheum 1998, 41:942-945.
33. Luquita A, Urli L, Svetaz MJ, Gennaro AM, Volpintesta R, Palatnik S, Rasia M:
Erythrocyte aggregation in rheumatoid arthritis: cell and plasma
factor's role. Clin Hemorheol Microcirc 2009, 41:49-56.
doi: 10.1186/1423-0127-17-8
Cite this article as: Luquita et al., In vitro and ex vivo effect of hyaluronic acid
on erythrocyte flow properties Journal of Biomedical Science 2010, 17:8