Homo-binding character of LMO2 isoforms and their both synergic and antagonistic functions in regulating hematopoietic-related target genes potx
Bạn đang xem bản rút gọn của tài liệu. Xem và tải ngay bản đầy đủ của tài liệu tại đây (1.51 MB, 10 trang )
Sun et al. Journal of Biomedical Science 2010, 17:22
/>The cost of publication in Journal of Biomedical Science
is bourne by the National Science Council, Taiwan.
Open Access
RESEARCH
© 2010 Sun et al; licensee BioMed Central Ltd. This is an Open Access article distributed under the terms of the Creative Commons At-
tribution License ( which permits unrestricted use, distribution, and reproduction in any
medium, provided the original work is properly cited.
Research
Homo-binding character of LMO2 isoforms and
their both synergic and antagonistic functions in
regulating hematopoietic-related target genes
Wei Sun, Wen-Wen Shen, Shuang Yang, Fen Hu, Yang Gao, Yu-Huan Qiao and Tian-Hui Zhu*
Abstract
Background: The human lmo2 gene plays important roles in hematopoiesis and is associated with acute T
lymphocyte leukemia. The gene encodes two protein isoforms, a longer form LMO2-L and a shorter form LMO2-S. Both
isoforms function as bridge molecules to assemble their partners together to regulate their target genes. A typical
LMO2 binding site consists of two elements, a GATA site and an E-box, with an interval of 9~12 bp.
Methods: In this study, the combination of MBP pulldown assay and mammalian two hybrid assay were used to
confirm the homo-binding character of LMO2-L/-S isoforms. Luciferase reporter assay and Real-time PCR assay were
used to detect expression levels and relative promoter activities of LMO2-L/-S isoforms. Co-transfection and Luciferase
reporter assay were used to reveal the detailed regulatory pattern of LMO2-L/-S isoforms on their targets.
Results: Herein we report the homo-interaction character of LMO2-L and LMO2-S and their major difference in
manner of regulating their target genes. Our results showed that LMO2-L and LMO2-S could only bind to themselves
but not each other. It was also demonstrated that LMO2-L could either positively or negatively regulate the
transcription of its different target genes, depending on the arrangement and strand location of the two elements
GATA site and E-box, LMO2-S, however, performed constitutively transcriptional inhibiting function on all target genes.
Conclusion: These results suggest that LMO2 isoforms have independent functions while there is no interaction
between each other and they could play synergetic or antagonistic roles precisely in regulating their different genes
involved in normal and aberrant hematopoiesis.
Background
LMO2 is a pivotal factor in promoting embryonic
hematopoiesis as well as angiogenesis[1,2]. Lmo2 null
mutation in mice leads to failure of yolk sac erythropoie-
sis and embryonic lethality around E10.5[1]. LMO2 also
correlates to the onset of T cell leukemia[3-5]. The
human lmo2 gene was firstly cloned from an acute T lym-
phocyte leukemia (T-ALL) patient with (11;14)(p13;q11)
translocation[6], and its aberrant expression could be
detected in a considerable percentage of T-ALLs[5]. The
oncogenic property of LMO2 was also confirmed in
transgenic mouse models[7] and in X-SCID patients
treated with retrovirus-mediated gene therapy, in which
T-ALL emerged due to the insertion of retroviral
sequence that incurs aberrant expression of LMO2 [8].
Early studies showed that lmo2 gene had two tran-
scripts Lmo2-a and Lmo2-b with distinct promoters, but
both of them encode a same product LMO2-L[9]. Our
group later cloned a new transcript from human adult
kidney, termed Lmo2-c (Fig. 1A)[10]. Lmo2-c has the pro-
moter of its own and encodes a shorter isoform, termed
LMO2-S, which has 14 amino acids missed in the N-ter-
minal region compared to LMO2-L (Fig. 1B).
Both LMO2-L and -S are transcriptional regulators, but
interestingly, they have no direct DNA binding ability.
They function as bridge molecules to assemble their part-
ners, including LDB1, GATA1, TAL1 and E47, together to
form a complex that that recognizes and binds to specific
DNA sequences of the target genes. The specific DNA
sequences of LMO2 binding site consist of a GATA site
* Correspondence:
1
Laboratory of Molecular Genetics, College of Medicine, Nankai University,
Tianjin 300071, PR China
Sun et al. Journal of Biomedical Science 2010, 17:22
/>Page 2 of 10
and an E-box, with 9~12 bp in between[11,12]. Till now
several LMO2 targets have been identified, including c-
kit[13], GPA[14] and miR-142[15] in hematopoietic cells
and VE-Cadherin[16] in vessel endothelial cells. It is also
suggested that the binding site in T-ALL cells could be
double E-boxes[17]. Both LMO2-L and LMO2-S can
interact with all these partners including LDB1, GATA1,
TAL1 and E47 in a similar manner, but the binding affin-
ity can vary for LDB1[18]. It remains uncharacterized in
detail regarding how the two LMO2 isoforms function
together in a given cell type. In this study, we report that
both LMO2-L and LMO2-S had only homo-interaction
patterns, and they could have either synergic or antago-
nistic transcriptional regulatory roles depending on their
target genes.
Methods
Plasmid construct
The promoter region of Lmo2-a, -b and -c transcripts
termed P1, P2 and P3 were cloned from normal human
genome and inserted into pGL4-basic vector. The artifi-
cial reporters were generated as follows: DNA sequences
containing the typical LMO2 binding sites, the E-box and
GATA site in different arrangements were synthesized
(Fig. 2B), the sequences were: E-box-GATA+: 5'-GATC-
TACAGGTGCTATGCGGGGATAGA-3';
E-box-GATA-: 3'-ATGTCCACGATACGC-
CCCTATCTCTAG-5;
GATA-E-box+: 5'-GATCTGGATAGCTATGCGA-
CAGGTGA-3';
GATA-E-box-: 3'-ACCTATCGATACGCT GTCCA-
CTCTAG-5;
E-box-E-box+: 5'-GATCTACATCTGCTATGCGGA-
CAGATGA-3';
E-box-E-box-: 3'-ATGTAGACGATACGCCTGTC-
TACTCTAG-5.
DNA fragments in pairs were annealed in vitro using
T4 DNA ligase buffer (Takara, Dalian, China). The
annealing temperature fell in a gradient of 1°C/min from
95°C to 25°C. Then the double-strand fragments were
inserted into the BglII site just ahead of the basic SV40
promoter in the pGL3-promoter vector.
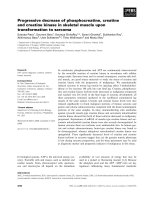
Figure 1 Expression of LMO2-L and -S isoform and activities of their promoters in haematopoietic and non-haematopoietic cells. (A) Sketch
map of three transcripts of LMO2. Lmo2-a/b which have 6 and 4 exons respectively encode LMO2-L, and Lmo2-c that has 2 exons encodes LMO2-S.
The 3 black bars represent 3 promoters P1, P2 and P3, the regions used for reporter assays were marked below. (B) Difference in protein sequences
between LMO2-L/S. The cartoon shows the difference in N-terminal regions and the different amino-acids are shown beneath. (C) Real-time PCR de-
tection of LMO2-L/S expression in cell lines. The bars represented the ratio between relative expression levels of LMO2-L/S and GAPDH, the data
showed the means of three separate experiments. (D) Relative activity of P1, P2 and P3. pGL4-basic was used as control and its activity was marked as
1. All the data came from at least three independent experiments and were evaluated by student's t-test, p < 0.05.
Sun et al. Journal of Biomedical Science 2010, 17:22
/>Page 3 of 10
Cell culture and transfection
K562, U937, HL-60, Jurkat, MOLT-4 and Raji cells were
cultured in RPMI1640, HEK293 cells were cultured in
DMEM, and both media were supplemented with 10%
fetal bovine serum (GIBCO BRL, Grand Island, NY,
USA), 100 μg/ml penicillin and 100 μg/ml streptomycin.
Two millions of K562 cells were transfected by electropo-
ration with a total of 10 μg plasmid DNA and electropo-
ration was performed with 960 μF and 210 V in a Bio-Rad
gene-pulser
®
. HEK293 cells were plated at 1 × 10
5
cells/
well in 24-well plates and transfected by
Lipofectamine2000 following the manufacturer's instruc-
tion (Invitrogen, Austin, TX, USA).
Induced expression of MBP-LMO2-L/-S recombinant
protein and maltose affinity chromatography
DH5α strains with plasmid pMAL-c2x/pMAL-LMO2-L/
-S were activated and cultured in 1 L flask, IPTG (at a
final concentration of 0.1 mmol/L) was added at a culture
density of OD 0.6-0.8 to induce the expression of recom-
binant protein for 4 hr. Bacteria cells were harvested and
re-suspended in STE buffer (50 mmol/L Tris-HCl pH 7.9,
0.5 mmol/L EDTA, 50 mmol/L NaCl, 5%Glycerol) in a
ratio of 1: 10 with the original media. Bacteria protein
was extracted by sonication (250 W, 10 s, 5 times). 10 mg
total bacteria protein of each sample was firstly incubated
with 5 mL amylose-resin (New England Biolabs, Ipswich,
MA, USA) at 4°C for 2 hrs with rotation. Then the pro-
tein-resin mixture was filled in the 1 × 10 cm column
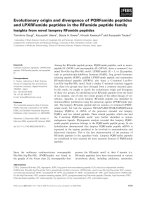
Figure 2 MBP-pulldown and mammalian two hybrid assay indicated homo-interaction character of LMO2-L and -S isoform. (A) Coomassie
blue R-250 staining of MBP-pulldown samples after SDS-PAGE. NC, amylose resin without recombinant protein and incubated with K562/Jurkat total
protein; MAL-β-galactase, sample of purified MAL-β-galactase incubated with K562/Jurkat total protein used as a control; MAL-LMO2-L/-S, sample of
purified MAL-LMO2-L/-S incubated with K562/Jurkat total protein. (B) Western blot analysis of relative samples corresponding to (A) using anti-LMO2
antibody. (C) Mammalian two hybrid assay of LMO2-L and LMO2-S. pACT, activation domain fusion protein expression plasmid; pBIND, GAL4 binding
domain fusion protein expression plasmid. +, cells transfected with such component; -, cells transfected without such component.
Sun et al. Journal of Biomedical Science 2010, 17:22
/>Page 4 of 10
(Phamacia), washed with 5 × volume Buffer A (20 mmol/
L Tris-HCl pH 7.9, 0.2 mol/L NaCl, 1 mmol/L EDTA) and
eluted by Buffer B (Buffer A with 20% maltose). Elutions
were dialyzed in 4°C for 1 hr with 3 times in Buffer C (20
mmol/L Tris-HCl pH 7.9, 0.1 mol/L NaCl, 1 mmol/L
CaCl
2
, 1 mmol/L ZnSO
4
), concentrated by air-dry and
run SDS-PAGE.
Factor Xa cleavage of MBP-LMO2-L/-S recombinant protein
Purified recombinant MBP-LMO2-L/-S proteins (1 mg
each) in Buffer C were added 5 μg Factor Xa (New Eng-
land Biolabs), respectively and incubated in 4°C for 72
hrs. Then samples were run SDS-PAGE or native PAGE.
MBP-pulldown assay
Total K562 or Jurkat proteins were extracted using
mRIPA lysis buffer (50 mmol/L Tris-HCl pH 7.5, 150
mmol/L NaCl, 1% Triton X-100, 0.5% DOC, 10 ug/mL
Aprotinin, 10 ug/mL Leupeptin, 1 mmol/L PMSF). 0.3
mg of purified protein was firstly incubated with 1 mg
total K562/Jurkat protein at 4°C overnight. Then 100 μL
of amylose-resin (New England Biolabs) was added into
each sample and incubated at 4°C for 2 hrs with rotation.
Incubated resin of each sample was washed 3 times with
Buffer A. Then equal volume 2× SDS loading buffer was
added to the resin precipitate and the samples were heat-
denatured for 10 min. The samples were then run SDS-
PAGE, gel was stained by Coomassie blue R-250.
Western blot analysis
The same sample derived from MBP-pulldown assay was
used. After SDS-PAGE, proteins were transferred to a
nitrocellulose membrane, and detected using anti-LMO2
monoclonal antibody (Millipore, Billerica, MA, USA).
Immunostaining was detected using an enhanced chemi-
luminescence system (Amersham Pharmacia Biotech,
Buckinghamshire, UK).
RNA isolation and Real-time PCR
Total RNA was isolated from cells using Trizol reagent
(Invitrogen) and 0.5 μg of each sample was used for
cDNA synthesis by M-MLV (Promega, Madison, WI,
USA). Real-time PCR was performed by ABI PRISM 7000
(ABI, USA), using 1× Evagreen dye and ROX as passive
reference. The amplification parameters were: 95°C 3
min, followed by 95°C 30 s, 64°C 1 min, 40 cycles. Primers
used for detection are:
LMO2-L forward: 5'-CGAAAGGAAGAGCCTGGAC-
3';
LMO2-S forward: 5'-CGGTGCTGGTCTCACTCTG-
3';
LMO2-L/S reverse: 5'-TTCACCCGCATTGTCATCT-
3';
miR-142 forward: 5'-TCTTAGGAAGCCA-
CAAGGAG-3';
miR-142 reverse: 5'-TAAGGTGCTCACCTGTCACA-
3';
GPA forward: 5'-ATTGTCAGCAATTGTGAGCATA-
3';
GPA reverse: 5'-TGATCACTTGTCTCTGGATTTT-3';
c-kit forward: 5'-GTGAAGTGGATGGCACCTGA-3';
c-kit reverse: 5'-TTGATCCGCACAGAATGGTC-3'.
The relative gene expression levels were normalized by
housekeeping gene GAPDH.
Luciferase assay
The ratio of Luciferase reporter to Renilla was 9:1 in a
total of 10 μg for electroporation of K562 cells. For trans-
fection of HEK293 and C2C12 cells with Lipofectamine
2000, the ratio was 5:1 in a total of 2 μg, and 4 μl of Lipo-
fectamine 2000 were mixed for each well of 24-well plate.
In the experiments of co-transfection of both reporters
and trans-regulator vectors, each single trans-regulator
vector was mixed with the reporter in a ratio of 1:1 and
the ratio between Luciferase reporter and Renilla was 5:1.
The total plasmid was 2 μg, and 4 μl of Lipofectamine
2000 were mixed for each well of 24-well plate. In the
experiments of co-transfection with all members of
LMO2 complex, in which either LMO2-L or LMO2-S or
no LMO2 (LMO2-NULL) was involved, the ratio of
Ldb1:LMO2:TAL1:E47:GATA1:reporter was 2:2:1:1:1:1.
In the case of E-box-E-box, the ratio of
Ldb1:LMO2:TAL1:E47:reporter was 2:2:2:2:1, according
to the previously established models. The ratio between
Luciferase reporter and Renilla was 5:1. The total plasmid
was 2 μg, and 4 μl of Lipofectamine 2000 were mixed for
each well of 24-well plate. Cells were lysated 24 hrs after
transfection. Luciferase activity was measured using
Dual-Luciferase Reporter Assay Kit (Promega) and nor-
malized by Renilla luciferase activity, according to the
manufacturer's instruction.
Mammalian two hybrid assay
LMO2-L and -S coding sequence was cloned into pACT
and pBIND vector (Promega), respectively. The pACT-
LMO2-L/S, pBIND-LMO2-L/S and pG5luc reporter vec-
tor were co-transfected into HEK293 cells in a ratio of 1:
1: 1 by Lipofectamine 2000. Luciferase activity was mea-
sured using Dual-Luciferase Reporter Assay Kit (Pro-
mega) following the manufacturer's instruction 24 hrs
after transfection.
Results
Cell type-specific expression level and the promoter
activities of LMO2 isoforms
The mRNA expression level of LMO2-L (corresponding
to Lmo2-a/b) and LMO2-S (corresponding to Lmo2-c)
were firstly detected by real-time PCR in several
hematopoietic cell lines (Fig. 1C). In T lineage cells Jurkat
Sun et al. Journal of Biomedical Science 2010, 17:22
/>Page 5 of 10
and MOLT-4, there were almost neither LMO2-L nor
LMO2-S expression detected. In B lineage cell line Raji,
the expression level of LMO2-L was modest while
LMO2-S was hardly detectable. However, in all three
myeloid cell lines, U937, HL-60 and K562, the expression
of both LMO2-L and -S was apparent, with LMO2-S
always lower than LMO2-L.
Furthermore, the activity of LMO2-a, b and c promot-
ers, termed P1, P2 and P3, respectively, was measured by
their capability to drive luciferase expression in human
hematopoietic cell line K562, human non-hematopoietic
cell line HEK29,3 and non human cell line C2C12, respec-
tively (Fig. 1D). The promoter region from -3433 to +385
for P1 was cloned and a series of 5'- and 3'- truncated
forms were generated. Surprisingly, none of these frag-
ments showed any positive activity in any cell lines (data
not shown). P2 activity, however, was about 8 fold higher
than P3 in K562 cells. This well matched the real-time
PCR results that LMO2-L was expressed always at the
higher level than LMO2-S (Fig. 1C). In both HEK293 and
C2C12 cells, a basal level of both P2 and P3 activities was
observed, though P3 again appeared weaker than P2. This
result implicated that P2 and P3 have certain basal activi-
ties in mammalian cells and the two promoters are strin-
gently regulated in hematopoietic cells.
Homo-interaction character of LMO2 isoforms
The maltose-binding protein (MBP) tagged recombinant
LMO2-L/S fusion proteins, which can be expressed in E.
coli in soluble form were purified by maltose affinity
chromatography with amylose resin, SDS-PAGE showed
the MBP-LMO2 fusion proteins were in a high purity
(Fig. 3A). Purified MBP-LMO2-L or -S recombinant pro-
teins were then cleaved by Factor Xa according to the
peptide sequence between MBP and LMO2-L/-S. LMO2-
L/-S bands were visible on SDS-PAGE with Coomassie
blue staining (Fig. 3B) and both cleaved and fusion
LMO2-L/-S protein could be detected by Western blot
using anti-LMO2 antibody as arrows indicated (Fig. 3C).
In the MBP-pulldown assay, purified MBP-LMO2-L or
-S recombinant proteins were incubated with K562 or
Jurkat cell lysate overnight with rotation to enrich the
components that can bind with LMO2-L or -S, respec-
tively. Meanwhile, the resin bound with MBP or without
bacteria proteins were used as controls. After washing to
eliminate unbound component, the proteins bound to the
resin were denatured and run SDS-PAGE, the gel was
stained by Coomassie blue (Fig. 2A). The clear 60 kD
bands in the gel were the MBP-LMO2-L/S fusion pro-
teins, these were subsequently confirmed by Western blot
analysis (Fig. 2B). Notably, there were also two visible
bands in K562 lysate lanes as indicated by the arrows,
which were approximately 18 kD and 17 kD, respectively.
These two bands were quite likely to native LMO2-L and
-S in K562 cells no matter the molecular weight or the rel-
ative expression amount, and these were also confirmed
by Western blot subsequently (Fig. 2B). Interestingly, Jur-
kat cell was considered had no LMO2 expression, but in
this assay, after MBP-pulldown enrichment, trace LMO2-
L could also be detected while LMO2-S could not (Fig.
2B).
In the other hand, in mammalian two hybrid assay, in
cells that cotransfected with pACT-LMO2-L/pBIND-
LMO2-L vector or pACT-LMO2-S/pBIND-LMO2-S vec-
tor, the Luciferase activity was high, however, in other
cases (pACT-LMO2-L/pBIND-LMO2-S or pACT-
LMO2-S/pBIND-LMO2-L), the activity was low (Fig.
2C). This result indicated that the interaction between
two molecules of LMO2-L or two molecules of LMO2-S
were strong, and the interaction between each other was
weak.
Different regulation modes by LMO2-L and -S isoforms on
various promoter element arrangements of target genes
The LMO2 binding site consisting of a GATA site and an
E-box was asymmetric as it was not a palindrome for the
whole site. It has been notable that GATA1 and TAL1/
E47 bind to their relevant DNA binding sites as two arms
of the LMO2 complex, which make the whole complex
asymmetric. So far, three different arrangement forms of
LMO2 binding elements have been identified in the pro-
moter region of GPA, VE-Cadherin and miR-142, respec-
tively, as shown in Fig. 4A. In these genes, LMO2-L has
different regulatory functions, to inhibit the expression of
miR-142[15] and up-regulate the other two in the pres-
ence of its partner molecules [14,16]. Therefore, it could
be speculated that arrangements of LMO2 binding ele-
ments may affect the regulation pattern of the LMO2
complex on these targets. To confirm this, 5 different
artificial reporter constructs were made in this study (Fig.
4). These constructs were named based on the strand
localization of the sense sequence of the GATA site, as
the sequence of E-box was a palindrome (Fig. 4B).
In K562 cells that have endogenous expression of both
LMO2 isoforms and their co-factors, the activity of some
reporters was shown obviously different (Fig. 4D): the
activity of GATA-E-box- showed a dramatic decrease
compared to the control while the activity of E-box-
GATA+ showed a modest increase. However, in HEK293
cells which had been shown to have no expression of
GATA1, TAL1 or LMO2-L/S (data not shown), the activ-
ity of these reporter constructs was indistinctive except
the construct E-box-E-box, which was shown to be
slightly increased (Fig. 4E).
The regulatory roles of trans-regulators involved in
LMO2 complex as well as two LMO2 isoforms on differ-
ent cis-element reporters were further investigated. The
function of three members that could direct bind to
Sun et al. Journal of Biomedical Science 2010, 17:22
/>Page 6 of 10
DNA, including GATA1, TAL1 and E47 were firstly
tested (Fig. 5A). E47 could increase the activity of all 5
reporter constructs while TAL1 alone had little effect on
any form of the reporters. However, in the co-presence of
both E47 and TAL1, where the two molecules could form
heterodimers, the activity of all 5 reporters was decreased
down to 50% compared to the control. GATA1 alone had
no prominent effect on all 5 reporters. It was remarkable
that although these regulators, when alone or combined,
had regulatory effects on the reporter constructs, their
functions did not appear to be selective. The regulators
tested in this study exhibited same functions on all these
reporter constructs regardless the arrangement differ-
ence of LMO2 binding elements.
However, in the presence of LMO2-L, the performance
of each reporter changed significantly; the activity of
GATA-E-box+ and E-box-GATA+ was up-regulated
whilst the activity of GATA-E-box- was down-regulated
dramatically and no prominent activity change was
detected for E-box-GATA The activity of E-box-E-box
was also further inhibited in the presence of LMO2-L. In
the presence of LMO2-S, however, the performance of
these reporters appeared totally different. The LMO2-S
complex always exhibited inhibitory function on all the
reporter constructs, at least down to the level of the
LMO2-NULL group. Particularly, the activity of E-box-E-
box was further inhibited, lower than LMO2-NULL and
similar to LMO2-L (Fig. 5B).
Effects of LMO2-L and -S isoforms on regulating
endogenous expression of target gene in myeloid cells
GPA, c-kit and miR-142 were all known target genes of
the LMO2 complex and normally expressed in myeloid
cells. Following the transfection with LMO2-L/S or the
EGFP control, their endogenous expression level changes
in K562 cells were also detected by real-time PCR. While
the elecrtoporation efficiency reached about 80%, as
monitored and estimated by the observation of EGFP
expressing cells (Fig. 6A), transgenic expression of LMO2
L/S seemed to be predominate and the endogenous
expression level of the two LMO2 isoforms were very low
(Fig. 6B). Then the same cell samples were used to detect
the relative expression levels of the three target genes
GPA, c-kit and miR-142 (Fig. 6C). It was found that cells
over-expressing LMO2-L had miR-142 level down-regu-
lated and c-kit level increased, On the other hand, cells
over-expressing LMO2-S had all the three genes
decreased significantly.
Discussion
LMO2 is a crucial factor in hematopoiesis as well as onset
of T-ALL. It always functions as bridging molecule to
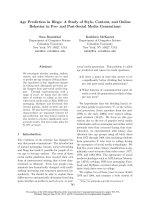
Figure 3 Maltose affinity chromatography purification of MBP-fusion proteins and Factor Xa cleavage. (A) Coomassie blue R-250 staining of
purified MBP-LMO2-L/-S/-β-galactase samples after SDS-PAGE. (B) Coomassie blue staining of Factor Xa cleaved MBP-LMO2-L/-S samples after SDS-
PAGE. (C) Western blot analysis of relative samples corresponding to (B) using anti-LMO2 antibody.
Sun et al. Journal of Biomedical Science 2010, 17:22
/>Page 7 of 10
assemble several trans-regulators to form a transcrip-
tional regulatory complex and determines the regulation
patterns on its targets. The homo-interaction character of
LMO2 isoforms indicated that trans-regulators could be
assembled by either LMO2-L or LMO2-S, but there
should be in principle no LMO2-L/LMO2-S heterodimer
in such complex. This seemed to facilitate different func-
tions performed by LMO2-L and LMO2-S without inter-
fere. Moreover, because the difference of amino-acid
sequence between LMO2-L and LMO2-S is in their N-
terminal, it could be speculated that the N-terminal of
LMO2-L/-S was involved in their homo-interaction and
was important for their functions in vivo.
There were several known targets of LMO2, including
early-progenitor genes c-kit[13], runx1[19], erythrocyte
specific gene GPA[14], p4.2[20] and T cell related gene
miR-142[15] and RALDH2[21]. Interestingly, although
these genes are regulated by the same LMO2 complex,
formed by either LMO2-L or LMO2-S together with
GATA, TAL1, and E47, some of them are shown to be
positively regulated while others negatively [13-15]. Fur-
ther analysis showed that the arrangement of the two key
elements, GATA site and E-box, in the promoter region
of these genes varies significantly. In this study, we dem-
onstrated that the functional responses of these arrange-
ments to the two LMO2 isoforms were indeed different.
LMO2-L could enhance the activity of promoters with
GATA-E-box+ or E-box-GATA+ while dramatically
inhibiting that of the GATA-E-box- or E-box-E-box
arrangement. However, LMO2-S exhibited the constitu-
tively inhibitory functions on all the arrangements.
Therefore, the eventual regulation outcomes by LMO2
isoforms on specific target genes in particular cell types
apparently depend on the element arrangements in the
promoter regions of these target genes as well as the rela-
tive expression level between the two LMO2 isforms.
Figure 4 Regulation activities of LMO2 isoforms on five element arrangements within a typical LMO2 binding site. (A) Sequences of promoter
regions of GPA, VE-Cadherin and miR-142. Letters bigger and in red were indicated as E-box, and in blue as GATA site. (B) Sketch map of the reporter
construction strategies. The two black boxes as well as their commentaries indicated 5 different arrangement forms of LMO2 binding site. (C) The ar-
tificial sequences used were shown in the table. Letters bigger and in red were indicated as E-box, and in blue as GATA site. (D) Relative activity of each
artificial reporter in K562 cells. (E) Relative activity of each artificial reporter in HEK293 cells. For both (D) and (E), the activity of pGL3-promoter was used
as control and marked as 1. All these experiments were performed at least 5 times independently, the graph showed the means and the standard
error of means of each result. All the data were evaluated by mean square test and Dunnett-t test, *Dunnett-t test, p < 0.05.
Sun et al. Journal of Biomedical Science 2010, 17:22
/>Page 8 of 10
C
Figure 5 Relative activities of reporter constructs regulated by LMO2 isoforms in HEK293 cells. (A) Relative activity of each artificial reporter
upon co-transfection of E47, TAL1, E47 and TAL1, or GATA1. (B) Relative promoter activity of each artificial reporter upon co-transfection of all other
members of LMO2-complex with LMO2-L, LMO2-S, or without LMO2 (LMO2-NULL). For both (A) and (B), the activity of pGL3-promoter was used as
control and marked as 1 in each group and all the others were shown as the ratio to it. All these experiments were performed at least 5 times inde-
pendently, the graph showed the means and the standard error of means of each result. All the data were evaluated by mean square test and Dunnett-
t test, *Dunnett-t test, p < 0.05.
Sun et al. Journal of Biomedical Science 2010, 17:22
/>Page 9 of 10
onsidering this precise regulation mechanism of LMO2-
L/S on their targets, the stringent regulation on the
expression of LMO2-L and LMO2-S would be crucial for
normal cellular processes including differentiation and
proliferation. In this respect, several previous studies
have reported that expression regulation of LMO2-L and
-S are indeed regulated by a series of mechanisms. There
exists a negative regulatory element in Lmo2-a promoter
(P1) [22] and the ETS-family members Fli1, Elf1, and Ets1
can up-regulate Lmo2-b promoter (P2) activity [23]. The
Lmo2-c promoter (P3), on the other hand, can be
enhanced by GATA1 and inhibited by another ETS-fam-
ily member PU.1 [18]. As demonstrated in this study,
LMO2-S was always expressed at lower levels compared
to LMO2-L in hematopoiesis-related cells and the basic
promoter activity of LMO2-L was about twice of LMO2-
S. It is therefore inferable that in different lineages and
different stages of hematopoiesis, the maintenance of the
relative expression levels and consequently the finely-
controlled functions of the two LMO2 isoforms may be
accomplished by these multiple factors.
The E-box-E-box form of the LMO2 binding site was
thought to be the aberrant LMO2 binding site particu-
larly in T-ALL [12,17]. One explanation for such a model
is that LMO2-L-TAL1 complex could inhibit E47-medi-
ated transactivation [24]. There have been several exam-
ples for this regulatory manner, such as the regulation on
artificial reporters of the Cd4, preTα, and Tcrα/δ genes
[24-26]. Our results here showed a general transcription
inhibiting manner for this case by both LMO2-L and
LMO2-S. It could further explain the pathologic function
of LMO2-L and -S in T-ALL as both of them could fur-
ther inhibit the expression of its aberrant targets bearing
such arrangement of LMO2 binding site. Although there
are both synergetic and antagonistic functions between
LMO2-L and -S, both of them could function as onco-
gene through the negative regulation on such genes in the
case of aberrant expression and thus block normal cell
differentiation and cause leukemia.
Figure 6 Differential regulation of LMO2-L and -S isoforms on endogenous expression of their target genes in K562 cells. (A) Transfection
efficiency was monitored by the observation of EGFP fluorescence and estimated more than 80%. (B) Total expression levels of LMO2-L or LMO2-S in
cells transfected with EGFP, LMO2-L or LMO2-S. (C) Relative expression levels of miR-142, GPA and c-kit in the same sample of (B). The bars in (B) and
(C) represented the ratio between the expression levels of LMO2-L/S and housekeeping gene GAPDH. The expression levels in the cells transfected
with EGFP were considered having no prominent changes and used as control. The data showed the means of three independent experiments. All
the data were evaluated by student's t-test, *student's t-test, p < 0.05.
Sun et al. Journal of Biomedical Science 2010, 17:22
/>Page 10 of 10
Conclusion
Taken together, our results showed that LMO2-L and
LMO2-S had only homo-binding character but not bind-
ing to each other. Meanwhile, LMO2-L could either posi-
tively or negatively regulate the transcription of its
different target genes, depending on the arrangement and
strand location of the two elements GATA site and E-box,
LMO2-S, however, performed constitutively transcrip-
tional inhibiting function on all target genes. These
results suggest that LMO2 isoforms have independent
functions while there is no interaction between each
other. They could play synergetic or antagonistic roles
precisely in regulating their different genes involved in
normal and aberrant hematopoiesis.
Competing interests
The authors declare that they have no competing interests.
Authors' contributions
WS: performed the experiments and wrote the paper. WWS: performed most
parts of the experiments. SY: help revising the paper. FH: performed parts of
the experiments. YG: help revising the paper. YHQ: guide for some experi-
ments. THZ: design the experiments and corresponding author.
Acknowledgements
This work was supported by National Nature Science Foundation of China
(No.30771054).
Author Details
Laboratory of Molecular Genetics, College of Medicine, Nankai University,
Tianjin 300071, PR China
References
1. Warren AJ, Colledge WH, Carlton MB, Evans MJ, Smith AJ, Rabbitts TH: The
oncogenic cysteine-rich LIM domain protein rbtn2 is essential for
erythroid development. Cell 1994, 78:45-57.
2. Yamada Y, Pannell R, Rabbitts TH: The oncogenic LIM-only transcription
factor Lmo2 regulates angiogenesis but not vasculogenesis. Proc Natl
Acad Sci USA 2000, 97:320-324.
3. Aplan PD, Lombardi DP, Reaman GH, Sather HN, Hammond GD, Kirsch IR:
Involvement of the putative hematopoietic transcription factor SCL in
T-cell acute lymphoblastic leukemia. Blood 1992, 79:1327-1333.
4. Ferrando AA, Neuberg DS, Staunton J, Loh ML, Huard C, Raimondi SC,
Behm FG, Pui CH, Downing JR, Gilliland DG, Lander ES, Golub TR, Look AT:
Gene expression signatures define novel oncogenic pathways in T cell
acute lymphoblastic leukemia. Cancer Cell 2002, 1:75-87.
5. Ferrando AA, Herblot S, Palomero T, Hansen M, Hoang T, Fox EA, Look AT:
Biallelic transcriptional activation of oncogenic transcription factors in
T-cell acute lymphoblastic leukemia. Blood 2004, 103:1909-1911.
6. Royer-Pokora B, Loos U, Ludwig WD: TTG-2 a new gene encoding a
cysteine-rich protein with LIM motif, is overexpressed in acute T-cell
leukaemia with the t(11;14)(p13;q11). Oncogene 1991, 6:1887-1893.
7. Larson RC, Fisch P, Larson TA, Lavenir I, Langford T, King G, Rabbitts TH: T
cell tumours with disparate phenotype in mice transgenic for Rbtn-2.
Oncogene 1994, 9:3675-3681.
8. Hacein-Bey-Abina S, Von Kalle C, Schmidt M, McCormack MP, Wulffraat N,
Leboulch P, Lim A, Osborne CS, Pawliuk R, Morillon E, Sorensen R, Forster
A, Fraser P, Cohen JI, de Saint Basile G, Alexander I, Wintergerst U,
Frebourg T, Aurias A, Stoppa-Lyonnet D, Romana S, Radford-Weiss I, Gross
F, Valensi F, Delabesse E, Macintyre E, Sigaux F, Soulier J, Leiva LE, Wissler
M, et al.: LMO2-associated clonal T cell proliferation in two patients
after gene therapy for SCID-X1. Science 2003, 302:415-419.
9. Royer-Pokora B, Rogers M, Zhu TH, Schneider S, Loos U, Bölitz U: the TTG-
2/RBTN-2 T cell oncogene encodes two alternative transcripts form
two promoter: the distal promoter is removed by most 11p13
translocations in acute T cell leukemias (T-ALL). Oncogene 1995,
10:1353-1360.
10. Zhu TH, Qin G, Royer-Pokora B: A novel post-transcriptional splicing
form of the acute T cell leukemia proto-oncogene Lmo2. Science in
China 2001, 44:561-569.
11. Wadman IA, Osada H, Grütz GG, Agulnick AD, Westphal H, Forster A,
Rabbitts TH: The LIM-only protein Lmo2 is a bridging molecule
assembling an erythroid, DNA-binding complex which includes the
TAL1, E47, GATA-1 and Ldb1/NLI proteins. EMBO 1997, 16:3145-3157.
12. Nam CH, Rabbitts TH: The Role of LMO2 in Development and in T Cell
Leukemia After Chromosomal Translocation or Retroviral Insertion.
Mol Ther 2006, 13:15-25.
13. Lécuyer E, Herblot S, Saint-Denis M, Martin R, Begley CG, Porcher C, Orkin
SH, Hoang T: The SCL complex regulates c-kit expression in
hematopoietic cells through functional interaction with Sp1. Blood
2002, 100:2430-2440.
14. Lahlil R, Lecuyer E, Herblot S, Hoang T: SCL assembles a multifactorial
complex that determines glycophorin A expression. Mol Cell Biol 2004,
24:1439-1452.
15. Yuan W, Sun W, Yang S, Du J, Zhai CL, Wang ZQ, Zhang J, Zhu TH: Down-
regulation of microRNA-142 by proto-oncogene LMO2 and its co-
factors. Leukemia 2008, 22:1067-1071.
16. Deleuze V, Chalhoub E, El-Hajj R, Dohet C, Le Clech M, Couraud PO, Huber
P, Mathieu D: TAL-1/SCL and Its Partners E47 and LMO2 Up-Regulate
VE-Cadherin Expression in Endothelial Cells. Mol Cell Biol 2007,
27:2687-2697.
17. McCormack MP, Rabbitts TH: Activation of the T-cell oncogene LMO2
after gene therapy for X-linked severe combined immunodeficiency. N
Engl J Med 2004, 350:913-921.
18. Wang Q, Zhang M, Wang X, Yuan W, Chen D, Royer-Pokora B, Zhu T: A
novel transcript of the LMO2 gene, LMO2-c, is regulated by GATA-1 and
PU.1 and encodes an antagonist of LMO2. Leukemia 2007,
21:1015-1025.
19. Nottingham WT, Jarratt A, Burgess M, Speck CL, Cheng JF, Prabhakar S,
Rubin EM, Li PS, Sloane-Stanley J, Kong-A-San J, de Bruijn MF: RUNX1-
mediated hematopoietic stem-cell emergence is controlled by a Gata/
Ets/SCL-regulated enhancer. Blood 2007, 110:4188-4197.
20. Xu Z, Huang S, Chang LS, Agulnick AD, Brandt SJ: Identification of a TAL1
target gene reveals a positive role for the LIM domain-binding protein
(Ldb1) in erythroid gene expression and differentiation. Mol Cell Biol
2003, 23:7585-7599.
21. Ono Y, Fukuhara N, Yoshie O: TAL1 and LIM-only proteins synergistically
induce retinaldehyde dehydrogenase 2 expression in T-cell acute
lymphoblastic leukemia by acting as cofactors for GATA3. Mol Cell Biol
1998, 18:6939-6950.
22. Hammond SM, Crable SC, Anderson KP: Negative regulatory elements
are present in the human LMO2 oncogene and may contribute to its
expression in leukemia. Leuk Res 2005, 29:89-97.
23. Landry JR, Kinston S, Knezevic K, Donaldson IJ, Green AR, Göttgens B: Fli1,
Elf1, and Ets1 regulate the proximal promoter of the LMO2 gene in
endothelial cells. Blood 2005, 106:2680-2687.
24. Herblot S, Steff AM, Hugo P, Aplan PD, Hoang T: SCL and LMO1 alter
thymocyte differentiation: inhibition of E2A-HEB function and pre-Ta
chain expression. Nat Immunol 2000, 1:138-144.
25. Tremblay M, Herblot S, Lecuyer E, Hoang T: Regulation of pT alpha gene
expression by a dosage of E2A, HEB, and SCL. J Biol Chem 2003,
278:12680-12687.
26. Bernard M, Delabesse E, Smit L, Millien C, Kirsch IR, Strominger JL,
Macintyre EA: Helix-loop-helix (E2-5, HEB, TAL1 and Id1) protein
interaction with the TCRalpha/delta enhancers. Int Immunol 1998,
10:1539-1549.
doi: 10.1186/1423-0127-17-22
Cite this article as: Sun et al., Homo-binding character of LMO2 isoforms
and their both synergic and antagonistic functions in regulating hematopoi-
etic-related target genes Journal of Biomedical Science 2010, 17:22
Received: 12 January 2010 Accepted: 27 March 2010
Published: 27 March 2010
This article is available from: 2010 Sun et al; licensee BioMed Central L td. This is an Open Access article distributed under the terms of the Creative Commons Attribution License ( ), which permits unrestricted use, distribution, and reproduction in any medium, provided the original work is properly cited.Journal of Biomedical Science 2010, 17:22