Báo cáo y học: "Antiretroviral treatment adherence and its determinants in Sub-Saharan Africa: a prospective study at Yaounde Central Hospital, Cameroon" pdf
Bạn đang xem bản rút gọn của tài liệu. Xem và tải ngay bản đầy đủ của tài liệu tại đây (703.75 KB, 12 trang )
BioMed Central
Page 1 of 12
(page number not for citation purposes)
AIDS Research and Therapy
Open Access
Research
Antiretroviral treatment adherence and its determinants in
Sub-Saharan Africa: a prospective study at Yaounde Central
Hospital, Cameroon
Mathieu Rougemont*
1
, Beat E Stoll
1
, Nadia Elia
1
and Peter Ngang
2
Address:
1
Institute of Social and Preventive Medicine, CMU, CH-1211 Geneva 4, Switzerland and
2
Department of Internal Medicine, CNPS
Hospital, Yaoundé, Cameroon
Email: Mathieu Rougemont* - ; Beat E Stoll - ; Nadia Elia - ;
Peter Ngang -
* Corresponding author
Abstract
Background: With African health-care systems facing exploding demand for HIV care, reliable methods
for assessing adherence and its influencing factors are needed to guide effective public-health measures.
This study evaluated individual patient characteristics determining antiretroviral treatment (ART)
adherence and the predictive values of different measures of adherence on virological treatment failure in
a cohort of patients in a routine-care setting in Cameroon.
Methods: Longitudinal study over 6-months following ART introduction, using patients questionnaires
and hospital and pharmacy records.
Results: At the end of the 6 months study period, 219 of 312 patients (70%) returned to the pharmacy
to refill their medication, 17% (51) were lost to follow-up, 9% (28) were dead and 4% (14) were
transferred to other care centres. Virological treatment failure at 6 months was experienced by 26
patients, representing 13% of patients with available viral load value. Pharmacy refill irregularity was the
most powerful predictor (odds ratio 12.4; P < 0.001) of virological treatment failure, compared with CD4
cell count increase at 6 months (odds ratio 7.8; P = 0.002) or self-reported adherence at one month (odds
ratio 1.1; P = 0.85). Low intensity of ART side-effects after one month was strongly associated with survival
(odds ratio 0.11; P = 0.001). Patients starting ART with CD4 cell count <100 cells/mm
3
had a greater risk
of dying during the follow-up period (odds ratio 2.69; P = 0.02). Compared with asymptomatic CDC stage
A patients, CDC stage B (odds ratio 5.72) and CDC stage C patients (odds ratio 16.9) had higher risk of
becoming lost to follow-up (P < 0.001). In the multivariate analyses, pharmacy non-adherence was less
frequent in women (adjusted odds ratio 0.56; P = 0.05) but more frequent in patients with high monthly
income (odds ratio 3.24; P = 0.04).
Conclusion: Pharmacy-refill adherence might be considered as an alternative to CD4 count monitoring
for identification of patients at risk of virological failure, especially in resources-scarce countries. The study
confirmed the difficulty in demonstrating clear associations of individual patient factors and treatment
outcomes. The substantial loss to follow-up and deaths occurring within 6 months after initiating ART
emphasise the need to understand the best timing of ART initiation and further elucidate and educate on
the underlying reasons for delaying initiation of ART in resource-limited countries
Published: 12 October 2009
AIDS Research and Therapy 2009, 6:21 doi:10.1186/1742-6405-6-21
Received: 30 March 2009
Accepted: 12 October 2009
This article is available from: />© 2009 Rougemont et al; licensee BioMed Central Ltd.
This is an Open Access article distributed under the terms of the Creative Commons Attribution License ( />),
which permits unrestricted use, distribution, and reproduction in any medium, provided the original work is properly cited.
AIDS Research and Therapy 2009, 6:21 />Page 2 of 12
(page number not for citation purposes)
Background
During the last decade, access to HIV care in Sub-Saharan
Africa has been improved by reduction in the cost of ART
and by the implementation of WHO guidelines promot-
ing scaling-up by task shifting for clinical decision-making
to less specialised health-care workers [1]. However, the
challenge to achieve high adherence to ART is particularly
acute in Sub-Saharan Africa as the high rates of HIV/AIDS
lead to greater absolute numbers of affected individuals
than in other low-income regions. Although long-term
good ART adherence has been observed in certain settings
of public sectors in Africa (Nachega, data presented at
16th Conference on Retroviruses and Opportunistic Infec-
tions 2009), the magnitude of this challenge in Sub-Saha-
ran Africa remains large [2] and there is growing evidence
for high rates of patients loss to follow-up [3,4]: a recent
review reported that ART programmes in Africa retain
only about 60% of their patients after two years on ART
[5].
As in other African countries, the average prevalence of
HIV in Cameroon has risen dramatically during the last
two decades, from 0.5% in the early 1990s to 5.5% in
2004 [6]. In view of the severe socio-economic and devel-
opmental impact of the epidemic, the government of
Cameroon has made the fight against HIV/AIDS a priority
area in its 2000-2010 strategic plans to combat poverty.
Although the cost of drugs has gone through several
phases of reduction since a pilot antiretroviral drug deliv-
ery programme started in 2000, the implementation of a
national decentralisation programme for HIV care in
2006 led to existing health infrastructures being over-
whelmed by a huge demand for treatment. The over-
crowding of HIV care centres has recently increased, as free
treatment began to be available in May 2007.
Adherence to antiretroviral therapy (ART) is crucial to
ensure viral suppression, decrease the risk of disease pro-
gression and drug resistance. However, it is difficult to
measure accurately, which is reflected in the number of
conflicting reports available on the response to ART in
people living with HIV/AIDS (PLHIV). Optimistic reports
[7-11] may have over-emphasised selective publication of
positive results [12], or have been biased towards highly
motivated patients with early access to limited therapy
[13]. Given these methodological difficulties, it is not sur-
prising that a bewildering number of factors have been
reported to influence adherence: age; gender; monthly
income; level of education; travel time from home to
clinic; baseline CD4 cell count; CDC HIV clinical stage
before starting ART, type of ART regimen, presence of early
ART side-effects and disclosure of HIV status to at least
one relative [14-20].
Clearly, there is a need for simple and reliable methods of
assessing adherence as well as its influencing factors in
order to guide effective public-health measures.
The objective of this study was to compare the diagnostic
accuracy of CD4 cell count changes, self-reported adher-
ence and pharmacy refill history to identify patients with
virological treatment failure amongst a cohort of PLHIV in
a routine care setting in Cameroon during the first 6-
month follow-up period. We then examined the relation-
ship between patient individual factors and adherence,
including in our analysis the substantial number of
patients loss to follow-up.
Methods
Study site, population and design
The Day Hospital of Yaoundé Central Hospital (YCH)
opened in 1998 with a capacity of offering care to 4500
PLHIV. By 2006 this centre had registered more than
10,000 PLHIV, with approximately 2000 patients on ART,
resulting in long waiting periods, overburdened staff and
a severe shortage of clinic space.
At the time of the study, patients had to pay for care,
including drugs (USD 7 to 17 monthly), laboratory tests
(USD 50 for pre-treatment check-up) and clinical visits
(USD 4 for a ticket valid for one month). Before receiving
ART, pre-counselling and post-counselling visits were nec-
essary, followed by three consecutive medical visits and a
final socioeconomic inquiry to assess ART readiness. Ther-
apeutic committee determined eligibility for ART based
on CDC clinical staging (the classification routinely used
in this hospital) and CD4 cell counts.
We recruited all ART-naïve patients at the Day Hospital of
YCH between June and September 2006 at their first
antiretroviral prescription visit. Exclusion criteria were age
under 18 years, imminent transfer to another treatment
centre, prior antiretroviral therapy and poor health status,
with the patient unable to provide consent and respond to
the initial inclusion questionnaire. In most cases the latter
patients were hospitalised in a common room that ren-
dered confidentiality difficult.
Routine clinical visits where scheduled on day 15, at
months 1 and 3, and every 3 months thereafter. Antiretro-
viral therapy was based on triple-drugs regimens consist-
ing of two NRTIs and one non-NRTI and was dispensed
only at the central hospital's pharmacy. Patients were pro-
vided with more medication than required, i.e. tablets
were usually dispensed for 30 days, whereas pharmacy
visits were scheduled in multiples of 4 weeks. At each
pharmacy visit were registered: date of present prescrip-
tion refill, prescribed drug regimen and date of the next
pharmacy appointment.
AIDS Research and Therapy 2009, 6:21 />Page 3 of 12
(page number not for citation purposes)
This study was approved by the Cameroon National Eth-
ics Committee and informed written consent was
obtained from each participant prior to inclusion into the
study.
Data collection
Biomedical and clinical data were extracted from the
clinic file of each enrolled patient and included biochem-
istry, haematological tests, CD4 cell counts determina-
tions (FacsCount; Becton-Dickinson, San Jose, CA, USA),
date of death or transfer to another health centre. Deter-
mination of CD4 cell levels were performed at the pre-
treatment examination and routinely requested every 6
months thereafter. Plasma viral load assays (Abbott Real
Time HIV-1 assay) were offered to all study participants
after ≥ 5 months of ART.
At the day of introducing ART, three trained study inter-
viewers administered an initial questionnaire exploring
socioeconomic status, knowledge and beliefs toward HIV
and ART, social support and disclosure of HIV status
[21,22].
A second culturally adapted questionnaire gathered infor-
mation on self-reported ART adherence and early ART
side-effects [23]. It was administered after one month of
therapy by a PLHIV external to the health care team. We
asked whether or not any ART had been missed, using glo-
bal one-month recall. All interviews were conducted in
either French or English, the two national languages in
Cameroon.
Pharmacy records were reviewed 6 months after ART initi-
ation to define pharmacy-refill adherence. In order to fur-
ther ascertain true adherence status, patients without
renewed prescriptions in the last two months were
actively traced by two phone calls and if still alive, encour-
aged to come back to the clinic to restart therapy.
Outcome definitions
Virological treatment failure was defined as a viral load
>400 copies/ml (lower detection limit of 40 copies/ml),
and was used as the gold standard to compare different
methods of adherence measurements: CD4 count change,
self reported adherence and pharmacy-refill history.
Immunological treatment failure was defined as a reduc-
tion in CD4 count after 6-months of treatment to, or
below, pre-therapy baseline, or persistent levels below
100 cells/mm
3
[1].
Self-reported adherence was classified as "adherent" when
not a single dose was missed or non-adherent if the
patient admitted having missed at least one dose during
the last month.
Pharmacy non-adherence was defined as renewal of pre-
scriptions of later than 2 weeks after the scheduled phar-
macy appointment, or patients confirming abandoned
ART on phone call tracing. Patients not traced by phone
calls were considered to be lost to follow-up. The follow-
up time was censored at the last scheduled pharmacy visit.
Statistical Analysis
Statistical analyses were conducted using STATA version 9
(Texas, USA).
The three different methods to measure adherence were
compared in their ability to predict virological failure by
computing their sensitivity and specificity, positive and
negative predictive values and positive and negative like-
lihood ratios. Finally, the association between each
method and virological failure was also reported as OR
and 95% confident interval. We then used the method of
adherence assessment showing the strongest association
with virological failure as a surrogate of true treatment
adherence. Chi-square tests were used to determine the
associations between each individual patient baseline
characteristic and adherence, at a P < 0.2 level of signifi-
cance. Logistic regression models were fitted including
characteristics shown to be associated with adherence in
univariate analysis (P < 0.2). Variables measured at one
month were excluded from this analysis as the substantial
number of patients with early loss to follow-up reduced
the number of available data and thus statistical power.
As the substantial rate of patients loss to follow-up may
introduce bias into estimates of risk factors for treatment
non-adherence, we conducted a sensitivity analysis where
associations were tested in two scenarios: a best-case sce-
nario, where all patients lost to follow-up and not success-
fully traced by phone call were considered as adherent,
and a worst-case scenario where all such patients were
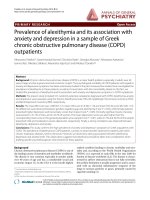
defined as non-adherent [Fig. 1].
Results
Baseline characteristics
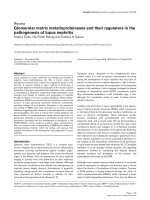
Patient's disposition is shown in [Fig 1]. Of the 434
patients selected to receive ART between June and Septem-
ber 2006, 405 (93%) attended the baseline visit and 312
(72%) were included in the study. Reasons for non partic-
ipation of eligible patients were imminent transfer to
another treatment centre (n = 20), first antiretroviral pre-
scription by a physician not participating in the study (n
= 15), a physical health status rendering long interviews
difficult for the patient (n = 11), refusal to take part (n =
8) and other reasons (n = 39).
Among the 312 enrolled patients at the start of ART, the
mean age (± SD) was 37 ± 9 years, with a majority of
AIDS Research and Therapy 2009, 6:21 />Page 4 of 12
(page number not for citation purposes)
women (63%) [Table 1]. Although 97 participants (31%)
reported no income-generating occupation, 76 (78%) of
these received occasional or regular financial help from
relatives. Thirty-two patients (10%) benefited from treat-
ment support from the Global Fund, which was associ-
ated with neither socio-economic status nor with income
levels (data not shown). Forty-six per cent of the cohort
had the lowest financial income (monthly income of less
than USD50). About two-thirds of the patients (70%)
lived close to the clinic, with only 15 (5%) living more
than 4 hours from the Day Hospital by public transport.
Most patients (n = 195 or 63%) had been followed at the
clinic for less than one month before initiating ART. How-
ever, only 36 patients (12%) reported the use of alterna-
tive therapies for HIV in the past. At the time of starting
ART the majority of the cohort were classified as sympto-
matic (64% at CDC stage B and 14% at stage C), the
median baseline CD4 count was 104 cells/mm
3
(inter-
quartile range 50 - 177 cells/mm
3
). All patients received
two nucleoside reverse transcriptase inhibitors (NRTIs)
and one non-nucleoside reverse transcriptase inhibitor
(NNRTI) with the exception of one patient who received
two NRTIs and one protease inhibitor.
When asked about social support and stigmatisation, 275
participants (88%) reported having disclosed their HIV
status to at least one person and 260 (83%) declared sat-
isfied by family or friends support. Most patients (n = 258
or 80%) had optimistic expectations of the effects of ART
on their health status, a sizable minority believed that
treatment could cure HIV (44%) and 118 patients (38%)
were unaware of possible ART side effects.
Treatment outcomes and adherence measures
Of 312 patients in the initial cohort, 219 (70%) were still
coming to the pharmacy to refill their medication after 6
months of follow-up, while 51 (17%) were lost, 28 (9%)
Table 1: Socio-demographic and clinical data at start of ART of
the 312 patients studied
Characteristics n %
Age groups (year)
<30 65 21
30-49 199 64
≥ 50 32 10
Missing data 16 5
Gender
Male 106 34
Female 198 63
Missing data 8 3
Marital status
Single, Divorced, Separated 182 58
Married, Cohabiting 114 37
Missing data 16 5
Level of education
Primary 91 29
Secondary without Bachelor 156 50
Secondary with Bachelor or University 45 15
Missing data 20 6
Monthly income
< USD 50 145 46
USD50 - USD 125 73 23
> USD 125 77 25
Missing data 17 6
Travel time (home to clinic) (h)
<1 217 70
1-4 68 21
>4 15 5
Missing data 12 4
Time of follow-up before ART
<1 month 195 63
1-6 months 86 27
>6 months 20 6
Missing data 11 4
CDC Stage
A5718
B20164
C4414
Missing data 10 4
CD4 baseline Strata (cells/mm
3
)
<100 143 46
100-200 109 35
>200 47 15
Missing data 13 4
Flow chart for adherence analysisFigure 1
Flow chart for adherence analysis.
!
∀#
∃
∀#
∀
∀#%
&∋
∃
(%&∋
AIDS Research and Therapy 2009, 6:21 />Page 5 of 12
(page number not for citation purposes)
had died and 14 (4%) were had been transferred to other
care centres. The incidence rate of loss to follow-up was
40.1 per 100 persons years (95% CI: 30.5 - 52.8) and mor-
tality rate was 21.2 per 100 persons years (95% CI: 15 -
31). Drop-out occurred at a median of 44 days (IQR: 28 -
80 days) and death occurred at a median of 55 days (IQR:
28 - 81 days) after treatment initiation.
The first routinely scheduled follow-up CD4 cell count
was performed by only 71 patients (23% of patients still
followed-up). The median rise in CD4 cell count from
baseline to this point was 117 cells/mm
3
and 16 patients
(22%) with available follow-up CD4 cell count met crite-
ria for immunological treatment failure. Using phone call
tracing alongside tracking of patients during regular fol-
low-up visits, we obtained viral load values for 206
patients. Virological treatment failure (viral load value of
> 400 copies/ml) at 6 months was experienced by 26
patients, representing 13% of patients with available viral
load value and 8% of the entire cohort.
Self-reported adherence data after one month of therapy
were obtained for 238 patients (76%). The majority of
respondents (78%) claimed not to have missed a single
dose during this period. The proportion of participants
that reported full adherence to treatment during the past
month decreased from 83% at one month to 57% at 6
months.
Adherence based on pharmacy refill charts after 6 months
of follow-up could be analysed for 278 participants.
Twenty-eight subjects were excluded because of their short
follow-up duration (<2 months) and 6 patients had
incomplete data on the refill chart [Fig 1]. Two-thirds
(64%) of patients assessed came regularly every month
within two weeks of the pharmacy-appointed dates and
qualified as adherent in the analysis. Non-adherence
(interruptions or discontinuations) was defined for 23%
of the participants with available data: 49 subjects inter-
rupted their treatment for at least 3 weeks during the fol-
low-up period; 14 patients lost to follow-up could be
traced by phone calls and confirmed they had discontin-
ued ART. Thirty-seven patients (14%) could not be traced
by phone call after loss from pharmacy follow-up.
Adherence measurements and virological treatment failure
There were significant differences between the ability of
different measures of adherence to predict virological
treatment failure after 6 months of therapy [Table 2].
Pharmacy-refill irregularity was the most powerful predic-
tor (OR, 12.40; 95% CI, 4.75-32.40; P < 0.001). In the
sub-sample of 194 patients whose 6-month viral load and
Table 2: Potential predictors associated with virological treatment failure (>400 HIV RNA cop/ml) after 6 months of initiating ART
Self reported adherence CD4 count change Pharmacy refill history
100% <100% Immunological
success
Immunological
failure
Regular,
continuous
Irregular or
interrupted
Total (Nb) 140 25 51 14 147 47
Virological success
(Nb)
125 22 44 6 140 29
Virological failure
(Nb)
15 3 7 8 7 18
OR (95%CI) 1.13 (0.30-4.25) 7.78 (1.68-36.0) 12.4 (4.75-32.4)
Sensitivity 0.17 0.53 0.72
Specificity 0.85 0.88 0.83
Positive predictive
value
0.12 0.57 0.38
Negative
predictive value
0.83 0.86 0.95
Positive likelihood
ratio
1.13 1.23 4.23
Negative likelihood
ratio
0.97 0.53 0.34
Viral load measurement was available for 206 patients. Immunological success means a rise above 100 cells/μl; immunological failure means a drop
to pre-treatment levels or <100 cells/μl,)
AIDS Research and Therapy 2009, 6:21 />Page 6 of 12
(page number not for citation purposes)
pharmacy refill charts were available, 38% of the phar-
macy non-adherent patients demonstrated virological
treatment failure while 95% of pharmacy adherent
patients presented with virological suppression. Immuno-
logical treatment failure was also significantly associated
with virological treatment failure (OR, 7.78; 95% CI,
1.68-36.0; P = 0.002). However, pharmacy adherence esti-
mated by pharmacy refill charts had greater accuracy for
detecting virological treatment failure than CD4 count
changes at 6-months: the sensitivity was higher (72% ver-
sus 53%) with approximately the same specificity (82%
versus 88%).
Table 3: Logistic regression of patient characteristics associated with treatment outcomes in the first 6 months after initiating ART
Characteristics Disappeared (n = 51) Died (n = 28)
Odds ratio
(95%CI)
P-value Odds ratio
(95%CI)
P-value
Age (years) 0.65 0.23
<30 0.98 (0.45-2.15) 0.39 (0.11-1.35)
30-49 1 1
≥ 50 1.55 (0.61-3.96) 0.58 (0.13-2.65)
Sex 0.09 0.37
Male 1 1
Female 0.58 (0.31-1.08) 0.68 (0.30-1.55)
Monthly income (USD) 0.9 0.43
<USD50 1.19 (0.55-2.59) 0.92 (0.32-2.63)
USD50 - USD125 1 1
>USD125 1.09 (0.44-2.68) 1.67 (0.57-4.90)
Education 0.44 0.51
Primary 1 1
Secondary without bachelor 1.38 (0.67-2.84) 1.71 (0.64-4.58)
Secondary with bachelor or university 0.79 (0.26-2.39) 1.77 (0.49-6.01)
Travel time to clinic (hour) 0.47 0.97
<1 1 1
1-4 1.30 (0.62-2.72) 1.02 (0.39-2.71)
>4 1.93 (0.65-5.75) 1.22 (0.26-5.77)
Baseline CD4-cell count (cells/μl) 0.86 0.02
<100 1.06 (0.57-1.97) 2.69 (1.12-6.44)
≥ 100 1 1
Clinical stage <0.001 0.11
CDC stage A 1 1
CDC stage B 5.72 (1.33-24.70) 2.08 (0.59-7.35)
CDC stage C 16.9 (3.58-80.30) 4.52 (1.04-19.70)
ART side-effects at 1 month 0.71 0.638
No side-effects 1 1
One or more side-effects 1.24 (0.40-3.85) 1.43 (0.30-6.73)
ART side-effects at 1 month 0.14 0.001
Improving 0.49 (0.19-1.26) 0.11 (0.02-0.52)
Not improving 1 1
Disclosure of HIV status 0.22 0.93
Yes 1 1
No 1.10 (0.95-1.27) 1.01 (0.79-1.29)
Patients who disappeared (n = 51) or died (n = 28) are compared with patients with complete follow-up or transferred (n = 233). OR were
calculated using logistic regression, p-values from the likelihood ratio test.
AIDS Research and Therapy 2009, 6:21 />Page 7 of 12
(page number not for citation purposes)
Notably, self-reported adherence at 1 month was not sig-
nificantly associated with virological treatment outcomes.
Associations between patient characteristics, retention
and mortality
Univariate analysis of individual patient factors [Table 3]
showed that the most significant factor associated with
survival was the improvement of early ART side-effects,
(OR: 0.11; 95% CI: 0.02-0.52). Patients starting treatment
with CD4 cell count below 100 cells/mm
3
were at signifi-
cantly greater risk of death during the follow-up period
(OR: 2.69; 95% CI: 1.12-6.44). We found only a trend for
association of HIV CDC stage with mortality. However,
HIV CDC clinical stage at the beginning of treatment sig-
nificantly predicted (P < 0.001) loss to follow-up: com-
pared with asymptomatic patients CDC stage A, CDC
stage B patients (OR: 5.72; 95% CI: 1.33-24.70) and spe-
cially CDC stage C patients (OR: 16.90; 95% CI: 3.58-
80.30) had greater rates of loss to follow-up.
There was a non-significant trend to lower rates of inter-
ruption of follow-up for women (OR: 0.58; 95% CI: 0.31-
1.08) and for those reporting improving ART side-effects
after one month of treatment (OR: 0.49; 95% CI: 0.19-
1.26). None of the socio-economic determinants studied
appeared to influence patient retention and mortality:
neither age, nor level of education, nor economic situa-
tion and social support were significantly associated with
loss to follow-up or with death.
Associations between patient characteristics and
pharmacy adherence
As patients lost to follow-up may have introduced bias
into the analysis, we analysed the association of individ-
ual patient characteristics with pharmacy adherence in a
sensitivity analysis, using two scenarios, a best-case and a
worst-case scenario [Table 4]. In the best-case scenario,
where all participants lost to follow-up were analysed as
adherent, greater age (OR: 0.38; 95% CI: 0.11-1.33),
female sex (OR: 0.66; 95% CI: 0.37-1.18) and patients
reporting improvement of early ART side-effects (OR:
0.51; 95% CI: 0.23-1.10) tended keep pharmacy appoint-
ments less irregularly (P < 0.2). In this scenario, a monthly
middle income was significantly associated (P = 0.01)
with greater pharmacy adherence. Low (OR: 2.49; 95% CI:
1.03-6.01) or high (OR: 3.76; 95% CI: 9.58) incomes
groups showed a higher risk for pharmacy non-adherence.
In the worst-case scenario, female sex (OR: 0.60; 95% CI:
0.35-1.01) and improving early ART side-effects (OR:
0.47; 95% CI: 0.24-0.95) were characteristics associated
(P < 0.05) with lower pharmacy non-adherence. CDC
stage B patients (OR: 2.68; 95% CI: 1.26-5.68) and spe-
cially CDC stage C patients (OR: 5.13; 95% CI: 2.02-
13.00) had higher risk of pharmacy non-adherence than
asymptomatic patients.
In the multivariate analysis [Table 5], women presented
lower risk for non-adherence both in the best case
(adjusted OR: 0.56; 95% CI: 0.29-1.07; P = 0.08) and in
the worst case scenarios (adjusted OR: 0.56; 95% CI: 0.31-
1.02; P = 0.05). Economic status, in particular patients
with the highest monthly income when compared with
monthly middle income (OR: 3.24; 95% CI: 1.24-8.46; P
= 0.04), was retained as a predictor of poor adherence
only in the best case scenario. When compared with
asymptomatic patients, the multivariate analysis con-
firmed a marked risk of non-adherence for CDC stage B
patients (OR: 2.75; 95% CI: 1.23-6.18) and CDC stage C
patients (OR: 5.07; 95% CI: 1.87-13.80) in the worst-case
scenario (P = 0.003).
Discussion
Despite substantial improvements in the affordability and
availability of ART in recent years, African health-care sys-
tems face enormous challenges in the context of explod-
ing demand for HIV care [24]. The main objective of this
study was to identify factors influencing ART adherence
and evaluate related outcome of therapy 6 months after
ART initiation in a routine setting.
Treatment outcomes and adherence measurements
Our cohort showed a relative low patient retention rate:
70% of the patients who started ART still came to the
pharmacy to take their prescription after six months of fol-
low-up, 17% disappeared, 9% died and 4% were referred
to other care centres. These results confirm that most
losses to follow-up and deaths occur during the initial
period after ART initiation.
A recent systematic review [5] of 33 earlier cohorts in
developing countries reported a mean retention rate of
79% at six months. Our slightly lower retention rates may
be due to the increasing challenge of managing growing
numbers of patients treated.
Pharmacy-refill history gives no description of daily
adherence to treatment, because patients may not take all
prescribed medications. It could also be considered as a
time-consuming monitoring tool for the pharmacy staff,
owing to the rapidly growing number of patients in public
ART programs. However, this is a simple, inexpensive
approach and it was previously reported to be as accurate
as CD4 counts for predicting virological response [25]. We
found the same correlation between pharmacy-refill
adherence and virological outcome at 6 months. In our
settings, pharmacy-refill adherence had even greater accu-
racy, with higher sensitivity and similar specificity to CD4
count changes at 6 months for predicting virological treat-
ment failure. Moreover, data from refill charts in routine-
care conditions were available for 95% of the participants,
whereas only 23% of the cohort performed their first CD4
cell count follow-up, an analysis that patients had to cover
AIDS Research and Therapy 2009, 6:21 />Page 8 of 12
(page number not for citation purposes)
Table 4: Patient characteristics associated with pharmacy non-adherence during the first 6 months after initiating ART
Characteristics Best-case scenario Worst-case scenario
OR (95%CI) P-value OR (95%CI) P-value
Age (years) 0.09 0.95
<30 1.45 (0.74-2.83) 1.05 (0.57-1.95)
30-49 1 1
≥ 50 0.38 (0.11-1.33) 0.90 (0.40-2.04)
Sex 0.17 0.05
Male 1 1
Female 0.66 (0.37-1.18) 0.60 (0.35-1.01)
Monthly income (US$) 0.01 0.08
< USD 50 (20'000 FCFA) 2.49 (1.03-6.01) 1.73 (0.89-3.38)
USD 50 - USD125 (20'000-50'000) 1 1
> USD 125 (>50'000) 3.76 (1.47-9.58) 2.27 (1.08-4.77)
Education 0.82 0.16
Primary 1 1
Secondary without Bachelor 0.96 (0.51-1.83) 1.35 (0.76-2.37)
Secondary with Bachelor or University 0.74 (0.28-1.95) 0.64 (0.27-1.54)
Travel time to clinic (hour) 0.21 0.73
<1 1 1
1-4 0.88 (0.44-1.78) 1.24 (0.68-2.61)
>4 0.22 (0.03-1.74) 1.29 (0.44-3.79)
Baseline CD4-cell count (cells/μl) 0.75 0.85
<100 1.09 (0.62-1.93) 1.05 (0.64-1.73)
≥ 100 1 1
Clinical stage 0.44 0.001
CDC stage A 1 1
CDC stage B 1.60 (0.72-3.55) 2.68 (1.26-5.68)
CDC stage C 1.72 (0.62-4.75) 5.13 (2.02-13.0)
Initial ART regimen
Twice daily 1 0.81 1 0.79
Three times daily 0.93 (0.53-1.64) 1.07 (0.65-1.75)
Occurrence of ART side-effects at 1 month 0.46 0.64
No side-effects 1 1
One or more side-effects 0.74 (0.34-1.62) 0.84 (0.41-1.73)
Course of ART side-effects at 1 month 0.09 0.04
Improving 0.51 (0.23-1.10) 0.47 (0.24-0.95)
Not improving 1 1
Reported ART adherence at 1 month
100% 1 0.55 1 0.19
<100% 1.30 (0.56-3.01) 1.66 (0.78-3.52)
Disclosure of HIV status 0.82 0.38
Yes 1 1
No 0.98 (0.81-1.18) 1.07 (0.92-1.24)
Non-adherent patients are compared with adherent patients in a best and a worst case scenario (best-case scenario: patients lost to follow-up were
considered adherent; worst-case scenario: patients lost to follow-up were considered non-adherent). The associations of each characteristic with
time stayed adherent were examined using logistic regression models.
AIDS Research and Therapy 2009, 6:21 />Page 9 of 12
(page number not for citation purposes)
at their own expense. The ability of adherence monitoring
from the pharmacy to identify patients at risk of treatment
failure may help health-care providers for early adherence
counselling interventions. At the time of the study, data
from refill charts were kept at the Central Pharmacy and
were not communicated to clinicians. A practical implica-
tion of our findings is that systematic monitoring of phar-
macy-refill adherence should be integrated into
therapeutic score cards carried by every patient.
Self-reported adherence has been described in several
studies as a rapid and inexpensive method, albeit subject
to social-desirability and recall biases [26,27]. In our
cohort, self-reported adherence was not predictive of viro-
logical treatment failure. One earlier study in a South Afri-
can cohort [28], found only a modest increase in risk
(unadjusted OR: 2.35, 95% CI: 1.52-2.53) for patients
reporting <100% at 6 weeks for virological failure at 12
months, which might not have been detectable in our
smaller population. In addition, the proportion of our
participants that reported 100% adherence to treatment
during the past month decreased from 83% at one month
to 57% at 6 months. Mannheimer [27] described a similar
decline in self-reported adherence with time. It is likely
that these decreases reflect decreases in true daily adher-
ence with time. However, there may also have been an
overestimation of self-reported medication in early stages
due to desire to please when patients do not feel confident
in a new environment. Further studies in lower-income
settings are needed to verify the accuracy of self-reported
medication adherence as a predictor of virological out-
come.
Determinants of ART adherence
We examined determinants of adherence in two scenarios
to reduce bias due to loss to follow-up. We identified
female sex, middle monthly income and less ART related
side-effects at one month as predictors of higher phar-
macy adherence under both scenarios. Age and HIV clini-
cal CDC stage correlated with pharmacy adherence only
under best and worst-case scenarios, respectively. Gender
remained of borderline significance after adjusting for
potential confounders in the multivariate model.
To the best of our knowledge, the current study is the first
to demonstrate that income may not be linearly associ-
ated with adherence: patients with monthly middle
income had greater pharmacy adherence rates than both
the poorest and the richest participants. A recently pub-
lished meta-analysis [17] examined the association
between socio-economic status and adherence to antiret-
roviral therapy: out of 8 studies, only 2 prospective studies
identified low income as a predictor of non-adherence.
All, except one [29], analysed income as a binary variable
which could explain why none of them described our U-
shaped association. Selection bias through restricted
financial access to health care seems unlikely in our set-
tings: two-thirds (67%) of patients reported no or occa-
sional income, whereas only 25% of our population
reported earning more than USD125 per month.
With the exception of a trend towards greater loss rates
among men, we failed to demonstrate any other social or
demographic association with loss to follow-up. The same
gender association with both death and loss to follow-up
was recently reported from a study in Malawi [30].
Limitations of the study areas of uncertainty
It is unclear how far our results can be generalised to other
countries and healthcare systems. Compared with reports
from patients starting ART in other treatment programmes
in lower-income countries [2], our cohort had a lower
Table 5: Multivariate logistic regression of baseline characteristics associated (P < 0.2) with pharmacy non-adherence in the univariate
analysis
Characteristics Best-case scenario Worst-case scenario
Adjusted OR
(95%CI)
P-value Adjusted OR
(95%CI)
P-value
Sex 0.08 0.05
Male 1 1
Female 0.56 (0.29-1.07) 0.56 (0.31-1.02)
Monthly income (USD) 0.04 0.28
<USD50 2.04 (0.82-5.06) 1.66 (0.80-3.44)
USD50 - USD125 1 1
> USD125 3.24 (1.24-8.46) 1.86 (0.82-4.22)
Clinical stage 0.003
CDC stage A 1
CDC stage B 2.75 (1.23-6.18)
CDC stage C 5.07 (1.86-13.8)
AIDS Research and Therapy 2009, 6:21 />Page 10 of 12
(page number not for citation purposes)
proportion of men, fewer patients at clinical advanced dis-
ease stages and higher baseline CD4 cell counts.
The percentage of male patients in our cohort reflects the
gender distribution of HIV prevalence in Cameroon,
which indicates that women's access to health care for HIV
is improving. We also observed discrepancies between
biological (CD4 counts) and clinical (CDC stages) levels
of disease in our participants: Only 14% of our patients
started therapy at CDC clinical stage C, despite a median
CD4 cell count of 107 cells/μl. The simplest explanation
for this is an underestimation of CD4 cell count at the Day
Hospital Laboratory. This conclusion is supported by our
observation of a large variability of baseline CD4 cell
counts for patients who were analysed at close intervals at
different laboratories (data not shown). A lack of associa-
tion between immunological and virological outcomes
have been found in similar settings [3] suggesting that
CD4 cell count follow-up should be interpreted with cau-
tion, particularly if performed in different laboratories. An
alternative explanation would be a systematic clinical mis-
classification of patients. This is supported by the observa-
tion that 75 of 169 patients (44%) enrolled at the YCH
Day hospital between 2001 and 2003 were classified as
CDC clinical stage C [31]. Such inconsistencies also reflect
the constraints on hospital resources and pressure on staff
generated by the rapidly increasing number of eligible
cases to be evaluated by the Therapeutic Committee every
week.
Only 15 patients in our study (5%) lived more than 4
hours of travel from the Day Hospital, which may not be
representative of patients in ART programmes at other
hospitals. A survey of patients initiating ART from 2002 to
2005 in Limbe Provincial Hospital, the only ART clinic
serving the Southwest Province of Cameroon at the time
of the study, showed that 44.3% of patients were living
more than 40 km by inaccessible road from the clinic
[19]. As treatment scale-up programmes are currently
attempting to shift ART delivery to health districts in
remote areas, more research is needed on geographic
access to ART.
Only 312 out of 440 originally eligible patients were
included in our study cohort. Such high attrition rates
before initiating ART treatment are a main source of selec-
tion bias in studies of retention rates in Africa. Data from
different cohorts in other lower-income settings [2] sug-
gest that about 50% of patients lost early to follow-up
may have died. This phenomenon needs to be better
understood to enable targeted interventions. Without an
informed consent, we were not allowed to review all med-
ical records in detail to assess if baseline characteristics of
the initial eligible population differed from our cohort.
Our study focused on the first six months of follow-up
after ART initiation, a period previously characterized by
high attrition [5,18,19,32] and thus considered to be a
crucial phase for promoting adherence. As level of adher-
ence and its predictors may vary over time, we strongly
encourage ART programs to conduct long-term surveil-
lance of these outcomes to fully understand the subtle var-
iations of its dynamic behavioral process.
Conclusion
Although there is no 'gold standard' for the assessment of
medication adherence, pharmacy-refill adherence or
other easily accessible methods should be considered as
an alternative to CD4 count monitoring for identification
of patients at risk of virological failure, especially in low-
income countries. It represents a simple, inexpensive and
accurate method that correlates with virological response
to treatment. Data from pharmacy refill charts should be
made available to health-care workers to help identifying
patients at greatest risk of treatment failure.
It is still difficult to pinpoint determinants of non-adher-
ence to ART in lower-income countries; for example, our
study indicates than the role of economic status is more
complicated than may previously have been thought. Pre-
venting treatment discontinuation by enhancing adher-
ence counselling for a higher-risk population may not be
effective: all previous studies failed to clearly demonstrate
a specific group that would benefit from such interven-
tion. Developing strategies should rather focus on
improving adherence follow-up by simple and inexpen-
sive measurement.
Finally, more studies in resource-limited countries are
urgently needed to understand the underlying reasons for
late initiation of ART and for high attrition rates before
initiating ART, which account for a large number of early
losses to follow-up and deaths in lower-income countries.
Abbreviations
AIDS: Acquired immune deficiency syndrome; ART: Anti
retroviral treatment; CDC: Centers for disease control and
prevention; CI: Confidence interval; HIV: Human
immune deficiency virus; IQR: Inter quartile range;
NNRTI: Non- Nucleoside reverse transcriptase inhibitor;
NRTI: Nucleoside reverse transcriptase inhibitor; OR:
Odds ratio; P: P value for statistical significance; PLHIV:
People living with human immune deficiency virus; SD:
Standard deviation; WHO: World Health Organization;
YCH: Yaoundé Central Hospital.
Competing interests
The authors declare that they have no competing interests.
AIDS Research and Therapy 2009, 6:21 />Page 11 of 12
(page number not for citation purposes)
Authors' contributions
All authors read and approved the final manuscript. MR
conceived the study, raised funds, participated in the
design and coordination of the study, collected and
cleaned data, interpreted data, drafted the manuscript.
BES contributed to the design and coordination of the
study, contributed to data entering and cleaning, partici-
pated to interpreted and helped in drafting and revising
the manuscript. NE contributed to data cleaning, per-
formed statistic analysis and interpretation, and helped in
revising the manuscript. PN conceived the study, partici-
pated in the design and coordination of the study, carried
out data collection, coordinated laboratory sample
processing, contributed to manuscript revision. All
authors read and approved the final manuscript.
Acknowledgements
Dr Odile Ouwe Missi Oukem: laboratory expertise, Laboratoire CIRCB,
Yaoundé; Dr Mireille Claudine Essomba: pharmacy health workers coordi-
nation, Yaoundé Central Hospital; Dr Yvette Nkene and Dr Charles
Kouanfack: consulting physicians at the Day Hospital, YCH; Berthe Ymele,
Dora Njamnshi, Vincent Omgba: health care workers at the Day Hospital,
study interviewers; Dr Edwige Belinga and Alain Ewodo: additional study
interviewers; Dr Thomson Kinge: scientific advisor and technical assistance;
Bibiane Bekono Ntsama: data cleaning and processing; Dominique Roulin,
Prof Jean-François Balavoine, Eric Linder and Renaud Gautier: main financial
support by Sidaccueil Association, Geneva, Switzerland; Jens Diedrich: addi-
tional financial support by Boehringer Ingelheim, Switzerland; Dr Daniel
Gene and Dr François Kündig: additional financial support, La Chaux-de-
Fond Hospital, Switzerland; Dr Sabine Yerly: laboratory expertise, Geneva
Hospital Central Laboratory of Virology, Switzerland; Dr Thomas Szeless:
study interviewers training and coordination; Dr Pelle Stolt and Dr Alexan-
dra Calmy: scientific writing advisors; Prof Fritz Baumann: technical assist-
ance.
References
1. Gilks CF, Crowley S, Ekpini R, Gove S, Perriens J, Souteyrand Y, et al.:
The WHO public-health approach to antiretroviral treat-
ment against HIV in resource-limited settings. Lancet 2006,
368(9534):505-510.
2. Brinkhof MW, Dabis F, Myer L, Bangsberg DR, Boulle A, Nash D,
Schechter M, Laurent C, et al.: Early loss of HIV-infected patients
on potent antiretroviral therapy programmes in lower-
income countries. Bull World Health Organ 2008, 86(7):559-67.
3. Van Oosterhout JJ, Bodasing N, Kumwenda JJ, Nyirenda C, Mallewa J,
Cleary PR, et al.: Evaluation of antiretroviral therapy results in
a resource-poor setting in Blantyre, Malawi. Trop Med Int
Health 2005, 10(5):464-470.
4. Laurent C, Meilo H, Guiard-Schmid JB, Mapoure Y, Noel JM,
M'Bangue M, et al.: Antiretroviral therapy in public and private
routine health care clinics in Cameroon: lessons from the
Douala antiretroviral (DARVIR) initiative. Clin Infect Dis 2005,
41(1):108-111.
5. Rosen S, Fox MP, Gill CJ: Patient retention in antiretroviral
therapy programs in sub-Saharan Africa: a systematic
review. PLoS Med 2007, 4(10):e298.
6. Demographic and Health Surveys Cameroon 2004 2009
[ />data.cfm?surv_id=232&ctry_id=4&SrvyTp=ctry].
7. Laniece I, Ciss M, Desclaux A, Diop K, Mbodj F, Ndiaye B, et al.:
Adherence to HAART and its principal determinants in a
cohort of Senegalese adults. AIDS 2003, 17(Suppl 3):S103-S108.
8. Orrell C, Bangsberg DR, Badri M, Wood R: Adherence is not a
barrier to successful antiretroviral therapy in South Africa.
AIDS 2003, 17(9):1369-1375.
9. Weiser S, Wolfe W, Bangsberg D, Thior I, Gilbert P, Makhema J, et
al.: Barriers to antiretroviral adherence for patients living
with HIV infection and AIDS in Botswana. J Acquir Immune Defic
Syndr 2003, 34(3):281-288.
10. Laurent C, Kouanfack C, Koulla-Shiro S, Nkoue N, Bourgeois A,
Calmy A, et al.: Effectiveness and safety of a generic fixed-dose
combination of nevirapine, stavudine, and lamivudine in
HIV-1-infected adults in Cameroon: open-label multicentre
trial. Lancet 2004, 364(9428):29-34.
11. Attaran A: Adherence to HAART: Africans take medicines
more faithfully than North Americans. PLoS Med 2007,
4(2):e83.
12. Weidle PJ, Wamai N, Solberg P, Liechty C, Sendagala S, Were W, et
al.: Adherence to antiretroviral therapy in a home-based
AIDS care programme in rural Uganda. Lancet 2006,
368(9547):1587-1594.
13. Mills EJ, Nachega JB, Buchan I, Orbinski J, Attaran A, Singh S, et al.:
Adherence to antiretroviral therapy in sub-Saharan Africa
and North America: a meta-analysis. JAMA 2006,
296(6):679-690.
14. Mills EJ, Nachega JB, Bangsberg DR, Singh S, Rachlis B, Wu P, et al.:
Adherence to HAART: a systematic review of developed and
developing nation patient-reported barriers and facilitators.
PLoS Med 2006, 3(11):e438.
15. Amberbir A, Woldemichael K, Getachew S, Girma B, Deribe K: Pre-
dictors of adherence to antiretroviral therapy among HIV-
infected persons: a prospective study in Southwest Ethiopia.
BMC Public Health 2008, 8:
265.
16. Etard JF, Laniece I, Fall MB, Cilote V, Blazejewski L, Diop K, et al.: A
84-month follow up of adherence to HAART in a cohort of
adult Senegalese patients. Trop Med Int Health 2007,
12(10):1191-1198.
17. Falagas ME, Zarkadoulia EA, Pliatsika PA, Panos G: Socioeconomic
status (SES) as a determinant of adherence to treatment in
HIV infected patients: a systematic review of the literature.
Retrovirology 2008, 5:13.
18. Karcher H, Omondi A, Odera J, Kunz A, Harms G: Risk factors for
treatment denial and loss to follow-up in an antiretroviral
treatment cohort in Kenya. Trop MedInt Health 2007,
12(5):687-94.
19. Mosoko JJ, Akam W, Weidle PJ, Brooks J, Aweh A, et al.: Survival
and adherence to ART in an era of decreasing drug cost in
Limbe, Cameroon. 14th Conference on Retroviruses and Opportunis-
tic Infections. (CROI); 2007 25-28 February; Los Angeles, California .
Abstract 536
20. Ollivier F, N'Kam M, Midoungue C, Rey JL: Study conducted at the
Yaounde University Hospital on anti-retroviral treatment
compliance (Cameroon). Sante Publique 2005, 17(4):559-568.
21. Nachega JB, Lehman DA, Hlatshwayo D, Mothopeng R, Chaisson RE,
Karstaedt AS: HIV/AIDS and antiretroviral treatment knowl-
edge, attitudes, beliefs, and practices in HIV-infected adults
in Soweto, South Africa. J Acquir Immune Defic Syndr 2005,
38(2):196-201.
22. Weiser S, Wolfe W, Bangsberg D, Thior I, Gilbert P, Makhema J, et
al.: Barriers to antiretroviral adherence for patients living
with HIV infection and AIDS in Botswana. J Acquir Immune Defic
Syndr 2003, 34(3):281-288.
23. Chesney MA, Ickovics JR, Chambers DB, Gifford AL, Neidig J, Zwickl
B, et al.: Self-reported adherence to antiretroviral medica-
tions among participants in HIV clinical trials: the AACTG
adherence instruments. Patient Care Committee & Adher-
ence Working Group of the Outcomes Committee of the
Adult AIDS Clinical Trials Group (AACTG). AIDS Care 2000,
12(3):255-266.
24. Wester CW, Bussmann H, Avalos A, Ndwapi N, Gaolathe T, Car-
diello P, et al.: Establishment of a public antiretroviral treat-
ment clinic for adults in urban Botswana: lessons learned.
Clin Infect Dis 2005, 40(7):1041-1044.
25. Bisson GP, Gross R, Bellamy S, Chittams J, Hislop M, Regensberg L, et
al.: Pharmacy refill adherence compared with CD4 count
changes for monitoring HIV-infected adults on antiretroviral
therapy. PLoS Med 2008, 5(5):e109.
26. Chesney MA, Ickovics JR, Chambers DB, Gifford AL, Neidig J, Zwickl
B, et al.: Self-reported adherence to antiretroviral medica-
tions among participants in HIV clinical trials: the AACTG
adherence instruments. Patient Care Committee & Adher-
Publish with BioMed Central and every
scientist can read your work free of charge
"BioMed Central will be the most significant development for
disseminating the results of biomedical researc h in our lifetime."
Sir Paul Nurse, Cancer Research UK
Your research papers will be:
available free of charge to the entire biomedical community
peer reviewed and published immediately upon acceptance
cited in PubMed and archived on PubMed Central
yours — you keep the copyright
Submit your manuscript here:
/>BioMedcentral
AIDS Research and Therapy 2009, 6:21 />Page 12 of 12
(page number not for citation purposes)
ence Working Group of the Outcomes Committee of the
Adult AIDS Clinical Trials Group (AACTG). AIDS Care 2000,
12(3):255-266.
27. Mannheimer S, Friedland G, Matts J, Child C, Chesney M: The con-
sistency of adherence to antiretroviral therapy predicts bio-
logic outcomes for human immunodeficiency virus-infected
persons in clinical trials. Clin Infect Dis 2002, 34(8):1115-1121.
28. Fielding KL, Charalambous S, Stenson AL, Pemba LF, Martin DJ,
Wood R, Churchyard GJ, Grant AD: Risk factors for poor virolog-
ical outcome at 12 months in a workplace-based antiretrovi-
ral therapy programme in South Africa: a cohort study. BMC
Infect Dis 2008, 16(8):93.
29. Singh N, Berman SM, Swindells S, Justis JC, Mohr JA, Squier C, Wage-
ner MM: Adherence of human immunodeficiency virus-
infected patients to antiretroviral therapy. Clin Infect Dis 1999,
29(4):824-830.
30. Chen SC, Yu JK, Harries AD, Bong CN, Kolola-Dzimadzi R, Tok TS,
King CC, Wang JD: Increased mortality of male adults with
AIDS related to poor compliance to antiretroviral therapy in
Malawi. Trop Med Int Health 2008, 13(4):513-519.
31. Laurent C, Bourgeois A, Mpoudi-Ngole E, Ciaffi L, Kouanfack C,
Mougnutou R, et al.: Tolerability and effectiveness of first-line
regimens combining nevirapine and lamivudine plus zidovu-
dine or stavudine in Cameroon. AIDS Res Hum Retroviruses 2008,
24(3):393-399.
32. Lawn SD, Myer L, Harling G, Orrell C, Bekker LG, Wood R: Deter-
minants of mortality and nondeath losses from an antiretro-
viral treatment service in South Africa: implications for
program evaluation. Clin Infect Dis 2006, 43(6):770-6.