Báo cáo y học: "Cerebrospinal fluid neopterin: an informative biomarker of central nervous system immune activation in HIV-1 infection" ppt
Bạn đang xem bản rút gọn của tài liệu. Xem và tải ngay bản đầy đủ của tài liệu tại đây (773.91 KB, 12 trang )
Hagberg et al. AIDS Research and Therapy 2010, 7:15
/>Open Access
REVIEW
© 2010 Hagberg et al; licensee BioMed Central Ltd. This is an Open Access article distributed under the terms of the Creative Commons
Attribution License ( which permits unrestricted use, distribution, and reproduction in
any medium, provided the original work is properly cited.
Review
Cerebrospinal fluid neopterin: an informative
biomarker of central nervous system immune
activation in HIV-1 infection
Lars Hagberg*
1
, Paola Cinque
2
, Magnus Gisslen
1
, Bruce J Brew
3
, Serena Spudich
4
, Arabella Bestetti
2
, Richard W Price
4
and Dietmar Fuchs
5
Abstract
HIV-1 invades the central nervous system (CNS) in the context of acute infection, persists thereafter in the absence of
treatment, and leads to chronic intrathecal immunoactivation that can be measured by the macrophage activation
marker, neopterin, in cerebrospinal fluid (CSF). In this review we describe our experience with CSF neopterin
measurements in 382 untreated HIV-infected patients across the spectrum of immunosuppression and HIV-related
neurological diseases, in 73 untreated AIDS patients with opportunistic CNS infections, and in 233 treated patients.
In untreated patients, CSF neopterin concentrations are almost always elevated and increase progressively as
immunosuppression worsens and blood CD4 cell counts fall. However, patients with HIV dementia exhibit particularly
high CSF neopterin concentrations, above those of patients without neurological disease, though patients with CNS
opportunistic infections, including CMV encephalitis and cryptococcal meningitis, also exhibit high levels of CSF
neopterin. Combination antiretroviral therapy, with its potent effect on CNS HIV infection and CSF HIV RNA, mitigates
both intrathecal immunoactivation and lowers CSF neopterin. However, despite suppression of plasma and CSF HIV
RNA to below the detection limits of clinical assays (<50 copies HIV RNA/mL), CSF neopterin often remains mildly
elevated, indicating persistent low-level intrathecal immune activation and raising the important questions of whether
this elevation is driven by continued CNS infection and whether it causes continued indolent CNS injury.
Although nonspecific, CSF neopterin can serve as a useful biomarker in the diagnosis of HIV dementia in the setting of
confounding conditions, in monitoring the CNS inflammatory effects of antiretroviral treatment, and give valuable
information to the cause of ongoing brain injury.
Introduction
History
The AIDS dementia complex (ADC) or HIV-associated
dementia (HAD) was recognized as a novel central ner-
vous system (CNS) disorder early in the AIDS epidemic
[1] and subsequently linked to a pathological substrate of
HIV encephalitis (HIVE) [2]. Not long after this recogni-
tion, a number of investigators sought objective labora-
tory biomarkers in the cerebrospinal fluid (CSF) that
might provide insight into pathogenesis and also aid in
diagnosis and disease staging, which were otherwise
based on the constellation of clinical signs and symptoms
and their impact on functional capacity. This search par-
alleled similar efforts to find blood markers of systemic
disease that could more clearly predict systemic disease
progression and prognosis. Indeed, the CSF studies
examined some of the same biomarkers that were being
studied in blood as systemic disease markers. One of
these was the pteridine metabolite, neopterin, the blood
and urine concentrations of which were found to predict
systemic disease progression [3]. Neopterin was noted to
be elevated in the CSF of HIV-infected patients, and par-
ticularly high levels were reported in patients with ADC/
HIVE, suggesting that this might be a useful CNS disease
marker [4-6]. The origin of neopterin in activated mac-
rophages also fit with emerging recognition of the central
role of these cells in ADC/HIVE pathogenesis [7,8].
* Correspondence:
1
Department of Infectious Diseases, Sahlgrenska University Hospital, University
of Gothenburg; SE 41685 Sweden
Full list of author information is available at the end of the article
Hagberg et al. AIDS Research and Therapy 2010, 7:15
/>Page 2 of 12
However, interest in neopterin and other soluble
immunological biomarkers in blood waned with the
development and widespread clinical use of quantitative
assays of HIV-1 RNA that provided a valuable practical
guide to the pace of disease progression and the effects of
treatment. In parallel attention to CSF immunological
biomarkers, including neopterin, declined after it was
shown that HIV RNA levels could be measured in the
CSF of most untreated patients and that high levels could
often be detected in ADC/HIVE [6,9,10]. Attention also
shifted to other quantitative methods, including anatomi-
cal and functional neuroimaging and neuropsychological
testing, to advance diagnosis and patient characterization
[11].
More recently, several factors have converged to sug-
gest that it might be worthwhile to revisit immunological
CSF biomarkers in general, and neopterin, in particular.
One of these again parallels considerations of systemic
HIV disease and relates to the renewed appreciation of
the importance of immune activation in systemic disease
pathogenesis and progression [12]. A number of studies
show that immunological markers on blood T cells can
provide prognostic information beyond that of the blood
viral load and CD4+ T cell count; in fact, at least one
more recent study shows that blood neopterin can also
add to prognosis even when these other markers are
taken into account [13]. Another is the difficulty in diag-
nosis of ADC/HIVE in many patients currently present-
ing with neurological symptoms and signs within a
background context of drug use, psychiatric disorders,
homelessness and socioeconomical deprivation which,
unfortunately, also frequently reduce access and capacity
to adhere to combination antiretroviral therapy (cART),
leaving these patients with pre-existing neurological dis-
ease particularly vulnerable to progressive HIV disease,
including ADC. These patients may elude diagnosis as
illustrated in one of the case examples described below.
Additionally, if there is a rationale for tailoring drug com-
binations for more effective CNS treatment, it may be
important to predict and diagnose ADC/HIVE by more
objective means than ordinary clinical examination
which can miss diagnosis or by neuropsychological test-
ing which may be affected by other conditions. Finally,
with successful viral suppression by antiviral treatment,
there remains the important question of whether neuro-
logical injury still continues as a result of persistent CNS
infection and immune activation, explaining the high
prevalence of neurocognitive impairment in treated
patients [14]. CSF neopterin might provide a convenient
and reliable measure of ongoing brain pathology. Thus,
CSF neopterin measurement may contribute to address-
ing these several issues.
Approach of this Review
In this review we examine changes in CSF neopterin con-
centrations in the different stages of systemic HIV infec-
tion and HIV-related neurological disease in untreated
patients and the impact of treatment. To examine and
illustrate these issues, we have aggregated a cross-sec-
tional experience derived from four clinical sites (Goth-
enburg, Sweden; Milan, Italy; San Francisco, California
USA; and Sydney, Australia) that span a broad range of
subjects who have been examined in the context of natu-
ral history, treatment and clinical studies. Some of these
patients have been reported as part of smaller previous
reports [6,15-19], but they are now collected together and
supplemented by unpublished experience in order to pro-
vide a broader picture of CSF neopterin changes in HIV
infection.
We will first briefly review the biology of neopterin and
its use as an indicator of macrophage activation in HIV
CNS infection and disease. We will then describe our
experience with this measurement in the aggregate cross-
sectional cohort and also present some longitudinal sub-
ject examples before considering what these findings
indicate and how neopterin might be used in the future.
While CSF neopterin has been known to be elevated in
HIV infection and further increased in ADC/HIVE and
CNS opportunistic infections for more than two decades
[4,5], most studies characterizing the concentrations of
this pteridine have focused on small groups or compared
only restricted subject groups.
Biology of CSF Neopterin
Neopterin is a biochemical product of the guanosine
triphosphate pathway that is both cell-restricted and
inducible by immune-inflammatory stimuli. It is pro-
duced primarily in monocyte/macrophage and related
cells and the most important stimuli are interferons,
especially Th1-type cytokine interferon-γ (IFN-γ) (Figure
1) [3]. Other cells and cytokines have only limited poten-
tial to induce neopterin formation in vitro, but impor-
tantly tumor necrosis factor-α (TNF-α) can accelerate
neopterin synthesis when initiated by IFN-γ [20]. By con-
trast, immunosupressants such as cyclosporin-A, and
Th2-type cytokines including interleukin-4 and -10 coun-
teract the production of neopterin [21]. The same is true
for anti-inflammatory compounds including certain
HMG-CoA reductase inhibitors (statins) and salicylic
acid [22]. The cytokine-induced formation of neopterin
appears to be part of the antimicrobial and antineoplastic
action of macrophages [23].
A strong correlation also exists between neopterin lev-
els and the release of reactive oxygen species (ROS) by
macrophages [24,25], which might be of particular rele-
vance in neurodegeneration. Neopterin also induces the
expression of pro-inflammatory signal transduction ele-
Hagberg et al. AIDS Research and Therapy 2010, 7:15
/>Page 3 of 12
ment nuclear factor-κB (NF-κB) [26,27], and the expres-
sion of cytokines and inflammatory mediators [28], and
intercellular adhesion molecule-1 (ICAM-1) [29]. Pro-
duction of relevant amounts of neopterin is species-
restricted and occurs only in the monocytes/mac-
rophages and astrocytes of primates but not in other ani-
mal species. In these cells neopterin is biosynthesised at
the expense of 5,6,7,8-tetrahydrobiopterin (BH4), the
necessary cofactor of amino acid monoxygenases [30,31].
BH4 is also cofactor of the cytokine-inducible enzyme
nitric oxide synthase (iNOS), one of the most important
cytotoxic reactions of macrophages stimulated by IFN-γ.
However, in human monocytic cells expressing iNOS the
concentrations of BH4 are diminished and thus iNOS
activity may lead to the accumulation of highly toxic and
vasoconstrictory peroxynitrite at the expense of vasodila-
tory nitric oxide. Moreover, neopterin likely participates
in several other important molecular biological pathways
involving macrophages and oxidative stress.
There is often a good correlation between blood and
CSF neopterin concentrations in patients with HIV infec-
tion. An early study also demonstrated a significant cor-
relation between blood neopterin concentrations and the
loss of brain tissue expressed as the ventricle-brain ratio
measured by computed tomography [32]. The parallel
production of systemic and CNS neopterin and ROS pro-
duction may contribute to brain tissue injury in this set-
ting. At the same time, other cytotoxic compounds may
accumulate as a result of CNS immune activation, when
tryptophan is degraded via the kynurenine pathway.
Interferon-γ, some other cytokines as well as the HIV
regulatory protein tat and nef induce activity of the
enzyme indoleamine 2, 3-dioxygenase simultaneously
with neopterin release [33,34]. This enzyme degrades the
essential amino acid tryptophan to N-formyl-kynurenine,
which in macrophages is further converted to the neuro-
toxic substance, quinolinic acid [35]. Thus, neopterin
production appears to be part of the cascade of neuro-
toxic processes in HIV infection, and hence can also serve
as a biomarker of these processes.
A practical further aspect of relevance in considering
the use of CSF neopterin as a disease biomarker in com-
parisons to others, including the cytokines that regulate
its production, is its stability in biological fluids, due to its
rather polar chemical character, ready diffusibility, and
long half-life. By contrast many cytokines (including, for
example, IFN-γ) have short half-lives with biological
activities that rely on effects on neighbouring cells in
close proximity rather than at a distance and that might
not be as well reflected in lumbar CSF. Neopterin appears
to provide a more stable indicator of the aggregate mac-
rophage activation in the CNS compartment. It is also
easily and reliably measured with commercially available
ELISA or RIA (both from BRAHMS, Hennigsdorf, Ger-
many) that have been shown to yield comparable results
[36]. Additionally, these assays have a large dynamic
range that encompasses the concentrations encountered
in physiological and pathological states in human and
other primates. Like all such CSF markers, lumbar CSF
concentrations cannot distinguish a regional source
within the brain or indeed how much was produced
within the brain and how much in the leptomeninges.
The lumbar CSF reflects the aggregate intrathecal activity
after diffusion and intermixing.
CSF Neopterin Across the Spectrum of HIV Infection
To provide a view of the CSF neopterin changes across
the spectrum of HIV infection and HIV-related CNS
injury within the context of other biomarkers, we exam-
ined a cross-sectional sample derived from four clinical
centers that included HIV seronegative subjects,
untreated neuroasymptomatic HIV-infected subjects
grouped according to blood CD4+ T cell, ADC neurolog-
ical diagnoses, two groups of treated HIV-patients and
five groups with CNS opportunistic diseases.
The 53 HIV-seronegative subjects in San Francisco who
volunteered for study lumbar puncture (LP) as controls
were derived from a similar background to the HIV-
infected subjects in San Francisco (mean age 43.9 years);
43 (81%) were male, similar to the proportion in the HIV-
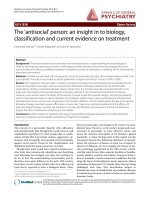
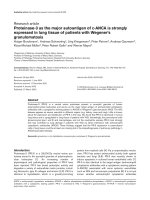
Figure 1 Induction of neopterin formation in brain cells. Pro-in-
flammatory cytokines like interferon-γ (IFN-γ) induce expression of
GTP-cyclohydrolase I in various brain cells. As an intermediate product
7,8-dihydroneopterin-triphosphate is produced which is further con-
verted by pyruvoyl-tetrahydropterin synthase (PTPS) to form 5,6,7,8-
tetrahydrobiopterin (BH4), the cofactor of several aromatic amino acid
monooxygenases that are involved in the production of tyrosine, L-
DOPA, serotonin and nitric oxide. Different from neurons, monocytic
cells possess only low constitutive activity of PTPS. Thus, 7,8-dihydro-
neopterin-triphosphate does not undergo conversion to BH4, rather it
is dephosphorylated and oxidized to neopterin in non-enzymatic reac-
tions.
Guanosine triphosphate (GTP)
GCH I
5,6,7,8-Tetrahydrobiopterin
(BH4)
PTPS
Neurons
IFN-
J
7,8-Dihydroneopterintriphosphate
Neopterin
Macrophage lineage
Dephosphorylation
Oxidation
(e.g., HOCl)
Hagberg et al. AIDS Research and Therapy 2010, 7:15
/>Page 4 of 12
infected subjects. The untreated HIV-infected subjects
without overt neurological disease (referred to as neuroa-
symptomatics, NA) were stratified by blood CD4+ T cell
counts and included: 53 subjects with CD4+ counts <50
cells/μL (mean age 38.9); 69 subjects with CD4+ counts
50-199 cells/μL (mean age 38.6); 69 with counts 200-349
cells/μL (mean age 38.8); and 108 with CD4+ counts >350
cells/μL (mean age 37.5). Untreated patients with ADC
were divided into 30 with Stage 1 (mean age 38.9) and 53
with Stage 2-4 severity (mean age 40.1). Treated subjects
included 150 with plasma HIV RNA suppressed below 50
copies/mL (referred to as treatment successes) (mean age
43.4) and 83 with >50 copies/mL (treatment failures)
(mean age 45.3) after >6 months of treatment. The 73
subjects with CNS opportunistic diseases (referred to
henceforth as opportunistic infections, OIs) included 16
with progressive multifocal leukoencephalopathy (PML),
13 with cytomegalovirus encephalitis (CMV-E), 18 with
toxoplasmic encephalitis (toxo), 16 with cryptococcal
meningitis (crypto) and 10 with primary CNS lymphoma
(PCNSL). CSF neopterin was measured by either EIA or
RIA using the BRAHMS kit and following the manufac-
turer's instructions. The assays were performed in Inns-
bruck (Gothenburg, Milan, Sydney and some of San
Francisco samples) and San Francisco (majority of San
Francisco samples including all HIV negative samples);
while formal quality control comparison between those
two laboratories was not done, samples in this and subse-
quent studies performed in duplicate at both sites were in
close agreement (<12 percent variance). Multiple group
comparisons were analyzed by Kruskal-Wallis test and
Dunn's multiple comparison post hoc tests, two-group
comparisons used the Mann Whitney test, while correla-
tions among variables across groups used Spearman's
test, all performed with Prism 5 (GraphPad Software).
The results of the CSF neopterin determinations on this
aggregate of 741 subjects are shown in Figure 2 along
with blood neopterin, CSF and plasma HIV RNA levels
and CSF white blood cell (WBC) counts to provide con-
text.
CSF Neopterin in Systemic Disease Progression
CSF neopterin was elevated compared to HIV- controls
(mean 5.3, SD 2.2 nmol/L) in untreated HIV infection
across the spectrum of CD4+ T cell decline. Indeed, CSF
neopterin increased as blood CD4+ cells fell, rising from
a mean of 17.9 nmol/L (SD 17.7) in those with CD4+
counts >350 cells/μL, to 21.0 nmol/L (SD 14.2) with
CD4+ cell counts of 200 - 349 cells/μL, and seeming to
plateau in those with 50 - 199 and < 50 cells/μL, with
means of 28.7 and 26.2 (SDs 17.2 and 17.1), respectively
(Figure 2A). Clearly, HIV infection led to almost universal
intrathecal immunoactivation as measured by neopterin,
and this increased as immunosuppression worsens and
CD4+ T cells fell to below 200 cells/μL. In part these
increases in CSF neopterin paralleled those of CSF HIV
RNA levels, and indeed across all of the untreated HIV-
positive subjects without opportunistic disease the CSF
neopterin correlated with the CSF HIV RNA levels (p <
0.0001, Spearman r = 0.4742). However, a notable devia-
tion in this parallel rise was found in the group with
CD4+ T cells below 50 cells/μL in whom the HIV RNA
levels fell below the neuroasymptomatic groups with
higher CD4+ T cells (Figure 2C), while the neopterin did
not. These changes in CSF neopterin were not simply a
reflection of a general increase in CSF inflammation,
though this may provide a partial explanation, since the
CSF WBC counts actually decreased to nearly normal
levels in subjects with <50 CD4+ cells/μL (Figure 2E)
while CSF neopterin remained elevated.
The changes in blood neopterin (Figure 2B) showed a
similar increase with falling CD4+ T cells, and overall
correlated with the CSF neopterin (p < 0.0001, Spearman
r = 0.567), though the levels were lower in the blood, par-
ticularly in the ADC groups. This increase in blood neop-
terin also paralleled the plasma HIV RNA levels (p <
0.0001, r = 0.433) (Figure 2D)
CSF Neopterin in ADC
This group included patients defined by impairment in
their cognitive-motor functional status in daily life and
confirmed by bedside examination (rather than test per-
formance on formal neuropsychological testing) and clas-
sified as ADC stages 1-4 as previously defined [37]. In
brief this staging rates patient's functional disturbance
from mild but definite impairment in daily activities
(Stage 1), to moderate impairment with inability to per-
form the more demanding aspects of daily life (Stage 2),
severe with major intellectual or motor incapacity and
slowing (Stage 3), or end stage disease with nearly vegeta-
tive state and only rudimentary comprehension and
responses (Stage 4)
In the patients with ADC stage 1-4, there was a notable
jump in CSF neopterin (Figure 2A) compared to the neu-
roasymptomatic groups, including those with CD4
counts below 200 with whom they might most appropri-
ately be compared (Figure 2F). This was seen in patients
with Stage 1 and particularly Stage ≥2 ADC who exhib-
ited a marked increase in this CSF marker (means of 47.8
and 76.6 nmol/L, with SD of 27.5 and 55.1 nmol/L,
respectively) compared to the non-ADC groups, while
the two ADC groups did not differ from each other. The
stage 2-4 ADC patients had higher CSF HIV RNA levels
than the other groups (Figure 2C). The ADC groups had
higher CSF WBC counts than the non-ADC group with
<50 CD4+ cells, but other HIV+ groups had similar WBC
counts without such neopterin increase, which clearly
indicates that CSF neopterin in ADC was not caused by
Hagberg et al. AIDS Research and Therapy 2010, 7:15
/>Page 5 of 12
the CSF pleocytosis. Indeed, comparison of CSF neop-
terin and CSF WBC counts across the HIV+ groups
shows a clear dissociation and indicates that the changes
in CSF neopterin with ADC were not simply part of a
non-specific inflammatory response.
Blood neopterin was also higher in the ADC patients,
but did not show the same increase as CSF. Thus, whereas
the increases in blood and CSF levels of neopterin were of
similar magnitude in the neuroasymptomatics (for exam-
ple, mean CSF and blood levels of patients with <50
CD4+ cells/μL were 26.2 and 28.2 nmol/L, respectively),
the increase in blood neopterin in the ADC patients was
notably less marked than in the CSF. Blood neopterin was
higher in the ADC 2-4 than in the NA with CD4+ cell
counts ≥ 200, but not in those below 200.
CSF neopterin in CNS OIs
Because data on the CSF concentrations in CNS OIs in
HIV infection are limited, we included subjects with five
different OIs in this analysis. None of the patients were
on antiretroviral treatment at the time of CSF collection.
The diagnosis was confirmed by positive CSF PCR for JC
virus in progressive multifocal leukoencephalopathy
(PML) and for cytomegalovirus (CMV) in CMV encepha-
litis, by response to treatment for toxoplasmosis, by CSF
cryptococcal antigen or culture, and for primary CNS
lymphoma (PCNSL) by histological confirmation or pre-
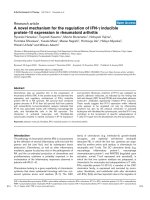
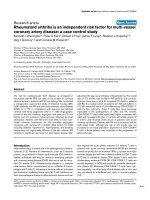
Figure 2 Cross-sectional analysis of CSF neopterin in HIV disease in the context of other CSF and blood measurements. Included are 53 HIV-
seronegative volunteers; untreated HIV positive neurologically asymptomatic (NA) subjects; 53 with CD4+ counts <50 cells/μL (mean age 38.9); 69
subjects with 50-199 cells/μL (mean age 38.6); 69 with counts 200-349 cells/μL (mean age 38.8); and 108 with CD4+ counts >350 cells/μL. Untreated
patients with ADC were divided into 30 with Stage 1, and 53 with Stage 2-4. Treated subjects included 150 with plasma HIV RNA suppressed below
50 copies/mL (treatment successes) and 83 with >50 copies/mL (treatment failures) after >6 months of treatment. The OI group included 73 patients
with CNS opportunistic diseases (see text). The boxes show the 25-50
th
quartile with median bar and mean +, while the whiskers show the 10-90
th
quartile. A. CSF neopterin. Overall ANOVA P < 0.0001, Dunn's post hoc comparisons showed that HIV- group differed from all HIV+ groups (P < 0.001
except Sucesses P < 0.5); ADC 2-4 differed from all NAs (P < 0.01- 0.001) but not from ADC 1 group; the ADC 1 group differed from the NA CD4 >350
(P < 0.05) and 200 - 349 (P < 0.001) but not from other NA groups. The treated successes differed both from all the untreated HIV-infected groups (P
< 0.001) and the HIV negatives (P < 0.05), while the treated failures also differed from the untreated HIV-infected (P < 0.05- 0.001), except those with
CD4 >350, and from the HIV- (P < 0.001). The OI group differed from the NAs with CD4>200 and treated groups but not from those with lower counts
or from ADC groups. B. Plasma neopterin. Statistical analysis was similar to CSF except that ADC 2-4 differed only from the two higher CD4 NAs (P <
0.01- 0.001) and the ADC 1 only from the CD4 >350, and the treatment successes did not differ from the HIV seronegatives while the failures did (P <
0.001). C. CSF HIV RNA. D. Plasma HIV RNA. E CSF WBC counts. F. Blood CD4+ T cell counts. Abbreviations: HIV-, HIV seronegative control group; NA,
neurologically asymptomatic; ADC, AIDS dementia complex; Rx Success, treated with plasma suppression to <50 copies HIV RNA per mL; Rx Failure,
treated with continued plasma viremia with ≥ 50 copies HIV RNA per mL.
CSF Neopterin
HIV-
NA CD4 >350
NA CD4 200-349
NA CD4 50 - 199
NA CD4<50
ADC 1
ADC 2-4
Rx Success
Rx Failure
OIs
0
40
80
120
160
A.
Neopterin (nmol/L)
CSF HIV
HIV-
NA CD4 >350
NA CD4 200-349
NA CD4 50 - 199
NA CD4<50
ADC 1
ADC 2-4
Rx Success
Rx Failure
OIs
1
2
3
4
5
6
7
C.
HIV RNA (log
10
copies/mL)
CSF WBCs
HIV-
NA CD4 >350
NA CD4 200-349
NA CD4 50 - 199
NA CD4<50
ADC 1
ADC 2-4
Rx Success
Rx Failure
OIs
0
10
20
30
40
50
E.
CSF WBCs/uL
Blood Neopterin
HIV-
NA CD4 >350
NA CD4 200-349
NA CD4 50 - 199
NA CD4<50
ADC 1
ADC 2-4
Rx Success
Rx Failure
OIs
0
40
80
120
160
B.
Neopterin (nmol/L)
Plasma HIV
HIV-
NA CD4 >350
NA CD4 200-349
NA CD4 50 - 199
NA CD4<50
ADC 1
ADC 2-4
Rx Success
Rx Failure
OIs
1
2
3
4
5
6
7
D.
HIV RNA (log
10
copies/mL)
Blood CD4
HIV-
NA CD4 >350
NA CD4 200-349
NA CD4 50 - 199
NA CD4<50
ADC 1
ADC 2-4
Rx Success
Rx Failure
OIs
0
500
1000
1500
F.
Blood CD4 Count (cells/
P
L)
Hagberg et al. AIDS Research and Therapy 2010, 7:15
/>Page 6 of 12
sumptively by combining CSF Epstein-Barr virus PCR,
thallium 201 SPECT and lack of response to antitoxoplas-
mic treatment (Figure 3). As a group, the CSF neopterin
in the OIs differed from: the HIV negatives (P < 0.001);
both treatment groups (P < 0.001); NAs with blood CD4
counts >350 cells/μl (P < 0.001); and NAs with CD4 200-
349 (P < 0.05); But they did not differ from the NAs with
CD4 50-199 or <50 or from either ADC group.
Because of the heterogeneity of this OI aggregate
group, we further examined the individual OIs and com-
pared them to two groups with similar CD4 counts, the
NAs with <200 and the ADC 1-4 (both of these groups
derived from combination of two groups from the initial
analysis). As shown in Figure 3, two of the OIs, PML and
toxoplasmosis had relatively low CSF neopterin levels,
and indeed these did not differ from the 152 subjects in
the NA group. By contrast the CSF neopterin was highest
overall in the CMV-E group and intermediate in the cryp-
tococcal and PCNSL groups, both with broad range of
values, with only the toxoplasmosis group differing from
the ADC group (P < 0.05).
Thus, overall, OIs can confound diagnosis of ADC
using CSF neopterin, particularly in the case of CMV
encephalitis which may also be difficult to distinguish by
neuroimaging and non-focal clinical findings, emphasiz-
ing the importance of CSF CMV PCR in this differential
diagnosis. The other OIs can usually be distinguished by
clinical and neuroimaging findings. The relatively low
CSF neopterin in PML is consonant with the paucity of
inflammation pathologically. Since none of these patients
exhibited clinical or radiographic immune reconstitution
inflammatory syndrome (IRIS), it will be of interest in the
future to examine whether neopterin or other CSF
immune inflammatory markers might help to understand
and clinically distinguish and monitor this disorder [38].
CSF Neopterin in Treated Patients
Treated patients were defined as those receiving at least
three antiretroviral drugs (cART). They were divided into
success and failures, according to plasma HIV-1 levels
above or below 50 copies/mL. CSF neopterin was, in gen-
eral, markedly reduced in the two treated patient groups
compared to the untreated subjects, showing that combi-
nation therapy has a potent effect on intrathecal immu-
noactivation. However, as previously reported [18,19],
these reductions fell short of reaching the levels of the
HIV seronegative controls. Thus, the successfully treated
group had a mean CSF neopterin concentration of 10.8
nmol/L (+/-10.3 SD) and the failure group 16.2 nmol/L
(+/-18.5) compared to the HIV- control concentration
mean of 5.3 (+/-2.2). This indicates a state of continued
intrathecal immunoactivation in these treated patients,
and with considerable variability. Whether this continued
activity relates to persistent CNS HIV infection despite
CSF HIV RNA levels below the standard level of labora-
tory detection of 50 copies/mL or to a persistence of
immune activation due to some other cause is an impor-
tant topic of study. We have shown elsewhere that these
low levels of CSF neopterin may relate to continued repli-
cation that can be demonstrated with more sensitive viral
detection methods [39].
While the ANOVA analysis that include all of the
groups did not show a difference between the successes
and failures, a simple comparison between these two
groups suggested a significant difference (p = 0.0004
using Mann Whitney test) consistent with the view that
more effective viral control had an effect on CSF neop-
terin. However in neither group did the levels of CSF
neopterin clearly relate to the penetration and efficacy of
their antiviral drugs, at least as measured by the CNS
penetration-effectiveness (CPE) score or rank as pro-
posed and recently revised by Letendre and colleagues
[40,41]. We analyzed the possible effects of the aggregate
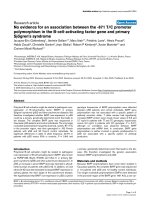
Figure 3 CSF neopterin concentrations in the 73 subjects with
CNS opportunistic diseases (OIs) included 16 with progressive
multifocal leukoencephalopathy (PML), 13 with cytomegalovirus
encephalitis (CMV-E), 18 with toxoplasmic encephalitis (toxo), 16
with cryptococcal meningitis (crypto) and 10 with primary CNS
lymphoma (PCNSL), and for comparison, neuroasymptomatic
HIV positive (NA) subjects with <200 blood CD4 counts (collapsed
from two groups in Figure 2) and ADC 1-4 (also collapsed from
two groups in Figure 2). The box and whiskers and statistical meth-
ods are as described for Figure 2. The CSF neopterin in the PML group
differed from the CMV-E (P < 0.001) and ADC 1-4 group (P < 0.01) but
not from the other OI groups or from the NA group. The CMV enceph-
alitis patients had the highest levels and in addition to differing from
the PML group, differed from the toxoplasmosis patients (P < 0.01) and
neuroasymptomatics (P < 0.001), but not the ADC group. The toxoplas-
mosis group, in addition to differing from the CMV group also differed
from the ADC group (P < 0.05) but not the other OIs or NAs. The cryp-
tococcal meningitis group differed from the NA with low CD4 T cells/
μl (P < 0.05) while the PCNSL group did not differ from the other
groups.
CSF Neopterin in OIs
PML
CMV-E
Toxo
Crypto
PCNSL
NA CD4<200
ADC 1-4
0
40
80
120
160
CSF Neopterin (noml/L)
Hagberg et al. AIDS Research and Therapy 2010, 7:15
/>Page 7 of 12
CNS penetration and efficacy of the patients' antiviral
drugs on CSF neopterin for both the success and failure
groups, and found no correlation either across the entire
group (Spearman's test) or between CPE rank groups.
Figure 4 shows the analysis using the modified 2010 CPE
rank score, and the earlier CPE score gave similar results.
These results also bring up the issue of normal levels of
CSF neopterin. For this study our controls were taken
from a population with a similar range of risks and back-
ground conditions as the HIV-infected subjects. This may
account for the higher mean level in this group than in
other control group studies. In an earlier study of 24
healthy volunteers CSF, neopterin concentrations ranged
between 3.2 and 5.5 nmol/l (mean 4.2 nmol/L) with the
RIA method (Henning/BRAHMS Berlin) [42]. In 47 con-
trol individuals regarded as healthy (aged 18-76 years),
for whom CSF analysis was done because of headache or
vertigo but infection and other diseases were excluded as
much as possible (CSF albumin and cell count were nor-
mal), the mean neopterin concentration was 4.0 nmol/L
(+ 2 SD = 5.9 nmol/L, again using the RIA method)[43].
The normal levels of CSF neopterin increase with age
[42], though we found no significant age effect among
either the HIV negative controls or the infected neuroas-
ymptomatic groups, both of which contained a relatively
restricted age distribution (Spearman's test, not shown).
A later Swedish patient cohort with similar inclusion cri-
teria included 55 individuals and found the mean neop-
terin concentration to be 4.6 nmol/l (SD, 0.7 nmol/L with
the same RIA method). Pooling these three studies pro-
vided a population of 126 individuals with a mean CSF
neopterin value of 4.2 nmol/l (SD, 0.8 nmol/l), and likely
approximates the normal concentrations; using this value
+ 2SD, this would provide a clinical upper limit for nor-
mal CSF neopterin of 5.8 nmol/L encompassing 97.5% of
values. The 53 HIV- subjects shown in Figure 2 were
recruited as control volunteers for comparison with HIV-
infected patients; some were substance abusers, and
hence inclusion was not as stringent with the objective of
approximating the HIV+ population rather than the ideal
'norm'. In this group the mean neopterin concentration
was higher than the Swedish controls at 5.3 nmol/L and
the variance was greater (SD, 2.2 nmol/L) (by EIA
method, Henning Berlin). These measurements were also
all performed in San Fancicsco, and it is possible that this
biased the results. This higher, less stringent figure was
used for comparison in this analysis of HIV effects. How-
ever, whichever of these control values one uses, the
HIV+ subjects, including those treated effectively, all had
higher CSF neopterin concentrations (P < 0.01 - 0.001).
Longitudinal Case Examples of Treatment
Four longitudinal case examples shown in Figure 5 fur-
ther illustrate the CSF neopterin response to treatment
and emphasize some of the dynamics of its change with
disease evolution and treatment. In the figure each case
Figure 4 CSF neopterin in A. Successes and B. Failures. Relation to the revised 2010 CPE rank scores [40]. There were no significant differences in
CSF among these groups, nor was there a correlation when all ranks were considered as a continuous variable. Symbols show the medians and lines
the intraquartile range for each group. Additionally, no correlation was found using the older CPE score system (not shown) [41].
Successes
<=5
6
7
8
9
=>10
0
10
20
30
40
A.
CPE Ranks (Revised 2010)
CSF Neopterin (noml/L)
Failures
<=5
6
7
8
9
=>10
0
10
20
30
40
B.
CPE Ranks (Revised 2010)
CSF Neopterin (noml/L)
Hagberg et al. AIDS Research and Therapy 2010, 7:15
/>Page 8 of 12
(A - D) shows the changes in CSF and blood HIV RNA
levels in the upper panel and the CSF and blood neop-
terin in the lower panel.
The first patient (A) illustrates the rapid decrease in
CSF immune activation and HIV RNA in some patients
with ADC treated with potent cART. It also shows the
dissociation of intrathecal and systemic macrophage acti-
vation at baseline. The response to therapy shows that the
high level of CSF neopterin was 'driven' by HIV infection,
since it improved as quickly as viral replication was inhib-
ited.
Patient A was 33 years old when he presented with
Stage 2 ADC in January, 2000 with both cognitive and
motor (including spastic gait) impairment. This was
his presenting manifestation of HIV infection which
was diagnosed at the same time with a blood CD4+ T
cell count of 133 cells per μL. He was treated with
abacavir, 3TC, nevirapine, and ritonavir-boosted indi-
navir with rapid HIV RNA response in both blood
and CSF (top panel). After a transient increase, his
high CSF neopterin also fell rapidly, and over the year
of follow-up reached a near normal level (6.4 nmol/L).
While his blood neopterin was also elevated and fell,
the magnitude at baseline and subsequent change
were far less than the CSF. Over the same period he
improved clinically and was able to return to acting
school, albeit with mild residual gait stiffness; his per-
formance measured by an aggregate Z score n four
quantitative neurological performance tests (QNPZ-
4) improved from -4.56 to -1.86 [44].
The second patient (B) again illustrates the potent
effects of cART on CSF neopterin. It also illustrates a
phenomenon reported in other 'failing' patients - CSF
HIV RNA levels may remain disproportionately reduced
in the face of drug resistance and poor adherence [45].
Also, as in the larger failures group in Figure 2, the CSF
neopterin was also reduced in this setting, though
remaining above that of HIV seronegatives.
Patient B was 47 years when diagnosed with ADC
Stage 2 in January, 2000, again with a substantially
higher CSF than blood neopterin level. Dementia was
his presenting manifestation of HIV infection and the
blood CD4+ T cell count was 130 cells per μL The
CSF neopterin response was a little slower then in the
previous case when he was treated with ritonavir-
boosted indinavir, zidovudine and lamivudine. It
remained elevated at 21.3 nmol/L at one year when
the CSF (and blood) HIV RNA had reached the limit
of detection (40 copies per mL). Subsequently, his
treatment adherence varied (dashed line in top panel)
and his plasma HIV RNA rose above his pre-treat-
ment level. The CSF HIV RNA level, though detect-
able, did not rise proportionately, nor did his CSF
neopterin which remained modestly elevated, but not
to the baseline level. Over the effective treatment
period his mental status improved clinically.
Figure 5 Four subjects studied longitudinally. For each of the four subjects (A-D) the top panel shows the HIV RNA concentrations and treatment
intervals and the bottom panel the CSF and blood neopterin levels. The symbol definitions in the two A panels apply to all four subjects.
Hagberg et al. AIDS Research and Therapy 2010, 7:15
/>Page 9 of 12
The third patient (C) again illustrates the dissociation
of CSF and blood neopterin levels, even without overt
CNS disease, and the response to cART over a very long
period and after treatment interruption.
Patient C was 51 year in January, 1997 when diag-
nosed with a symptomatic primary HIV infection
with a CD4 cell count of 250 cells per μL. Treatment
was given immediately with indinavir, zidovudine and
lamivudine. He has been followed for 12 years with
yearly lumbar punctures, including a period of treat-
ment, drug holiday, and resumed treatment. As he
stopped his treatment, the CSF neopterin rose to 40.5
nmol/L and when new treatment with efavirenz, aba-
cavir and lamivudine was given, the CSF neopterin
concentration fell to just above normal (6.9 nmol/L).
The final patient (D) illustrates a steady rise in CSF
neopterin that was dissociated from his relatively stable
blood neopterin, proportionally exceeded his log
10
CSF
HIV RNA increase and preceded his clinical presenta-
tion. This suggests not only an increase in CNS infection,
but a switch in its character to a type that associates with
brain injury. In this case, the change in CSF neopterin
might have served as a helpful indicator of the develop-
ment of ADC.
Patient D was 41 years old when he first entered a
longitudinal natural history (the sentinel neurological
cohort, SNC) study in July, 2002. He had a history of
drug abuse and psychiatric disease, both of which
obscured his underlying HIV-related neurological
impairment as he began to develop neurological dis-
ease over the second year of follow-up; this also con-
tributed to his refusal to begin cART. While his blood
and CSF HIV RNA levels gradually increased over the
initial two years of his course, this also did not lead to
starting therapy. His CSF neopterin rose steeply dur-
ing the second year of follow-up at a time when was
judged neurologically stable until he presented with
increasing confusion and was diagnosed with ADC
Stage 1 and a blood CD4+ T cell count of 267 cells per
μL (his nadir). He was hospitalized and began treat-
ment with zidovudine, 3TC and nevirapine. His CSF
neopterin decreased rapidly, then more gradually,
reaching 6.4 nmol/L at the end of follow up. CSF and
plasma RNA were at the limit of detection. He also
recovered clinically with eventual restoration to nor-
mal activities with his QNPZ-4 improving from -2.28
before treatment to 0.45 after.
Pathobiological Implications of CSF Neopterin
Changes in HIV
Together the presented data, along with earlier studies,
show that neopterin is produced in the intrathecal space
(higher CSF than blood concentrations) and that
increased CSF concentrations of this pteridine indicate a
nearly universal state of enhanced macrophage activation
within the CNS in HIV infection. Its elevation with infec-
tion and rapid decrease with treatment show that it is
ultimately driven by HIV infection. However, in ADC
patients, the levels of CSF neopterin rise above those in
neuroasymptomatic patients with comparable systemic
and CSF HIV RNA concentrations and pleocytosis. One
speculation is that to some extent neopterin is produced
in the meningeal and perivascular spaces in relation to
local infection, but that in ADC and its underlying sub-
strate, HIVE, the character of infection and its capacity to
produce neopterin changes as infected and uninfected
macrophages and microglia are activated. Extending this
hypothetical framework, the augmented neopterin in
these patients may indicate autonomous compartmental-
ized HIV infection within CNS macrophages [46],
whereas infection in the non-ADC patients may be
largely transitory, non-compartmentalized and supported
within lymphocytes with less robust stimulation of mac-
rophages. Of course, these associations need to be more
directly established, but they provide an attractive bridge
between these observations on neopterin and virological
studies showing that virus detected in CSF likely has at
least two origins [47,48].
CSF Neopterin in Clinical Management of HIV
Infection
Given the changes in CSF neopterin and its relation to the
critical process of immunoactivation within the CNS, one
can ask whether there might be a role for measurement of
this CSF biomarker in clinical practice, including diagno-
sis, prognosis and treatment evaluation related to CNS
injury.
Diagnosis
When HIV-infected patients present with neurological
abnormalities, the character of symptoms and signs leads
to appropriate evaluations for opportunistic infections,
malignancies, vascular diseases and other afflictions
using neuroimaging and other modalities. Absence of
focal clinical or neuroimaging toxoplasmosis/CNS lym-
phoma findings, and negative CSF analysis for CMV,
other herpes virus, JCV, EBV and cryptococcus supports
the ADC/HIVE diagnosis.
To assess the value of CSF neopterin in this setting, we
used the cross-sectional study results shown in Figure 2.
For this analysis we excluded CNS opportunistic infec-
tions, though one should caution that, especially CMV-
encephalitis, cryptoccal meningitis and CNS lymphoma,
may also elevate CSF neopterin to levels seen in patients
with ADC. Using this cross-sectional study data, we con-
structed a series of receiver-operator characteristic
(ROC) curves to estimate the sensitivity and specificity of
CSF neopterin in the diagnosis of ADC. Figure 6 shows
Hagberg et al. AIDS Research and Therapy 2010, 7:15
/>Page 10 of 12
two of these in which ADC 2-4 (A) and ADC 1-4 (B) were
compared to the four groups of untreated neuroasymp-
tomatic subjects. From this analysis, if one uses a cutoff of
CSF neopterin ≥ 30 nmol/L, the sensitivity for a diagnosis
of ADC 2-4 is 80% and the specificity 81% (likelihood
ratio = 4.2). For ADC 1-4 the sensitivity drops to 71%,
while the specificity remains at 81% (likelihood ratio =
3.8). A higher cut off of 40 nmol/L yields sensitivity for
ADC 2-4 of 72%, specificity of 93% and likelihood ration
of 9.8, while for ADC 1-4 the sensitivity of 66%, specific-
ity again 93% and the likelihood ratio is 8.9.
Thus, measuring the CSF neopterin has diagnostic
value in ADC, though not to a degree to provide suffi-
ciently certain diagnosis on its own. The reasons for this
uncertainty relate principally to the overlap of the neu-
roasymptomatic subjects into the range of the ADC sub-
jects, particularly the ADC 1 group. There are several
explanations for this beyond a true biological overlap in
CSF neopterin. These include imprecision of clinical
diagnosis in classifying our subjects. Thus, some of the
neuroasymptomatics may indeed have had incipient or
unrecognized brain injury. Case D provides an example
where CSF neopterin elevation indeed predicted clinical
presentation. On the other hand, some patients diag-
nosed as ADC might have suffered other conditions. At
the present time there is no objective 'gold standard' for
this diagnosis.
Prognosis
Is it possible to use CSF neopterin concentrations as a
prognostic marker? In a prospectively studied cohort of
35 neurologically asymptomatic HIV-infected patients,
CSF neopterin above 20 nmol/l had almost 7 times the
risk of developing ADC, but the risk did not increase fur-
ther when CSF neopterin was above 40 nmol/L [16].
These patients were neurologically asymptomatic at
inclusion but had advanced HIV infection as measured by
CD4+ cell count (<200 cells/μl) and the median follow-up
time was 21 months. In a longitudinal retrospective study
with a longer follow up time CSF neopterin concentration
did not predict dementia development in 8 patients com-
pared with matched controls, although these patients had
higher CD4 cell count [49]. In the same study, however,
the neurofilament light chain protein (NFL), a CSF bio-
marker of axonal injury, predicted dementia development
[49]. Further studies comparing markers and using
marker combinations may help to clarify this issue.
Treatment effect
The goal for antiretroviral treatment is to eliminate mor-
tality and morbidity related to organ dysfunction, includ-
ing the CNS, related directly or indirectly to HIV
infection. We generally measure this efficacy using the
surrogate, plasma HIV RNA level. However, there is
growing concern that CNS morbidity can continue
despite treatment that suppresses plasma, and even CSF,
viremia, at least as measured by conventional clinical
assays [50]. Can CSF neopterin provide a more refined
measure of successful amelioration of CNS infection and,
more particularly, ongoing CNS injury?
Combination ART has a profound effect on CSF viral
load and neopterin levels as shown above and reported
previously [51]. Hence, looking at the positive side, CSF
neopterin is reduced by therapy to levels below those of
asymptomatic infection and well below those characteris-
tic of ADC. However, looking at the 'half-empty' side,
these levels often remain above normal. Does this indi-
cate ongoing infection and should further efforts be made
in the individual patient to assure that they indeed return
to normal? Some antiretroviral drugs appear to be more
effective in reducing CSF viral load and possibly CNS
immunoactivation, and it has been suggested that CNS
drug penetration may be an important aspect of treat-
ment in general [41]. Our results failed to show a rela-
tionship between the CPE scores that take into account
CNS drug penetration and CSF neopterin levels. While
Figure 6 ROC curves for two comparisons. A. ADC 2-4 was com-
pared to the four groups of untreated neuroasymptomatics. B ADC 1-
4 (ADC 1 group and 2-4 group combined) was compared to the four
groups of NAs. AUC, area under the ROC concentration curve where 1
is high and 0.5 not different from random.
A. ROC Curve of ADC 2-4 vs NAs
0 20
40 60 80 100
0
20
40
60
80
100
AUC=
0.8831
100% - Specificity%
Sensitivity
B. ROC Curve of ADC 1-4 vs NAs
0 20 40
60 80 100
0
20
40
60
80
100
AUC=
0.8585
100% - Specificity%
Sensitivity
Hagberg et al. AIDS Research and Therapy 2010, 7:15
/>Page 11 of 12
our study was not designed to test this issue and there
were few subjects in the lower score range, these results
may suggest that other drug properties are important in
determining the effect on CNS immunoactivation in this
setting.
Persistent low-level neopterin production might per se
be associated with chronic CNS damage, as expression of
intrathecal immune activation and also because of its
probable neurotoxic effect. Given the long lifespan of
HIV-infected persons, these effects might, in the long-
term, combine with CNS insults typical of the older age
and contribute to functional neurological impairment.
Conclusions
Combination antiretroviral drug treatment has had a dra-
matic effect on morbidity and mortality of HIV infection,
including those involving the CNS and the previously
most common of these, ADC/HIVE. The study of CSF
neopterin has contributed to our understanding of CNS
HIV infection and its consequences. As attention now
turns to the potential CNS effects of lower grade immu-
noactivation before or in the presence of treatment, con-
tinued study of CSF neopterin may turn out to be helpful
in this next phase of understanding pathogenesis and
designing and evaluating therapeutics. We do not under-
stand the consequences of chronic immune activation in
these settings and whether interventions can be tailored
to reduce any deleterious effects. Hence, further studies
are needed to evaluate this as well as whether particular
antiretroviral drug combinations may more effectively
minimize such immune activation. Although nonspecific,
we think that neopterin concentration is a useful bio-
marker in monitoring this CNS immune activation and
its potential consequences, and in evaluating the effects
of different antiviral and even adjuvant strategies that
have proved so difficult to assess using neurological
symptoms or signs, neurocognitive performance or CSF
viral loads. CSF neopterin may prove to be a valuable sur-
rogate to address these important issues.
Declaration of interests
The authors declare that they have no competing inter-
ests.
Authors' contributions
LH, PC, RWP, MG, BJB, SS, and AB collected CSF samples and made the subject
evaluations. DF and RWP were responsible for the biochemical analyses. The
study was planned and interpreted and the data were reviewed and revised by
all the authors. LH and RWP prepared the manuscript. All authors read and
approved the final manuscript.
Acknowledgements
The study was supported by; Sahlgrenska Academy at the University of Goth-
enburg (ALFGBG-11067), Swedish Research Council (project 2007-7092),
NHMRC program grant #358399, National Institutes of Health grants R01
MH62701, K23 MH074466, and UL1 RR024131.
Author Details
1
Department of Infectious Diseases, Sahlgrenska University Hospital, University
of Gothenburg; SE 41685 Sweden,
2
Department of Infectious Diseases, San
Raffaele Scientific Institute, Milan, Italy,
3
Departments of Neurology and HIV
Medicine, St. Vincent's Centre for Applied Medical Research St. Vincent's
Hospital, University of New South Wales, Sydney, Australia,
4
Department of
Neurology, University of California San Francisco, San Francisco, CA, USA and
5
Division of Biological Chemistry, Biocenter, Innsbruck Medical University,
Innsbruck, Austria
References
1. Navia BA, Jordan BD, Price RW: The AIDS dementia complex: I. Clinical
features. Ann Neurol 1986, 19(6):517-524.
2. Navia BA, Cho ES, Petito CK, Price RW: The AIDS dementia complex: II.
Neuropathology. Ann Neurol 1986, 19(6):525-535.
3. Fuchs D, Spira TJ, Hausen A, Reibnegger G, Werner ER, Felmayer GW,
Wachter H: Neopterin as a predictive marker for disease progression in
human immunodeficiency virus type 1 infection. Clin Chem 1989,
35(8):1746-1749.
4. Fuchs D, Chiodi F, Albert J, Asjo B, Hagberg L, Hausen A, Norkrans G,
Reibnegger G, Werner ER, Wachter H: Neopterin concentrations in
cerebrospinal fluid and serum of individuals infected with HIV-1. AIDS
(London, England) 1989, 3(5):285-288.
5. Sonnerborg AB, von Stedingk LV, Hansson LO, Strannegard OO: Elevated
neopterin and beta 2-microglobulin levels in blood and cerebrospinal
fluid occur early in HIV-1 infection. AIDS (London, England) 1989,
3(5):277-283.
6. Brew BJ, Bhalla RB, Paul M, Gallardo H, McArthur JC, Schwartz MK, Price
RW: Cerebrospinal fluid neopterin in human immunodeficiency virus
type 1 infection. Ann Neurol 1990, 28(4):556-560.
7. Anderson E, Zink W, Xiong H, Gendelman HE: HIV-1-associated
dementia: a metabolic encephalopathy perpetrated by virus-infected
and immune-competent mononuclear phagocytes. J Acquir Immune
Defic Syndr 2002, 31(Suppl 2):S43-54.
8. Williams KC, Hickey WF: Central nervous system damage, monocytes
and macrophages, and neurological disorders in AIDS. Annu Rev
Neurosci 2002, 25:537-562.
9. McArthur JC, McClernon DR, Cronin MF, Nance-Sproson TE, Saah AJ, St
Clair M, Lanier ER: Relationship between human immunodeficiency
virus-associated dementia and viral load in cerebrospinal fluid and
brain. Ann Neurol 1997, 42(5):689-698.
10. Brew BJ, Pemberton L, Cunningham P, Law MG: Levels of human
immunodeficiency virus type 1 RNA in cerebrospinal fluid correlate
with AIDS dementia stage. The Journal of infectious diseases 1997,
175(4):963-966.
11. Antinori A, Arendt G, Becker JT, Brew BJ, Byrd DA, Cherner M, Clifford DB,
Cinque P, Epstein LG, Goodkin K, et al.: Updated research nosology for
HIV-associated neurocognitive disorders. Neurology 2007,
69(18):1789-1799.
12. Kuller LH, Tracy R, Belloso W, De Wit S, Drummond F, Lane HC,
Ledergerber B, Lundgren J, Neuhaus J, Nixon D, et al.: Inflammatory and
coagulation biomarkers and mortality in patients with HIV infection.
PLoS Med 2008, 5(10):e203.
13. Mildvan D, Spritzler J, Grossberg SE, Fahey JL, Johnston DM, Schock BR,
Kagan J: Serum neopterin, an immune activation marker,
independently predicts disease progression in advanced HIV-1
infection. Clin Infect Dis 2005, 40(6):853-858.
14. Cysique LA, Brew BJ: Neuropsychological functioning and antiretroviral
treatment in HIV/AIDS: a review. Neuropsychol Rev 2009, 19(2):169-185.
15. Gisslen M, Chiodi F, Fuchs D, Norkrans G, Svennerholm B, Wachter H,
Hagberg L: Markers of immune stimulation in the cerebrospinal fluid
during HIV infection: a longitudinal study. Scand J Infect Dis 1994,
26(5):523-533.
16. Brew BJ, Dunbar N, Pemberton L, Kaldor J: Predictive markers of AIDS
dementia complex: CD4 cell count and cerebrospinal fluid
concentrations of beta 2-microglobulin and neopterin. The Journal of
infectious diseases 1996, 174(2):294-298.
17. Gisslen M, Fuchs D, Svennerholm B, Hagberg L: Cerebrospinal fluid viral
load, intrathecal immunoactivation, and cerebrospinal fluid monocytic
Received: 25 February 2010 Accepted: 3 June 2010
Published: 3 June 2010
This article is available from: 2010 Hagberg et al; licensee BioMed Central Ltd. This is an Open Access article distributed under the terms of the Creative Commons Attribution License ( which permits unrestricted use, distribution, and reproduction in any medium, provided the original work is properly cited.AIDS Resear ch and Therapy 2010, 7:15
Hagberg et al. AIDS Research and Therapy 2010, 7:15
/>Page 12 of 12
cell count in HIV-1 infection. J Acquir Immune Defic Syndr 1999,
21(4):271-276.
18. Abdulle S, Hagberg L, Svennerholm B, Fuchs D, Gisslen M: Continuing
intrathecal immunoactivation despite two years of effective
antiretroviral therapy against HIV-1 infection. AIDS (London, England)
2002, 16(16):2145-2149.
19. Eden A, Price RW, Spudich S, Fuchs D, Hagberg L, Gisslen M: Immune
activation of the central nervous system is still present after >4 years of
effective highly active antiretroviral therapy. The Journal of infectious
diseases 2007, 196(12):1779-1783.
20. Werner-Felmayer G, Werner ER, Fuchs D, Hausen A, Reibnegger G,
Wachter H: Tumour necrosis factor-alpha and lipopolysaccharide
enhance interferon-induced tryptophan degradation and pteridine
synthesis in human cells. Biol Chem Hoppe Seyler 1989,
370(9):1063-1069.
21. Weiss G, Murr C, Zoller H, Haun M, Widner B, Ludescher C, Fuchs D:
Modulation of neopterin formation and tryptophan degradation by
Th1- and Th2-derived cytokines in human monocytic cells. Clin Exp
Immunol 1999, 116(3):435-440.
22. Neurauter G, Wirleitner B, Laich A, Schennach H, Weiss G, Fuchs D:
Atorvastatin suppresses interferon-gamma -induced neopterin
formation and tryptophan degradation in human peripheral blood
mononuclear cells and in monocytic cell lines. Clin Exp Immunol 2003,
131(2):264-267.
23. Hoffmann G, Wirleitner B, Fuchs D: Potential role of immune system
activation-associated production of neopterin derivatives in humans.
Inflamm Res 2003, 52(8):313-321.
24. Nathan CF: Peroxide and pteridine: a hypothesis on the regulation of
macrophage antimicrobial activity by interferon gamma. Interferon
1986, 7:125-143.
25. Weiss G, Fuchs D, Hausen A, Reibnegger G, Werner ER, Werner-Felmayer G,
Semenitz E, Dierich MP, Wachter H: Neopterin modulates toxicity
mediated by reactive oxygen and chloride species. FEBS Lett 1993,
321(1):89-92.
26. Hoffmann G, Schobersberger W, Frede S, Pelzer L, Fandrey J, Wachter H,
Fuchs D, Grote J: Neopterin activates transcription factor nuclear factor-
kappa B in vascular smooth muscle cells. FEBS Lett 1996, 391(1-
2):181-184.
27. Cirillo P, Pacileo M, S DER, Calabro P, Gargiulo A, Angri V, Granato-
Corigliano F, Fiorentino I, Prevete N, R DEP, et al.: Neopterin induces pro-
atherothrombotic phenotype in human coronary endothelial cells. J
Thromb Haemost 2006, 4(10):2248-2255.
28. Hoffmann G, Frede S, Kenn S, Smolny M, Wachter H, Fuchs D, Grote J,
Rieder J, Schobersberger W: Neopterin-induced tumor necrosis factor-
alpha synthesis in vascular smooth muscle cells in vitro. Int Arch Allergy
Immunol 1998, 116(3):240-245.
29. Hoffmann G, Rieder J, Smolny M, Seibel M, Wirleitner B, Fuchs D,
Schobersberger W: Neopterin-induced expression of intercellular
adhesion molecule-1 (ICAM-1) in type II-like alveolar epithelial cells.
Clin Exp Immunol 1999, 118(3):435-440.
30. Werner-Felmayer G, Golderer G, Werner ER: Tetrahydrobiopterin
biosynthesis, utilization and pharmacological effects. Curr Drug Metab
2002, 3(2):159-173.
31. Cano OD, Neurauter G, Fuchs D, Shearer GM, Boasso A: Differential effect
of type I and type II interferons on neopterin production and amino
acid metabolism in human astrocyte-derived cells. Neurosci Lett 2008,
438(1):22-5.
32. Fuchs D, Moller AA, Reibnegger G, Stockle E, Werner ER, Wachter H:
Decreased serum tryptophan in patients with HIV-1 infection
correlates with increased serum neopterin and with neurologic/
psychiatric symptoms. J Acquir Immune Defic Syndr 1990, 3(9):873-876.
33. Smith DG, Guillemin GJ, Pemberton L, Kerr S, Nath A, Smythe GA, Brew BJ:
Quinolinic acid is produced by macrophages stimulated by platelet
activating factor, Nef and Tat. J Neurovirol 2001, 7(1):56-60.
34. Werner ER, Bitterlich G, Fuchs D, Hausen A, Reibnegger G, Szabo G, Dierich
MP, Wachter H: Human macrophages degrade tryptophan upon
induction by interferon-gamma. Life Sci 1987, 41(3):273-280.
35. Freeze ASK, During MJ, Martin JB: Kynurenine metabolites of
tryptophan: Implications for neurological diseases. Neurology 1990,
40:691-695.
36. Mayersbach P, Augustin R, Schennach H, Schonitzer D, Werner ER,
Wachter H, Reibnegger G: Commercial enzyme-linked immunosorbent
assay for neopterin detection in blood donations compared with RIA
and HPLC. Clin Chem 1994, 40(2):265-266.
37. Price RW, Brew BJ: The AIDS dementia complex. The Journal of infectious
diseases 1988, 158(5):1079-1083.
38. Cinque PKI, Gerevini S, Miro JM, Price RW: Progressive multifocal
leukoencephalopathy in HIV-1 infection. Lancet Infect Dis 2009,
9:625-636.
39. Yilmaz A, Price RW, Spudich S, Fuchs D, Hagberg L, Gisslen M: Persistent
intrathecal immune activation in HIV-1-infected individuals on
antiretroviral therapy. J Acquir Immune Defic Syndr 2008, 47(2):168-173.
40. Letendre S, FitzSimons C, Ellis R, Clifford D, Collier A, Gelman B, McArthur J,
Vaida F, Heaton R, Grant I: Correlates of CSF Viral Loads in 1221
Volunteers of the CHARTER Cohort. 17th Conference on Retroviruses and
Opportunistic Infections. San Francisco, CA, US 2010.
41. Letendre S, Marquie-Beck J, Capparelli E, Best B, Clifford D, Collier AC,
Gelman BB, McArthur JC, McCutchan JA, Morgello S, et al.: Validation of
the CNS Penetration-Effectiveness rank for quantifying antiretroviral
penetration into the central nervous system. Archives of neurology 2008,
65(1):65-70.
42. Hagberg L, Dotevall L, Norkrans G, Larsson M, Wachter H, Fuchs D:
Cerebrospinal fluid neopterin concentrations in central nervous
system infection. The Journal of infectious diseases 1993,
168(5):1285-1288.
43. Hagberg LAl-M, Abdulle S, Gisslén M: Clinical application of
cerebrospinal fluid neopterin concentrations in HIV infection.
Pteridines 2004, 15:102-106.
44. Price RW, Yiannoutsos CT, Clifford DB, Zaborski L, Tselis A, Sidtis JJ, Cohen
B, Hall CD, Erice A, Henry K: Neurological outcomes in late HIV infection:
adverse impact of neurological impairment on survival and protective
effect of antiviral therapy. AIDS Clinical Trial Group and Neurological
AIDS Research Consortium study team. AIDS (London, England) 1999,
13(13):1677-1685.
45. Spudich S, Lollo N, Liegler T, Deeks SG, Price RW: Treatment benefit on
cerebrospinal fluid HIV-1 levels in the setting of systemic virological
suppression and failure. The Journal of infectious diseases 2006,
194(12):1686-1696.
46. Schnell G, Spudich S, Harrington P, Price RW, Swanstrom R:
Compartmentalized human immunodeficiency virus type 1 originates
from long-lived cells in some subjects with HIV-1-associated dementia.
PLoS Pathog 2009, 5(4):e1000395.
47. Strain MC, Letendre S, Pillai SK, Russell T, Ignacio CC, Gunthard HF, Good B,
Smith DM, Wolinsky SM, Furtado M, et al.: Genetic composition of human
immunodeficiency virus type 1 in cerebrospinal fluid and blood
without treatment and during failing antiretroviral therapy. J Virol
2005, 79(3):1772-1788.
48. Caragounis EC, Gisslen M, Lindh M, Nordborg C, Westergren S, Hagberg L,
Svennerholm B: Comparison of HIV-1 pol and env sequences of blood,
CSF, brain and spleen isolates collected ante-mortem and post-
mortem. Acta Neurol Scand 2008, 117(2):108-116.
49. Gisslen M, Hagberg L, Brew BJ, Cinque P, Price RW, Rosengren L: Elevated
cerebrospinal fluid neurofilament light protein concentrations predict
the development of AIDS dementia complex. The Journal of infectious
diseases 2007, 195(12):1774-1778.
50. Brew BJ, Crowe SM, Landay A, Cysique LA, Guillemin G:
Neurodegeneration and ageing in the HAART era. J Neuroimmune
Pharmacol 2009, 4(2):163-174.
51. Gisslen M, Svennerholm B, Fuchs D, Hagberg L: Neurological efficacy of
stavudine, zidovudine, and lamivudine. Lancet 1998,
352(9125):402-403.
doi: 10.1186/1742-6405-7-15
Cite this article as: Hagberg et al., Cerebrospinal fluid neopterin: an informa-
tive biomarker of central nervous system immune activation in HIV-1 infec-
tion AIDS Research and Therapy 2010, 7:15