Báo cáo y học: "Identifying individuals with virologic failure after initiating effective antiretroviral therapy: The surprising va" potx
Bạn đang xem bản rút gọn của tài liệu. Xem và tải ngay bản đầy đủ của tài liệu tại đây (301.47 KB, 7 trang )
RESEARC H Open Access
Identifying individuals with virologic failure after
initiating effective antiretroviral therapy: The
surprising value of mean corpuscular hemoglobin
in a cross-sectional study
Bryan Lau
1*
, Geetanjali Chander
2
, Stephen J Gange
1
, Richard D Moore
1,2
Abstract
Objective: Recent studies have shown that the current guidelines suggesting immunologic monitoring to
determine response to highly active antiretroviral therapy (HAAR T) are inadequate. We assessed whether routinely
collected clinical markers could improve prediction of concurrent HIV RNA levels.
Methods: We included individuals followed within the Johns Hopkins HIV Clinical Cohort who initiated
antiretroviral therapy and had concurrent HIV RNA and biomarker measurements ≥4 months after HAART. A two
tiered approach to determine whether clinical markers could improve prediction included: 1) identification of
predictors of HIV RNA levels >500 copies/ml and 2) construction and validation of a prediction model.
Results: Three markers (mean corpuscular hemoglobin [MCH], CD4, and change in percent CD4 from pre-HAART
levels) in addition to the change in MCH from pre-HAART levels contained the most predictive information for
identifying an HIV RNA >500 copies/ml. However, MCH and change in MCH were the two most predictive
followed by CD4 and change in percent CD4. The logistic prediction model in the validation data had an area
under the receiver operating characteristic curve of 0.85, and a sensitivity and specificity of 0.74 (95% CI: 0.69-0.79)
and 0.89 (95% CI: 0.86-0.91), respectively.
Conclusions: Immunologic criteria have been shown to be a poor guideline for identifying individuals with high
HIV RNA levels. MCH and change in MCH were the strongest predictors of HIV RNA levels >500. When combined
with CD4 and percent CD4 as covariates in a model, a high level of discrimination between those with and
without HIV RNA levels >500 was obtained. These data suggest an unexplored relationship between HIV RNA and
MCH.
Introduction
Current World Health Organization guidelines recom-
mend using CD4 counts to monitor treatment response
to highly active antiretroviral therapy (HAART) in
regions where HIV viral load testing is unavailable [1].
However, recent reports suggest that monitoring CD4
counts does not accurately classify individuals who have
not successfully suppressed HIV RNA levels [2-4]. One
study, from Uganda, examined whether CD4 counts and
CD4 percentages could be used to classify individuals as
above or below four thresholds of HIV RNA (50, 500,
1000, and 5000) and at three time points (6, 12, and 18
months) after the initiation of treatment [3]. Various
classification schemes based upon CD4 counts (e.g. an
increase in CD4 count from 0 to 6 months) or CD4 per-
centage provided a sensitivity range of only 0.04-0.62 for
detecting individuals with HIV RNA above 500 [3]. We
examined whether other clinical markers that are routi-
nely assessed within the J ohns Hopkins HIV Clinical
Cohort (JHHCC) could provide b etter classification of
individuals who do not have suppressed HIV RNA levels
using a novel approach.
* Correspondence:
1
Department of Epidemiology, Johns Hopkins Bloomberg School of Public
Health, 615 N. Wolfe Street, Baltimore, Maryland 21205, USA
Full list of author information is available at the end of the article
Lau et al. AIDS Research and Therapy 2010, 7:25
/>© 2010 Lau et al; li censee BioMed Central Ltd. T his is an Open Access article distributed under the terms of the Cre ative Commons
Attribution License ( which permits unre stricted use, distribution, and reproduction in
any medium, pro vided the original work is properly cited.
Methods
The JHHCC was established to prospectively quantify the
processes and outcomes of care for HIV-in fected indivi-
duals seen in clinical practice in the Baltimore metropoli-
tan area [5]. All patients give informed consent and the
JHHCC is conducted in accordance with the ethical stan-
dardsoftheJohnsHopkinsInstitutional Review Board
and with the Helsinki Declaration of 1975. Subjects
included in this analysis were individuals who initiated
HAART after January 1, 2000 and had an HIV RNA mea-
surement at least 4 months after initiation. Each indivi-
dual also had to have at least one of the biological
markers (listed below) measured within 60 days before or
30 days after the time of HIV RNA measurement. Only a
single record of HIV RNA (the first measurement occur-
ring at least 4 months after HAART initiation) and clini-
cal markers for each individual was included in the
analyses. All individuals were still on treatment at the
time of their HIV RNA measurement.
We utilized a random forest approach to evaluate the
ability of routinely collected clinical markers to classify
individuals as greater or less than 500 HIV RNA copies/
ml. Random-forests are an algorith mic, non-parametric
approach to identify prognostic variables and are robust
to over fitting the data [6,7]. These methods are an exten-
sion of classification and regression trees (CART) which
by introducing randomness in variable selection and have
been shown to have lower error and better classification
rates [6,8]. Briefly, individual classification trees were
generated from random bootstrap samples from the data
set. Each node of the tree (or branch point) was created
by selecting a random subset of candidate classification
variables. As with standard CART methods, nodes were
split by variables that optimize a splitting criteria and
each tree is grown to full size. Because each classification
tree was dev eloped from a bootstrap sample of the study
population, a subset of the study population remained
unused for that tree; this subset was used to validate the
tree and estimate the classification error. Ultimately, the
random forest approach provides a measure of each vari-
able’s importance by examining (in the validation subset)
the increase in error rate when the variable is ignored
[6,8]. This consists of running the data from the subset of
individuals not chosen in the bootstrap sample through
the tree while permuting each covariate in turn. Thus
each covariate has a set of error rates (obtained from
each tree) for when the specific covariate has and has not
bee n permuted. The change in the error rate is summar-
ized over all trees in the random forest and divided by
the standard error to provide a standardized change in
error rate. If a variable did not truly have prognostic
importance then the change in error rate should be dis-
tributed around 0 and normally distributed.
The random-forest approach was used to search for
prognostic variables among the following measures:
absolute CD4, percent CD4, serum albumin, alanine
aminotransferase, aspartate aminotransfer ase, creatinine,
hemoglobin, total lymphocyte, eosinophil, and neutro-
phil counts, potassium, calcium, chloride, CD3 counts,
red blood cell count, mean corpuscular hemoglobin
(MCH), mean corpuscular hemoglobin concentration
(MCHC), mean corpu scular volume (MCV), packed cell
volume, platelet count, alkali ne phosphatase, CO
2
,
direct billirubin, and HAART regimen (protease inhibi-
tor [PI], non-nucleoside [NNRTI], triple nucleoside
[NRTI], and dual regimen containing bo th PI a nd
NNRTI based regimens). The measured value up to 1
year preceding HAART initiation, and the correspond-
ing difference between post-HAART an d pre-HAART
values, were included (e.g. change in MCH = [post-
HAART MCH] - [pre-HAART MCH]). Individual s who
were missing marker measurements had values imputed
using the approac h for imputation in random-forests as
outlined by Brieman [9] (R Foundation for Statistical
Computing, Vienna, Austria: ).
Imputation in random forests maintains accuracy when
up to 80% of the data are missing [9].
Initially the random forest included all covariates to
determine an overall error rate and order of the variable
importance. Utilizing this information, we constructed
another random forest limiting the covariates to the 12
most important variables. Subsequently we continued to
prune covariates from the random forest by eliminating
the least predi ctive variables until we reached a random
forest consisting of variables which had a variable
importance above 1.96 as a cutoff since a non-prognos-
tic variable should be normally distributed.
While, the random-forest approach prov ides an excel-
lent method for identification of important, prognostic
variables, it un fortunately does not produce a familiar
regression equation that c an be easily disseminated
through printed material. Furthermore, the random-for-
est may conta in thousands of trees and therefore cannot
be easily included in a figure. Thus, we utilized the ran-
dom-forest results to identify variables that had the
most predictive capability based upon the variable
importance measure. We then used these variables to
construct a logistic model with HIV RNA above
500 cps/ml as the outcome and the concurrent markers
(or change from pre-HAART levels) were included as
covariates. Because of the missing data, we re-imputed
the missing data 20 times to account for the variability
in the imputation process and summarized the results of
the logistic model for multiple imputation [10]. To opti-
mally assess the classification error of both the random-
forest and logistic model, we reserved one-half of the
Lau et al. AIDS Research and Therapy 2010, 7:25
/>Page 2 of 7
study population as a cross-validation set. The models
calibration was examined by splitting the predicted
probabilities from the logistic model into 8 quantiles
(each consisting of 98 indviduals) and assessing the
observed probability of having an HIV RNA above 500
copies/ml as compared to the mean predicted probabil-
ity in each quantile group [11].
To determine how well the models were able to dis-
criminate between those who did and did not have an
HIV RNA above 500 copies/ml, we relied primarily on
the receiver o perating characteristic (ROC) curve and
the area under the receiver operating characteristic
(AUROC) curve. An ROC curve is the relationship
between sensitivity and specificity when different cutoff
of a distribution is u tilized. The AUROC provides the
probability that one can discriminate between two indi-
viduals (one randomly chosen from those who are above
500 copies/ml and one randomly chosen from those
that are below 500 copies/ml) which individual is above
500 copies/ml [12].
Results
The study population was comprised of 1,568 indivi-
duals; 784 were used for the random-forest analysis and
784 for the valida tion set . Study population characteris-
tics are shown in Table 1. The median (interquartile
range, IQR) time the HIV RNA was measured a fter
HAART initiation was 0.48 (IQR: 0.39-0.65) years. The
majority of individuals had an HIV RNA level below
500 copies/ml (1017 [65%]). The median CD4 count just
prior to HAART initiation was 190 (IQR: 66-315) cells/
mm
3
and278(IQR:143-426)atthetimeofHIVRNA
measurement. Most were on a PI-based regimen (47%)
followed by a NNRTI-based regimen (38%) with the rest
on either a dual PI and NNRTI or triple NRTI-based
regimen (15%). A total of 696 (59%) we re on a regimen
containing a thymidine analogue (49% conta ining zido-
vudine and 33% containing stavudine).
Utilizing the variables listed above, the random-forest
method was able t o correctly classify 659/784 indivi-
duals: 473/509 individuals with HIV RNA < 500 copies/
ml, for a specificit y of 0.93 [95% confidence interval, CI:
0.90-0.95] and 186/275 individuals ≥ 500 copies/ml, for
a sensitivity of 0.68 [95% CI: 0.62-0.73]. The most
important variable when all variables were included was
the MCH levels followed by change in MCH from pre-
HAART levels. Using the variable importance as a
guide, a new random-forest was grown eliminating the
least important variab les from the model. The final ran-
dom-forest included with four different markers: MCH
(both current and change from pre-HAART level), cur-
rent CD4 count, change in percent CD4, and MCHC
(bo th current and change from pre-HAART level). This
final, reduced random-forest was able to correctly
Table 1 Study population characteristics
Training Data (n = 784) Validation Data (n = 784)
Median Age (IQR) 42.4 (36.7, 47.6) 41.8 (36.2, 48.3)
Male Sex - N (%) 500 (64) 522 (67)
Race - N (%)
African-American 588 (75) 589 (75)
White 169 (22) 174 (22)
Other 27 (3) 21 (3)
HIV Risk Behaviors - N (%)*
MSM 203 (26) 203 (26)
IDU 288 (37) 290 (37)
Heterosexual 412 (53) 399 (51)
Median RNA (IQR) copies/ml** 155 (50, 6147) 145 (50, 7071)
Median CD4 (IQR) cells/ul** 273 (149, 441) 279 (133, 418)
[N = 701 (89%)]† [N = 695 (89%)]†
Median Change in Percent CD4 (IQR)*** 2.9 (0.0, 6.7) 3.0 (-0.4, 7.3)
[N = 655 (84%)]† [N = 635 (81%)]†
Median MCH (IQR) (pg/cell)** 33.0 (30.2, 36.6) 32.8 (29.9, 36.2)
[N = 413 (53%)]† [N = 410 (52%)]†
Median Change in MCH (IQR)*** 1.7 (-0.2, 4.3) 1.8 (-0.3, 5.2)
[N = 364 (46%)]† [N = 360 (46%)]†
*HIV risk behaviors are reported behaviors at enrollment into the cohort and are not mutually exclusive
** At time of first HIV RNA measurement at least 4 months after initiation of effective therapy
*** Change is the change from pre-HAART levels to marker measurement concurrent with HIV RNA measurement occurring at least 4 months after initiation of
treatment.
† The number and percent in brackets correspond to the number of individuals that were not missing these data.
Lau et al. AIDS Research and Therapy 2010, 7:25
/>Page 3 of 7
classify 643/784 individuals for an overall error rate
of 18% (specificity: 459/409 = 0.90 [95% CI: 0.87-0.93];
sensitivity: 184/275 = 0.67 [95% CI: 0.61-0.72]).
A logistic model was constructed based upon these
final variables. The final logistic model is shown in
Table 2 and shows approximately 20% decr ease in odds
having a HIV RNA above 5 00 copies/ml f or every pg/
cell higher of either MCH level or change in MCH
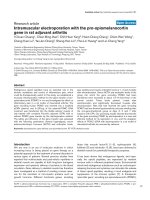
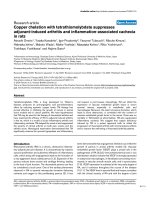
(from pre-HAART levels). A calibration plot (Figure 1)
demonstrated that the logistic model was fairly well cali-
brated as the curves lowess curves for the training (solid
line) data set fo llowed the 45 degree li ne. The area
under the receive r operating curve (AUROC) was 0.85
(95% CI: 0.82-0.88). Using a predicted probability from
the logistic model of >0.5 as having HIV RNA ≥500
copies/ml the sensitivity, specificity, positive and nega-
tive predictive values are shown in Table 3. The operat-
ing characteristics of this logistic model relative to the
random-forest prediction approach resulted in a slight
decrease in spe cificity (0.89 vs. random forest: 0.90) and
an increase in sensitivity (0.70 vs. random forest: 0.67)
with a positive predictive value of 0.77 and negative pre-
dictive value of 0.84 among the training set.
Change in MCHC from pre-HAART leve ls and
MCHC were not included in the final model as these
two variables were not significant in the logistic model
(p = 0.71 and 0.36, respectively). Modeling a non-linear
relationship of these two variables did provide a signifi-
cant association (c
2
= 18.64; 5 degrees of freed om; p =
0.002). However, when included in the model, these two
variables and non-linear terms did not substantially
improve prediction (AU ROC = 0. 86). Therefore, these
variables were left out of the final logistic model in
favor of a more parsimonious model.
The final random-forest applied to the validation set
resulted in a sensitivity of 0.71 (95% CI: 0.66-0.76) and a
specificity of 0.91 (95% CI: 0.88-0.93). These were not
significantly different compared to the training set (sen-
sitivity p = 0.27; specificity p = 0.67). When the logistic
model was applied to the validation data set, the
calibration curve (Figure 1, open circles and dashed-do t
line) suggests that the actual probability was lower than
the predicted. However, this was mainly for those with a
predicted probability between 0.21 and 0.37 and other-
wise the overall curve and confidence intervals suggest a
fairly well calibrated model. Nevertheless, the s ensitivity
and specificity from the logistic model (Table 3), was
Table 2 Results of logistic model after screening for variables by the random forest approach***
Beta Coefficient Odds Ratio Odds Ratio 95% Confidence Interval p-value
Intercept 7.27 ** <0.0001
MCH (pg/cell) -0.19 0.83 0.77, 0.89 <0.0001
Change in MCH (per pg/cell)* -0.22 0.81 0.74, 0.88 <0.0001
CD4 (per 100 cells/mm
3
) -0.32 0.73 0.65, 0.81 <0.0001
Change in Percent CD4 (per percent)* -0.05 0.95 0.91, 0.99 0.008
* Change is relative to the pre-HAART value for an individual, thus a positive value for change in MCH indicates an increase in MCH for an individual from their
pre-HAART value.
** The intercept has no OR interpretation.
*** To determine the predicted probability of having an HIV RNA > 500 copies/ml for an individual, take the value of each variable and multiply it by the
corresponding Beta Coefficient. Take the sum of the resulting values and add the Intercept Beta Coefficient. This is the log(odds) that an individual has an HIV
RNA value above 500 copies/ml. The predicted probability is then 1/(1+e(-log(odds)).
Figure 1 Calibration curve. A calibration curve resulting from the
logistic model presented in Table 2, which shows good calibration
overall when applied to the training (solid diamonds, solid line) and
validation (open circles, dash-dot line) sets, despite that those with
a predicted probability between 0.21 and 0.37 the actual probability
appears to be lower than predicted in the validation set. Vertical
lines correspond to 95% confidence intervals for the corresponding
quintile group.
Lau et al. AIDS Research and Therapy 2010, 7:25
/>Page 4 of 7
not significantly diff erent in the validation set as com-
pared to the training set (p = 0.64 and p = 1.0, respec-
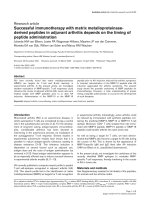
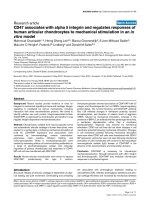
tively). Furthermore, the AUROC in the validation set
was unchanged at 0.85 (95% CI: 0.82-0.88) and the
receiver operating curves for the training and validation
data sets in addition to the two data sets combined were
similar (Figure 2). Using the combined training and vali-
dation data sets, the point on the ROC curve that maxi-
mized both t he sensitivity a nd specificity at both 0.80
was a cutoff in the predicted probability from the logis-
tic model of 0.31.
For comparison to a lo gistic model based solely on
CD4 at time of HIV RNA measurement, the training
and validation data had an AUROC of 0.73 (95% CI:
0.70-0.77) and 0.75 (95% CI: 0.71-0.78), respectively
indicating that CD4 by itself had a l ower ability to dis-
criminate between those who were and were not above
500 copies/ml. A cutoff in the predicted probability of
0.5 from this logistic mo del resulted in a sensitivity of
0.49 (95% CI: 0.44-0.55) and specificity o f 0.87 (95% CI:
0.84-0.89) in the training data. Similar resu lts were seen
in the validation set (sensitivity: 0.55 [95% CI: 0.49-
0.60]; specificity: 0.85 [95% CI: 0.82-0 .88]). Inclusion of
change in CD4 from pre-HAART levels slightly
improved these results (AUROC of 0.77 and 0.78 for
training and validation data sets, respectively).
Discussion
There are two notable conclusions to this study. First,
we e xpected traditional markers to be the most predic-
tive (e.g. CD4, total lymphocyte counts) of current HIV
RNA status. The importance of MCH and change in
MCH was unexpected. There is a paucity of information
on MCH with treatment and HIV RNA levels. Previous
studies have suggested that mean corpuscular volume
may change with NRTI use [13,14]. Another suggested
that among treated individuals, those on an indinavir,
nelfinavir, or saquinavir regimen had higher MCV and
MCH than individuals on non-PI based regimens [15].
Perhaps the most compel ling data is a recent study that
examined hematological differences among Thai patients
with and without antiretroviral therapy stratified by tha-
lassemia (both alpha and beta) status [16]. Focusing on
those without thalassemia, individuals treated with anti-
retrovirals had a higher MCH level (36.13 vs. 28.7 pg; p
< 0.001) and higher MCV (107.26 vs 87.1 fL; p < 0.001)
[16]. However, HIV RNA levels were not reported.
Therefore, whether o r not the importance of MCH i s
due to a correlation with HIV RNA levels or due to
antiretrovirals, remains to be answered. While a signifi-
cant portion of our study population was on a regimen
containing a zidovudine, which has been associa ted with
Table 3 Results of applying the logistic model to both the training set and validation set using a predicted probability
of 0.5 as the cutoff*
Training Set (N = 784)
Model Classification* HIV RNA > 500 copies/ml HIV RNA ≤ 500 copies/ml
HIV RNA > 500 copies/ml 192 57 PPV = 0.77
HIV RNA ≤ 500 copies/ml 83 452 NPV = 0.84
Sensitivity 0.70 (95% CI: 0.64, 0.75) Specificity 0.89 (95% CI: 0.86, 0.91)
Validation Set (N = 784)
Model Classification* HIV RNA > 500 copies/ml HIV RNA ≤ 500 copies/ml
HIV RNA > 500 copies/ml 205 57 PPV = 0.78
HIV RNA ≤ 500 copies/ml 71 451 NPV = 0.86
Sensitivity 0.74 (95% CI: 0.69, 0.79) Specificity 0.89 (95% CI: 0.86, 0.91)
* Individuals with probability >0.5 were classified as having HIV RNA > 500; Positive predictive value (PPV); Negative predictive value (NPV)
Figure 2 Receiver operating characteristic curve.Thereceiver
operating characteristic curve (ROC) for the combined training and
validation data set (solid line), training (dashed line), and validation
(dash-dot line) data based upon the logistic model presented in
Table 2.
Lau et al. AIDS Research and Therapy 2010, 7:25
/>Page 5 of 7
anemia [17-20], these antiretrovirals were not likely to
have had an effect because treatment would have likely
attenuated the assoc iation of MCH with an HIV RNA
above 500 due to the inverse relationship. Furthermore,
including variables indicating whether zidovudine was
used did not significantly contr ibute to the random for-
est analysis. In the logistic model, the point estimates
for MCH and change in MCH rem ained virtually
unchanged (less than 5% of the estimate in Table 2)
suggesting that zidovudine and stavudine are unlikely
potential confounders of the MCH HIV RNA relation-
ship. Furthermore, inclusion of zidovudine and stavu-
dine in the model did not substantially improve the
AUROC (0.86 vs. 0. 85). Nevertheless, the rela tionship
between HIV RNA and MCH should be further investi -
gated in longitudinal studies to confirm this relationship.
Second, the results suggest that a binary rule for clas-
sifying individuals as either above or below 500 copies/
ml is too simplistic. Rather it may need to be multiple
markers as a set of complex binary partitions (random-
forest) or a linear combination (on a logit scale) of mul-
tiple markers. The algorithmic random-forest approach
has not been used extensively in HIV/AIDS applications
but shows promise as a powerful tool to identify impor-
tant variables that may classify individuals as above or
below a certain HIV RNA threshold. As we have
demonstrated, this approach may be used in conjunction
with a regression model. For example, building a logistic
model using a backwards stepwise selection approach
with Akaike’ s information criteria upon our training
data resulted in a model with 30 variables. Additionally
it had an AUROC of 0.91 with a sensitivity of 0.75 and
specificity of 0.92. However, this model was overly opti-
mistic had an attenuated AUROC, sensi tivity and speci-
ficity that was 0.84, 0.69, and 0.87, respectively. This
demonstrates that our approach resulted in a much sim-
pler model of 6 variables and an AUROC that remained
constant at 0.85 in both the training and validation data
sets. Thus our analysis did not result in an overly opti-
mistic model (i.e. model was transportable to the v alida-
tion set).
Our goal was to assess whether routinely collected
clinical markers in addition to CD4 could potentially
predict individuals who had an HIV RNA above 500
copies/ml after initiation of effective treatment. It is pos-
sible that additional information such as adherence data
would improve the prediction and discrimination
betweenthosewhodoanddonothaveanHIVRNA
above 500 copies/ml. Recent s tudies by Bisson [21] and
Cambiano [22] have shown that adherence measures
may be useful for detecting virologic failure and
rebound, respectively. Thus inclusion of good adherence
data is likely to improve our prediction model that
focused on clinical markers.
We do not know whether these results will generalize
to regions which need a method for identifying indivi-
duals w hose HIV RNA levels remain above 500 copies/
ml. Regional conditions may affect hematologic para-
meters such as MCH in ways (e.g ., nutrition, endemic
diseases, etc.) that would make the MCH less predictive.
In addition, patients in a developed country can afford
routine complete blood count testing, which may be less
affordable and available in devel oping countries. Finally,
the prevalence of HIV RNA suppression will also contri-
bute to the usefulness of this predictor sinc e the preva-
lence affects the positive and negative predictive values.
However, our approach of utilizing a random forest to
screen through variables to identify important predictors
for a prediction model may be applied to resource lim-
ited settings.
We believe that our approach is more powerful for
determining predictor s of a suppressed viral load than
previous approaches in that it was able to identify
important prognostic markers from a large number of
variables while providing a parsimo nious model without
loss (as compared t o automatic backwards selection) in
ability to discriminate between those who do and do not
have an HIV RNA above 500 copies/ml. These methods
could be used to deter mine whether the MCH or other
biomarkers can be used in resource-limited settings
where the viral load is not routinely available.
Acknowledgements
This project has been funded in whole or in part from the National Institutes
of Health (R01-DA011602 for the Johns Hopkins HIV Clinical Cohort; U01-
AI069918 for the North American AIDS Cohort Collaboration on Research
and Design, which is a part of the International Epidemiologic Databases to
Evaluate AIDS (IeDEA); and K01-AI071754 (to B.L.)). The funding sources have
had no involvement with this manuscript and does not imply endorsement
by said agencies.
Author details
1
Department of Epidemiology, Johns Hopkins Bloomberg School of Public
Health, 615 N. Wolfe Street, Baltimore, Maryland 21205, USA.
2
Department of
Medicine, Johns Hopkins University School of Medicine, 1830 E. Monument
Street, Baltimore, Maryland 21287, USA.
Authors’ contributions
BL contributed to the design and analysis of the data and drafted the
manuscript. GC contributed to the interpretation of the data and revising
the manuscript. SJG contributed to the design and interpretation of the data
and manuscript revisions. RDM contributed to the acquisition and
interpretation of the data and manuscript revisions. All authors have given
final approval of the manuscript.
Competing interests
The authors declare that they have no competing interests.
Received: 24 March 2010 Accepted: 23 July 2010
Published: 23 July 2010
References
1. World Health Organization: Rapid advice: antiretroviral therapy for HIV
infection in adults and adolescents Geneva, Switzerland, World Health
Lau et al. AIDS Research and Therapy 2010, 7:25
/>Page 6 of 7
Organization 2009 [ />(last accessed March 2010).
2. Charles M, Leger P, Guiteau C, Severe P, Fitgerald D, Pape JW, Johnson WD:
Monitoring response to antiretroviral therapy (ART) in Haiti. XVII
International AIDS Conference: 3-8 August 2008; Mexico City, Mexico .
3. Moore DM, Awor A, Downing R, Kaplan J, Montaner JS, Hancock J, Were W,
Mermin J: CD4+ T-cell count monitoring does not accurately identify
HIV-infected adults with virologic failure receiving antiretroviral therapy.
J Acquir Immune Defic Syndr 2008, 49:477-84.
4. Reynolds SJ, Nakigozi G, Newell K, Ndyanabo A, Galiwongo R, Boaz I,
Quinn TC, Gray R, Wawer M, Serwadda D: Failure of immunologic criteria
to appropriately identify antiretroviral treatment failure in Uganda. AIDS
2009, 23:697-700.
5. Moore RD: Understanding the clinical and economic outcomes of HIV
therapy: the Johns Hopkins HIV clinical practice cohort. J Acquir Immune
Defic Syndr Hum Retrovirol 1998, 17(Suppl 1):S38-S41.
6. Breiman L: Random forests. Machine Learning 2001, 45:5-32.
7. Breiman L: Statistical modeling: The two cultures. Statistical Science 2001,
16:199-215.
8. Ishwaran H, Kogalur UB, Blackstone EH, Lauer MS: Random Survival Forests.
Annals of Applied Statistics 2008, 2:841-60.
9. Breiman L: Manual-setting up, using and understanding random forests
V4.0. 2003 [ />Using_random_forests_v4.0.pdf].
10. Little RJ, Rubin DB: Statistical Analysis with Missing Data New York: Wiley
1987.
11. Harrell FE Jr, Lee KL, Mark DB: Multivariable prognostic models: issues in
developing models, evaluating assumptions and adequacy, and
measuring and reducing errors. Stat Med 1996, 15:361-87.
12. Hanley JA, McNeil BJ: The Meaning and Use of the Area under a Receiver
Operating Characteristic (ROC) Curve. Radiology 1982, 143:29-36.
13. Romanelli F, Empey K, Pomeroy C: Macrocytosis as an indicator of
medication (zidovudine) adherence in patients with HIV infection. AIDS
Patient Care STDS 2002, 16:405-11.
14. Steele RH, Keogh GL, Quin J, Fernando SL, Stojkova V: Mean cell volume
(MCV) changes in HIV-positive patients taking nucleoside reverse
transcriptase inhibitors (NRTIs): a surrogate marker for adherence. Int J
STD AIDS 2002, 13:748-54.
15. Lai S, Lai H, Celentano DD, Vlahov D, Ren S, Margolick J, Lima JA,
Bartlett JG: Factors associated with accelerated atherosclerosis in HIV-1-
infected persons treated with protease inhibitors. AIDS Patient Care STDS
2003, 17:211-19.
16. Pornprasert S, Leechanachai P, Klinbuayaem V, Leenasirimakul P,
Sukunthamala K, Thunjai B, Phusua A, Saetung R, Sanguansermsri T: Effect
of haematological alterations on thalassaemia investigation in HIV-1-
infected Thai patients receiving antiretroviral therapy. HIV Med 2008,
9:660-666.
17. Fischl MA, Richman DD, Causey DM, Grieco MH, Bryson Y, Mildvan D,
Laskin OL, Groopman JE, Volberding PA, Schooley RT, Jackson GG,
Durack DT, Andrews JC, Nusinoff-Lehrman S, Barry DW, AZT Collaborative
Working Group: Prolonged zidovudine therapy in patients with AIDS and
advanced AIDS-related complex. JAMA 1989, 262:2405-10.
18. Moyle G, Sawyer W, Law M, Amin J, Hill A: Changes in hematologic
parameters and efficacy of thymidine analogue-based, highly active
antiretroviral therapy: a meta-analysis of six prospective, randomized,
comparative studies. Clin Ther 2004, 26:92-97.
19. Richman DD, Fischl MA, Grieco MH, Gottlieb MS, Volberding PA, Laskin OL,
Leedom JM, Groopman JE, Mildvad D, Hirsch MS, Jackson GG, Durack DT,
Nusinoff-Lehrman S: The toxicity of azidothymidine (AZT) in the
treatment of patients with AIDS and AIDS-related complex. A double-
blind, placebo-controlled trial. N Engl J Med 1987, 317:192-97.
20. Simpson DM: Human immunodeficiency virus-associated dementia:
review of pathogenesis, prophylaxis, and treatment studies of
zidovudine therapy. Clin Infect Dis 1999, 29:19-34.
21. Bisson GP, Gross R, Bellamy S, Chittams J, Hislop M, Regensberg L, Frank I,
Maartens G, Nachega JB: Pharmacy Refill Adherence Compared with CD4
Count Changes for Monitoring HIV-Infected Adults on Antiretroviral
Therapy. PLoS Medicine 2008, 5:0777-0789.
22. Cabiano V, Lampe FC, Rodger AJ, Smith CJ, Geretti AM, Lodwick RK,
Holloway J, Johnson M, Phillips AN: Use of a prescription-based measure
of antiretroviral therapy adherence to predict viral rebound in HIV-
infected individuals with viral suppression. HIV Medicine 2010, 11:216-224.
doi:10.1186/1742-6405-7-25
Cite this article as: Lau et al.: Identifying individuals with virologic
failure after initiating effective antiretroviral therapy: The surprising
value of mean corpuscular hemoglobin in a cross-sectional study. AIDS
Research and Therapy 2010 7:25.
Submit your next manuscript to BioMed Central
and take full advantage of:
• Convenient online submission
• Thorough peer review
• No space constraints or color figure charges
• Immediate publication on acceptance
• Inclusion in PubMed, CAS, Scopus and Google Scholar
• Research which is freely available for redistribution
Submit your manuscript at
www.biomedcentral.com/submit
Lau et al. AIDS Research and Therapy 2010, 7:25
/>Page 7 of 7