Báo cáo y học: " Long-term CD4+ lymphocyte response following HAART initiation in a U.S. Military prospective cohort" potx
Bạn đang xem bản rút gọn của tài liệu. Xem và tải ngay bản đầy đủ của tài liệu tại đây (355.41 KB, 11 trang )
Lifson et al. AIDS Research and Therapy 2011, 8:2
/>
RESEARCH
Open Access
Long-term CD4+ lymphocyte response following
HAART initiation in a U.S. Military prospective
cohort
Alan R Lifson1,8*, Elizabeth M Krantz2,8, Lynn E Eberly2,8, Matthew J Dolan3, Vincent C Marconi4, Amy C Weintrob5,8,
Nancy F Crum-Cianflone6,8, Anuradha Ganesan7,8, Patricia L Grambsch2,8, Brian K Agan8,
for the Infectious Disease Clinical Research Program (IDCRP) HIV Working Group8
Abstract
Background: Among HIV-infected persons initiating highly active antiretroviral therapy (HAART), early CD4+
lymphocyte count increases are well described. However, whether CD4+ levels continue to increase or plateau
after 4-6 years is controversial.
Methods: To address this question and identify other determinants of CD4+ response, we analyzed data for 1,846
persons from a prospective HIV military cohort study who initiated HAART, who had post-HAART CD4+
measurements, and for whom HIV seroconversion (SC) date was estimated.
Results: CD4+ count at HAART initiation was ≤ 200 cells/mm3 for 23%, 201-349 for 31%, 350-499 for 27%, and
≥500 for 19%. The first 6 months post-HAART, the greatest CD4+ increases (93-151 cells) occurred, with lesser
increases (22-36 cells/year) through the first four years. Although CD4+ changes for the entire cohort were
relatively flat thereafter, HIV viral load (VL) suppressors showed continued increases of 12-16 cells/year. In
multivariate analysis adjusting for baseline CD4+ and post-HAART time interval, CD4+ responses were poorer in
those with: longer time from HIV SC to HAART start, lower pre-HAART CD4+ nadir, higher pre-HAART VL, and
clinical AIDS before HAART (P < 0.05).
Conclusions: Small but positive long-term increases in CD4+ count in virally suppressed patients were observed.
CD4+ response to HAART is influenced by multiple factors including duration of preceding HIV infection, and
optimized if treatment is started with virally suppressive therapy as early as possible.
Background
Among those with human immunodeficiency virus
(HIV) infection, the CD4+ T-lymphocyte count is the
major indicator of immunodeficiency, a main factor in
deciding whether to initiate highly active antiretroviral
therapy (HAART), and an important parameter in monitoring treatment response [1,2]. Failure to restore a
normal CD4+ count following HAART is associated
with increased morbidity due to both AIDS and nonAIDS events, as well as increased mortality [3-5].
* Correspondence:
1
Division of Epidemiology and Community Health, University of Minnesota,
Minneapolis, MN, USA
Full list of author information is available at the end of the article
Studies of the kinetics of CD4+ count response postHAART indicate that the CD4+ count increases rapidly
during the first 3-6 months, in part due to release of
memory T-cells from lymphoid tissue, and then
increases slowly during the next 3-4 years, reflecting
reconstitution of the immune system [6-10]. The magnitude of CD4+ recovery may depend on a variety of factors, including maintenance of virologic suppression,
age, and CD4+ count at HAART initiation [1,7,9,11-20].
The question of whether those initiating HAART will
continue to increase their CD4+ count after 4-5 years or
will plateau has been debated in the literature, and
remains unclear. Some studies have suggested that normalization of CD4+ counts in HIV-infected persons can
be achieved if viral suppression with HAART can be
© 2011 Lifson et al; licensee BioMed Central Ltd. This is an Open Access article distributed under the terms of the Creative Commons
Attribution License ( which permits unrestricted use, distribution, and reproduction in
any medium, provided the original work is properly cited.
Lifson et al. AIDS Research and Therapy 2011, 8:2
/>
maintained for a sufficiently long period of time [19]. In
one study, after > 5 years on HAART, patients with
viral suppression who started at ≤200 cells/mm3 had an
adjusted annual increase of 32 cells/mm3, attaining an
average CD4+ count of 497 cells/mm 3 [19]. Another
study statistically estimating the CD4+ trajectory concluded that those starting HAART at ≤200 CD4+ cells
who remained on therapy would continue to increase
through 7 years, although 25% still had ≤350 cells at
7 years [20]. One small study of 16 patients followed for
up to 10 years with strict viral control based on HIV
RNA detection using ultrasensitive techniques showed
continued positive increases in CD4+ counts, although
this study represented a small group of highly selected
patients [21]
On the other hand, other studies report that the average CD4+ count may level off after 4-6 years following
HAART initiation, even among patients with viral suppression [12,13]. Given this leveling off, many patients
who start at lower CD4+ counts, even after years on
HAART with early CD4+ increases, may fail to reach a
normal CD4+ threshold. In one study of those with sustained viral suppression who started HAART at ≤200
CD4+ cells/mm 3 , after 6 years only 42% had ≥ 500
CD4+ cells/mm 3 , and only 12% had >750 cells/mm 3
[12]. In another study, 44% of those starting therapy
with a CD4+ count <100 cells/mm3 and 25% of those
starting HAART with a CD4+ count of 100-200 cells were
unable to achieve a CD4+ cell count >500 cells/mm3 over
a mean follow-up of seven years, and many did not reach
this threshold by year 10 [18].
The important question of the long-term CD4+ count
response therefore remains unresolved. This question is
especially relevant for those who start HAART at lower
CD4+ counts. Despite current recommendations to start
HAART at CD4+ counts of 350 cells/mm 3 or greater
[1,2], the reality is that many patients, even in developed
countries, are still being diagnosed and initiate treatment late in the course of their HIV infection [22,23].
An additional methodological challenge in using
observational data to evaluate the long-term effect of
CD4+ count at HAART initiation on subsequent
response is that those starting HAART at lower CD4+
levels may have been infected for longer periods of time.
If the post-HAART response is affected by duration of
HIV infection, comparing different strata without
accounting for the fact that those initiating HAART at
lower CD4+ levels may have a longer lead-time can
result in biased group comparisons [24].
We were able to address both of these issues by analyzing data from the U.S. Military HIV Natural History
Study (NHS) [25]. This prospective cohort of HIVinfected U.S. military personnel has followed some participants for up to twelve years after availability of
Page 2 of 11
HAART. Because all active duty personnel are confirmed to be HIV-negative prior to enlistment and
undergo routine HIV screening, HIV seroconversion
(SC) date can be reliably determined for the majority of
members. All cohort members have free access to care
and availability of therapy. Data from this cohort were
analyzed to determine the long-term CD4+ count trajectory after HAART initiation, as well as the influence of
baseline CD4+ count, duration of HIV infection, and
other covariates on post-HAART CD4+ response.
Methods
Study Cohort and Data Elements
The NHS is an observational prospective cohort study of
consenting U.S. military personnel and beneficiaries
[25]. Since 1985, routine HIV testing has been used to
restrict HIV-infected persons from enlistment. Active
duty personnel undergo repeat HIV screening every 1-5
years. Those found HIV-positive after enlistment, plus
HIV-positive retirees and dependents of active duty personnel, receive free medical evaluation and ongoing care
at military medical centers. Although HIV transmission
risk groups are not routinely assessed, injection drug
use was not self-reported by any Navy or Marine personnel who seroconverted for HIV during 1997-8 [26].
More recently, hepatitis C prevalence of only 3% was
reported for evaluable subjects in this cohort [27], consistent with low injection drug use.
Since 1986, the NHS has enrolled 5,091 HIV-positive
participants; NHS protocol is for patients to be seen
every six months at one of seven participating military
medical centers. Data collected include demographics,
medical histories including medication use, and laboratory measures including CD4+ count. In 1996, HIV viral
load (VL) became available to the study.
This analysis was limited to those with: (1) documented HIV-positive status, (2) HAART receipt after July 1,
1995, with a documented HAART initiation date, (3) a
CD4+ count within six months before HAART initiation
and (4) at least one follow-up CD4+ count after
HAART. Because they represented a distinct population,
dependents of active duty personnel were not included
in this analysis. Data were evaluated through February
2010.
This substudy was approved by the governing central
institutional review board. The study was conducted
according to the principles expressed in the Declaration
of Helsinki. All study participants in the NHS provided
written informed consent
Statistical Analysis
Of 1846 patients in this analysis, 1475 (80%) had documented last negative and first positive HIV test dates,
with the estimated HIV SC date calculated as the
Lifson et al. AIDS Research and Therapy 2011, 8:2
/>
mid-point. For 371 (20%) patients, the date of the first
positive but not the last negative HIV test was recorded
in the study’s database; the estimated SC date for these
patients was imputed based upon the median time
between the first positive and last negative dates for
other cohort members with known and comparable first
HIV positive test dates.
Baseline CD4+ count and VL were taken as the values
most closely preceding the HAART initiation date
within the prior 6 months. For CD4+ response curves,
every six-month values were chosen based on the CD4+
count whose date most closely approximated intervals
of six month follow-up from HAART initiation; CD4+
counts had to be obtained within a 3 month window of
the interval date. CD4+ follow-up time was truncated at
the earliest of the following: last recorded visit at which
a CD4+ count was obtained; last recorded visit prior to
three successive 6-month visits with missing CD4+
counts; death; or 12-year post-HAART visit.
Visual inspection of the post-HAART CD4+ response
curve for all patients indicated that the CD4+ response
curves were not simple linear slopes. Based on our
inspection, breakpoints of 0.5 and 4.0 years postHAART were assigned, and linear mixed effects models
with splines were used to model separate CD4+ slopes
for the following time periods after HAART initiation: 0
to 0.5 years; 0.5 to 4 years; and > 4 years. Random
effects for intercepts and slopes were included.
Separate CD4+ response curves were generated for
those initiating HAART at CD4+ “baseline” counts of
≤200, 201-349, 350-499, and ≥500 cells/mm3. Interactions between post-HAART time period and baseline
CD4+ strata were included in linear mixed effects models to estimate and compare separate CD4+ slopes by
baseline CD4+ group. Baseline characteristics between
CD4+ strata were compared using chi-square tests or
analysis of variance.
Unadjusted models first compared CD4+ response trajectories between the four baseline strata; multivariate
models then compared baseline CD4+ strata adjusting
for the following covariates: age at HAART start, gender, race/ethnicity, presence of clinical AIDS prior to
HAART, baseline VL (most closely prior to HAART
start), any ART prior to HAART, time from estimated
HIV SC date to HAART initiation date, year of HAART
start, and nadir pre-HAART CD4+ count. Clinical AIDS
was defined as presence of a clinical disease (not CD4+
count) meeting the 1993 Centers for Disease Control
AIDS case definition [28]. As previously defined for the
NHS [29], HAART included ART regimens with drugs
from two or more classes, or certain combinations of
three or more nucleoside/nucleotide reverse transcriptase inhibitors (NRTI); patients on ART not meeting the
HAART definition were typically on mono or dual
Page 3 of 11
NRTI regimens. Age was modeled as a linear spline to
allow for separate linear estimates among those < 40
years and among those ≥40 years. Holm’s stepdown
Bonferroni method adjusted for multiple slope
comparisons.
This analysis was repeated for the subset of participants defined as VL suppressors. Because VL assays
with different detection limits were used during followup, an undetectable VL was defined as <400 copies/ml.
VL suppression was defined as two consecutive undetectable VLs, with the first within 48 weeks after
HAART start. Data for this subgroup were censored
when two consecutive VL measurements ≥400 copies/
ml were first observed.
To evaluate robustness of our main findings, additional
exploratory models were constructed with additional variables added as covariates. In the first model, a timeupdated variable was added to indicate whether the patient
was on or off HAART at each 6-month follow-up visit. In
the second model, time-updated log10-transformed VL
(based on six-month post-HAART values) was added; the
separate baseline VL covariate was removed since it is captured in the time-updated covariate. In the third model,
initial HAART regimen was added, and categorized
as NRTI plus protease inhibitor (PI), NRTIs plus nonnucleoside reverse transcriptase inhibitor (NNRTI), NRTIs
alone, and regimens with both NNRTIs and PIs.
Results
Characteristics at HAART initiation
One thousand eight hundred and forty-six HIV-positive
individuals met analysis inclusion criteria, with characteristics summarized in Table 1. The median length of
follow-up post-HAART was 5.5 years, and median number of CD4+ count values obtained post-HAART (using
six-month intervals) was 10 (interquartile range: 4, 18).
CD4+ count at HAART initiation was ≤ 200 cells/
mm 3 for 23% of participants, 201-349 cells for 31%,
350-499 cells for 27%, and ≥500 cells for 19%. The four
strata differed significantly by multiple characteristics
(Table 1). Among other differences, AIDS prior to
HAART, baseline VL ≥100,000 copies/ml, and longer
time from SC to HAART start were all most common
in those with a baseline CD4+ ≤200 cells/mm3.
CD4+ response curves after HAART initiation
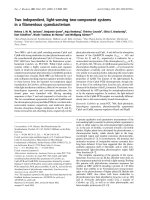
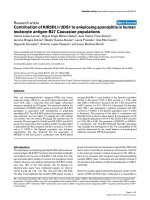
Figure 1 shows the CD4+ count response after HAART
initiation for all participants in this analysis. For the first
6 months after HAART initiation, the average increase
in CD4+ count was 129.9 cells (95% CI 122.0, 137.8).
For the second phase (0.5-4.0 years) after HAART, the
average annual increase was 29.1 cells (95% CI 24.5,
33.7). For the third phase (4.0-12.0 years), the average
annual change was -0.4 cells (95% CI -4.5, +3.6).
Lifson et al. AIDS Research and Therapy 2011, 8:2
/>
Page 4 of 11
Table 1 Characteristics of Participants in U.S. Military HIV Natural History Study by Baseline CD4+ Strata at HAART
Initiation
CD4+ (cells/mm3) at HAART start
≤200
201-349
350-499
≥500
Total
(N = 419)
(N = 580)
(N = 493)
(N = 354)
(N = 1846)
Male
Race/ethnicity
397 (95%)
566 (98%)
470 (95%)
337 (95%)
1770 (96%)
Caucasian
169 (40%)
255 (44%)
216 (44%)
172 (49%)
812 (44%)
African American
199 (47%)
246 (42%)
211 (43%)
139 (39%)
795 (43%)
Hispanic
38 (9%)
54 (9%)
49 (10%)
27 (8%)
168 (9%)
Other
13 (3%)
25 (4%)
17 (3%)
16 (5%)
71 (4%)
1995-1999
311 (74%)
289 (50%)
298 (60%)
245 (69%)
1143 (62%)
2000-2003
2004-2008
43 (10%)
65 (16%)
104 (18%)
187 (32%)
97 (20%)
98 (20%)
68 (19%)
41 (12%)
312 (17%)
391 (21%)
36 (31, 42)
34 (29, 39)
34 (28, 39)
34 (29, 39)
34 (29, 40)
Year of HAART start *
Median age at
HAART start (IQR) *
CD4+ nadir (cells/mm3) *
≤200
419 (100%)
83 (15%)
20 (4%)
10 (3%)
532 (29%)
201-349
0 (0%)
497 (86%)
180 (37%)
58 (16%)
735 (40%)
350-499
0 (0%)
0 (0%)
293 (59%)
96 (27%)
389 (21%)
0 (0%)
0 (0%)
0 (0%)
190 (54%)
190 (10%)
≥500
Baseline VL at HAART start (copies/ml) *
<1000
17 (4%)
37 (6%)
59 (12%)
65 (18%)
178 (10%)
1,000-9,999
25 (6%)
111 (19%)
107 (22%)
92 (26%)
335 (18%)
10,000-99,999
156 (37%)
290 (50%)
231 (47%)
131 (37%)
808 (44%)
≥100,000
170 (41%)
117 (20%)
72 (15%)
54 (15%)
413 (22%)
Missing
51 (12%)
25 (4%)
24 (5%)
12 (3%)
112 (6%)
116 (28%)
277 (66%)
24 (4%)
217 (37%)
19 (4%)
221 (45%)
7 (2%)
146 (41%)
166 (9%)
861 (47%)
6.8 (3.5,10.1)
3.2 (1.3,7.3)
3.3 (1.4,7.2)
2.8 (1.0,7.2)
4.1 (1.4,8.4)
4.9 (2.2,11.4)
4.5 (2.0,9.2)
6.0 (2.1,10.8)
6.1 (2.6,10.6)
5.5 (2.1, 10.5)
AIDS diagnosis prior to
HAART *
On ART prior to HAART *
Median years HIV SC to
HAART start (IQR) *
Median years post-HAART
follow-up (IQR) **
600
400
200
0
Mean CD4 with 95% CI
800
* P < 0.001 **P = 0.001.
HAART = Highly active antiretroviral therapy; ART = Antiretroviral therapy;
VL = HIV Viral load; IQR = Interquartile range; SC = Seroconversion.
0
1
2
3
4
5
6
7
8
9
10
11
12
Years from HAART Start
N: 1846 1656 1553 1440 1320 1246 1162 1085 1016 956 884 856 801 740 700 658 617 573 558 508 460 434 389 342 273
Figure 1 CD4+ Response Curve After HAART Initiation for All
Participants, U.S. Military HIV Natural History Study.
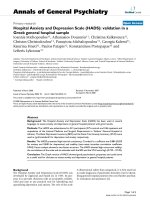
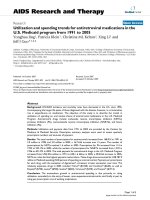
Figure 2 shows the CD4+ count response after
HAART initiation by baseline CD4+ stratum. The mean
CD4+ cell count at 4, 8, and 12 years post-HAART was
324, 367 and 402 (95% CI: 356, 448) for the ≤200 CD4+
cell baseline stratum; 532, 513 and 548 (95% CI: 478,
618) for the 201-349 cell stratum; 641, 611 and 666
(95% CI: 602, 729) for the 350-499 cell stratum; and
846, 799 and 814 (95% CI: 684, 945) for the ≥500 cell
stratum.
The average CD4+ change and 95% CI for each of the
three post-HAART time intervals are summarized in
Table 2; the first time period is presented as CD4+
change per half-year; the second and third time periods
present CD4+ change per year. Within all CD4+ strata,
the greatest average increases (93-151 cells) were noted
Page 5 of 11
800
600
400
200
CD4 at HAART Start
500+
350−499
201−349
<= 200
0
Mean CD4 with 95% CI
1000
Lifson et al. AIDS Research and Therapy 2011, 8:2
/>
0
1
2
3
4
5
6
7
8
Years from HAART Start
9
10
11
12
HAART start CD4 500+: 354
331
291
291
257
252
242
228
216
209
187
185
179
152
148
141
134
117
112
109
98
87
74
66
43
HAART start CD4 350−499: 493
442
424
389
349
336
312
304
286
271
257
250
224
219
198
191
177
166
158
145
137
123
114
94
71
HAART start CD4 201−349: 580
531
486
444
417
371
354
320
292
275
252
233
221
202
188
173
163
150
150
126
105
105
96
80
72
HAART start CD4 <= 200: 419
352
352
316
297
287
254
233
222
201
188
188
177
167
166
153
143
140
138
128
120
119
105
102
87
Figure 2 CD4+ Response Curve After HAART by CD4+ Strata at HAART Initiation for All Participants, U.S. Military HIV Natural History
Study.
Table 2 Average Change in CD4+ Count by Time Since HAART Initiation: All Participants and Viral Suppressors in U.S.
Military HIV Natural History Study
CD4+ strata
at HAART start
Estimated CD4+ count change and 95% CI (cells/mm3) by time segment (Years from HAART initiation)
0-0.5 yrs
0.5-4.0 yrs
>4.0 yrs
(change/half-year)
(change/year)
(change/year)
All participants
109 (93, 126)
36 (30, 43)
8.6 (3.3, 14.0)
Viral suppressors
147 (123, 172)
66 (56, 75)
13.6 (6.0, 21.2)
All participants
149 (135, 162)
34 (28, 39)
3.5 (-1.3, 8.4)
Viral suppressors
171 (155, 188)
54 (48, 60)
14.4 (8.5, 20.4)
151 (136, 166)
177 (159, 195)
22 (16, 28)
51 (44, 57)
1.5 (-3.4, 6.4)
12.0 (6.1, 17.8)
All participants
93 (75, 110)
24 (17, 30)
-8.1 (-13.9, -2.4)
Viral suppressors
119 (98, 139)
56 (48, 63)
16.2 (9.8, 22.6)
≤200 cells/mm3
201-349 cells/mm3
350-499 cells/mm3
All participants
Viral suppressors
≥500 cells/mm3
* Significant (P < 0.05) differences in first-phase slopes: (1) All participants: ≤200 vs. 201-349; <200 vs. 350-499; 201-349 vs. ≥500; 350-499 vs. ≥500; (2) VL
suppressors: 201-349 vs. ≥500; 350-499 vs. ≥500;
** Significant (P < 0.05) differences in second-phase slopes: (1) All participants: ≤200 vs. 350-499; (2) VL suppressors: None;
*** Significant (P < 0.05) differences in third-phase slopes: (1) All participants: ≤200 vs. ≥500; 201-349 vs. ≥500; 2) VL suppressors: None.
(All P-values calculated with multiple comparisons adjustment).
HAART = Highly active antiretroviral therapy; CI = Confidence Interval.
Lifson et al. AIDS Research and Therapy 2011, 8:2
/>
within the first 6 months after HAART initiation. Continued but lesser increases of 22-36 cells/year were
noted during the second-phase period of 0.5-4.0 years
after HAART initiation. During the third phase (>4.0
years post-HAART start), the average CD4+ count
increased slightly (9 cells/year) in the lowest baseline
CD4+ stratum, remained essentially unchanged in
the two middle baseline strata, and decreased slightly
(8 cells/year) in the highest stratum (P < 0.05).
Page 6 of 11
Table 3 Adjusted Covariate Estimates * for CD4+ Cell
Response Post-HAART for All Participants, U.S. Military
HIV Natural History Study
Covariate
Estimate
(95% CI)
Pvalue
Effect of 10 years older if < 40 years
old
4.3 (-9.3, 17.9)
0.54
Effect of 10 years older if > 40 years
old
- 7.7 (-23.3, 7.9)
0.34
23.0 (-8.8, 54.8)
0.16
Age at HAART start
Female (vs. Male)
Multivariate analysis and adjusted CD4+ slopes
In a model controlling for baseline CD4+ count and
time interval after HAART start (first-, second- or thirdphase), a number of other variables were significantly
(P < 0.05) associated with CD4+ response (Table 3). A
significantly smaller CD4+ response post-HAART
occurred in those with clinical AIDS prior to HAART, a
lower CD4+ nadir, a higher baseline VL, a greater number of years from HIV SC to HAART start, Hispanic
ethnicity, and HAART initiation during 2000-2003 (vs.
2004-2009). Any ART prior to HAART was of borderline significance (P = 0.07).
The numerical estimates listed in Table 3 for different
levels of a specific covariate represent what the difference in post-HAART CD4+ counts would be after
adjustment for all other covariates in the model. For
example, after adjustment for all other covariates, a
patient with a baseline VL of < 1000 copies/ml will on
average have a post-HAART CD4+ count that is 57.2
cells higher than a patient with a baseline VL of ≥
100,000 copies/ml (the referent). After adjustment, a
patient infected for >8.5 years will on average have a
post-HAART CD4+ count that is 50.6 cells lower than a
patient infected for ≤1.5 years before HAART.
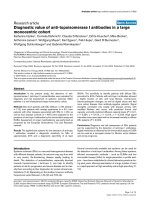
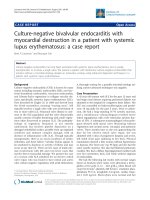
CD4+ response curves for viral suppressors
One thousand one hundred seventy-one participants
met criteria for VL suppressors. Figure 3 shows postHAART CD4+ count responses stratified by CD4+
count at HAART initiation for VL suppressors. The
mean CD4+ cell counts at 4, 8, and 12 years postHAART for VL suppressors were 448, 517 and 546
(95% CI: 405, 687) for the ≤200 CD4+ cell baseline stratum; 622, 680 and 737 (95% CI: 561, 914) for the 201349 CD4+ stratum; 745, 770 and 907 (95% CI: 791,
1023) for the 350-499 CD4+ stratum; and 947, 1006 and
1075 (95% CI: 820, 1330) for the ≥500 CD4+ cell
stratum.
The average CD4+ change and 95% CI for each of the
three post-HAART time intervals for VL suppressors
are summarized in Table 2. The greatest changes were
again noted within the first 6 months, followed by the
0.5-4.0 year period. For the third phase (>4.0 years)
post-HAART, there were significant annual increase in
Race
Caucasian
Reference
African American
-7.4 (-20.5, 5.7)
Hispanic
-35.0 (-57.8, -12.2)
0.003
-0.7 (-35.4, 33.9)
-23.3 (-46.1, -0.5)
0.97
0.045
Other
Clinical AIDS event prior to HAART start
0.27
Pre -HAART nadir CD4+ count (cells/mm3)
≤ 200
Reference
201-349
57.2 (31.4, 83.0)
<.001
350-499
160.8 (129.2,
192.5)
<.001
≥ 500
236.5 (196.4,
276.6)
<.001
< 1000
57.2 (32.5, 81.8)
<.001
1000-9999
40.2 (19.5, 60.8)
<.001
10,000-99,999
≥ 100,000
14.4 (-2.5, 31.3)
Reference
0.10
Baseline VL at HAART start (copies/ml) **
Years from SC to HAART initiation
≤ 1.5
Reference
> 1.5 to 4.0
-28.3 (-47.8, -8.8)
> 4.0 to 8.5
-44.1 (-65.3, -23.0)
<.001
> 8.5
-50.6 (-73.4, -27.9)
<.001
1995-1999
2000-2003
-12.8 (-36.6, 10.9)
-34.4 (-60.3, -8.4)
0.29
0.01
2004-2009
Reference
0.005
Year of HAART initiation
Any ART prior to HAART start
-16.4 (-34.4, 1.6)
0.07
* Aside from baseline CD4+ count and time interval after HAART start.
** Analysis adjusted for those for whom VL was missing/unknown.
HAART = Highly active antiretroviral therapy; ART = Antiretroviral therapy;
VL = HIV Viral load; SC = Seroconversion;
all baseline strata, although only at a mean of 12-16
cells per year. Second and third phase slopes did not
significantly differ for any of the baseline CD4+ strata
Multivariate analysis for VL suppressors
In multivariate analysis for viral suppressors, factors significantly (P < 0.05) associated with a lesser CD4+
response include male sex, lower CD4+ nadir, and
greater time from HIV SC to HAART start (Table 4).
Clinical AIDS before HAART was of borderline significance (P = 0.057). Numerical estimates in Table 4 for
Page 7 of 11
800
600
400
200
CD4 at HAART Start
500+
350−499
201−349
<= 200
0
Mean CD4 with 95% CI
1000
Lifson et al. AIDS Research and Therapy 2011, 8:2
/>
0
1
2
3
4
5
6
7
8
Years from HAART Start
9
10
11
12
HAART start CD4 500+: 253
238
201
185
154
143
133
122
110
93
79
76
69
52
49
42
45
38
35
32
29
23
22
20
13
HAART start CD4 350−499: 341
317
280
247
208
179
160
147
131
116
106
88
77
72
58
53
49
45
42
37
32
30
26
20
16
HAART start CD4 201−349: 397
371
330
277
251
214
187
159
144
123
102
85
78
69
56
48
44
37
39
31
29
28
24
18
17
HAART start CD4 <= 200: 180
161
150
118
109
93
80
69
63
50
52
42
46
38
37
29
28
29
25
25
21
23
17
15
10
Figure 3 CD4+ Response After HAART by CD4+ Strata at HAART Initiation for Viral Suppressors, U.S. Military HIV Natural History
Study.
different levels of a specific covariate again represent
what the difference in post-HAART CD4+ counts
would be after adjustment for all other covariates in the
model. For example, after adjustment, a viral suppressor
infected for >8.5 years will on average have a postHAART CD4+ count that is 33.4 cells lower than a
patient infected for ≤1.5 years before HAART.
Additional exploratory analyses
In the first model, the time-updated indicator of
HAART use was a significant positive predictor of
CD4+ response (coefficient = 95.1, 95% CI: 87.8, 102.4,
P < 0.001). All significant covariates in the original
adjusted model remained so, except for clinical AIDS
prior to HAART, which was of borderline significance
(P = 0.055). In the second model, time-updated VL after
HAART start was a significant predictor of CD4+
response (coefficient = -42.6 for every log10 increase in
VL, P < 0.001). All significant covariates in the original
adjusted model remained so, except for year of HAART
initiation. In the third model initial HAART regimen
was added to the model. All significant covariates in the
original adjusted model remained so.
Discussion
Among HIV-positive persons starting HAART, we identified a rapid average increase of 93-151 cells during the
first six months in all baseline CD4+ strata, followed by
a continued average increase of 22-36 cells per year
through the first four years. Among VL suppressors,
these increases were even greater, with an average of
119-177 cells during the first phase, followed by an average of 51-66 cells per year during the second phase,
through 4 years. For example, a patient who starts
HAART with a CD4+ count of 125 cells/mm3 and who
maintains viral suppression will on average have an
increase to about 500 cells/mm 3 at the end of four
years.
A major purpose of this analysis was to identify
whether after four years the CD4+ response continues
to increase or plateaus. Among all participants, the average third-phase response was slightly positive (8.6 cells/
year) in the lowest CD4+ baseline strata (≤200 cells),
slightly negative (-8.1 cells/year) in the highest strata
(≥500 cells), and essentially flat (with 95% CI overlapping zero) in the two middle strata. However, among
VL suppressors, we identified positive average increases
Lifson et al. AIDS Research and Therapy 2011, 8:2
/>
Page 8 of 11
Table 4 Adjusted Covariate Estimates* for CD4+ Cell
Response Post-HAART for Viral Suppressors, U.S. Military
HIV Natural History Study
Covariate
Estimate
(95% CI)
Pvalue
Effect of 10 years older if < 40 years
old
6.3 (-9.6, 22.2)
0.44
Effect of 10 years older if > 40 years
old
- 5.1 (-23.9, 13.7)
0.59
57.2 (14.6, 99.8)
0.009
Age at HAART start
Female (vs. Male)
Race
Caucasian
Reference
African American
9.2 (-7.3, 25.7)
0.27
Hispanic
-10.8 (-38.6, 17.1)
0.45
0.4 (-40.6, 41.4)
-32.7 (-66.4, 1.0)
0.98
0.057
Other
Clinical AIDS event prior to HAART start
Pre -HAART nadir CD4 count (cells/mm3)
≤ 200
Reference
201-349
55.3 (20.7, 89.9)
0.002
350-499
135.4 (94.6, 176.2)
<.001
≥ 500
195.1 (144.3,
245.8)
<.001
< 1000
8.5 (-21.6, 38.6)
0.58
1000-9999
10,000-99,999
-17.8 (-43.5, 7.9)
1.3 (-19.5, 22.2)
0.18
0.90
≥ 100,000
Reference
Baseline VL at HAART start (copies/ml) **
Years from SC to HAART initiation
≤ 1.5
Reference
> 1.5 to 4.0
-18.0 (-38.6, 2.6)
> 4.0 to 8.5
-27.7 (-52.0, -3.3)
0.03
≥ 8.5
-33.4 (-61.0, -5.8)
0.02
Year of HAART initiation
1995-1999
0.09
0.0 (-22.4, 22.4)
0.99
2000-2003
5.9 (-18.1, 29.9)
0.63
2004-2009
Reference
Any ART prior to HAART start
11.5 (-11.1, 34.0)
0.32
* Aside from baseline CD4+ count and time interval after HAART start.
** Analysis adjusted for those for whom VL was missing/unknown.
HAART = Highly active antiretroviral therapy; ART = Antiretroviral therapy;
VL = HIV Viral load; SC = Seroconversion;
of approximately 12-16 cells/year, with no significant
differences in third-phase slopes between any of the
baseline strata. This supports the general conclusion
that if viral suppression can be maintained through
effective and uninterrupted HAART, a continued
pattern of CD4+ count improvement may occur in
most patients, irrespective of CD4+ count at HAART
initiation.
There are several caveats to this overall conclusion.
Although increases four years after starting HAART in
viral suppressors continued to be positive, they were
small. This provides support for current guidelines to
start HAART at higher CD4+ levels, before severe
immune suppression has occurred [1,2,30]. In addition,
our analysis indicates that a variety of other factors may
affect and modulate the CD4+ response curve, including
nadir CD4+ cell count, AIDS prior to HAART start and
pre-HAART duration of HIV infection.
Our analysis is consistent with other studies identifying nadir CD4+ count as a predictor of CD4+ cell
response [31,32]. A lower nadir CD4+ count may reflect
a more profound disturbance of T-cell homeostasis,
with more severe immunological deficits that cannot be
reversed even with HAART-induced viral suppression
[33]. For example, in one analysis of response to immunization in those with normal CD4+ counts and viral
suppression after more than a year, a lower CD4+ nadir
before HAART predicted poorer vaccination response
[34].
Our analysis also identified a clinical AIDS diagnosis
preceding HAART as a predictor of a poorer CD4+
response. This may be another reflection of functional
or other immune deficiencies in response to HIV infection that lead to a less robust immunologic recovery.
This finding supports current recommendations to initiate HAART in all patients with a history of an AIDSdefining illness, irrespective of their current CD4+ count
[1,2].
A major finding of this analysis was the strong negative effect of pre-HAART duration of HIV infection on
CD4+ cell response to HAART, even after controlling
for viral suppression, CD4+ count and other factors. A
previous study [14] also identified duration of infection
as a predictor of CD4+ response, but duration was
based upon time from the first recorded HIV test rather
than the entire estimated period of HIV infection, as
this analysis was able to do. Potential immunopathogenic explanations for why a longer time from HIV SC
to HAART start results in a more impaired capacity for
immunologic recovery include decreased CD4+ cell production or excessive CD4+ cell destruction. For example, it has been proposed that CD4+ T-cell
hyperactivation may persist even after HAART virologic
suppression, and that this results in greater apoptotic
cell death [32,33,35-37]. Our finding that both higher
baseline VLs and longer duration of pre-HAART infection were predictive of poorer immunologic response
suggests that long-standing high levels of viral replication may lead to persistent T-cell activation or other Tcell dysfunction which cannot be fully reversed even
after HAART introduction.
This analysis has several potential limitations. First, by
definition those who were followed for >5 years represent “healthy survivors"; those who died or who dropped
out of the study because of illness soon after starting
HAART would not be captured in the third-phase
Lifson et al. AIDS Research and Therapy 2011, 8:2
/>
analysis. Although for the great majority of enrollees
death was uncommon, it was more common among
those in the lowest CD4+ cell strata. For example, a preliminary analysis of mortality among those initiating
HAART at ≤200 CD4+ cells/mm 3 identified a 6-year
death rate of 18%, compared to rates of 3%-5% for those
initiating HAART at the higher CD4+ cell strata
(IDCRP, unpublished data). Although many patients are
still followed in the military health care system even if
they are no longer on active duty after an AIDS diagnosis, some patients with advanced disease may have separated from the military system and had their health care
transferred to the Veteran’s Affairs or other health systems. However, even if such a healthy survivor effect did
occur, we do not believe that it significantly affected our
overall conclusions. Such an effect would most likely
occur in the lowest (≤200 cell) CD4+ stratum, and
among viral suppressors, the third-phase CD4+
increases we saw in this stratum were not significantly
different from those seen in the other baseline strata.
Nonetheless, the increased mortality seen in the lowest
group provides additional support for current guidelines
to start HAART before severe immune suppression has
occurred.
Second, in this observational study, the four baseline
strata were not randomized, and group differences may
be due to unmeasured confounding. We tried to limit
the extent of confounding by adjusting for many HIVrelated factors, as well as time-dependent covariates
including VL and HAART use. Analyzing our data in
different ways, including through several different
exploratory analyses, did not change our overall
conclusions.
Third, although we adjusted for different classes of
drug therapy at HAART initiation in our exploratory
sensitivity analyses, we did not present data on specific
ART drugs. However, this was not the intent of this
analysis. Even within a given antiretroviral class, there is
considerable variation depending on potency, drug-drug
interactions, use of ritonavir boosting for PIs, and multiple other factors. Clinicians may select individual drugs
for a HAART regimen based on a variety of factors, and
information about the efficacy of specific ART drugs
and regimens is best obtained through randomized
trials.
Finally, this cohort is characterized by a number of
specific demographic and clinical factors, and results
may vary for other populations with different characteristics. For example, 96% of our study sample was male,
and the median age was 36 years. Also, given the specific structured testing schedule in the military, it is likely
that many patients in this cohort were diagnosed with
HIV earlier than typically seen in clinical practice.
Page 9 of 11
This analysis also has several strengths. First, in contrast to many other HIV cohort studies, we were able to
estimate SC date and time from HIV SC to HAART
start. The fact that this variable consistently emerged as
a significant predictor of CD4+ response supports the
importance of including this covariate in our analysis.
Second, follow-up in this analysis extended for some
patients out past 8 years, considerably longer than most
other observational studies. This analysis therefore provides an important contribution to the literature concerning the long-term third-phase CD4+ response to
HAART, especially in those patients who maintain virologic suppression.
Third, because HIV treatment in the military is free,
availability of care and access to therapy were not barriers confounding our results. In fact, viral suppression
rates in this cohort have previously been reported as
approaching those in clinical trials [25].
Conclusions
Among HIV-infected persons who initiated HAART at
different CD4+ levels and who were followed in some
cases for over ten years, we identified a rapid followed
by a more gradual increase in CD4+ cells for the first
four years. After this time, among those who maintain
viral suppression, our results suggest that in all strata,
there will on average be a positive but small average
increase of about 12-16 cells per year. However, multiple factors may influence this immunologic response,
including CD4+ nadir, a preceding AIDS diagnosis, and,
importantly, time from HIV infection to HAART start.
Our findings strongly support the conclusion that
immunologic response to HAART is maximized if treatment is started with virally suppressive therapy as early
as possible.
Acknowledgements and Funding
Support for this work (IDCRP-000-03) was provided by the Infectious Disease
Clinical Research Program (IDCRP), a Department of Defense program
executed through the Uniformed Services University of the Health Sciences.
This project has been funded in whole, or in part, with federal funds from
the National Institute of Allergy and Infectious Diseases, National Institutes of
Health, under Inter-Agency Agreement Y1-AI-5072.
Additional members of the IDCRP HIV/STI Working Group include Susan
Banks, Mary Bavaro, Helen Chun, Cathy Decker, Connor Eggleston, Susan
Fraser, Joshua Hartzell, Gunther Hsue, Arthur Johnson, Mark Kortepeter,
Michael Landrum, Tahaniyat Lalani, Michelle Linfesty, Grace Macalino, Scott
Merritt, Robert O’Connell, Jason Okulicz, Shiela Peel, Michael Polis, John
Powers, Roseanne Ressner, Edmund Tramont, Tyler Warkentien, Paige
Waterman, Timothy Whitman, Ken Wilkins, Glenn Wortmann, and Michael
Zapor.
The content and views expressed in this publication is the sole responsibility
of the authors and does not necessarily reflect the views or policies of the
NIH or the Department of Health and Human Services, the DoD or the
Departments of the Army, Navy, Air Force, Department of Defense, nor the
U.S. Government. Mention of trade names, commercial products, or
organizations does not imply endorsement by the U.S. Government.
Lifson et al. AIDS Research and Therapy 2011, 8:2
/>
Author details
1
Division of Epidemiology and Community Health, University of Minnesota,
Minneapolis, MN, USA. 2Division of Biostatistics, University of Minnesota,
Minneapolis, MN, USA. 3Defense Institute for Military Operations, Wilford Hall
USAF Medical Center, San Antonio, TX, USA. 4School of Medicine, Emory
University, Atlanta, GA, USA. 5Infectious Disease, Walter Reed Army Medical
Center, Washington, DC, USA. 6Infectious Disease, Naval Medical Center-San
Diego, San Diego, CA, USA. 7Infectious Disease, National Naval Medical
Center, Bethesda, MD, USA. 8Infectious Disease Clinical Research Program,
Uniformed Services University of Health Sciences, Bethesda, MD, USA.
Page 10 of 11
11.
12.
13.
Authors’ contributions
AL was lead author on planning and coordinating the analysis, and drafting
interim and final versions of the manuscript. EK, PG, and LE conducted and/
or provided guidance with various aspects of the statistical analysis. VM, AW,
NC, AG and BA helped to implement the study, including data collection
and oversight at the individual study sites at which participants were
followed. EK, PG, LE, VM, AW, NC, AG, BA and MD participated in discussions
concerning the design of this project, provided feedback and suggestions
on interim analyses, and offered valuable input and recommendations on
draft versions of this manuscript. All authors have seen and approved the
final manuscript.
14.
15.
Competing interests
The authors declare that they have no competing interests.
Received: 19 October 2010 Accepted: 18 January 2011
Published: 18 January 2011
References
1. Panel on Antiretroviral Guidelines for Adults and Adolescents: Guidelines
for the use of antiretroviral agents in HIV-1-infected adults and
adolescents. Dept. Health and Human Services; 2009, 1-161 [http://www.
aidsinfo.nih.gov/ContentFiles/AdultandAdolescentGL.pdf].
2. Thompson MA, Aberg JA, Cahn P, Montaner JS, Rizzardini G, Telenti A,
Gatell JM, Günthard HF, Hammer SM, Hirsch MS, Jacobsen DM, Reiss P,
Richman DD, Volberding PA, Yeni P, Schooley RT: Antiretroviral treatment
of adult HIV infection: 2010 recommendations of the International AIDS
Society-USA Panel. JAMA 2010, 304:321-33.
3. Baker JV, Peng G, Rapkin J, Krason D, Reilly C, Cavert WP, Abrams DI,
MacArthur RD, Henry K, Neaton JD, Terry Beirn Community Programs for
Clinical Research on AIDS (CPCRA): Poor initial CD4+ recovery with
antiretroviral therapy prolongs immune depletion and increases risk for
AIDS and non-AIDS diseases. J Acquir Immune Defic Syndr 2008, 48:541-6.
4. Study Group on Death Rates at High CD4 Count in Antiretroviral Naive
Patients: Death rates in HIV-positive antiretroviral-naive patients with
CD4 count greater than 350 cells per μL in Europe and North America: a
pooled cohort observational study. Lancet 2010, 376:340-5.
5. Lawn SD, Little F, Bekker LG, Kaplan R, Campbel E, Orrell C, Wood R:
Changing mortality risk associated with CD4 cell response to
antiretroviral therapy in South Africa. AIDS 2009, 23:335-42.
6. Pakker NG, Notermans DW, de Boer RJ, Roos MT, de Wolf F, Hill A,
Leonard JM, Danner SA, Miedema F, Schellekens PT: Biphasic kinetics of
peripheral blood T cells after triple combination therapy in HIV-1
infection: a composite of redistribution and proliferation. Nat Med 1998,
4:208-14.
7. Battegay M, Nüesch R, Hirschel B, Kaufmann GR: Immunological recovery
and antiretroviral therapy in HIV-1 infection. Lancet Infect Dis 2006,
6:280-7.
8. Bucy RP, Hockett RD, Derdeyn CA, Saag MS, Squires K, Sillers M,
Mitsuyasu RT, Kilby JM: Initial increase in blood CD4+ lymphocytes after
HIV antiretroviral therapy reflects redistribution from lymphoid tissues. J
Clin Invest 1999, 103:1391-8.
9. Hunt PW, Deeks SG, Rodriguez B, Valdez H, Shade SB, Abrams DI,
Kitahata MM, Krone M, Neilands TB, Brand RJ, Lederman MM, Martin JN:
Continued CD4 cell count increases in HIV-infected adults experiencing
4 years of viral suppression on antiretroviral therapy. AIDS 2003,
17:1907-1915.
10. Smith K, Aga E, Bosch RJ, Valdez H, Connick E, Landay A, Kuritzkes D,
Gross BH, Francis IR, McCune JM, Kessler H, Lederman M: Long-term
changes in circulating CD4 T lymphocytes in virologically suppressed
16.
17.
18.
19.
20.
21.
22.
23.
24.
25.
patients after 6 years of highly active antiretroviral therapy. AIDS 2004,
18:1953-6.
Landay A, da Silva BA, King MS, Albrecht M, Benson C, Eron J, Glesby M,
Gulick R, Hicks C, Kessler H, Murphy R, Thompson M, White AC Jr, Wolfe P,
McMillan FI, Hanna GJ: Evidence of ongoing immune reconstitution in
subjects with sustained viral suppression following 6 years of lopinavirritonavir treatment. Clin Infect Dis 2007, 44:749-54.
Moore RD, Keruly JC: CD4+ cell count 6 years after commencement of
highly active antiretroviral therapy in persons with sustained virologic
suppression. Clin Infect Dis 2007, 44:441-6.
Gras L, Kesselring AM, Griffin JT, van Sighem AI, Fraser C, Ghani AC,
Miedema F, Reiss P, Lange JM, de Wolf F, ATHENA, Netherlands National
Observational Cohort Study: CD4 cell counts of 800 cells/mm3 or greater
after 7 years of highly active antiretroviral therapy are feasible in most
patients starting with 350 cells/mm3 or greater. J Acquir Immune Defic
Syndr 2007, 45:183-92.
Kaufmann GR, Furrer H, Ledergerber B, Perrin L, Opravil M, Vernazza P,
Cavassini M, Bernasconi E, Rickenbach M, Hirschel B, Battegay M, Swiss HIV
Cohort Study: Characteristics, determinants, and clinical relevance of CD4
T cell recovery to <500 cells/μL in HIV type 1-infected individuals
receiving potent antiretroviral therapy. Clin Infect Dis 2005, 41:361-72.
Khanna N, Opravil M, Furrer H, Cavassini M, Vernazza P, Bernasconi E,
Weber R, Hirschel B, Battegay M, Kaufmann GR, Swiss HIV Cohort Study:
CD4+ T cell count recovery in HIV type 1-infected patients is
independent of class of antiretroviral therapy. Clin Infect Dis 2008,
47:1093-101.
Nash D, Katyal M, Brinkhof MW, Keiser O, May M, Hughes R, Dabis F,
Wood R, Sprinz E, Schechter M, Egger M, ART-LINC Collaboration of IeDEA:
Long-term immunologic response to antiretroviral therapy in lowincome countries: a collaborative analysis of prospective studies. AIDS
2008, 22:2291-302.
García F, de Lazzari E, Plana M, Castro P, Mestre G, Nomdedeu M, Fumero E,
Martínez E, Mallolas J, Blanco JL, Miró JM, Pumarola T, Gallart T, Gatell JM:
Long-term CD4+ T-cell response to highly active antiretroviral therapy
according to baseline CD4+ T-cell count. J Acquir Immune Defic Syndr
2004, 36:702-13.
Kelley CF, Kitchen CM, Hunt PW, Rodriguez B, Hecht FM, Kitahata M,
Crane HM, Willig J, Mugavero M, Saag M, Martin JN, Deeks SG: Incomplete
peripheral CD4+ cell count restoration in HIV-infected patients receiving
long-term antiretroviral treatment. Clin Infect Dis 2009, 48:787-94.
Mocroft A, Phillips AN, Gatell J, Ledergerber B, Fisher M, Clumeck N,
Losso M, Lazzarin A, Fatkenheuer G, Lundgren JD, EuroSIDA study group:
Normalisation of CD4 counts in patients with HIV-1 infection and
maximum virological suppression who are taking combination
antiretroviral therapy: an observational cohort study. Lancet 2007,
370:407-13.
Lok JJ, Bosch RJ, Benson CA, Collier AC, Robbins GK, Shafer RW,
Hughes MD, ALLRT team: Long-term increase in CD4+ T-cell counts
during combination antiretroviral therapy for HIV-1 infection. AIDS 2010,
24:1867-76.
Guihot A, Tubiana R, Breton G, Marcelin AG, Samri A, Assoumou L,
Goncalves E, Bricaire F, Costagliola D, Calvez V, Rouzioux C, Autran B,
Katlama C, Carcelain G, ALT-ANRS CO-15 study group, DECAMUNE study
group: Immune and virological benefits of 10 years of permanent viral
control with antiretroviral therapy. AIDS 2010, 24:614-17.
Althoff KN, Gange SJ, Klein MB, Brooks JT, Hogg RS, Bosch RJ, Horberg MA,
Saag MS, Kitahata MM, Justice AC, Gebo KA, Eron JJ, Rourke SB, Gill MJ,
Rodriguez B, Sterling TR, Calzavara LM, Deeks SG, Martin JN, Rachlis AR,
Napravnik S, Jacobson LP, Kirk GD, Collier AC, Benson CA, Silverberg MJ,
Kushel M, Goedert JJ, McKaig RG, Van Rompaey SE, Zhang J, Moore RD,
North American AIDS Cohort Collaboration on Research and Design: Late
presentation for human immunodeficiency virus care in the United
States and Canada. Clin Infect Dis 2010, 50:1512-20.
Keruly JC, Moore RD: Immune status at presentation to care did not
improve among antiretroviral-naive persons from 1990 to 2006. Clin
Infect Dis 2007, 45:1369-74.
Cole SR, Li R, Anastos K, Detels R, Young M, Chmiel JS, Muñoz A:
Accounting for leadtime in cohort studies: evaluating when to initiate
HIV therapies. Stat Med 2004, 23:3351-63.
Marconi VC, Grandits GA, Weintrob AC, Chun H, Landrum ML, Ganesan A,
Okulicz JF, Crum-Cianflone N, O’Connell RJ, Lifson A, Wortmann GW,
Lifson et al. AIDS Research and Therapy 2011, 8:2
/>
26.
27.
28.
29.
30.
31.
32.
33.
34.
35.
36.
37.
Page 11 of 11
Agan BK, the Infectious Disease Clinical Research Program HIV Working
Group (IDCRP): Outcomes of highly active antiretroviral therapy in the
context of universal access to healthcare: the U.S. Military HIV Natural
History Study. AIDS Res Ther 2010, 7:14.
Brodine SK, Shaffer RA, Starkey MJ, Tasker SA, Gilcrest JL, Louder MK,
Barile A, VanCott TC, Vahey MT, McCutchan FE, Birx DL, Richman DD,
Mascola JR: Drug resistance patterns, genetic subtypes, clinical features,
and risk factors in military personnel with HIV-1 seroconversion. Ann
Intern Med 1999, 131:502-6.
Chun HM, Fieberg AM, Huppler Hullsiek K, Lifson AR, Crum-Cianflone NF,
Weintrob AC, Ganesan A, Barthel RV, Bradley WP, Agan BK, Landrum ML,
Infectious Disease Clinical Research Program HIV Working Group:
Epidemiology of Hepatitis B virus infection in a US cohort of HIVinfected individuals during the past 20 years. Clin Infect Dis 2010,
50:426-36.
Centers for Disease Control: 1993 revised classification system for HIV
infection and expanded surveillance case definition for AIDS among
adolescents and adults. MMWR 1992, 41(RR-17):1-19.
Weintrob AC, Grandits GA, Agan BK, Ganesan A, Landrum ML, CrumCianflone NF, Johnson EN, Ordóđez CE, Wortmann GW, Marconi VC, IDCRP
HIV Working Group: Virologic response differences between African
Americans and European Americans initiating highly active antiretroviral
therapy with equal access to care. J Acquir Immune Defic Syndr 2009,
52:574-580.
World Health Organization: Rapid advice: antiretroviral therapy for HIV
infection in adults and adolescents, November 2009. Geneva: WHO; 2009,
1-24 [ />McKinnon LR, Kimani M, Wachihi C, Nagelkerke NJ, Muriuki FK, Kariri A,
Lester RT, Gelmon L, Ball TB, Plummer FA, Kaul R, Kimani J: Effect of
baseline HIV disease parameters on CD4+ T cell recovery after
antiretroviral therapy initiation in Kenyan women. PLoS One 2010, 5:
e11434.
Negredo E, Massanella M, Puig J, Pérez-Alvarez N, Gallego-Escuredo JM,
Villarroya J, Villarroya F, Moltó J, Santos JR, Clotet B, Blanco J: Nadir CD4 T
cell count as predictor and high CD4 T cell intrinsic apoptosis as final
mechanism of poor CD4 T cell recovery in virologically suppressed HIVinfected patients: clinical implications. Clin Infect Dis 2010, 50:1300-8.
Gazzola L, Tincati C, Bellistrì GM, Monforte A, Marchetti G: The absence of
CD4+ T cell count recovery despite receipt of virologically suppressive
highly active antiretroviral therapy: clinical risk, immunological gaps, and
therapeutic options. Clin Infect Dis 2009, 48:328-37.
Lange CG, Lederman MM, Medvik K, Asaad R, Wild M, Kalayjian R, Valdez H:
Nadir CD4+ T-cell count and numbers of CD28+ CD4+ T-cells predict
functional responses to immunizations in chronic HIV-1 infection. AIDS
2003, 17:2015-23.
Valdez H, Connick E, Smith KY, Lederman MM, Bosch RJ, Kim RS, St Clair M,
Kuritzkes DR, Kessler H, Fox L, Blanchard-Vargas M, Landay A, AIDS Clinical
Trials Group Protocol 375 Team: Limited immune restoration after 3 years’
suppression of HIV-1 replication in patients with moderately advanced
disease. AIDS 2002, 16:1859-66.
Pitrak DL, Bolaños J, Hershow R, Novak RM: Discordant CD4 T lymphocyte
responses to antiretroviral therapy for HIV infection are associated with
ex-vivo rates of apoptosis. AIDS 2001, 15:1317-9.
Hunt PW, Martin JN, Sinclair E, Bredt B, Hagos E, Lampiris H, Deeks SG: T
cell activation is associated with lower CD4+ T cell gains in human
immunodeficiency virus-infected patients with sustained viral
suppression during antiretroviral therapy. J Infect Dis 2003, 187:1534-43.
doi:10.1186/1742-6405-8-2
Cite this article as: Lifson et al.: Long-term CD4+ lymphocyte response
following HAART initiation in a U.S. Military prospective cohort. AIDS
Research and Therapy 2011 8:2.
Submit your next manuscript to BioMed Central
and take full advantage of:
• Convenient online submission
• Thorough peer review
• No space constraints or color figure charges
• Immediate publication on acceptance
• Inclusion in PubMed, CAS, Scopus and Google Scholar
• Research which is freely available for redistribution
Submit your manuscript at
www.biomedcentral.com/submit