Báo cáo y học: " Characteristics of CD8+ T cell subsets in Chinese patients with chronic HIV infection during initial ART" doc
Bạn đang xem bản rút gọn của tài liệu. Xem và tải ngay bản đầy đủ của tài liệu tại đây (375.32 KB, 7 trang )
RESEARC H Open Access
Characteristics of CD8+ T cell subsets in Chinese
patients with chronic HIV infection during initial
ART
Yanmei Jiao
†
, Wei Hua
†
, Tong Zhang, Yonghong Zhang, Yunxia Ji, Hongwei Zhang
*
and Hao Wu
*
Abstract
Background: CD8+ T cells may play an important role in protecting against HIV. However, the changes of CD8+ T
cell subsets during early period of ART have not been fully studied.
Methods: Twenty-one asymptomatic treatment-naive HIV-infected patients with CD4 T+ cells less than 350 cells/μl
were enrolled in the study. Naïve, central memory(CM), effective memory(EM) and terminally differentiated effector
(EMRA) CD8+ cell subsets and their activation and proliferation subsets were evaluated in blood samples collected
at base line, and week 2, 4, 8 and 12 of ART.
Results: The total CD8+ T cells declined and the Naïve and CM subsets had a tendency of increase. Activation
levels of all CD8+ T cell subsets except EMRA subset decreased after ART. However, proliferation levels of total
CD8+ T cells, EMRA, EM and CM subsets increased at the first 4 weeks of ART, then decreased. Proliferation level of
the naïve cells decreased after ART.
Conclusion: The changes of CD8+ T cell subsets during initial ART are complex. Our results display a complete
phenotypical picture of CD8+ cell subsets during initial ART and provide insights for understanding of immune
status during ART.
Background
CD8+ T cells play an important role in protection against
intracellular pathogens. Eliminating CD8+ T lymphocytes
from monkeys during chronic SIV infection resulted in a
rapid and marked increase in viremia, which was a gain
suppressed coincident with the reappear ance of SIV-spe-
cific CD8+ T cells. Ant iviral CD8+ T cells controlled the
acute viremic phase of the infection, resulting in the
establishment of the viral set point [1-3].
Many studies [4-6] evaluated the changes of CD4+ cell
subsets during antiretroviral treatment (ART). However,
the changes of CD8+ T cell subsets in early period of
ART have not been fully studied yet.
Here, in our study, we investigated the characteristics
of naive (CD45RA +CCR7+), central memory (CM)
(CD45RA - CCR7+), effector memory (EM) (CD45RA-
CCR7-), and terminally differentiated effector (EMRA)
(CD45RA+ CCR7-) cell subsets [7,8], as well as activa-
tion and proliferation levels of each subset, during initial
ART in Chinese patients. Our results demonstrated that
most of the CD8+ cell subsets decrease during initial
ART, while Naïve and CM subsets have a tendency of
increase, which may reflect the immune reconstitution
of CD8+ T cells.
Results
Baseline demographic and clinical characteristics of the
subjects
A total of 21 HIV/AIDS patients were enrolled from
Beijing You’an Hospital, Capital Medical Un iversity. At
baseline, the average age of subjects was 36.8 ±12.1
years (range, 23-64 years). The median plasma viral load
of subjects was 148,141 copies/ml (interquartile range
1,294-1,157,417 copies/mL), and the median CD4+ T
cell count was 230 cells/μl (interquartile range 46-349
cells/μl). The median CD8+ T cell count was 1053 cells/
μl (interquartile range 382-1675). And most of the sub-
jects were men who have sex with men (MSM).
* Correspondence: ;
† Contributed equally
Center for Infectious Diseases, Beijing You’an Hospital, Capital Medical
University, Beijng 100069, China
Jiao et al. AIDS Research and Therapy 2011, 8:15
/>© 2011 Jiao et al; licensee BioMed Ce ntral Ltd. This is an Open Access article distributed under the t erms of the Creative Commons
Attribution License ( which permits unrestricted use, di stribution, and repro duction in
any medium, provided the original work is properly cited.
Changes of CD8+ T cells, naïve, CM, EM and EMRA
subsets
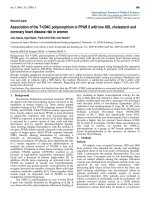
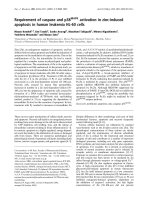
The gating strategy of CD8+ T cell populations was
showninfigure1.LongitudinalanalysesofCD8+T
cells, naïve, CM, EM and EMRA subsets in patients
with asymptomatic chronic HIV infection after ART
wereshowninfigure2.Themajorcomponentsof
CD8+ cells were EM and EMRA subsets, which
accounted for over 80 percent. Naïve and CM subsets
only accounted for less than 20 percent.
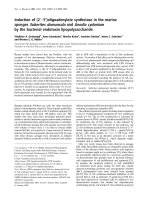
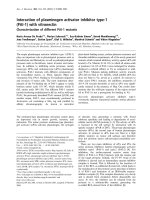
The median of CD8+ T cells decreased from 1053 to
904 cells/μl after 12 weeks of ART. Among the four
subsets of CD8+ cells, CD8+ EM and CD8+ EMRA sub-
sets had the same change pattern with CD8+ T cells.
The median of CD8+ EM subset decreased significantly
from 627 to 520 cells/μ l. Similarly, the median of CD8+
EMRA subset decreased significantly from 325 to 272
cells/μl.
The median of CD8+ naïve cells at baseline, week 2, 4,
8 and 12 was 79, 91, 99, 98, 102 c ells/μl respectively.
There were no significant differences among them. The
median of CD8+ CM subset kept slowly rising, from 21
cells/μl at baseline to 43 cells/μl at week 12 after ART.
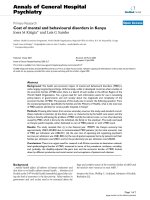
Activation of CD8+ cell subsets
We next investigat ed the effect of ART on T cell activa-
tion. HIV-infected individuals had higher T-cell activa-
tion in the blood as indicated by expression of HLA-DR
and CD38 [9]. Given the limited experimental condi-
tions, we did not stain CD38 with HLA-DR simulta-
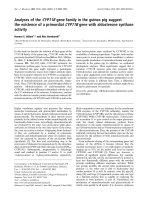
neously. At baseline the median proportion of activated
CD8+ T lymphocytes (CD38+) exceeded 80% and gra-
dually declined over 12 weeks, r eaching 73.77% (73.77 ±
9.14) at the last follow up visit. Activatio n of CD8+ EM
subsets decreased in a similar way, from 83.53% at base-
line to 72.87% at week 12. The median of activation of
CD8+ naïve cell subset was 62.997% at baseline. It fluc-
tuated between 49.0 9% and 65.7 9%, reaching to 63.32%
at week 12.
The median of percentage of CD38+ CD8+ CM subset
was 57.81%, 55.63%, 52.82%, 54.49% and 50.18% respec-
tively at the 5 times of follow up visits, fluctuating
between 50% and 58%. The median of CD8+ EMRA
subset was 84.43%, 86.11%, 83.64%, 85.22% and 83 .90%
respectively at the 5 times of follow up visits, stayin g at
a high level. Activation levels of the two subsets had no
significant changes after ART.
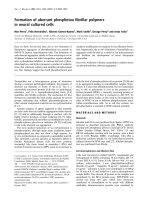
With respect to HLA-DR expression on CD8+ lym-
phocytes, there was also a high percentage of expression
at base line. The percentage of HLA-DR expression
decreased from 76.91% at baseline to 71.26 at week 12
aft er ART, which has the similar change patte rn to t hat
of CD38 expression.
The median of H LA-DR expression on CD8+ naïve
cell subset declined from 9.39% at baseline to 7.24% at
week 12 after ART. For CD8+ CM subset, the median
percentage of HLA-DR expression declined from 65.91%
at baseline to 51.43% at week 12. The median percen-
tagesofCD8+EMandEMRAsubsetswerebothina
high level around 80%. There were no significant
changes in activation of CD8+ EM and EMRA subsets
as indicated by HLA-DR.
Proliferation of CD8+ cell subsets
Proliferating subsets are calculated by measurement
of Ki67 expressio n. The median o f percentage o f
Ki67+CD8+ T cells elevated slightly at the f irst 4 weeks
of ART, then decreased gradually. Their values a t the 5
times of follow up visits were 4.85%, 7.27%, 6.85%,
5.73% and 4.27% respectively.
The median of proliferation of CD8+ naïve subset was
1.29%, 1.47%, 1.33%, 0.83% and 0.85% respectively at the
CD45RA APC
CCR7 FITC
Naive
CM
EM
EMRA
FSC-H
SSC-H
R1
IgG1PE
CD8 PerCP
R2
Figure 1 The gating strategy of CD8+ T cell populations from a single representative subject. Lymphocytes were gated first. Then CD8+
cells were gated. Central memory (CM; CD45RA-CCR7+), naive (CD45RA + CCR7+), effector memory (EM; CD45RA-CCR7-), and terminally
differentiated effector (EMRA; CD45RA + CCR7-) subsets were gated based on gated CD8+ cells.
Jiao et al. AIDS Research and Therapy 2011, 8:15
/>Page 2 of 7
5 times of fol low up visits. And the median of prolifera-
tion of CD8+ CM subset was 7.47%, 8.05%, 8.52%,
5.41% and 4.40% respectively. Both of the two subsets
had the trend of decline.
Ki67 expression on CD8+ EM cells had no signifi-
cantly change after ART, fluctuating between 5.60% and
9.65%. For CD8 + EMRA cells, percentage of Ki67 posi-
tive cells elevated after ART, reaching to peak of 4.09%
at week 8, then decreased to 2.74% at week 12.
The changes of mean fluorescence index (MFI) of
CD38 and Ki67 on CD8+ cell subsets have the same
pattern with those of percentages (data not shown).
Discussion
It has been reported previously that changes in the levels of
T cell subsets occurred after a long-term of ART, showing
a biphasic increase in CD4+ T cells and a trend of decrease
in CD8+ T cells [4-6]. However, little is known about the
change of CD8+ cell subsets during early period of ART.
In this study we investigated the dynamic changes not only
in CD8+ cell subsets, but also in their activation and prolif-
eration subsets in Chinese HIV/AIDS patients during early
period of ART, particularly in MSM population.
The number of CD 8+ T cells decrease after long-
term of ART [10,11]. Since their follow-up intervals are
too long, the early dynamic of CD8+ T cells c an not be
presented completely. Here, our results displayed a com-
plete phenotypical picture of CD8+ cell subsets during
initial ART. The total CD8+ T cel ls had a tendency of
decrease (see figure 2).
Of the 4 subsets we studied, EMRA and EM subsets
declined in consistent with total CD8+ T cells, while the
naïve and CM subsets had a tendency of increase during
the first 3 months of ART (see figure 2). However, most
of the changes had no significant differences. From the
results we ca n see that the decline s of CD8+ T cells are
mainly composed of EMRA and EM subsets, which may
play important roles in direct killing of target cells. The
decrease of EMRA and EM subsets may result from the
migration of these cells from blood to lymph tissues
[12]. Another reason may be the decline of HIV anti-
gens after ART [13,14].
During progressive HIV infection, naive T cells are
preferentially targeted, causing a marked decrease in
their propor tion [15,16]. The process of i mmune rec ov-
ery in HAART-treated adults induces a slow sustained
increase of naive lymphocytes [13,17]. The memory sub-
set derives from the naive cells by a post-thymic
maturation process. Our results showed that the
naïve and CM subsets have a tendency of increase.
0
100
200
300
400
0 2 4 8 12
ART time (weeks)
CD8 naive count (cells/ul)
0
500
1000
1500
2000
2500
0 2 4 8 12
*
ART time (weeks)
CD8 count (cells/ul)
0
50
100
150
*
0 2 4 8 12
ART time (weeks)
CD8 CM count (cells/ul)
0
500
1000
1500
2000
*
0 2 4 8 12
ART time
(
weeks
)
CD8 EM count (cells/ul)
0
200
400
600
800
*
*
0 2 4 8 12
ART time (weeks)
CD8 EMRA count (cells/ul)
Z
ZZ
Z Z
ZZ
Z Z
ZZ
Z Z
ZZ
Z Z
ZZ
Z
7RWDO
7RWDO7RWDO
7RWDO
1DLY
H
1DLYH1DLY
H
1DLYH
&0
&0&0
&0
(0
(0(0
(0
(05$
(05$(05$
(05$
A
C
B
DEFDEF
0 2
4
8 12
Median of cells
ART time (weeks)
Figure 2 Percentage changes in absolute CD8+ T cells and each phenotypic subset during initial ART (weeks). (A-E) Percentage changes
of CD8+ T cells, CD8 CM, CD8 EM and CD8 EMRA subsets respectively. (F) Mean percentage changes of CD8+ T cells, CD8 CM, CD8 EM and
CD8 EMRA subsets.
Jiao et al. AIDS Research and Therapy 2011, 8:15
/>Page 3 of 7
The increase of naïve and CM subsets may originate
from non-HIV specific CD8 cells, as was previous
reported [18] that CD8+ memory cells increased follow-
ing HAART were not c onsidered as HIV-sp ecific T
cells.
Activation of T cells is an important pathogenetic
event in HIV infection, which can be indicated by the
elevated expression of different antigens like CD38 and
HLA-DR on the surface of T lymphocytes [9]. CD38
level is a strongest predictive marker of HIV disease
progression [19,20] and may eve n predict antiretroviral
therapy (ART) treatment failure [21,22]. Several studies
[23-25] showed activated CD8+ T cells decreased after
ART. But they did not reveal the change of activated
CD8+ cell subsets. Both CD38 and HLA-DR expression
on CD8+ cell subsets decreased after ART in our study.
However, the magnitude of decrease is not remarkable
in some subsets of CD8+ T cells, especially EMRA sub-
set (see figure 3 and 4). One explanation is that the
plasma HIV viral loads are still above lower detection
limit (LDL) in most patients after 3 month of ART (data
not shown). Another reason is the potential exist of var-
ious opportunistic viral and bacterial infections.
T-cell proliferation based on Ki67 expression is corre-
lated generally with those obtained using direct
techniques [26,27], such as [2H] glucose incorporation.
There are some differences on the changes of percen-
tage of ki67+ CD8+ T cells. One report showed that the
percentages of CD8+Ki67+ cells increased during ART
[28], and the subset was maintained at a high percentage
until 18 weeks post ART. Another report [29] demon-
strated a decline of percentages of CD8+Ki67+ cells.
Our results showed that the percentages of Ki67+CD8+
cells as well as EM and EMRA subsets increased, while
those of naïve and CM subsets decreased (see figure 5).
The differences may come from sources of patients,
stage of the disease and duration of treatment time.
In conclusion, the changes of CD8+ T cell subsets
during initial ART are complex. Almost all of the CD8 +
cell subsets declined in activation levels during initial
ART. However, th e trends o f proliferation levels in dif-
ferent CD8+ subsets were inconsistent. Further studies
are needed to perform on a large scale and general
population.
Materials and met hods
Participants and study
Twenty-one HIV-1-infected treatment-naïve patients
were randomly enrolled from HIV/AIDS clinic of Beijing
You’an Hospital, with CD4+ T cell counts at less than
0
20
40
60
80
100
**
*
**
0 2 4 8 12
ART time (weeks)
CD38+CD8 %
0
20
40
60
80
100
0 2 4 8 12
*
ART time (weeks)
CD38+CD8 naive %
0
20
40
60
80
100
*
0 2 4 8 12
ART time (weeks)
CD38+CD8 CM %
0
20
40
60
80
100
0 2 4 8 12
**
*
*
ART time (weeks)
CD38+CD8 EM %
0
20
40
60
80
100
0 2 4 8 12
ART time (weeks)
CD38+CD8 EMRA %
Z
ZZ
Z Z
ZZ
Z Z
ZZ
Z Z
ZZ
Z Z
ZZ
Z
7RWDO
1DLYH
&0
(0
(05$
A
C
B
DEFDEF
Median of CD38+%
ART tiem
(
weeks
)
0 2 4 8 12
Z
ZZ
Z Z
ZZ
Z Z
ZZ
Z Z
ZZ
Z Z
ZZ
Z
7RWDO
1DLYH
&0
(0
(05$
0 2 4 8 12
Figure 3 Percentage changes in CD38 expressed CD8+ T cells and each phenotypic su bset during initial ART (weeks). (A-E) Percentage
changes of CD38 expressed CD8+ T cells, CD8 CM, CD8 EM and CD8 EMRA subsets respectively. (F) Mean percentage changes of CD38
expressed CD8+ T cells, CD8 CM, CD8 EM and CD8 EMRA subsets.
Jiao et al. AIDS Research and Therapy 2011, 8:15
/>Page 4 of 7
0
20
40
60
80
100
0 2 4 8 12
**
*
ART time (weeks)
HLA-Dr+ CD8 %
0
10
20
30
40
0 2 4 8 12
**
*
ART time (weeks)
HLA-Dr+CD8 naive %
0
20
40
60
80
100
0 2 4 8 12
*
ART time (weeks)
HLA-Dr+CD8CM %
50
60
70
80
90
100
110
0 2 4 8 12
ART time
(
weeks
)
HLA-Dr+CD8EM %
0
20
40
60
80
100
0 2 4 8 12
ART time (weeks)
HLA-Dr+CD8EMRA%
Z
ZZ
Z Z
ZZ
Z Z
ZZ
Z Z
ZZ
Z Z
ZZ
Z
7RWDO
1DLYH
&0
(0
(05$
DEFDEF
A
C
B
Median of HLA-DR+%
ART time (weeks)
0 2
4
12
8
Figure 4 Percentage changes in HLA-DR expressed CD8+ T cells and each phenotypic subset during initial ART (weeks).(A-E)
Percentage changes of HLA-DR expressed CD8+ T cells, CD8 CM, CD8 EM and CD8 EMRA subsets respectively. (F) Mean percentage changes of
HLA-DR expressed CD8+ T cells, CD8 CM, CD8 EM and CD8 EMRA subsets.
0 2 4 8 12
0
10
20
30
40
ART time (weeks)
Ki67+CD8 %
0 2 4 8 12
0
2
4
6
8
**
*
ART time (weeks)
Ki67+CD8naive %
0 2 4 8 12
0
10
20
30
40
*
ART time (weeks)
Ki67+CD8CM %
0 2 4 8 12
0
20
40
60
ART time (weeks)
Ki67+CD8EM %
0 2 4 8 12
0
10
20
30
**
ART time (weeks)
Ki67+CD8EMRA %
Z
ZZ
Z Z
ZZ
Z Z
ZZ
Z Z
ZZ
Z Z
ZZ
Z
7RWDO
1DLYH
&0
(0
(05$
DEFDEF
AC
B
Median of Ki67+%
ART time (weeks)
0
2 4
8 128 128
Figure 5 The changes in Ki67 expressed CD8+ T cells and each phenotypic subset during initial ART (weeks).(A-E)changesofKi67
expressed CD8+ T cells, CD8 CM, CD8 EM and CD8 EMRA subsets respectively. (F) Mean changes of Ki67 expressed CD8+ T cells, CD8 CM, CD8
EM and CD8 EMRA subsets.
Jiao et al. AIDS Research and Therapy 2011, 8:15
/>Page 5 of 7
350 cells/ul and no opportunistic infections w ithin the
previous th ree months. Exclusion criteria included preg-
nancy, active tuberculosis, or serious liver/renal dysfunc-
tion. All individuals were treat ed with ART, w hich
included 3TC + d4T (or AZT) + NVP. The study was
approved by the Beijing You’an Hospital Research Ethics
Committee, and written informed consent was obtained
from each subject.
Collection of Blood Samples
Fasting venous b lood samples were collected at 8-9 in
the morning in EDTA-containing tubes at baseline, 2, 4,
8 and 12 weeks of treatment. Peripheral blood mono-
nuclear cells (PBMCs) were isolated by Ficoll-Hypaque
density gradient centrifug ation. Activation and prolifera-
tion markers were detected immediately after isolation.
Flow cytometric analysis
The monoclonal antibodies (mAbs) of CD8+-PerCP,
CCR7-FITC, HLA-DR-PE and CD38-PE were purchased
from BD Bioscience (San Diego, CA, USA). Anti-
CD45RA-APC and anti-Ki67-PE was purchased from
eBioscience (San Diego, CA, USA).
Levels of immune activation were examined through
CD38 and HLA-DR expressions on different subsets of
CD8+ T lymphocytes. Freshly isolated PBMCs were
stained with ant-CD8-PerCP, anti-CD45RA-APC, anti-
CCR7-FITC and anti-CD38-PE or anti-HLA-DR-PE or
the correspon ding IgG1-PE isotype control according to
manufacturer’s instructions.
Cell proliferati on was studied by measuring expression
of the Ki-67 antigen. Freshly isolated PBMCs were incu-
bated with anti-CD8-PerCP, anti-CD45RA-APC, anti-
CCR7-FITC at 4°C for 30 min according to manufac-
ture’ s instructions. After washing with phosphate-buf-
fered saline (PBS), permeabilization was performed by
incubating cells with Cytofix/Cytoperm (BD Pharmigen,
San Diegio, CA) at 4°C for 20 min. Cells were stained
intracellulary with anti-Ki67-PE or the corresponding
isotype control anti-IgG1-PE at room temperatur e for 30
min. After washing with PBS, Four-color flow cytometric
analyses were then performed using FACSCalibur and
CELLQuest software (Becton Dickinson, San Jose, CA).
Assays for CD4+ and CD8+ T cell counts and Plasma HIV-
1 RNA
After whole-blood lysis (FACSlysing Solution, Becton
Dickinson San Diego, CA, USA), T lymphocyte counts
were determined by three-color flow cytometry using
CD3-APC, CD4-FITC and CD8+-PE monoclonal anti-
body (BD Bioscience San Diego, CA, USA). The analy sis
was p erformed on a BD FACSCount flow cytometer in
accordance with Chinese Center for Disease Control
and Prevention (CDC) guidelines.
Plasma viral load were measured by the Amplicor
HIV-1 monitor ultrasensitive Method (Roche, Germany),
with a detection limit of 40 copies/ml of plasma.
Statistical analysis
Data analysis was performed with SPSS 11.5 for Win-
dows software (SPSS Inc, Chicago, IL). Statistical signifi-
cance w ithin groups was analyzed with Kruskal-Wallis
Test; statistical significance between groups was ana-
lyzed with the Mann-Whitney U test. P < 0.05 is consid-
ered statistically significant.
Acknowledgements
This study was supported in part by the National 11th Five-Year Major
Projects of China (2008ZX10001-001, 2008ZX10001-006), and Beijing
Municipal of Science and Technology Major Project (D09050703590901).
Authors’ contributions
YJ drafted the manuscript and statistical analyses. WH participated in flow
cytometric analysis. TZ followed up patients and collected samples. YZ
assisted with manuscript and data anlysis. YJ assisted with flow cytometric
analysis and data acquisition. HZ conceived the study and participated in
the data analysis. HW supervised and coordinated the study. All authors
have read and approved the final manuscript.
Competing interests
The authors declare that they have no competing interests.
Received: 17 October 2010 Accepted: 25 March 2011
Published: 25 March 2011
References
1. Borrow P, Lewicki H, Hahn BH, Shaw GM, Oldstone MB: Virus-specific CD8+
cytotoxic T-lymphocyte activity associated with control of viremia in
primary human immunodeficiency virus type 1 infection. J Virol 1994,
68:6103-10.
2. Koup RA, Safrit JT, Cao Y, Andrews CA, McLeod G, Borkowsky W, Farthing C,
Ho DD: Temporal association of cellular immune responses with the
initial control of viremia in primary human immunodeficiency virus type
1 syndrome. J Virol 1994, 68:4650-5.
3. Metzner KJ, Jin X, Lee FV, Gettie A, Bauer DE, Di Mascio M, Perelson AS,
Marx PA, Ho DD, Kostrikis LG, Connor RI: Effects of in vivo CD8(+) T cell
depletion on virus replication in rhesus macaques immunized with a
live, attenuated simian immunodeficiency virus vaccine. J Exp Med 2000,
191:1921-31.
4. Ding YY, Jia WQ, Wang JS, Dong SL, Yang QH, Zhou RY, Qu SX, Lu LX,
Wei J, Qiao XC, Gao MY, Guo XL, Zhang TJ, Wu ZY, He N: [Survival and
immune response of rural HIV/AIDS patients after free antiretroviral
therapy]. Zhonghua Liu Xing Bing Xue Za Zhi 2008, 29:1176-80.
5. Zhang F, Haberer JE, Zhao Y, Dou Z, Zhao H, He Y, Cao GH: Chinese
pediatric highly active antiretroviral therapy observational cohort: a 1-
year analysis of clinical, immunologic, and virologic outcomes. J Acquir
Immune Defic Syndr 2007, 46:594-8.
6. Zhou HY, Zheng YH, He Y, Chen Z, Liu M, Yin W, Liu C: Evaluation of a 6-
year highly active antiretroviral therapy in Chinese HIV-1-infected
patients. Intervirology 2010, 53:240-6.
7. Sallusto F, Lenig D, Forster R, Lipp M, Lanzavecchia A: Two subsets of
memory T lymphocytes with distinct homing potentials and effector
functions. Nature 1999, 401:708-12.
8. Masopust D, Vezys V, Marzo AL, Lefrancois L: Preferential localization of
effector memory cells in nonlymphoid tissue. Science 2001,
291:2413-7.
9. Giorgi JV, Lyles RH, Matud JL, Yamashita TE, Mellors JW, Hultin LE,
Jamieson BD, Margolick JB, Rinaldo CR Jr, Phair JP, Detels R: Predictive
value of immunologic and virologic markers after long or short duration
of HIV-1 infection. J Acquir Immune Defic Syndr 2002, 29:346-55.
Jiao et al. AIDS Research and Therapy 2011, 8:15
/>Page 6 of 7
10. Li H, Zheng YH, Shen Z, Liu M, Liu C, He Y, Chen J, Ou QY, Huang ZL:
[Evaluation for two-year highly active antiretroviral therapy in Chinese
HIV-1 infection patients]. Zhonghua Yi Xue Za Zhi 2007, 87:2973-6.
11. Sester U, Sester M, Kohler H, Pees HW, Gartner BC, Wain-Hobson S,
Bocharov G, Meyerhans A: Maintenance of HIV-specific central and
effector memory CD4 and CD8 T cells requires antigen persistence. AIDS
Res Hum Retroviruses 2007, 23:549-53.
12. Alos L, Navarrete P, Morente V, Garcia F, Garrido M, Plana M, Mozos A,
Lopez A, Gil C, Pumarola T, Caballero M, Blanch JL, Fumero E, Miró JM,
Gallart T, Gatell JM, Campo E: Immunoarchitecture of lymphoid tissue in
HIV-infection during antiretroviral therapy correlates with viral
persistence. Mod Pathol 2005, 18:127-36.
13. Evans TG, Bonnez W, Soucier HR, Fitzgerald T, Gibbons DC, Reichman RC:
Highly active antiretroviral therapy results in a decrease in CD8+ T cell
activation and preferential reconstitution of the peripheral CD4+ T cell
population with memory rather than naive cells. Antiviral Res 1998,
39:163-73.
14. Mezzaroma I, Carlesimo M, Pinter E, Alario C, Sacco G, Muratori DS,
Bernardi ML, Paganelli R, Aiuti F: Long-term evaluation of T-cell subsets
and T-cell function after HAART in advanced stage HIV-1 disease. AIDS
1999, 13:1187-93.
15. Rabin RL, Roederer M, Maldonado Y, Petru A, Herzenberg LA: Altered
representation of naive and memory CD8 T cell subsets in HIV-infected
children. J Clin Invest 1995, 95:2054-60.
16. Roederer M, Dubs JG, Anderson MT, Raju PA, Herzenberg LA: CD8 naive T
cell counts decrease progressively in HIV-infected adults. J Clin Invest
1995, 95:2061-6.
17. Pakker NG, Notermans DW, de Boer RJ, Roos MT, de Wolf F, Hill A,
Leonard JM, Danner SA, Miedema F, Schellekens PT: Biphasic kinetics of
peripheral blood T cells after triple combination therapy in HIV-1
infection: a composite of redistribution and proliferation. Nat Med 1998,
4:208-14.
18. Ogg GS, Jin X, Bonhoeffer S, Moss P, Nowak MA, Monard S, Segal JP, Cao Y,
Rowland-Jones SL, Hurley A, Markowitz M, Ho DD, McMichael AJ, Nixon DF:
Decay kinetics of human immunodeficiency virus-specific effector
cytotoxic T lymphocytes after combination antiretroviral therapy. J Virol
1999, 73:797-800.
19. Eggena MP, Barugahare B, Okello M, Mutyala S, Jones N, Ma Y, Kityo C,
Mugyenyi P, Cao H: T cell activation in HIV-seropositive Ugandans:
differential associations with viral load, CD4+ T cell depletion, and
coinfection. J Infect Dis 2005, 191:694-701.
20. Liu Z, Cumberland WG, Hultin LE, Prince HE, Detels R, Giorgi JV: Elevated
CD38 antigen expression on CD8+ T cells is a stronger marker for the
risk of chronic HIV disease progression to AIDS and death in the
Multicenter AIDS Cohort Study than CD4+ cell count, soluble immune
activation markers, or combinations of HLA-DR and CD38 expression. J
Acquir Immune Defic Syndr Hum Retrovirol 1997, 16(2):83-92.
21. Vigano A, Saresella M, Rusconi S, Ferrante P, Clerici M: Expression of CD38
on CD8 T cells predicts maintenance of high viraemia in HAARTtreated
HIV-1-infected children. Highly active antiretroviral therapy. Lancet 1998,
352:1905-6.
22. Hunt PW, Deeks SG, Rodriguez B, Valdez H, Shade SB, Abrams DI,
Kitahata MM, Krone M, Neilands TB, Brand RJ, Lederman MM, Martin JN:
Continued CD4 cell count increases in HIV-infected adults experiencing
4 years of viral suppression on antiretroviral therapy. AIDS 2003,
17:1907-15.
23. Autran B, Carcelain G, Li TS, Blanc C, Mathez D, Tubiana R, Katlama C,
Debre P, Leibowitch J: Positive effects of combined antiretroviral therapy
on CD4+ T cell homeostasis and function in advanced HIV disease.
Science 1997, 277:112-6.
24. Borkowsky W, Stanley K, Douglas SD, Lee S, Wiznia A, Pelton S, Yogev R,
McIntosh K, Nachman S: Immunologic response to combination
nucleoside analogue plus protease inhibitor therapy in stable
antiretroviral therapy-experienced human immunodeficiency virus-
infected children. J Infect Dis 2000, 182:96-103.
25. Bouscarat F, Levacher M, Landman R, Muffat-Joly M, Girard PM, Saimot AG,
Brun-Vezinet F, Sinet M: Changes in blood CD8+ lymphocyte activation
status and plasma HIV RNA levels during antiretroviral therapy. AIDS
1998, 12:1267-73.
26. Johnson RP: The dynamics of T-lymphocyte turnover in AIDS. AIDS 2000,
14(Suppl 3):S3-9.
27. Hellerstein MK: Measurement of T-cell kinetics: recent methodologic
advances. Immunol Today 1999, 20:438-41.
28. Eggena MP, Barugahare B, Okello M, Mutyala S, Jones N, Ma Y, Kityo C,
Mugyenyi P, Cao H: T cell activation in HIV-seropositive Ugandans:
differential associations with viral load, CD4+ T cell depletion, and
coinfection. J Infect Dis 2005, 191:694-701.
29. Anthony KB, Yoder C, Metcalf JA, DerSimonian R, Orenstein JM, Stevens RA,
Falloon J, Polis MA, Lane HC, Sereti I: Incomplete CD4 T cell recovery in
HIV-1 infection after 12 months of highly active antiretroviral therapy is
associated with ongoing increased CD4 T cell activation and turnover. J
Acquir Immune Defic Syndr 2003, 33:125-33.
doi:10.1186/1742-6405-8-15
Cite this article as: Jiao et al.: Characteristics of CD8+ T cell subsets in
Chinese patients with chronic HIV infection during initial ART. AIDS
Research and Therapy 2011 8:15.
Submit your next manuscript to BioMed Central
and take full advantage of:
• Convenient online submission
• Thorough peer review
• No space constraints or color figure charges
• Immediate publication on acceptance
• Inclusion in PubMed, CAS, Scopus and Google Scholar
• Research which is freely available for redistribution
Submit your manuscript at
www.biomedcentral.com/submit
Jiao et al. AIDS Research and Therapy 2011, 8:15
/>Page 7 of 7