Derivatives Demystified A Step-by-Step Guide to Forwards, Futures, Swaps and Options phần 6 pps
Bạn đang xem bản rút gọn của tài liệu. Xem và tải ngay bản đầy đủ của tài liệu tại đây (173.7 KB, 25 trang )
Currency Options 109
10
11
12
13
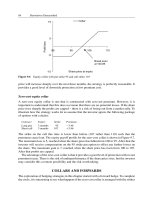
1.00 1.10 1.20 1.30
/$ rate at expiry
$ million received
Unhedged
Option hedge
Figure 11.3 Currency hedge using exchange-traded currency options
The two lines in Figure 11.3 cross when the spot rate is 1.125. At that level the dollars received
on the unhedged position is also $11.25 million. If the spot is below that level the option hedge
outperforms the unhedged position and produces more dollars for the euros. Above that level
the unhedged position actually produces more dollars than the hedged position. This is the
effect of paying premium to buy the option contracts. The put option offers protection against
a weakening euro, and a reasonable level of gain if the euro strengthens, but not the same level
as on an unhedged position.
FX COVERED CALL WRITING
The final currency option strategy investigated in this chapter is not a hedge, but a means
by which a corporation or financial institution can generate additional income by writing FX
options without incurring too much risk. Writing ‘naked’ or unhedged options is extremely
dangerous, but here the risk is covered through other underlying currency transactions. The
case we will explore is that of a US money manager. The manager holds £10 million in sterling-
denominated assets. The returns are acceptable but not spectacular, and the manager would
like to enhance the performance of the fund without taking too many risks. The spot rate is £/$
1.59. Two-month European-style sterling calls struck at $1.63 per pound are trading at 0.55
cents per pound.
The manager decides to write calls on sterling against the £10 million assets. If the calls are
ever exercised the manager will have to deliver pounds in return for dollars, but can liquidate
the assets to have the necessary sterling available. At a strike of 1.63 the dollars received would
be $16.3 million, which is rather better than the dollars received from liquidating the portfolio
at the current spot rate of 1.59. In the meantime, the calls will generate welcome premium
income.
Premium received = 10 000 000 × $0.0055 = $55 000
110 Derivatives Demystified
-0.5
-0.3
-0.1
0.1
0.3
0.5
1.55 1.57 1.59 1.61 1.63 1.65
£/$ spot rate at expiry
P&L $ million
Assets
Calls
Net
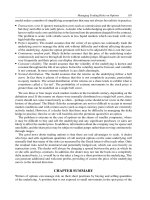
Figure 11.4 Outcome of FX covered call strategy
Figure 11.4 illustrates the profits and losses the investor would achieve as a result of movements
in the exchange rate between the pound and the dollar. This is shown at the expiry of the option
contracts and for a range of spot rates from 1.55 upwards. The vertical axis represents profits
and losses in millions of dollars. Note that the assumption throughout is that the sterling value
of the assets is unchanged at £10 million.
The solid line in the graph shows profits and losses on the underlying sterling assets resulting
from changes in the exchange rate. For example, the spot rate at the outset is 1.59 and the
sterling assets are worth $15.9 million. If the rate is unchanged, the profit and loss from
currency movements is zero, but if the pound strengthens or weakens, the dollar value of the
assets will change, resulting in gains or losses to the fund. The graph also shows the profits and
losses on the calls at expiry, and the net profit and loss on the combined covered call strategy.
A few examples will help to explain the values in the graph. Suppose the spot rate at expiry
is either 1.55 or 1.63 or 1.65:
r
Spot Rate = 1.55. The sterling-denominated assets are now worth only $15.5 million where
originally they were worth $15.9. This is a loss of $400 000. However, premium received
from writing the calls adds back $55 000 so the net loss is only $345 000. The options expire
out-of-the-money and worthless.
r
Spot Rate = 1.63. The sterling-based assets are now worth $16.3 million. This is a currency
gain of $400 000 million. To this is added the premium, so the net gain is $455 000. The
options expire at-the-money and worthless.
r
Spot Rate =1.65. Above 1.63 the written calls will be exercised. The manager has to deliver
£10 million and will receive $16.3 million. The currency gain on the assets is $400 000. To
this is added the premium, so the net gain is again $455 000. In fact the gain is capped at
this level.
The strategy is a known as a covered call because the money manager owns assets denominated
in British pounds which can be liquidated to cover the risks on the short call options. The
currency gains on the portfolio can reach $400 000 before the calls are exercised and the gains
Currency Options 111
are capped. In addition, the strategy generates premium income of $55 000. If the money
manager did not actually wish to liquidate the portfolio, an alternative approach is to buy the
calls back if the spot price looks like rising above the strike of 1.63.
CHAPTER SUMMARY
A currency or FX option conveys the right but not the obligation to exchange two currencies
at a predetermined rate. In a European-style contract the currencies can only be exchanged on
the expiry date. Exchange-traded options are generally standardized, although the exchanges
have introduced contracts that allow for some flexibility in the strikes and expiry dates and
quotation methods. FX options can be used to hedge currency exposures. Because they need not
be exercised, they can protect against adverse movements in an exchange rate while permitting
some degree of benefit if the rate moves in a favourable direction. The problem is the cost of
the premium. One way to reduce or eliminate the premium cost is a collar strategy. If the strikes
are set appropriately there is zero net premium to pay. The snag is that gains from currency
movements are capped at a certain level.
Another way to reduce premium when buying options to hedge currency exposures is to
incorporate a barrier feature into the contract. A company bidding for a contract that includes
currency risk maydecideto buy a compound option. This conveys the right but not the obligation
to buy a standard or ‘vanilla’ option at some future date. Institutional investors who purchase
assets denominated in foreign currencies can construct a covered call strategy. This involves
selling an out-of-the-money FX call on the foreigncurrency. If the call is exercised the investor is
covered because he or shecanliquidate the assets. The premium income adds to theperformance
of the fund. The disadvantage is that gains from favourable currency movements are capped.
12
Interest Rate Options
INTRODUCTION
In Chapters 3, 5 and 6 we explored products such as forward rate agreements (FRAs), in-
terest rate futures and interest rate swaps. FRAs and futures can be used by banks, traders,
corporations and institutional investors to manage exposures to or speculate on changes in
interest rates. However the potential gains are balanced by the potential losses. The buyer of
an FRA is paid compensation if the interest rate for the contract period turns out to be above
the contractual rate, but otherwise has to compensate the seller. If the contractual rate is the
expected rate for the period then the expected payout from the deal is zero. Interest rate futures
have similar characteristics, although settlement takes place daily and because of the different
quotation method it is the short who is paid out if interest rates rise.
A standard or ‘vanilla’ interest rate swap is the exchange of fixed for floating cash flows
on regular dates. The initial floating or variable cash flow is based on a cash market interest
rate (normally LIBOR). The subsequent cash flows are based on a sequence of future interest
rates. As such, it can be priced using the first cash market rate and the interest rate futures
that best match its payment periods. The fixed rate on a par swap is the rate that makes the
present values of the expected future cash flows equal to zero. The expected payout on a par
swap is zero. An interest rate option is different. The expected payout to the buyer (ignoring the
premium) is positive since the contract need not be exercised in unfavourable circumstances.
This flexibility has a price, the option premium. The premium restores the balance between
the buyer and the writer.
The interest rate option products explored in this chapter are over-the-counter and exchange-
traded options on short-term interest rates; interest rate caps, floors and collars; swaptions
(options to buy or to sell interest rate swaps); and bond options. We look at how the products
are quoted and at some practical applications. The payoff in all of these products depends on
what happens to market interest rates in the future, so that their valuation relies on an ability
to understand and model the behaviour of interest rates.
OTC INTEREST RATE OPTIONS
Interest rate options provide investors, traders and corporations with a flexible means of hedging
and managing interest rate risk. In recent decades the central banks of the major economies
have relaxed or abolished controls on currency exchange rates and tend to rely on short-term
interest rates as the major weapon to control inflation and regulate the economy. Among other
factors, this has led to increased volatility in interest rates and the need for sophisticated
risk-management tools.
In Chapter 3 we explored the structure and applications of forward rate agreements (FRAs).
The purchaser of an FRA is compensated in cash by the seller if the actual LIBOR rate for
the future time period covered by the contract is above the fixed contractual rate. Otherwise
114 Derivatives Demystified
the buyer compensates the seller. The contractual rate is a forward interest rate. In theory,
it can be established from cash market interest rates, although in practice it tends to be de-
termined by the prices at which the appropriate short-term interest rate futures contracts are
trading.
A European over-the-counter (OTC) interest rate call option is essentially a call on a forward
rate agreement for settlement on the option’s expiry date. The strike is the FRA fixed or
contractual rate. If at the expiry of the contract the LIBOR rate for the contract period is set
above the strike, then the owner of the call exercises and has a long position in an FRA, which
is settled in cash in the normal way. However, if the LIBOR rate is below the strike, the option
simply expires and no further payment is made. The buyer has to pay premium to the writer at
the outset based on the expected payout from the option contract.
As interest rate calls are used as components of interest rate caps (which we consider in
the next section), they are sometimes known as caplets. To illustrate how they work we take
a simple example of a European caplet. The notional principal is £10 million. This is used to
calculate the settlement payment on the underlying FRA if the contract is exercised. Additional
details of the contract are as follows:
Contract Contract period Expiry Strike rate Premium
European caplet 6v12 months In 6 months 4% p.a. 0.16% p.a.
The contract confers the right but not the obligation to buy an FRA with a notional of £10
million at a strike rate of 4% p.a. The future time period covered by the underlying FRA
begins in six months and ends six months later, i.e. a 12-month period. This time period is
often expressed in the market as ‘6v12’ or sometimes as ‘6x12’. The caplet expires in six
months. If it is exercised at that point it will become a long position in the underlying FRA.
Assuming the strike rate is the same as the forward rate for the contract period then the
caplet is at-the-money. The premium is expressed in terms of a per annum rate, though the
underlying FRA covers a six-month time period. The actual cost in sterling terms is calculated
as follows.
Premium cost = £10 million × 0.16% × 6/12 = £8000
The buyer of the caplet – the interest rate call – pays the premium to the writer, and then nothing
more is done until six months after the start date. At that point the LIBOR rate for the contract
period will be announced by the British Bankers’ Association (BBA). If we assume that the
rate is actually set at 5% p.a., then buyer of the call will exercise and have a long position in an
FRA at a contractual rate of 4% p.a. In practice this simply means that the writer has to make
a compensation payment based on the difference between 5% p.a. and 4% p.a. for a six-month
time period.
Compensation payment = £10 million × (5% − 4%) × 6/12 = £50 000
This is the compensation amount due at the end of the contract period, i.e. 12 months after
the option purchase date. As we saw in Chapter 3, it is conventional to make the settlement
payment after the actual LIBOR rate for the period is announced. In this example the payment,
to be made at the option expiry date, would be £50 000 discounted back for six months at
LIBOR. The real benefit of the caplet is that if the LIBOR rate is set at or below 4% then
the buyer is not obliged to exercise the contract. The maximum loss is the initial premium of
0.16% p.a., or £8000.
Interest Rate Options 115
Today
Purchase caplet
Strike = 4% p.a.
Period = 6v12
+6 months +1 year
Caplet expiry
Settlement date on
the underlying FRA
Maturity date
Figure 12.1 Payment dates on caplet
Hedging with interest rate calls
Imagine that the buyer of the caplet discussed in the previous section is a company that has
borrowed money and pays a variable or floating rate of interest on the loan. The details of the
company’s loan are as shown below:
Principal: £10 million
Interest rate: Six-month sterling LIBOR + 0.75% p.a.
Interest rate reset: Every six months
Payment dates: Payable in arrears every six months
There is exactly six months to the next interest payment on the loan. At that point the rate of
interest for the following six-month period will be reset at six-month sterling LIBOR plus 75
basis points (0.75%) per annum. The interest payment for the period will be made in arrears.
Suppose that the company is concerned that interest rates for this period might rise, increasing
its borrowing costs and affecting its profitability. It could buy a 6v12 FRA to cover the risk.
If LIBOR is set above the contractual rate the company will receive a payment on the FRA.
Unfortunately, if LIBOR is below that rate the company would have to make a settlement
payment to the seller of the FRA.
As an alternative, the company could purchase a call on the FRA (a caplet) – the right but not
the obligation to buy the FRA, with the terms as set out in the previous section. The premium
is 0.16% p.a. or £8000, the notional is £10 million, the contract period for the underlying FRA
is 6v12 and the strike is 4% p.a. Figure 12.1 shows the key payment dates on the caplet.
If the LIBOR rate in six months time for a six-month period is fixed at (say) 5% p.a. then
the company’s cost of borrowing on its underlying loan will be set at 5.75% for that period.
However, it can exercise the caplet and will receive a compensation payment on the underlying
FRA contract. Its net cost of borrowing is 4.91% p.a. calculated as follows:
Borrowing rate on loan = LIBOR + 0.75% p.a. = 5.75% p.a.
Plus premium paid for call = 0.16% p.a.
Less: compensation payment received on FRA = 1% p.a.
Net borrowing rate for the period = 4.91% p.a.
On the other hand, if LIBOR is set at or below the strike of the caplet, then the contract simply
expires worthless and the company need make no further payment. If, for example, LIBOR is
set at 3% p.a., the company’s net cost of borrowing is calculated as follows:
Borrowing rate on loan = LIBOR + 0.75% = 3.75% p.a.
Plus premium paid for call = 0.16% p.a.
Net borrowing rate for period = 3.91% p.a.
116 Derivatives Demystified
2%
3%
4%
5%
6%
7%
2% 3% 4% 5% 6% 7%
LIBOR setting p.a.
Borrowing rate p.a.
Unhedged
Hedged
Figure 12.2 Unhedged and hedged exposure to LIBOR
The graph in Figure 12.2 compares the company’s position if it does not hedge the interest rate
exposure (solid line) to its situation with the caplet in place (dotted line). By buying the caplet
the company establishes a maximum borrowing cost for the period of 4.91% p.a.
CAPS, FLOORS AND COLLARS
The caplet explored in the last section limits the company’s borrowing rate only for the six-
month future time period covered by the contract. The company may decide that it also wishes
to protect itself against increases in interest rates for the subsequent payment periods on its loan.
To do this it could buy a series or strip of caplets. The first, as before, would cover its interest
payment on the loan for the time period 6v12 (for six months starting in six months); the second
caplet would cover the time period 12v18 (for six months starting in 12 months); and so on.
If the strikes are all set at the same level this creates an interest rate cap. As the name
suggests, it is used to cap or limit a borrower’s effective funding rate for a series of future
interest payment periods. If for any one of the periods the LIBOR rate is set above the strike,
then the buyer of the cap is compensated in cash by the writer of the contract. The cap premium
is simply the sum of the premiums of the constituent caplets. It is either paid in a lump sum
at the outset, or in instalments, often on dates that match the interest payments made on the
underlying loan.
A caplet is priced in relation to the forward interest rate for the period it covers. A caplet
covering a period 6v12 is priced against the forward interest rate for the period 6v12. If the
market is expecting increases in LIBOR rates over the years ahead and the forward rates are
higher than cash market rates, this can mean that the premium cost of a cap with a strike set
around current interest rate levels is prohibitively expensive. The writer of the cap would have
to take into account the fact that he or she will most likely be making a number of compensation
payments to the buyer over the life of the contract. In other words, the expected payout from
the cap is high, and this has to be factored into the premium that is charged.
Interest Rate Options 117
Normally in this type of case the cap strike is set above current interest rate levels. Addition-
ally, a borrower may choose to combine the purchase of a cap with the sale of an interest rate
floor with a strike set at a lower rate. It would normally agree this as a package deal with an
option dealer. The combined strategy is called an interest rate collar, and operates as follows.
If the LIBOR rate for a payment period is set above the cap strike, the borrower receives a
compensation payment from the dealer. However, if the LIBOR rate is set below the strike of
the floor the borrower has to make a compensation payment to the dealer. The effect for the
borrower is to establish a maximum and a minimum funding rate. If the strikes of the cap and
floor are set appropriately the premiums cancel out and there is zero net premium to pay on
the deal. This structure is called a zero-cost collar.
We return to the case of a company that has borrowed £10 million on a variable or floating
rate basis. Interest payments are made every six months in arrears and the payment for a given
period will be set at the start of the period at LIBOR + 0.75%. p.a. This time the company
agrees a zero-cost collar strategy with a dealer based on a notional of £10 million, in which it
buys a cap struck at 7% p.a. and writes a floor struck at 5%. p.a. Payouts on the collar are made
every six months to match the payments on the underlying loan. Suppose that during one of
the loan payment periods the LIBOR rate for that period is set at 4%, at 6% or at 8% p.a.
r
LIBOR = 4% p.a. The rate on the underlying loan will be set at 4.75% p.a. The floor is
struck at 5% p.a. and LIBOR is 1% lower than this, therefore the company has to pay 1% p.a.
compensation to the dealer. As there is no premium to pay on the collar, the company’s net
borrowing cost for the period is 4.75% + 1% = 5.75% p.a.
r
LIBOR = 6%. The rate on the underlying loan will be set 6.75% p.a. There is nothing to be
paid on the floor and nothing is received on the cap, so the net cost of borrowing is simply
6.75% p.a.
r
LIBOR =8%. The rate on the underlying loan will be set at 8.75% p.a. The company receives
1% p.a. on the cap, since the strike is 7% p.a. The net cost of borrowing is therefore 8.75% −
1% = 7.75% p.a.
Because of the hedge the company’s minimum cost of borrowing is 5.75% p.a. and the max-
imum is 7.75% p.a. The result of the zero-cost collar hedge for a range of possible LIBOR
rates is illustrated in Figure 12.3.
SWAPTIONS
As another alternative, the company might consider an interest rate swap, in which it receives
a floating rate linked to LIBOR and pays in return a fixed rate of interest. The notional on the
swap would be set at £10 million and the payments would be made every six months in arrears
to match its underlying loan. (See Chapter 6 for further information on interest rate swaps.)
Suppose that the fixed rate on the swap is set at 6% p.a. In practice, this would be calculated
from the forward interest rates that cover the time periods to maturity. The effect of hedging
the loan with the interest rate swap is illustrated in Figure 12.4.
As a result of entering into the swap the company can fix its borrowing costs at 6.75% p.a.
The advantage of this strategy is that if interest rates rise sharply the company will not suffer as
a result. It has known borrowing costs for the lifetime of the swap and it can plan its business
activities accordingly. The drawback is that it cannot benefit from any decline in interest rates.
Compare this with the zero-cost collar strategy, where the company can gain from declining
interest rates as long as they do not fall below the strike of the floor.
118 Derivatives Demystified
4.75%
5.75%
6.75%
7.75%
8.75%
4% 5% 6% 7% 8%
LIBOR setting
Effective rate % p.a.
Figure 12.3 Zero-cost interest rate collar
COMPANY DEALER
6% p.a.
LIBOR
LOAN
LIBOR + 0.75%
Figure 12.4 Loan plus swap
As another alternative, the company can consider a European payer swaption. This confers
the right but not the obligation to enter into an interest rate swap at some point in the future (at
the expiry of the swaption). In the actual swap it would pay a fixed rate of interest and receive
LIBOR in return. The notional principal, the payment dates and the interest calculations on the
underlying swap would all be specified in the contract. The swaption provides flexibility. The
company has the choice over whether or not to exercise and to enter into the swap specified
in the contract. In addition, if at expiry the fixed rates on interest rate swaps in the market are
higher than the fixed rate agreed in the contract, a payer swaption would be in-the-money and
could be closed out at a profit.
Interest Rate Options 119
For example, suppose the company buys a swaption conferring the right in six months’ time
to enter into a swap paying 6.25% p.a. and receiving LIBOR. If in six months’ time the fixed
rate on swaps is 6.5% p.a., then the swaption has a positive value. In theory, the buyer of the
swaption could exercise the contract, enter into a swap paying a fixed rate at 6.25% p.a., and
at the same time make an offsetting deal in the spot market in which it receives 6.5% p.a. In
practice the swaption contract can be set up such that if it expires in-the-money the company
is paid the intrinsic value in cash by the writer of the contract. This, of course, would only
happen if swap rates rise, in which case the company’s borrowing costs would also increase.
There are two important differences between the zero-cost collar and the swaption strategies.
Firstly, there is premium to pay on a swaption. Secondly, the swaption can only be exercised
once. If exercised, the company acquires a position in an interest rate swap. The collar consists
of a series of interest rate options covering different time periods, each of which individually
may or may not be exercised depending on how the actual LIBOR rate for that period compares
with the strikes of the cap and of the floor. In practical terms, the company in the case study
will have to make its decision on which product to choose based on its attitude to risk, its views
on the likely direction of interest rates and its willingness or otherwise to pay premium. It has
a number of choices to consider (these are by no means exhaustive).
r
Do nothing. In which case its borrowing costs will increase if interest rates rise.
r
Buy an FRA. This will fix its effective borrowing rate for one time period only.
r
Pay fixed on a swap. This will fix its effective borrowing rate for a series of future time
periods. If interest rates fall it cannot benefit.
r
Buy a call on an FRA (a caplet). This will cap its effective borrowing rate for one future
time period only. However, it incurs premium costs.
r
Enter into a zero-cost collar. This establishes a minimum and a maximum borrowing rate for
a series of future time periods. There is no premium. However, the company can no longer
benefit if interest rates fall below the strike of the floor.
r
Buy a payer swaption, the right to enter a swap at some point in the future as the payer
of fixed and the receiver of a variable rate. If rates rise this can fix its effective borrowing
rate for a series of future time periods, and if rates fall the contract need not be exercised.
However, it incurs premium costs.
EURODOLLAR OPTIONS
Chapter 5 has details of the Eurodollar futures contracts traded on Chicago Mercantile Ex-
change (CME). They are widely used by financial institutions to manage their exposures to
changes in short-term interest rates. Contracts are based on a three-month $1 million notional
deposit starting in the future. The quotation is made in terms of 100 minus the interest rate for
that future time period. The notional principal is never exchanged. Instead, there are a series
of margin payments based on the changing price of the contract in the market.
A movement of 0.01 in the futures price is equivalent to a change of one basis point (0.01%)
in the interest rate for the future time period covered by the contract. It is worth $1 million
×0.01% × 3/12 = $25. Sellers or shorts gain if the interest rate increases. Buyers or longs
gain if the rate falls. Interest rate futures are used to price forward rate agreements, which
are their OTC relatives. CME also offers an option on the Eurodollar futures contract. The
premiums are quoted in a similar way to the futures prices. In dollar terms a premium of 20
basis points is worth 20 × $25 = $500.
120 Derivatives Demystified
r
A call option is the right to buy and a put is the right to sell a Eurodollar futures contract at
a fixed price, the strike price, on or before expiry.
r
If a long call is exercised it results in a long position in a futures contract, which benefits
from falling interest rates.
r
If a long put is exercised it results in a short position in a futures contract, which benefits
from rising interest rates.
r
In-the-money contracts are automatically exercised at expiry.
r
The options are American-style. If an option is exercised early a trader who is short a contract
is randomly assigned a futures position. If it is a call this results in a short position in the
futures for the assigned trader. A put results in a long position.
To illustrate how the contracts work, suppose that a trader buys one December Eurodollar put
struck at 98.62. The December futures is trading at 98.71. The agreed premium is 10 basis
points. Each point is worth $25 so the dollar premium is calculated as follows:
Premium cost = 10 points × $25 = $250
The put is out-of-the money since it confers the right to sell a futures at only 98.62 when it is
trading above this level on the exchange. Therefore the option has zero intrinsic value and the
premium cost is purely time value. The futures price is based on the expected rate of interest for
the three-month period starting in December. The expected rate is 100 − 98.71 = 1.29% p.a.
The closing price of the December futures at expiry is based on the actual LIBOR rate set
for the period covered by the contract. Suppose it is set at 2% p.a. at expiry. Then the December
futures will close at 100.00 − 2.00 = 98.00. The trader owns a put that provides the right to
sell a Eurodollar futures at 98.62. The net profit is calculated as follows:
Intrinsic value in points = 9862 − 9800 = 62 points
Value in dollars = 62 × $25 = $1550
Net profit (intrinsic value less premium) = $1550 − $250 = $1300
The net profit can also be calculated as 62 points intrinsic value less 10 points premium which
is 52 points × $25 = $1300. Suppose, on the other hand, that the December futures closes at
expiry at (say) 99.00 based on a LIBOR rate set at 1.00% p.a. Then the put option will simply
not be exercised. For the buyer of the contract, the worst that can happen is that the option
expires out-of-the-money and the initial premium has been lost.
EURO AND STERLING INTEREST RATE OPTIONS
Very similar interest rate option contractsare traded in Europe. The three-month Euriborfutures
traded on LIFFE (through its electronic network) is based on a €1 million deposit starting in
March, June, September or December plus certain other months. A Euribor option contract is
the right to buy or to sell one Euribor futures. Each one-point move in the market value of a
contract is worth €25 though the price is allowed to change in half-point intervals. Exercise
can take place on any business day and results in a position in the futures with the expiry month
associated with that option. For example, the exercise of a long December call results in a long
position in the December futures. The exercise of a long March put results in a short position
in the March futures.
Interest Rate Options 121
LIFFE also offers a option on the three-month sterling interest rate futures. The main dif-
ference here is that the underlying futures is based on a notional £500 000 deposit, so each
full point move in the price quotation is worth £12.50. The premium is not paid in full when an
option is purchased. Instead, initial margin is posted at the outset and a series of daily variation
margin payments or receipts are made, depending on the changing market value of the contract.
BOND OPTIONS
Bond options are classified as interest rate options because bond prices are critically affected
by changes in market interest rates. Many bond options in the OTC market are European-style
contracts. A European bond option is the right but not the obligation to buy or sell a bond on
a specified date at an agreed price, the strike or exercise price. By contrast, exchange-traded
contracts are options on bond futures and can be exercised on any business day up to and
including expiry. Here are some of the most important applications of OTC bond options.
r
Hedging. The owner of a bond is concerned about a short-term rise in interest rates (which
would lead to a fall in the value of the bond) but would prefer not to sell out. One possibility
is to short bond futures, so that losses on the bond are compensated by gains on the futures
(depending on the efficiency of the hedge), but profits on the bond would then be offset by
losses on the futures. An alternative is to buy a put option on the bond. If the bond price
falls, the put can be exercised, eliminating further losses. If the price rises, the owner can
still benefit from that rise. However, the option costs premium.
r
Zero-cost collars. Institutional investors dislike paying premium because it affects the per-
formance of the fund. The owner of a bond who is concerned about a fall in price can buy an
out-of-the-money put and sell an out-of-the-money call. If the strikes are set appropriately
then the premiums cancel out and there is zero net premium to pay. The owner is protected
if the bond price falls below the strike of the long put. Unfortunately gains on the bond are
capped if the price rises above the strike of the written call.
r
Covered call writing. An investor who owns a bond can generate additional income by
writing an out-of-the-money call on the asset. The premium received will enhance investment
performance. If the bond price rises above the strike and the call is exercised, the investor is
covered, since he or she can deliver the bond.
r
Leveraged position taking. A trader who thinks that interest rates are set to fall can buy an
out-of-the-money or at-the-money call on a fixed-coupon bond. This is much cheaper than
buying the bond. If rates do fall the bond price will rise as its coupon (fixed rate of interest)
becomes more attractive. The call will also increase in value and it can then be sold at a
profit. The return on capital is greater than would have been achieved if the actual bond had
been purchased.
Exchange-traded bond options
In Chapter 4 we looked at a number of bond futures contracts traded on the Chicago Board of
Trade and other exchanges. Table 12.1 sets out the specification of the 10-year Treasury note
option contract traded on the CBOT. The underlying here is a futures, so that if a long call is
exercised the holder acquires a long position in one 10-year US Treasury note futures contract.
If a long put is exercised the holder acquires a short position in a futures contract. Premiums
are quoted per $100 in points and sixty-fourths of a point rather than in decimal format.
122 Derivatives Demystified
Table 12.1 CBOT option on 10-year US Treasury note futures
Trading unit: Each option contract is based on one CBOT US 10-year Treasury note future
with a specified delivery month. The underlying futures is based on
US Treasuries with a face value of $100 000
Contract months: Next three consecutive months plus the next two months in the cycle March,
June, September and December
Last trading: In the month before the delivery month of the underlying futures contract
Exercise style: American. Options that expire in-the-money are automatically exercised
Reprinted by permission of the Board of Trade of the City of Chicago, Inc. copyright 2004, ALL RIGHTS RESERVED
Suppose that a trader is anticipating future cuts in interest rates, which will increase the
value of Treasury notes and bonds. The futures prices, which are derived from those in the
cash market, will follow suit. The trader buys a March call on the CBOT with the following
details:
Contract type Strike Expiry Premium
10-year Treasury note call 113 March 1-16
The underlying March futures is trading at 111
23
32
, which in decimal format is 111.71875
per $100 par value. Therefore the call is out-of-the money since it confers the right to buy a
September futures contract at a higher price of $113. The premium is $1
16
64
= $1.25 per $100
par value. On the contract size of $100 000 this amounts to $100 000 × 1.25% = $1250.
Suppose that the futures price rises to 115 on the exchange, driven upwards by falling interest
rates. Then the trader could exercise the call, buy a futures at 113 and sell it into the market at
115. The profit from exercising the option is its intrinsic value, which is 115 − 113 = $2 per
$100 par value. On the contract size of $100 000 this is $2000. The net profit for the trader
is therefore $2000 less the initial premium of $1250, which comes to $750. Alternatively,
assuming there is some time remaining to expiry, a better alternative might be to sell the call
back into the market.
Bund and gilt bond options
The government bond options traded on the European exchanges are similar to the US Treasury
contracts on the CBOT. The most important contract is the German government bond (or bund)
option on Eurex, the combined Swiss–German exchange. The unit of trading is one bund futures
contract. A call is the right to buy a specific futures contract at the strike price. A put is the
right to sell a specific futures at the strike price.
r
If a call option is exercised this results in a long position in the futures for the owner of the
option and a short position for the writer.
r
If a put option is exercised this results in a short futures position for the owner and a long
position for the writer.
r
The contract can be exercised on any exchange trading day.
As we saw in Chapter 4, the bund futures is based on €100 000 par value of a notional
German government bond with between 8.5 and 10.5 years to maturity and a coupon rate of
6% p.a. The price is quoted in euros per €100 par value to two decimal places. The tick size
(minimum price movement) is 0.01 per €100 par value, so that the value of each tick movement
Interest Rate Options 123
on the €100 000 contract size is €100 000 × 0.01% =€10. The premiums on the bund option
contracts are quoted in the same way. Suppose that a trader buys one 114 strike Euro bund call
option contract at a premium of 0.50 per €100, i.e. 50 ticks. The premium payable in cash
terms is calculated as follows.
Premium cost = 50 ticks × €10 = €500
If the contract is exercised then the trader acquires a long position in the futures at a price of
€114 per €100. The futures would have to be trading at 114 + 0.50 = 114.50 to break even
on the deal (ignoring brokerage and funding costs). The trader has the right to buy one contract
at 114. If this right is exercised and the futures is worth 114.50 then the profit from exercise is
50 ticks or €500, which recovers the initial premium paid. If the futures is trading above this
level then the profit from exercise exceeds the premium.
The option on the long gilt futures on LIFFE is also an American-style contract and can be
exercised on any business day. Exercise results in a long or short position in a gilt futures. The
underlying futures is based on £100 000 par value of a notional 6% p.a. coupon gilt. Like the
US Treasury contract on the CBOT, delivery against the futures can take place on any business
day in the delivery month at the choice of the seller. The tick size on both the futures and the
options is 0.01 per £100 and the value of each tick is £100 000 × 0.01% = £10. If a trader
buys an option and the value of the option rises by (say) 20 ticks, then the trader can sell the
contract back and realize a profit of 20 × £10 = £200 less transaction costs.
One feature of gilt options that is different to the LIFFE stock options we considered in
Chapter 10 is that the premium is not paid in full at the time an option contract is purchased.
Instead, like a futures contract, the buyer deposits initial margin at the outset, followed by a
series of variation margin payments and receipts depending on the changing value of the option
contract. If the buyer decides to exercise a contract the original premium cost must be paid to
the clearing house, which credits the account of the seller.
CHAPTER SUMMARY
An interest rate option is a contract whose value depends on future interest rates. An OTC
interest rate option is a call or a put on a forward rate agreement (FRA). An OTC interest rate
call is also known as a caplet. If at expiry the actual interest rate for the period covered by
the contract is above the strike the holder of the call is compensated in cash. Otherwise the
contract expires worthless. The snag is that the caplet costs premium. An interest rate cap is
a series or strip of caplets all with the same strike. The premium is the sum of the premiums
of the constituent caplets. A borrower who is concerned about rising interest rates can buy a
cap and at the same time sell a floor to offset some or all of the premium cost. This is called
a collar and establishes a maximum and a minimum rate of interest. A European swaption is
the right but not the obligation to enter into an interest rate swap on a future date as the payer
or as the receiver of the fixed rate.
An OTC bond option conveys the right but not the obligation to buy or to sell a bond at a
fixed strike price. Exchange-traded contracts on the CBOT and on LIFFE are options on bond
futures. If an option is exercised it results in a long or short position in a futures contract.
Bond options can be used to take speculative trading positions, to hedge against changes in
interest rates and bond prices, and to generate additional premium income for a fund invested
in fixed-income securities.
13
Option Valuation Concepts
INTRODUCTION
Option premium consists of intrinsic value, which is either zero or positive, plus time value.
Intrinsic value cannot be negative because the holder is never obliged to exercise a contract that
is out-of-the-money. Even if an option has zero intrinsic value it will still have some time value,
assuming that it has not yet expired and the price of the underlying can fluctuate to any extent.
The time value reflects the chance or possibility that the option may become in-the-money
before expiration. Generally speaking, this chance is greater:
r
the longer the time remaining until the expiry of the option;
r
the greater the volatility of the price of the underlying asset.
Taken together these factors – time to expiry and volatility – represent opportunities for the
buyer of an option and risks for the seller or writer of the contract. Time value is the price
of that opportunity and that risk. Calculating intrinsic value is easy, but it is more difficult to
calculate time value. The problem is that unlike (say) a US Treasury bill, the future cash flow
arising from an option is inherently uncertain and depends on what happens to the price of the
underlying over the life of the contract. To value an option we need a pricing methodology
that is based on probability – taking into account the possible future cash flows that might
result from buying or selling an option, and the probabilities that those will occur. This is the
conception that underlies the models used to value option contracts.
The model for pricing European options on shares was developed by Black, Scholes and
Merton in the 1970s. Myron Scholes and Robert Merton were awarded the Nobel prize for
their work in 1997, Fischer Black sadly having died two years before. It is beyond the scope of
an introductory text such as this to explain the mathematics behind the Black–Scholes model
(as it is commonly known) in detail. Appendix A shows how it can easily be set up on an Excel
spreadsheet, and Appendix C has some suggestions on further reading for anyone wishing to
explore the mathematics of the subject.
The aim here is to provide an intuitive understanding of how the model operates in practice.
The focus is on the inputs, and how changing those inputs affects the value that is calculated.
In the financial markets relatively few people work through all the mathematics underlying
the pricing of options, especially the techniques used in the later-generation models that have
been developed since Black–Scholes. Nevertheless many people rely on pricing models in
their day-to-day business activities and need to develop a reasonable working understanding
of the inputs and outputs, the key assumptions, and the practical limitations.
THE CONCEPT OF EXPECTED PAYOUT
Option valuation starts from the idea of expected payout or payoff. Some readers will be
familiar with this concept from economics or from business decision theory – or perhaps from
126 Derivatives Demystified
Table 13.1 Possible share prices at expiry
and probabilities
Possible share price ($) Probability (%)
120 25
100 50
80 25
personal experience when weighing up whether or not to make a risky investment or place a
bet. The first step is to weight all the possible payouts (outcomes) from an investment or a bet
by the chance or probability of achieving each outcome. The average or expected payout is the
sum of all the weighted payouts.
As a very simple example, suppose that an investor is offered a deal with the following terms.
The initial stake is $100. The investor reckons that there is a 35% chance of being repaid $220,
a 25% chance of being repaid $150 and a 40% chance of getting nothing back at all on the
deal. The question is: Is this a good proposition or not? By working out the expected payout
we can help to provide an answer.
Expected payout = ($220 × 35%) + ($150 × 25%) + ($0 × 40%)
= $114.50
The stake is $100 but the expected payout is higher at $114.50, so the deal is a good one
(assuming the probabilities have been correctly assessed and the investor is prepared to put
any capital at risk in the first place). In theory, the investor should be prepared to stake up
to just under $114.50 to take part in the deal. The basic concept of expected payout is very
simple indeed but has real-world applications. For example, a company is likely to prosper
if it always takes on projects whose expected payouts (in today’s money) exceed the initial
amounts invested.
An option is a financial instrument that offers a range of possible payouts depending on what
happens to the price of the underlying. It follows that the expected payout from an option is
the sum of all the possible payouts, each weighted by the probability of attaining that payout.
The value of the contract is its expected payout; if it can be purchased for less than this, then it
represents a good deal. A person who trades options and (over some sustained period) always
buys contracts for less than their expected payout values will be successful.
To illustrate the idea, let us suppose that a share is trading in the cash market at $100. A
trader is offered a one-year European call on the share struck at-the-money, i.e. with an exercise
price of $100. How much should he or she pay for the contract? To keep things simple, we
assume that interest rates are zero and the share pays no dividends. Therefore, its one-year
forward price is also $100. The share is also rather unusual in that it can only take one of three
possible values in one year. Table 13.1 sets out these values and the probabilities that each will
be attained.
The greatest likelihood is that the share price after one year will still be $100. However there
is a 25% chance that it will have increased by $20 and a 25% chance that it will have fallen by
$20. The expected value of the share in one year’s time is the sum of all the possible values
weighted by their probabilities.
Expected share value = ($120 × 25%) + ($100 × 50%) + ($80 × 25%)
= $100
Option Valuation Concepts 127
If today the trader entered into a forward contract to buy the share in one year’s time at a fixed
price of $100, then the expected payout on the deal is zero. If the share is worth $120 at the
point of delivery the trader would make $20. However, the trader has an equal and opposite
chance that the share will only be worth $80 at that time.
Expected payout on forward = ($20 × 25%) + ($0 × 50%) + (−$20 × 25%)
= $0
Since the expected payout on this deal is zero, the trader should not pay a premium to enter
into such a contract. However, if the trader buys an at-the-money call the situation is totally
different. This is the right but not the obligation to purchase the underlying share in one year’s
time at a strike of $100. If the share price is above $100 at expiry the call will be exercised,
otherwise it will expire worthless. The trader buying the call has a positive expected payout.
Expected payout from long call = ($20 × 25%) + ($0 × $50) + ($0 × 25%)
= $5
Equally, the expected loss to the writer of the call is $5. Therefore in order to restore equilibrium
(and fairness) the trader should pay a premium of $5 to the writer. That is the fair value of the
at-the-money call. In this example we assumed that interest rates are zero. If rates are positive
then the expected payout would have to be discounted back to the day when the option was
purchased and the premium paid.
INPUTS TO THE BLACK–SCHOLES MODEL
The Black–Scholes model, adapted for a share that pays dividends, requires only five inputs
to price a European-style option. (Appendix A explains how to set the model up on an Excel
spreadsheet.) The value of option – the theoretical premium that should be paid for the contract –
is the expected payout at expiry discounted back to the day the option is purchased and the
premium paid. The inputs to the model are as follows:
r
The spot or cash price of the underlying share
r
The strike or exercise price of the option
r
The time to expiry of the option
r
The volatility of the underlying share
r
The cost of carry on the underlying share – the interest rate to the expiry of the option less
any dividend income received on the share over that period.
The purpose of the first two of these inputs is quite straightforward. They establish whether or
not the option has any intrinsic value. They also help to determine how likely or otherwise it
is that the option will be exercised. If a call has a strike of $100 and the cash market value of
the share is also $100, the option has zero intrinsic value but we could say that there is a good
chance – perhaps an even chance – that the share price will be trading above $100 at expiry
and that the option will expire in-the-money. However, if the spot price is $100 and the strike
is $200 it is far less likely that the call will ever be exercised. Assuming they both have the
same expiration date, the value of an out-of-the-money option will generally be less than that
of an at-the-money contract on the same underlying.
We discussed previously why time to expiry is important in valuing an option. There is a
greater chance that the price of a share will change substantially over the course of a year
128 Derivatives Demystified
than during a single day. Other things being equal, therefore, a longer-dated option tends to be
more valuable because it provides greater profit opportunities for the buyer of the contract –
the expected payout is higher.
Input number five to the model – the cost of carry – is also quite straightforward. A European
option can only be exercised at expiry, which is in the future. Therefore it is priced in relation
to the forward price of the share – its expected value on the expiration date. As we saw in
Chapter 2, the forward price of a share is calculated from the spot price plus the net cost of
carrying the share for delivery on the forward date, i.e. the funding rate less any dividends
earned over the carry period. Therefore we need these inputs to the model. Another way to
look at this is to appreciate that writers of options take very substantial risks, and normally
expect to hedge or cover those risks. The writer of a call option is at risk if the share price
increases. To hedge this exposure he or she buys a quantity of the underlying. To do this the
writer borrows money, and has therefore to factor into the premium charged for the option the
funding cost less any dividends earned on holding the shares.
The model also requires an estimate of the volatility of the underlying. The measurement of
volatility is discussed in more detail in the next section, but the reason why it requires such an
input is quite clear. All other things being equal, an option on a highly volatile share is more
expensive than an option on an asset that trades in a narrow range. The chance of an extreme
movement in the price of the underlying is greater, and so the option has a higher expected
payout.
HISTORICAL VOLATILITY
Of the five inputs to the model only the volatility assumption is really problematical. The spot
price is available from the stock exchange; nowadays the figure is likely to be broadcast widely
and continuously updated on electronic data sources such as Reuters or Bloomberg. So too is
the market interest rate. The strike of a contract is a matter of agreement between the various
parties, as is the time to expiry. It is not too difficult to forecast the dividend income on a share if
the option expires in a few weeks or months (although with longer-dated contracts forecasting
dividends becomes increasingly speculative). The most difficult question is: Where can we
find the correct volatility assumption?
A useful starting point is to look at the past price behaviour of the underlying share and
calculate its historical volatility. This is measured statistically, as the standard deviation of the
percentage returns (price changes plus dividends) on the share over a historical time period. The
calculation is based on percentage returns rather than the dollar price of a share to produce a
measure that is comparable across different assets that trade at different price levels. Essentially,
however, the concept is simple. The more extreme the fluctuations in the share price over the
historical time period, the greater the volatility value that will be calculated.
Standard deviation is a measure of dispersion from an average value and is widely used in
many practical applications, not just in finance and business. As an example, Figure 13.1 is a
histogram showing the distribution of heights in a sample group (it was actually based on a
sample of 1000 adult women in the UK). On the horizontal axis heights have been grouped into
ranges. The vertical axis shows the proportion of the sample that fell into each height range. If
narrower and narrower ranges were taken, the graph would increasingly begin to resemble the
famous bell curve or normal distribution, as illustrated in Figure 13.2. The shape of the curve
tells us that the majority of the sample is grouped around the mean or average value – i.e. most
people are at or around average height, and far fewer are at the extremes at either end. A bell
curve has certain defining characteristics.
Option Valuation Concepts 129
0%
2%
4%
6%
8%
12%
14%
1.4-
1.42-
1.44-
1.46-
1.48-
1.5-
1.52-
1.54-
1.56-
1.58-
1.6-
1.62-
1.64-
1.66-
1.68-
1.7-
1.72-
1.74-
1.76-
1.78-
1.8-
1.82-
Heights in metres
Frequency %
10%
Figure 13.1 Histogram based on a sample of heights
0%
2%
4%
6%
8%
10%
12%
14%
1.4-
1.42-
1.44-
1.46-
1.48-
1.5-
1.52-
1.54-
1.56-
1.58-
1.6-
1.62-
1.64-
1.66-
1.68-
1.7-
1.72-
1.74-
1.76-
1.78-
1.8-
1.82-
Heights in metres
Frequency %
Figure 13.2 Histogram with bell curve plotted
r
It has a single peak at the exact centre. The mean or average is also the value that appears
most frequently in the distribution of values. Half the curve is above the mean and half
below.
r
The curve is symmetrical about the mean and falls off smoothly in either direction. It moves
closer and closer to the horizontal axis but never actually touches it. For practical applications
this is a little unrealistic. It is unlikely that any members of a human population fall into the
category of being over 10 metres tall.
r
In fact there is not just one but a whole family of bell curves. The shape of a curve is defined
by the mean value and the standard deviation, which measures the extent to which the values
tend to deviate from the mean.
130 Derivatives Demystified
Figure 13.3 Distribution with lower standard deviation
Figure 13.4 Distribution with higher standard deviation
Measuring the historical volatility of a share follows the same process as calculating the
standard deviation for a sample of heights. (The method is given in Appendix A.) The first
step is to find a sample of prices of the underlying share over some historical period. For
example, we could use one month of daily closing prices on the stock exchange. The next
step is to calculate the daily percentage price changes and the average of these values. This
is the mean or the middle point of the bell curve. Volatility is measured by calculating the
standard deviation – the extent to which the percentage price changes in the sample diverge
from the average value. Graphically, a small standard deviation value produces a bell curve
for the returns on the share that is tall and bunched around the mean (Figure 13.3). A larger
standard deviation value will generate a curve that is much more spread out (Figure 13.4).
Applied to the option pricing model, what this means is that (other inputs being equal) an
option on a share whose returns are assumed to follow the distribution in Figure 13.4 will
be appreciably more valuable than one whose performance is assumed to follow the curve in
Figure 13.3. The greater the volatility of a share, the greater the chance of an extreme price
movement. This increases the expected payout to the buyer of the option, and hence the initial
premium he or she will be required to pay to the writer of the contract.
Option Valuation Concepts 131
IMPLIED VOLATILITY
The advantage of using historical volatility to price an option is that (normally) the sample
data are readily available and the method of calculation is quite straightforward. In fact all the
necessary functions required to work out the mean and the standard deviation for a set of data
are included in spreadsheet packages such as Excel. However, there are serious practical and
theoretical problems when using historical volatility to price options.
r
The sample data. What is the correct historical time period on which to base the sample of
price data? Perhaps it is best to use data from the last few months, since this is likely to be
most representative of the current behaviour of the underlying. However, this runs the risk of
not capturing the more extreme price movements that happen infrequently and at longer time
intervals. We may be underestimating volatility by not incorporating such events. On the
other hand, we do not wish to include data that are old and stale; the nature of the underlying
share may have altered fundamentally since the data were collected.
r
The past and the future. An even more serious problem is that historical volatility is by its
very nature based on what happened to the underlying in the past. What we really need to
know when pricing an option is how volatile the underlying is going to be over the life of
the contract. This is what will really determine the expected payout to the buyer and the
expected loss to the seller.
Unfortunately, in the absence of a crystal ball, there is no way of directly observing how volatile
an asset will be in the future. We can only make a forecast. To some extent at least this is likely
to be based on what has happened in the past – on the historical volatility – but we also need
to incorporate reasonable expectations on the future events that are likely to affect the level of
volatility. For example, we might observe that a share price has suffered a period of extreme
turbulence in recent months, perhaps driven by factors that are specific to the company such
as a boardroom crisis; or perhaps the result of general instability in the stock market caused
by political or macroeconomic events. We might conclude that matters are now likely to settle
down a little (possibly because the issues causing the uncertainty look likely to be resolved)
and that the level of volatility over the next few months is set to decline. In a different case we
may foresee future events that are likely to increase the volatility of a share – such as rising
takeover speculation.
When options are freely traded on exchanges and in the over-the-counter market, it is quite
easy to obtain data on the premiums at which they are currently being dealt. This can be used to
calculate the implied volatility of an option. Implied volatility is the volatility assumption built
into the actual dollar price of an option. It is obtained by ‘operating the model backwards’. In
other words, rather than use a volatility assumption to determine the dollar value of an option,
we use the dollar price at which it is trading in the market to determine the volatility assumption
that would generate such a price. All the other inputs to the pricing model – spot price, strike,
time, carry – are kept constant. The volatility assumption is adjusted by trial-and-error until
the model produces a value equal to the actual market dollar price of the option.
Implied volatility is used by dealers, by risk managers in banks and also by the buyers of
options who are attempting to determine the contracts that represent good value and those that
are overpriced. There are a wide range of practical applications.
r
Establishing market consensus. Options on shares such as Microsoft and on indices such
as the S&P 500 are very widely traded. From the general level of premiums being charged
132 Derivatives Demystified
for such options on the market, we can extract the market’s consensus expectation on what
the volatility of the underlying asset is likely to be over the time to expiry of the contracts.
Assuming it is a fair and efficient market with many participants, we can say that implied
volatility provides us with an unbiased estimate of future volatility. It builds in the market’s
consensus expectations on all the future events that are likely to affect the future price
behaviour of the underlying asset, based on currently available information.
r
Establishing relative value. Since buyers and sellers can normally agree on the other inputs
to valuing an option, the key issue when setting the price of a contract is deciding which
volatility assumption to use. A trader who is considering buying an option can contact a
dealer, ask for a price, and insert that value into the option model. This will tell the trader the
volatility assumption used by the dealer to derive the option premium. If he or she believes
that the share is going to be more volatile than the dealer predicts, then the trader should
seriously consider buying the option. Its expected payout is likely to be greater than the
premium charged by the dealer.
SHARE PRICE SIMULATIONS
The Black–Scholes model takes into account the fact that there is a very large number of
possible payouts from an option contract, each of which has to be weighted according to its
probability. The probabilities it uses are called risk-neutral probabilities. In simple terms, this
means that it is assumed that the writer of an option manages the risks involved by trading in
the underlying shares (this is called delta hedging and is explained in Chapters 14 and 15).
The methodology is based on the assumption that the returns on a share follow a normal
distribution – the famous bell curve. There is a method of replicating the result of the model
using simpler calculations, although it does take a great deal longer, by setting up a so-called
Monte Carlo simulation.
Figure 13.5 shows a histogram with the results of a Monte Carlo simulation used to price
a short-dated at-the-money European call on a share struck at $100. The first step was to
0%
1%
2%
3%
4%
5%
93
94
95
96
98
99
100
101
102
104
105
106
Share price at expiry
Frequency
Figure 13.5 Histogram from a Monte Carlo simulation
Option Valuation Concepts 133
produce a large set of random numbers. These were then used to generate a set of possible
values for the underlying share at the expiry of the option, based on a starting level of $100
and incorporating a volatility assumption (and an assumption that the returns on the share
follow a normal distribution). The resulting share values were grouped together into ranges
on the horizontal axis. The height of the vertical bar indicates the frequency of occurrence in
the simulation. The share prices that occurred most often in the simulation were in the ranges
around $100. Very few values below $95 or above $105 were generated.
The call option we wish to price is a European call struck at-the-money at $100. All the
share prices at $100 and below occurring in the simulation can be ignored since then the option
would expire out-of-the-money with zero intrinsic value. Positive payouts occur if the share
is trading above the strike at expiry. If the share value is $101 the payout is $1; if it is $102
the payout is $2; and so on. For any given share price, the histogram tells us the probability
that the share will be trading at that level at the expiry of the option – this is measured on the
vertical axis of the graph by the frequency of the occurrence of that value in the simulation.
The European call can now be priced in four steps:
1. Take each possible share price at expiry (above the strike) and calculate the resulting payout
from the option; this is simply its intrinsic value.
2. Weight each payout bythe probabilityof receivingthat payout, as measured by the frequency
of the occurrence in the simulation.
3. Add up the probability-weighted payouts to calculate the average or expected payout from
the option at expiry.
4. Discount the expected payout at expiry back to its present value. This establishes the value
of the option.
One of the practical limitations of Black–Scholes is that the actual behaviour of shares in the
real world appears not to conform to the pattern we would expect from a single bell curve. The
problem is highlighted by extreme market events such as the 1987 crash, where some markets
fell by over 20% in a day. These seismic events seem to occur more frequently than we would
expect if the returns on shares actually followed a normal distribution.
One way to cope withthis problem is to adjust the volatility assumptions used to price options
in order to factor in the prospect of extreme market movements. These are often known as ‘tail’
events by option specialists, because they relate to share price movements at the extreme ends
of the distribution curve. Another approach is to develop more complex models that alter or
relax some of the assumptions of Black–Scholes – for example, models that use distributions
other than the bell curve, or allow volatility to change during the life of an option.
VALUE OF A CALL AND PUT OPTION
This section firstly explores the relationship between the spot price of the underlying and
the value of a call option. The example is based on a one-year option on a share struck at-the-
money and valued using the Black–Scholes model adjusted for dividends. The details of the
option contract are given in Table 13.2; the share price and the option premium are quoted in
cents.
At a spot share price of 600, the option value, as given by the Black–Scholes model, is
13.93. Since the option is at-the-money it has zero intrinsic value and the 13.93 is all time
value. What, however, will happen to the option if the spot price of the underlying changes?
Table 13.3 illustrates the effects for a range of spot prices (shown in the first column) from

![wiley finance, investment manager analysis - a comprehensive guide to portfolio selection, monitoring and optimization [2004 isbn0471478865]](https://media.store123doc.com/images/document/14/y/xf/medium_QyYI7IBVAK.jpg)