LARRY WILLIAMS LONG-TERM SECRETS TO SHORT-TERM TRADING phần 3 potx
Bạn đang xem bản rút gọn của tài liệu. Xem và tải ngay bản đầy đủ của tài liệu tại đây (639.51 KB, 25 trang )
48
will most often close at their extreme-thus there is no need to try to play any silly technical games of
wiggling and waggling buying and selling during the day.
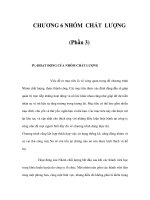
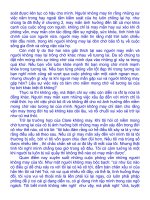
I can prove my point about large-range days with the following charts. Figures 3.1 through 3.6 show
different time periods of Copper, Cotton, Soybeans, Pork Bellies, Gold, and T-Bonds, a pretty wide diversity
of markets. Carefully go through each chart, note the large-range days, and then notice where they opened
and closed.
In the vast majority of the large-range, up close days you should have noted that price opened near the
low of the day and closed near the high. The down close, large-range days reveal just the opposite trading
pattern; openings near the highs and closes near the low of the day.
What this all means to short-term traders is that, to catch a winning
trade, the most profitable strategy is to hold to the close.
I cannot emphasize this enough. The most profitable short-term trading strategy I know and use is to
enter the trade, place my protective stop, then shut my eyes, hold my breath, quit looking at the market, and
wait to get out on the close. Or later! If I am lucky enough to get a large-range day I will
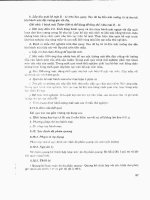
Figure 3.1 High grade copper (daily bars). Graphed by the "Navigator"
(Genesis Financial Data Services).
49
Figure 3.2 Cotton #2 (daily bars). Graphed by the "Navigator"
(Genesis Financial Data Services).
Figure 3.3 Soybeans (daily bars). Graphed by the "Navigator"
(Genesis Financial Data Services).
50
Figure 3.4 Pork Bellies (daily bars). Graphed by the "Navigator"
(Genesis Financial Data Services).
Figure 3.5 Comex Gold (daily bars). Graphed by the "Navigator"
(Genesis Financial Data Services).
51
Figure 3.6 Day T-Bonds (daily bars). Graphed by the "Navigator"
(Genesis Financial Data Services).
have captured a major move that can pay off the small-range days. If I try to dance in and out, I will
invariably not make as much money as holding to the close. The truth is whenever I have tried fancy
dancing, I have had to pay the piper a stiff fee.
To further prove this point, Figures 3.7 through 3.9 show the results of a simple little system for trading
the S&P 500. The rule is simply to buy on the open every Monday if that open is lower than Friday's close.
This is the start of short-term system building, so don't get enamored with the results or the system quite yet.
My point here is to show you the tremendous advantage of knowing you can make more money if you hold
until the close.
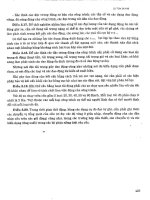
Figure 3.7 depicts what most short-term traders want to do, make about $500 a day trading so the
results reflect a stop of $3,000 (large, but that's what this volatile market requires) and an automatic $500
profit. Although the accuracy is high at 59 percent, the speculator loses money $8,150 to be specific.
The next set of data reflects all the same rules except a $1,000 target. This time we make money,
$13,737, again on the same number of trades, 389, giving us a small average profit per trade of $35. I have
deducted $50 for commissions (as all results shown in this book do). To make our $13,737, we were down
$8,897 at one point, and had 55 percent winning trades.
52
Figure 3.7 A trade with a $500 target.
Finally, we are able to turn the corner and make money by following my basic rule of holding until the
close and then exiting the position. What a difference, we actually clean up, banking $39,075 of profits,
with a $100 average profit per trade, 3 times better than when taking an automatic $1,000 profit. Our
drawdown, how much we had to lose during our worst run to make what we did, was less at $6,650; the
$500 target trader had a $12,837 drawdown. The facts speak for themselves. Traders can argue all day long
about what works and what does not work, but what you have just seen settles
Figure 3.8 A trade with a $1,000 target.
53
Figure 3.9 A trade that follows the basic rule: $100 profit per trade.
the argument for me. It is sitting tight, not trading in and out that will make for profits.
I hold to the close, at least, for an exit point. Until someone can do the impossible, call all short-term
fluctuations, there will be no better strategy for a short-term trader, as you will capture the large-range days
where serious money is to be made. The only difference in the preceding results was how long the trade was
held: the shorter the holding period, the less opportunity for profits. Never forget that rule.
There is even more money to be made holding over, past the close, but that should be true if what I
said earlier is valid, that it takes time for profits to accrue. As we discuss individual markets, I will give you
more specific rules of how to further capitalize on this phenomenon of profitable trading.
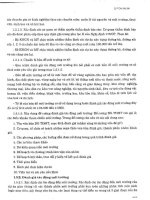
As final proof for my thesis, Figure 3. 10 shows the same system we just looked at, buying on
Mondays when the market opens below Friday's close. But this time, we are going to hold the position in the
first example until the next close; that is, the first close after our entry day or until we are stopped out,
whichever comes first. The product of this strategy nets $68,312, making an additional $30,000 and
increasing our net profit per trade by $7 1.
Finally, look at Figure 3.11, which depicts holding for the close 6 days after entry or being stopped
out. Following this strategy proves my point and should cure you of the notion that big easy money can be
made catching small swings. We now make $71,600, almost doubling the exit on close results boosting our
average trade up to a now respectable $251. Remember, the only difference in these results is how long we
stayed in the trade, all the other rules are the same.
54
Figure 3.10 Using timing to increase our profits.
The legendary Jesse Livermore said it best, "It was never my thinking that did it for me, it was my
sitting that made the big money. My sitting!"
He added, "Men who can be right and sit tight are uncommon."
What I am trying to get across to you is that catching the big swing (within the time frame you are
trading) is the only way I have been able to make millions of dollars trading. I finally figured out that I had
to let my profits run to be able to pay off the losses that are as natural to this game as breathing is to life.
Losses will most absolutely come to you. That is a given,
Figure 3.11 The timing makes all the difference.
55
it will happen, which gives rise to the obvious question, what can we do to offset these chunks out of our
rear end? There are only two ways to overcome this negative, we must either have a very low percentage of
losing trades and/or a substantially higher average profit than loss. Time, and time alone, will give you
larger profits, not thinking, not fancy dancing, not trying to buy and sell every top and bottom. That is a
fool's game. It is not a matter of opinion-it is provable, as the simple system presented in this chapter so
clearly demonstrates.
By now, you should have learned how the market moves, the three most dominant time cycles, and be
developing a sense, or feel, for the underlying order in what appears to be chaos. But most of all, you
should have learned to hold on to winners to the end of the time frame you are trading for. In my case, I'm
trading for 2-to 5-day swings. Whenever my greed factors have convinced me to take a quick profit-or
overstay my time period-I have paid dearly.
Chapter 4
Volatility Breakouts
The Momentum Breakthrough
Necessity may, or may not, be the mother of nvention, but for sure it is the fatber of taking chances.
Momentum is one of the five concepts that can bring us short-term trading profits. It is what Newton
was talking about when he said an object once Set in motion tends to stay in motion. So it is with stocks
and commodities: once price starts to move, it will most likely keep going that direction. There are almost
as many ways to measure momentum as there are traders. I will not delve into all of them, just the ones I
have found to work, and the concept, I trade with. There are other approaches; any one with a fertile mind
should be able to go past where I have. Mathematicians, this is the chapter where you can bring all your
techniques, concepts, and formulas to play. This is where you have a distinct advantage over those of us
limited to basic addition. multiplication, and subtraction.
I doubt that anyone fully understood how the markets work until the mid-1980s. Sure, we knew about
trend; about overbought and oversold markets; about a few patterns, seasonal influences, fundamentals,
and the like But we really did not know what caused trend or, more correctly put. how it began and ended.
57
58
We do now and it is time for you to learn this fundamental truism of price structure and movement.
Trends are set in motion by what I call "explosions of price activity." Succinctly, if price, in one hour,
day, week, month (pick your time frame for trend identification) has an explosive move up, or down, the
market will continue in that direction until there is an equal or greater explosive move in the opposite
direction. This has come to be known as an expansion in volatility and verbally captured by the phrase
coined by Doug Brie "volatility breakout," based on my early 1980 work.
It gets down to this, price has an explosive breakout, up or down, from a center point. That is what sets
or establishes the trend. Thus we have two problems; first, what do we mean by an explosive breakout (how
much of an up or down move), and second, from what point do we measure this expansion in price?
Let's start with the beginning, what set of data should we use to measure the expansion?
Since my working thesis is that we need a very quick explosion of price change I like to use daily range
values-the difference between the day's high and close. This value shows how volatile the market has been
each and every day. It is when this volatility increases out of recent proportion that trends change.
There are several ways of taking this measure. You might use the average range for the last X
number of days, various swing points, and the like. Bi and large though, I have found that using just
yesterday's range as my cornparison of volatility works wonders. Let's say yesterday's range was 12 cents in
Wheat. If today's range exceeds that range by some percentage. the trend probably changed, at least that is
the way to wager. This would be a clear in dication price has had a new impetus driving it in a direction, and
price. Like any object once set in motion, tends to stay in the direction of that motion.
It is really as simple as that, a pickup in range, substantially greater than yesterday's range implies a
change in the current market direction.
That also leads to the second problem: From what point do we measure the expansive move, up or
down? most traders think we should measure from today's closing price. That is typical thinking; we usually
compare price change from close to close. But it is not the correct answer. I will get to that in a moment, but
first let's consider points from which to measure this expansion: we could use the close, the average price of
the current day, or perhaps today's high for a buy or today's low for a sell.
Let's look at the very best results of several nonrelated commodities using a variety of points for
measuring the explosion. Table 4.1 shows buying tomorrow at a percentage of today's range added to
today's close. The data, listed in order, shows the commodity, percentage of range, dollar profit. accuracy,
and average profit per trade.
59
In this table I have even provided the best percent of the previous day's range to add to the close for a
buy and to subtract for a sell. In this, and all data shown, no stop was used and you were always long short.
This table shows only the best percent volatility add-ons for buys and subtracts for sells; and again in
the data for Table 4.1, we added the volatility factor or filter to the previous day's close. Using cattle as an
example, if price rallied 70 percent of the previous day's range above the close, we bought and sold short at
50 percent of the day's range subtracted from the close.
Next, look at buying tomorrow at a percentage of yesterday's range added to yesterday's high or
subtracting that same amount from yesterday's low for a sell signal (see Table 4.2).
60
Although this concept makes money, again on the best-fit basis, it does not do as well as adding or
subtracting a value from the close. A simple way to compare the results is to determine the size of the
average profit per trade. In the add-to-the-close method, it is $327 a trade and $313 for the add-to-the-high
and subtract-from-the-low technique.
The next set of data adds a percentage of today's range to tomorrow's open and buys there for a long
entry or subtracts a percentage of today's range from the opening for a sell. The results appear in Table 4.3.
A careful look at the data shows us the average profit per trade is higher at $389 and the accuracy is
also higher; five commodities in this test showed an accuracy of 50 percent or higher while none of them did
in the first two tests.
My conclusion is that the best point to add or subtract a volatility expansion value to is tomorrow's
open. I have always traded this technique with the open, but in preparation for this book, I did the preceding
tests to see whether my judgement was right and was pleased to see facts fit my intuitive conclusion.
As short-term traders, we can use this concept to tell us there is a high probability of a further extension
of price we can capitalize on. I will not trade just because of such an entry but will use this as my entry
technique when the time and conditions are correct.
Of all the trend entry approaches I am aware, from moving averages to trendlines, oscillators to Ouija
boards, and fancy math to simple charts; I have never seen a more consistently profitable mechanical entry
technique than volatility breakouts. It is the most consistent of all entries I have ever traded, researched or
seen. Now let's look at some ways of using this basic concept.
61
Simple Daily Range Breakouts
From the preceding we have learned that we should add our breakout value to tomorrow's opening.
Now the questions begin; What's the best value?. There are several good ones, but the simplest is to take
today's range adding a portion of it to tomorrow's opening. Just that simple approach has been a consistent
moneymaker since I first discovered it almost 20 years ago.
It is now time to go a bit beyond these results and create a trading model that is actually tradable (i.e.,
it makes money in an acceptable fashion). Figure 4.1 shows the result of buying and selling bonds on the
open every day at a distance of 100 percent of the previous day's range above the open for a buy and 100
percent below the open for a sell.
A protective stop of $1,500 or 50 percent of the previous day's range subtracted from our entry is used
as our protective stop while our exit is the Bail Out or the first profitable opening after entry technique.
This does make money, $73,468 with 80 percent accuracy on 651 trades. On average, the system makes
$7,000 a year and would require a $13,000 bankroll to net the 70 percent a year gain. The drawdown of
only $10,031 is quite good for such a basic system. A problem can be seen in that the average profit per
trade is only $112.86; this needs to be higher. The data set is from 1990 through August 1998.
Any idea how we might accomplish such a lofty goal? For now, let's try our basic TDW (Trade Day
of Week) strategy to see what happens if we only
Figure 4.1 A trading model that works.
62
Figure 4.3 Trade day of the week: Tuesday.
63
Figure 4.5 Trade day of the week: Thursday.
64
Figure 4.6 Trade day of the week: Friday.
take buy and sells on certain specific days. To get a sense of this, Figures 4.2 through 4.6 show the buys for
each day of the week, then the sells for each day, and finally we put together the best buy/sell days for a
working model we can actually trade.
The listings indicate the best days to buy have been Tuesdays and Thursdays, whereas the best sell
days have been Wednesdays and Thursdays. Figure 4.7 shows that if we restrict trading to just these days,
we don't make as much money, only $56,43 7, but just about cut the number of trades in half and boost our
profits up to $173 on average, a number worth trading for. Your lesson here is that the Trade Day of Week
(TDW) can make a big difference in your system's performance. Best yet, the drawdown plummets to only
$3,500 from $10,031 and the accuracy jumps to 84 percent. This is a big improvement, as explained in the
discussion of money management in Chapter 13.
65
Figure 4.7 Restricting trade days makes a big difference.
66
A Look at Volatility In the S&P 500
Does this concept have application for the S&P 500?
Although there can be no doubt about this technique working with a 50 percent volatility expansion, we
can improve on it a great deal. How? By using something we already know about, the impact of TDW. The
next set of data shows the volatility breakout performance by each day of the week for
Figure 4.9 Trading on Tuesdays.
67
Figure 4.10 Trading on Wednesdays.
the S&P 500. The exit is the same as with the bonds shown earlier. Clearly, some are days better than others
to trade. Figures 4.8 through 4.12 show the buy signals by day of week; Figures 4.13 through 4.17 show
sell signals by day of week.
Figure 4.18 shows trading on just the more influential days. The best days to be a buyer were all days
except Thursday and Friday, while the best sell day was Thursday, with Friday a push, but it is used in the
following listing. This is not a bad system, it "made" $227,822 with 75 percent accuracy on
Figure 4.11 Trading on Thursdays.
68
69
70
1,333 trades and had a very small drawdown of only $13,737. I would prefer a larger average profit per
trade than the $170 shown here.
An astute, thinking trader should be asking questions like, "Could we use a closer volatility expansion
number to be a buyer on the more bullish days and a farther away entry value on the days that don't work so
well with the 50 percent value? And how about our exit, would it pay off to hold longer on the more
bullish/bearish days?"
71
These questions can continue indefinitely, but do need to be asked to optimize performance. Proof that
research pays off is offered by Figure 4.19, which shows the use of the preceding rules, except that the buy
entry comes at 40 percent of the previous day's range added to the open, the sell entry at 200 percent of the
range subtracted from the open. There is a big difference here; while it actually makes a little less money
($14,000), the accuracy goes to 83 percent, the average profit per trade is escalated to $251, and our number
of trades is reduced by 46 percent!
Separating Buyers from Sellers to Find Volatility Using Market Swings
A third way to measure potential volatility expansions comes from looking at price swings over the
past several days. Mike Chalek deserves credit for this concept with a system he designed and labeled,
"Talon." The basic idea is to look at the various swings price has taken from one point to the next over the
past few years. There are many such points to study.
The ones I have chosen for this next glimpse into market activity, measure the amount of price
movement from the high 3 days ago to today's low. That is Step 1. Step 2 is to take the swing distance from
the high 1 day ago minus the low 3 days ago. Finally, we will use the largest of these values as our basic
volatility measurement to begin the process of designing a filter or price cushion to add to tomorrow's
opening for buying or subtract for selling.
The system does okay; it makes money as the following results on the S&P 500 from 1982 to 1998
demonstrate (see Figure 4.20).
72
The rules are to buy at 80 percent of the swing value above the opening and sell at 120 percent of the swing
value below the opening. Use a dollar stop of $1,750 and my bailout exit. This makes $122,837 from 1982
to 1998 with an average profit per trade of $228.
Results
As always though, the question becomes, can we do better? Our last attempt at doing better was to use
TDW as our filter to substantially improve performance. We will now go beyond this and bring in a
fundamental consideration-the impact of bond prices on stock prices.
We will now try this concept as a filter (Figure 4.21). The rule is quite simple, we will only take buy
signals if the closing price of bonds is greater today than 5 days ago, and only take sells if bonds are lower
than 3 5 days ago. Our reasoning is well founded in the somewhat common knowledge that higher bond
prices are bullish for stocks, lower bond prices bearish.
What a difference this makes! An average profit per trade goes from $228 to $281 while our drawdown
plummets from $13,025 to only $5,250. Best of all though is that in the original "nonfiltered" trades we had
a largest losing trade of $8,150, whereas with the bond filter the largest loss was only $2,075!
73
One Step Further
Your education is nearing completion if you are wondering what happens in this model if we only
take signals on the best TDWs while the trend of the Bond market is giving us bullish or bearish
confirmation?
Again, the results speak for themselves: by combining all these ingredients we increase our chances or
odds for short-term trading success. 'Notice the number of trades is substantially reduced, this means our
exposure is less, but our average profit per trade increases. Our profits decline to "only" $76,400 but the
average profit per trade jumps to $444, drawdown stays about the same at $5,912 but the percent of
winning trades goes to 90 percent.
What we have done here is filter out trades that are not backed by all three of our conditions. Filtered
trading for short-term swings will put you a light year-or two-ahead of all the rest of the short-term traders.
There is an extra advantage here; by using filters you are placing demands on the market, demands that
mean you will not trade every day, demands that naturally force you to trade less, not more. Active traders
are usually losing traders. Those of us who pick and choose our spots to speculate are more inclined to
come out winners as we have tipped the scales in our favor, which is what intelligent speculation is all
about.