The Toyota Way Fieldbook phần 8 doc
Bạn đang xem bản rút gọn của tài liệu. Xem và tải ngay bản đầy đủ của tài liệu tại đây (3.69 MB, 49 trang )
Carefully Aim Before Firing
In Toyota’s internal Toyota Way 2001 document they describe problem solving
under the broad category genchi genbutsu—the actual part, the actual place. The
discipline of carefully observing actual processes directly without preconcep-
tion—with a blank mind—starts the process of truly understanding the problem.
This leads to a thorough explanation of what is happening and its effect on the
area, the team, the customer, or the company and reveals why the problem
deserves attention. The first requirement of problem solving is to determine the
merit of solving the problem. At this stage, all problems can be weighed side by
side, and the most important are tackled first. Lesser problems may be assigned
to small teams, such as Quality Circles, or even to individuals.
There’s a saying that mocks both American and Japanese styles of problem
solving. The Americans say, “Ready, fire, aim,” while the Japanese say, “Ready,
aim, aim, aim, fire.” There is an element of truth in both of these approaches, and
an element of both strength and weakness in each.
Many companies in the United States are so focused and driven by short-term
(quarterly) results that improvement activities are initiated before the situation
is clearly understood. These actions are completed, and a new (90-day) plan is
Develop a Thorough
Understanding of
the Situation and
Define the Problem
Chapter 14
Copyright © 2006 by The McGraw-Hill Companies, Inc. Click here for terms of use.
developed each quarter. This short-term “fire first and set the target later”
approach leads to a “shotgun” effect, resulting in bits of improvement here and
there. Often these random improvements are made to issues unrelated to the
situation being addressed. Activities are completed, but the desired condition is
not achieved, and because there was no defined reason for these activities, a
long-term sustainment of “results” is virtually guaranteed to fail.
In contrast, the Japanese (and Toyota) can be painstakingly meticulous in
the initial phase of understanding the situation, which frustrates Americans
who are ready to “get started.” This apparently belabored process is vital to a
successful problem-solving activity for two reasons.
1. Careful consideration must be given to understanding the characteristics
of the problem—by weighing the impact of the problem on customers,
employees, and the company, and finally by deciding if the problem is
important enough to dedicate valuable time and attention to solving. The
inventor Charles Kettering said, “A problem well stated is a problem half
solved.” Put another way, a large proportion of the problem-solving
activity should be devoted to thoroughly understanding the problem sit-
uation, which leads to focusing on the problem rather than its symptoms.
2. Focusing energy and leveraging resources is critical to achieving a higher
level of success with minimal effort. This starts with reaching agreement
with all affected parties on the need to pursue the issue.
Within Toyota, the question, “Why did you pick up this problem?” is often
used. It means, “How did you determine that this problem deserves your time
and attention?” And also, “Why did you choose this problem over the many
other possible issues?” In addition, there is an implied request: “Please explain
your reasoning so I can understand the situation, ensure that you’ve done ade-
quate reflection, assure that we are in agreement and alignment on the issue—
and so I can provide necessary support and guidelines for your process.” There
are many things packed into that one simple question, issues that must be
examined in order to develop a thorough understanding of the situation.
THE TOYOTA WAY FIELDBOOK324
TRAP
Avoid the mistake of putting too much effort and expense into
solving insignificant problems. Carefully consider the importance
and value of solving the problem prior to beginning activity. Do
not exert one dollar’s worth of effort to solve a five-cent problem.
If the problem is relatively minor in comparison to other prob-
lems, it can be addressed by the individual or team most affected
by it, rather than by a large team or member of management.
This rigorous questioning often leads to frustration for Americans, who
tend to feel that it questions their ability to handle the situation on their own (an
American characteristic), or that their evaluation was not complete. Within
Toyota, many people meticulously review the process of understanding the sit-
uation, and feedback is always given. Often, after initial rounds of questions,
additional rounds of questioning ensue. This is the “aim, aim, aim” phase.
Valuable insights can be gained by this repetition, perhaps bringing new things
to light through various reviewers, and in the long run much time can be saved
by not chasing errant issues of lesser importance.
If your organization hasn’t had an effective process for making improvement,
there will probably be numerous issues in the backlog. When the word “problem”
is mentioned or people know that you want to improve processes and are inter-
ested in knowing what the problems are, two things will probably happen:
1. You’ll be deluged with many problems, ranging from broken water foun-
tains and fans (which should be corrected without the need for long-term
problem solving) to issues that occurred years ago.
2. As soon as any “problem” is mentioned, solutions will be proposed. Since
the existence of a problem has not been confirmed, any proposal of solu-
tions is premature and a waste of time (not focused or leveraged).
Initiating this process may be like opening Pandora’s box. After looking
inside, you may wish you had kept the lid closed! It’s easy to be overwhelmed
by the magnitude of opportunity for improvement available (and necessary)
and the sheer numbers of problems that will surface.
Chapter 14. Develop a Thorough Understanding 325
TIP
You must be prepared to help people differentiate between
issues that can and should be corrected in the short term without
in-depth analysis and long-term endemic issues that affect the
performance of the person, group, or company.
TRAP
One of the signs of a “Ready, fire, aim” culture is the tendency to
“jump” immediately from the “problem” to the “solution.” In many
cases the problem may be mentioned casually and much time
spent proposing various “solutions” before the “problem” has
been clearly defined. At this stage in the process it is likely that
a symptom has been observed rather than a true problem.
The following is a typical conversation that might occur, indicating the trap
of jumping to solutions prematurely:
Manager: We have been having trouble with defects lately. (Note the vague
“definition” of a “problem”.)
Employee 1: A lot of the damage is coming from handling. (Note the “root cause
analysis”.)
Employee 2: Why don’t we get new carts? (Note the jump to a solution.)
Employee 1: Yeah, Joe had a design for one a while back. (Now the conver-
sation gets way off track!)
Employee 3: Do you know what happened to it?
Employee 1: No, but I know he had one.
Employee 2: I saw it too, but I’m not sure what happened to it. I think he told
the engineer, but nothing was ever done.
Manager: Would you ask Joe to find out about his design and see if he still
has it? (Now valuable time will be wasted chasing a “solution” to an unde-
fined problem.)
Employee: Yes, I should know something by next week’s meeting.
Problem solved! Or was it? What was the problem? “Defects” is a fairly
broad issue. Why did the employee jump to the conclusion that “defects” were
caused by handling? That may be his personal experience regarding “defects,”
but it’s only one possibility. Do you see how the process was so easily side-
tracked? The conversation went from a general statement about defects (not a
well-defined problem), to a cause (handling), to a solution (Joe’s carts), to an
action (follow up with Joe) in a matter of seconds. What will happen next?
There will be follow-up with Joe, additional meetings when time is spent (wast-
ed) debating why Joe’s solution was never used in the first place, and then
debate about whether it was actually a good design and a different design is
needed. Finally, a decision may be reached to build new carts, and they will be
put in place. Do you think the “defect” problem will be resolved? The sad part
THE TOYOTA WAY FIELDBOOK326
TIP
To avoid premature discussion of solutions and to keep the
process on track, record ideas for solutions with a statement such
as: “Okay, that may be a possible solution and I don’t want to
lose your idea, so I’ll write it down and we can discuss it later,
when we’re investigating possible solutions. However, right
now we want to stay focused on identifying the problem.”
is that this group is under the illusion that they’re actually getting “results,” and
in fact they may somewhat improve the results. But it’s a case of focusing on the
nickels (small causes) while the dollars (major causes) fly overhead.
Find the True Problem to Get the Most
Significant Results
When beginning the process of identifying the true problem, it’s a challenge to
find the issue at the most significant level. Often a problem is perceived based
on personal experience, but this may only be “a problem” rather than “the prob-
lem.” If we ask, “What is your main problem?” the answer is likely to be an issue
that is most present and frequently experienced by the person being asked. For
example, an operator who experiences a persistent problem every day will likely
perceive it to be “the problem.” In addition, a person’s role in the organization
tends to skew the importance of an issue for him or her. Those in the accounting
department, for example, tend to see cost issues as the most important. Those
in purchasing often believe that vendors are the primary concern, and engineers
tend to focus on equipment-related issues.
Toyota refers to the Five-why process (explained later) as a “causal chain,”
because the problems and their causes are linked together in a series of single
and branched chains. In an attempt to identify “the problem,” people often enter
the causal chain at the problem perception point, or the “point of recognition,”
rather than at the level of the true problem. They have identified what they
believe the problem to be, but they may be further down the causal chain rather
than at the top, where the true problem resides. Finding the true problem is
based on understanding its effect at the highest level, where the full impact of
the issue is experienced.
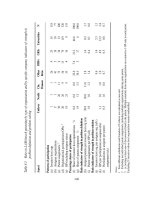
When identifying any problem, Toyota views it in the context of the primary
performance measures, which are safety, quality, productivity, and cost (Figure
14-1). These measures are inherently linked to one another, and it’s not possible
to negatively impact one of the measures without also negatively influencing
another. For example, if a defect affects quality performance, it may also affect
Chapter 14. Develop a Thorough Understanding 327
TRAP
It’s easy to confuse activity with results. A poorly defined problem
and a rush to solution and action lead to activity without achiev-
ing the desired results. If you desire to maximize your return, a
focused effort on a clearly defined problem followed by a thor-
ough analysis will lead to significant results.
the ability to produce the desired quantity of product, thus causing customer
service levels to suffer. To avoid affecting the customer, appropriate countermea-
sures such as increased inspection or production time may be employed to protect
the customer. These extra measures will increase the cost. An operator who detects
the defect may conclude that the defect is “the problem,” when in fact the true
problem is the affect on customer service, and ultimately on the total cost.
The placement of the measures in this model does not imply importance. In
other words, cost is not the most important measure. Customer satisfaction is
the most important measure. We want to achieve the highest level of customer
satisfaction while maintaining the lowest possible cost.
Delivering a quality product to the customer is always understood to be the
number one goal. A tenet of the Toyota Way is that a defect should never knowingly
be passed on to the next process. The effort to ensure the correction, containment,
or control of the quality problem will have a negative impact on productivity
and cost. Notice the lack of “customer delivery” or “safety.”
Within Toyota, all processes are closely linked to each other, and the “cus-
tomer” is actually the next process. Given these tight connections and the fact
that all processes in the plant and throughout the entire supply chain are inher-
ently linked, if you fail to meet the customer demand (the next process), the
entire operation will begin to stop, one process at a time (like dominos). For this
reason, the satisfaction of the customer is implicitly understood and does not
need to be measured separately. If a process is unable to meet the demand, it is
a productivity issue. In addition, safety is an implicit expectation for everyone,
and as such, may be “omitted” from the discussion of measures. Safety as the
number one priority is a given.
THE TOYOTA WAY FIELDBOOK328
COST
CUSTOMER
SERVICE
QUALITY
PRODUCTIVITY
Figure 14-1. Relationship of primary performance measures
It may helpful to think of these relationships in terms of the problem, symp-
toms of the problem, and the causes of the problem.
Using a medical condition as an analogy: Suppose you visit the doctor and
complain of aches and fever. These are not the problem. They are symptoms of
the problem. The problem is that you don’t feel well (and as a result may miss
work or other activities). The doctor will take information and perform tests
and gather facts (vital signs) that are part of the analysis, to find the cause of the
aches and fever. Visually, the process looks like Figure 14-2.
Symptoms are presented to the side of the problem, as in “I have this problem,
and as a result I have these symptoms.” To get to the cause(s), the information
is analyzed to evaluate all possibilities. The symptoms are an important piece in
the overall understanding of the problem. They provide supporting evidence
that a problem exists. They also provide quantifiable data showing the magnitude
of the problem. In this case, a fever of 104 degrees is more significant than a
fever of 100, thus increasing the need to treat the problem.
The relationship of the three primary measures will follow the same model
of Problems, Symptoms, and Causes, as shown in Figure 14-3.
In this case, low productivity would be the problem, poor quality a cause, and
high cost a symptom or result. Using this model is important because it forces con-
sideration of the bigger picture. We may believe that a repetitive quality problem
Chapter 14. Develop a Thorough Understanding 329
PROBLEM
(Don't feel well)
AS A RESULT OF
THE PROBLEM
THESE
SYMPTOMS
EXIST
(Aches and Fever)
ROOT CAUSES
ANALYSIS
LEADS TO
Figure 14-2. Illness symptoms versus root causes
is the true problem, but if we look further, we find there is an issue having a greater
impact (this is assuming that the rule to never knowingly pass a defect to the next
process is followed). Quality is a causal factor for poor productivity.
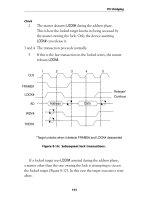
This thought process is depicted in Figure 14-4. The problem is perceived at the
point of recognition (where the problem is “found”). To consider this “problem” in
a larger context, we would use a statement such as; “We have this problem, there-
fore, this happens.” For example, suppose that the perceived problem is a machine
malfunction resulting in scrap parts. The statement would be, “The machine mal-
functions, therefore the part is scrap.” Continuing this line of thinking we state,
“The part is scrap, therefore we are losing production capacity and increasing cost.
Therefore, we are not able to meet the production requirement,” or, “Therefore our
cost it too high.” At this point we begin to understand the greater significance of
the true problem.
If we do not consider the situation in a larger context, we may limit the pos-
sible solutions as well and the total impact of solving a larger problem. Thinking
in this way allows us to identify the true problem and thus provides three distinct
advantages:
1. Ensuring that the most significant opportunity has been captured maxi-
mizes results with minimal effort.
THE TOYOTA WAY FIELDBOOK330
PROBLEM
(Reduced Productivity)
AS A RESULT OF
THE PROBLEM
SYMPTOMS:
Increased Cost,
Poor Customer
Service
Quality
(Scrap and Rework)
Quality Issue
Causes
Figure 14-3. Problem symptoms versus root causes
2. Taking a larger view opens the possibility of solving the true problem by
correcting causes in addition to the ones initially identified.
3. The lower-level cause identified may be very difficult to correct (which is
why it is perceived as the biggest problem), and focusing only on this dif-
ficult condition will preclude consideration of larger and easier causes,
which lead to greater opportunity.
The following was an actual conversation between a Toyota sensei (teacher)
and a process engineer at an automotive parts plant. It examines the challenge
of shifting focus from the perceived problem to the true problem.
Sensei: What is the problem in your area?
Engineer: The welding robot keeps breaking down. (The perception of the
“problem” is based on personal experience and the person’s role.)
Sensei: Are you sure that is your problem?
Engineer: Yes. It breaks down all the time. We’ve tried various things to correct
it but have had only limited success. We need to get a new robot. (Notice
the jump to a solution.)
Sensei: I am not sure that is your real problem.
Engineer: Yes it is. It has been the problem for a long time. We have data to
show how much it breaks down.
Chapter 14. Develop a Thorough Understanding 331
True Problem
Point of Recognition
Point of Cause
(Where the problem
physically occurs)
Exploration of the
perceived problem may
lead to discovery of a
Larger Problem
Solving a Larger Problem
may yield different
opportunities for solution
Therefore….
Moving towards
understanding the True
Problem
(The "perceived problem")
5 Whys?
Moving toward solutions
Root Causes
(Solving will correct
the True Problem)
Figure 14-4. The problem-solving continuum
Sensei: I am sure it breaks down, but I am still not sure it is the real problem.
Engineer (a little angrily): It is the problem. I’ve been working on this for
almost four years and I can tell you it is a problem. (Is it the problem or a
problem?)
Sensei: Yes, I know you’ve been working hard on the robot; however, let me
explain why it is not the real problem. When the robot breaks down, what
happens?
Engineer: There is a fault at Loading Zone 3 because the weld nut does not
feed. We’ve been working with the vendor to improve the feeder.
Sensei: Okay, what I mean is, what happens to the line when the robot breaks
down?
Engineer: It stops, of course.
Sensei: When the line stops, what happens?
Engineer: Everyone stands around, and they call me to fix the robot.
Sensei: I mean, what happens to the flow of product?
Engineer: It stops.
Sensei: When the product flow stops, what happens?
Engineer: Everyone stands around.
Sensei: I mean, what happens to our ability to make parts?
Engineer: Of course we can’t make parts with the line stopped!
Sensei: So we are not able to satisfy our customer with the required number
of parts?
Engineer: We can’t meet the demand without working overtime.
Sensei: So the real problem is that we are unable to meet customer demand
without working overtime?
Engineer: No. The problem is the robot.
Sensei: Well, let’s go to the line and look.
As the sensei and engineer proceed to the line, the engineer wants to take
the sensei to the robot to show him the “problem.” The sensei knows that line
stoppage for any reason will ultimately affect the ability to meet production
demand and that the robot is only one possibility. Therefore, it is further down
the causal chain and not the high-level problem he’s looking for. The sensei
takes the engineer to the end of the line to observe flow. In a few minutes he
notices that the flow stops.
Sensei: Why did the line stop?
Engineer: The employees are rotating positions.
Sensei: How often do they rotate?
THE TOYOTA WAY FIELDBOOK332
Engineer: Every half hour, but you can’t change that without causing a large
problem with the employees. They all agreed on a half-hour rotation for
ergonomics.
Sensei: My concern in not how often they rotate. I am concerned that when
they do rotate, the line stops for about four to five minutes. That is as much
as 10 minutes every hour, nearly 20 percent lost time!
They watch the line a little longer and again the flow stops. This time it is
because the shipping container is full and waiting for the material handler to
remove it and bring an empty one.
Sensei: Why did the line stop?
Engineer: The container was full and they needed a new one. The only way
you’re going to prevent that is to have a material handler here full-time,
and we don’t have enough material handlers for that.
Sensei: (Sternly) There is always more than one way to solve any problem.
I’m sure we can design a system for exchanging the containers in a way
that does not stop the product flow and does not require a material han-
dler here full-time. Right now, though, I am just trying to understand the
true problem.
Here is how the causal chain appears to the engineer:
Problem: The robot breaks down.
Why? There is a run fault signal in Zone 3.
Why? The nut does not feed.
Why? The equipment is not designed correctly.
Where does this path lead? It leads to a dead end! It is a dead end that can
consume large amounts of time and money attempting to correct a very chal-
lenging issue. In the meantime, the “low hanging fruit” is falling from the tree!
Examining a Problem in Reverse
Now let’s look at the causal chain from the sensei’s point of view. First, he begins
with the problem as pointed out by the engineer, and using the “therefore”
method, he proceeds back up the chain until he’s sure he has found the true prob-
lem, as shown below. Note that we begin at the perceived problem line and con-
tinue to state “therefore” proceeding upward until the true problem is identified.
Therefore: The process can’t meet demand without overtime. This is the true
problem.
Therefore: Process doesn’t make parts.
Therefore: The product flow stops.
Chapter 14. Develop a Thorough Understanding 333
Therefore: The line stops.
The robot breaks down. Start with the perceived problem and work up to
find the true problem.
Once the true problem and resulting symptoms are identified, it’s possible
to compare the full implications of the true problem and consider the value of
proceeding with the process of solving the problem. It is still necessary to define
the extent of the problem and its characteristics.
Defining the Problem
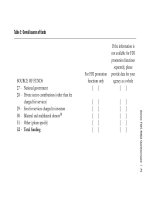
In order to be defined as a “problem,” four pieces of information are required:
1. The actual current performance with some historical trend detail.
2. The desired performance (standard or goal).
3. The magnitude of the problem as seen by the difference between the actual
and desired (sometimes referred to as the “gap”).
4. The extent and characteristics of the problem or situation.
When presenting this information, a picture is worth a thousand words.
Always try to explain the situation visually with a trend graph (Figure 14-5). The
trend graph should include enough historical data to show how long the condi-
tion has existed (for long-term performance improvement opportunities a mini-
mum of six months is recommended if available). The data should be displayed
so the characteristics of the problem are seen. For example, does the problem
appear to be getting better, worse, or staying the same? This understanding assists
in determining the importance of addressing this problem versus other prob-
lems. If the problem is getting worse, more immediate action may be necessary,
such as a short-term countermeasure. If the situation is getting better or staying
THE TOYOTA WAY FIELDBOOK334
Monthly Units per Hour
Fabrication Line
0
10
20
30
40
Jan
Feb
Mar
Apr
May
Jun
Jul
Aug
Sep
Oct
Nov
Dec
Units per Hour
Goal = 36
Figure 14-5. Trend chart of monthly units per hour
the same, the future results are more predictable (not likely to get worse) and the
consequences of inaction (which is always a considered action) are understood.
The goal is to portray the situation so an accurate assessment is possible.
This is best achieved using actual facts and not assumptions or “feelings.” Be wary
of data coupled with the words “I think” or “ I feel”! The goal is to elevate problems
and to get a clear understanding of their characteristics so we can understand
what will be required to solve them and how difficult that will be. A problem
that’s stated in a way that makes it look better than it truly is does not help in
the problem-solving process (Figure 14-9).
Also consider the stability of the problem. Are the results consistent day-to-day
(or period-to- period), or are there large swings with varied good and bad results?
Problems with a high degree of variation from period to period indicate a situation
that is out of control. There are probably many contributing factors, and isolating
the causes may be difficult. An intermittent problem is also harder to analyze
because it does not occur consistently, and therefore seeing the problem firsthand
is difficult and often requires an extended observation to identify the causes.
The charts in Figures 14-6 to 14-11 were generated using the Microsoft Excel
charting function (primarily for ease of printing). Excel will automatically select
scaling based on the high and the low data points and the variation. In most cases
this scaling is effective for visually understanding the problem. Often the data is
collected and charted manually (which is preferred by Toyota) and the scale is
established incorrectly. The charts show some common situations encountered
when charting data to develop a thorough understanding of the problem.
The chart in Figure 14-6 has an insufficient number of data points. In this
example, it is not possible to get a clear understanding of the trend. Usually we
need to see 6 to 12 months of history to gain a clear perspective of the trend of
an issue. For the trend, a monthly summary (average) of results is preferred to
show the higher-level, long-term direction of the problem.
Chapter 14. Develop a Thorough Understanding 335
Monthly Units per Hour
Fabrication Line
0
10
20
30
40
Jan Feb Mar
Month
Units per Hour
Goal = 36
Figure 14-6. Chart with insufficient data points to see trend
Figure 14-7 shows the detail necessary to understand the daily characteris-
tics of the problem. The performance of this fabrication process varies from day
to day within a range. This process has not reached a level of stability, and the
variation indicates the possibility of multiple issues contributing to the instabil-
ity, thus representing a more challenging problem to solve.
THE TOYOTA WAY FIELDBOOK336
Fabrication Daily Units per Hour
0
1 2 3 4 5 8 9 10 11 12 15 16
5
10
15
20
25
30
35
40
Date
Units per Hour
Goal = 36
Fabrication Daily Units per Hour
20
1 2 3 4 5 8 9 1011121516
22
24
26
28
30
32
34
36
38
40
Date
Units per Hour
Goal = 36
Figure 14-7. Chart with sufficient date points to see trend
Figure 14-8. Chart with inflated appearance of variation due to scale
Figure 14-8 shows the same data as Figure 14-7 but the variability of perform-
ance is artificially inflated due to a compressed scale on the chart. Visually, the
problem appears larger than it truly is. It’s important for a chart to have the correct
visual impact so everyone has a clear understanding of the challenge ahead.
Figure 14-9 shows the same data as Figures 14-7 and 14-8. Notice how the
variation is visually smoothed. This process appears more stable, and thus is
misleading. An excessively large scale causes the artificial smoothing effect.
Collecting data is an important part of the philosophy of building a culture
to stop and fix problems, as described in Chapter 8. The greatest benefit is
gained by recognizing problems in “real time” and correcting them immediately.
Data used to solve problems is interpreted from the perspective of long-term
trends and resolving “systemic” issues.
Building a Strong Supporting Argument
As shown in the above examples, there will be symptoms that go along with
problems. In the case of businesses, the symptoms will be reflected in confirming
Chapter 14. Develop a Thorough Understanding 337
Fabrication Daily Units per Hour
0
12345891011121516
20
40
60
80
100
120
140
Date
Units per Hour
Goal = 36
Fabrication Weekly Units per Hour
0
5
10
15
20
25
30
35
40
1/1
1/8
1/15
1/22
1/29
2/5
2/12
2/19
Week
Units per Hour
Goal = 36
Figure 14-9. Chart with artificially smoothed variation due to scale
Figure 14-10. Chart with artificially smoothed variation by averaging
The chart in Figure 14-10 shows the effect of smoothing by averaging daily
data on a weekly basis. The visual impact is lessened, and the daily variability
inherent in this process will not be seen, thus giving a false sense of stability in
the process.
performance indicators. For example, an inability to meet customer demand will
also be reflected in additional overtime, missed or late shipments, or increased
backlog. These corresponding indicators provide supporting evidence of the
validity of the problem and the merit of correcting it.
Toyota uses the corresponding indicators to support the process of focusing
on the most important issues. Problems are evaluated to determine which require
the most immediate attention using the following criteria:
◆ Importance. How important is the problem in the overall context of cus-
tomer satisfaction, departmental, or company goals? Safety problems are
automatically the highest-level importance.
◆ Urgency. What deadlines are dependent on the resolution of the problem,
and what is the consequence if the deadline is not met? The ability to meet
a change in a customer requirement deadline is considered a high urgency.
◆ Tendency. Is the problem getting worse, improving, or staying the same?
When comparing problems it is necessary to consider whether every prob-
lem should be addressed.
By showing the effect of a specific problem on customer service, quality, safe-
ty, or cost, it is possible to develop a compelling argument to correct this specific
problem versus other problems. This method of prioritization ensures that
resources are focused appropriately on the most important and valuable problems.
Following safety concerns, problems that negatively affect the customer
take precedence. This could include missed shipments, late shipments, and
quality problems. Cost issues can easily be compared to ensure that the larger
issues are being handled promptly. The Toyota Way necessitates building a
strong rationale for attacking any problem. If a strong rationale has not been
developed, the question “Why did you pick up this problem?” would surely be
asked. The format for showing the supporting indicators is the same as the
problem symptom model above.
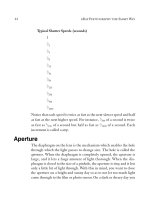
A complete example of a problem statement is shown in Figure 14-11. Note
that the summary statements, along with the graphs, are sufficient to thoroughly
explain the problem situation and the corresponding issues. In this example the
pictures tell the story and brief explanatory statements are used. Here, the true
problem is the inability to meet the production requirement. As a result, overtime
is used to compensate for the problem (increasing cost), and customer service is
also declining. The problem with its supporting evidence allows us to “size up”
this problem and determine the benefit if it is solved (and also determine a sen-
sible investment to make in the solution that will provide a good return on the
investment of time and expense).
Now that the problem and the effect of the problem on other performance
indicators is thoroughly understood and a decision is made to correct the sit-
uation, it’s time to develop a deeper understanding of the causes of the
problem.
THE TOYOTA WAY FIELDBOOK338
1. DEFINE THE PROBLEM SITUATION
Problem Summary Statement
• Units per hour is consistently below goal.
• Condition is worsening.
• Overtime costs are increasing.
• Number of late shipments are increasing.
Monthly Units per Hour
Fabrication Line
0
10
20
30
40
Jan Feb Mar Apr May Jun Jul Aug Sep Oct Nov Dec
Units per Hour
Goal = 36
Overtime $ per Month
0
20
40
60
80
100
Jan
Feb
Mar
Apr
May
Jun
Jul
Aug
Sep
Oct
Nov
Dec
Jan
Feb
Mar
Apr
May
Jun
Jul
Aug
Sep
Oct
Nov
Dec
$ 000‘s
Monthly Late Shipments
0
20
40
60
80
Quantity
Figure 14-11. Complete problem statement
THE TOYOTA WAY FIELDBOOK340
Reflect and Learn from the Process
Identify and select a problem you want to solve and use to reflect
upon in Chapters 14 through 18. The problem should be signifi-
cant, but not one of the most difficult problems you have. We sug-
gest learning the problem-solving process on simpler issues before
tackling more difficult ones.
1. Gather facts related to the problem and define the problem
according to these criteria:
a. Display the actual performance history (at least six months)
in a line graph format.
b. Show the goal or standard (current and/or in the future).
c. Identify the gap between the actual performance and the
goal.
2. Consider the information that you believe depicts your problem.
a. Are you sure you have identified the “true problem”?
b. Can you make a connection directly to a safety, quality,
delivery, productivity, or cost performance measure?
3. Clarify the significance of solving this problem.
a. Identify other issues related to this problem (items affected
by this problem). Quantify them by graphing them.
b. Can you verify that it is important to “pick up this prob-
lem”?
c. Quantify the value of solving this problem (don’t spend
a dollar to solve a five-cent problem).
d. Is it worth your time or the time of others to solve this
problem?
e. How much do you want to invest in solving this problem?
4. Based on your value quantification in the previous question,
determine the most cost effective method to proceed with the
problem.
a. Will you “work the problem” personally?
b. Will you delegate the problem to others and only follow
up?
c. Will this problem require a large team, small team, or a
single individual to solve it?
TOYOTA’S CORPORATE slogan is “Yoi shina, yoi kangai,” which means, “Good
thinking, good products.” This applies particularly well to the analysis portion
of problem solving. Toyota places high value on the ability to think logically
and creatively because a solid thinking process will produce the best results.
Every Toyota manager understands, above all, the value of human creativity—
that it is the single thing that will set them apart from their competition.
The analysis phase of problem solving should be an exploration into areas
previously not understood. It’s a bit of detective work, a bit of scientific exper-
imentation, and an opportunity to discover new things. Analysis is the “Ah-ha”
stage, the time to gather evidence, the time to repeatedly ask “Why?” and to find
the source of an issue, its root. When the root causes are discovered, the
“answers” to solve the problem become obvious. At this time “good thinking”
will generate the best solutions—highly effective, simple yet elegant, and low
cost, but not shoddy.
As Albert Einstein once said: “The important thing is not to stop questioning.”
Principles of Effective Analysis
Effective analysis is crucial for finding and understanding the many potential
causes of the problem. From those potential causes, it’s necessary to narrow the
field and focus on the most significant ones. Much of Toyota’s great success
stems from the ability to fully analyze a situation and understand the many
Complete a Thorough
Root Cause Analysis
Chapter 15
Copyright © 2006 by The McGraw-Hill Companies, Inc. Click here for terms of use.
causes of the problem beyond the most apparent. The following principles are
a crucial part of the Toyota approach:
1. The analysis must not be clouded by preconceived ideas of the problem
causes. If the cause is assumed, it will preclude a useful analysis and most
likely lead to poor results.
2. Always follow the genchi genbutsu principle to verify the source of the prob-
lem. Do not depend on others, or on data, to find the cause. Use informa-
tion to point toward the location to “go see.” The point of cause must be
observed firsthand.
3. Analysis is continued until it is certain that the true causes, or root causes,
of the problem are discovered (using the “Five-Why” method).
4. In nearly all situations there are multiple causes for problems, and thus
the analysis must be comprehensive. Toyota evaluates causes through the
4Ms: Man, Method, Material, and Machine.
5. Since there are many possible causes, it’s necessary to narrow to the most
significant ones. Narrowing allows the focusing of efforts to generate
greater results.
6. During the analysis, the goal is to identify problem causes that can be cor-
rected by the problem solver. This avoids the tendency to defer the problem
to others and forces the question, “What can we do?”
7. A thorough and complete analysis will yield root causes that will clearly
indicate specific, corrective actions. There is an observable and obvious
trail leading from the problem to the causes and to the solutions.
8. Thorough and complete analysis provides factual data, allowing precise
prediction of potential results when the causes are corrected. Determining
the exact result is an important part of the process since it forces the evalu-
ation of capability and effectiveness in examining a problem.
As with many aspects of the Toyota Way, the thought process is critical to
success. Notice that during the following conversation, people will jump to pre-
conceived conclusions rather than recognizing the simple but true answer to the
question. Using the example in the problem statement below, we would begin
the Five-Why process as follows:
Problem statement: “The fabrication units per hour is below goal.”
Upon asking our group “Why?” we might get the following answers:
1. Because the machines break down.
2. Because operators are absent.
3. Because we run out of parts.
4. Because operators are not trained.
5. Because the setup times are long.
Each of these answers may be “true,” as in the conversation between the
engineer and the lean sensei described in chapter 14, but they are further down
THE TOYOTA WAY FIELDBOOK342
Chapter 15. Complete a Thorough Root Cause Analysis 343
TRAP
In many cases we see people attempting to force the Five-Why
process into five boxes by trying to “figure out” the correct chain
with five “answers.” This process does not fit a predeveloped
template format. The causal chain may branch at any level and
yield unknown quantities of answers at each. If you are strug-
gling to find Five Whys, most likely you’re jumping across links
in the chain. Take time to reflect on the simpler, more obvious
answer in order to allow the discovery of all possibilities.
the Five Why chain. The first challenge is to focus solely on the direct question:
“Why are the fabrication units per hour below goal?” Then the true answer
would obviously be: “Because we do not make enough parts each hour.”
Knowing where to focus is crucial in order to train our minds to understand the
complete chain. Skipping what appear to be obvious links in the chain will cause
jumping to preconceived causes, thus overlooking other possibilities. This is
one of the greatest risks and also the greatest challenges in thinking.
Proceeding with our questioning, we would ask, “Why don’t we make enough
parts each hour?” Again the tendency is to skip to the obvious answers, but by
approaching this with a different thought process, we would see this answer:
“Because we lose opportunities to make good parts.” The production of any prod-
uct is accomplished by utilizing the time of people and machinery, and available
material. In this case there are only two main causes for a shortage of produc-
tion—loss of time and loss of material (scrap). Note that this line of thinking
also maintains a narrow focus that will isolate the most significant causes from
the less significant ones. In the example above, the first question led immedi-
ately to a lengthy list. Once a long list is established, it’s extremely difficult to
narrow the focus. It is much easier to maintain a narrow focus and divide the
possibilities gradually through effective questioning. At this point the Five Why
chain would look like Figure 15-1.
Problem statement: The fabrication units per hour is below goal.
Why?
We are not able to make enough parts each hour
Why?
We are losing production opportunities
Why? Why?
Losing time Losing parts (scrap)
Figure 15-1. Initial Five-Why analysis
At this level the Five-Why chain has developed the first branch. Prior to ask-
ing “Why?” for both branches, it’s important to understand which is the most
significant. This understanding will maintain a narrower focus. For the sake of
this demonstration, we will assume that the data show that scrap is very low
and time is the greater loss, and proceed to show the continuation of the causal
chain from this level. It is imperative to actually confirm the overall impact of
each item, rather than to assume. The scrap quantity data may be available and
fairly easy to quantify; however, the time losses will require a visit to the work-
place (genchi genbutsu) to verify the amount of time loss.
When asking “Why?” do not jump down the chain to the deeper issues.
Carefully consider the loss of time in a production process and try to keep the
focus narrow by answering the direct question. Look for the broad categories
under which the detailed answers will fall. Remember to use the “Therefore”
method if you find yourself answering further down the chain. If the answer
“Setup time is too long” arises, state “Therefore” and find the answer. In this sit-
uation it would be: “Therefore the machine is not running for a long time.” The
following step would be: “Therefore we are losing time.” If the “Therefore”
method was used on some of the other issues, it’s likely that “The machine is
not running” (or “The line is not running”) would be a consistent theme. This
is the common category we are looking for. In addition, our questioning may
lead us to understand that loss of time due to excessive process cycle time is
also a primary category. Now the Five-Why chain will appear as shown in
Figure 15-2.
Again the causal chain is branching. At this time a visit to the workplace is
absolutely necessary. In order to improve your observation ability you must
learn to “look with intention.” Based on the analysis thus far, what is the inten-
tion of your observation? The intention is to look to see whether there are cycle
time losses or situations during which the process is not operating.
The general thinking within Toyota is to consider the cycle losses first. Cycle
time losses are those losses that occur every cycle as the operation is performed;
THE TOYOTA WAY FIELDBOOK344
Problem statement: The fabrication units per hour is below goal.
Why?
We are not able to make enough parts each hour
Why?
We are losing production opportunities
Why? Why?
Losing time Losing parts (scrap)
(Not most significant)
Why? Why?
Cycle time losses Process not running
Figure 15-2. Second pass Five-Why analysis
therefore, they have a “high tendency” of occurrence. The cumulative effect of
these small losses can be very great. In addition, the reduction will generate an
immediate and continuous payback. A small payback that can be captured
immediately and will continue to pay forever is a preferred result. Small cycle
time losses are also generally easy to correct. They may include excessive oper-
ator or machine motion, delays due to waiting, or overprocessing (doing more
than necessary). Of course, these are all forms of muda (waste), and the removal
of muda is a primary objective.
Visiting the workplace, you will probably see many other examples of cycle
losses and process stoppages. You’ll need to gather facts to understand the total
impact of each issue—the importance, urgency, and tendency—and a simple way
to do this is to use a value-added/non-value-added
1
breakdown list as shown in
Figure 15-3. The example is from a sawing operation, but the list generated is fair-
ly typical in most manufacturing operations. Remember, the links of the causal
chain were related to losses of time, either through cycle losses or due to losses of
time when the operation is not running or not adding value. The list that is gener-
ated will include both cycle and run-time losses. Since the ultimate objective is to
find causes that are linked through the causal chain to the original problem, we’re
looking only for those activities that take time away from the value-adding task.
In other words, if the operator is performing a non-value-adding task but the
machine is adding value while the operator does the task, improving this item will
not lead to reducing the problem, and thus is not a beneficial improvement. The
first priority is to address the issues that directly reduce the time available to add
value and therefore cause a loss of production.
Chapter 15. Complete a Thorough Root Cause Analysis 345
Load saw
Unload saw
Change blade
Clean up
Break down
Inspect parts
Move finished parts
Meetings
Waiting for wood
Handling wood
Blade is cutting wood
Value-Added Task Non-Value-Added Task
ALL ACTIVITY
OTHER THAN
CUTTING WOOD IS
NON-VALUE-
ADDED ACTIVITY
Figure 15-3. Value-added/Non-value-added analysis
For further information on the case see: Bill Costantino, "Cedar Works: Making the Transition to
Lean," in J.K. Liker (ed.), Becoming Lean, Productivity Press, 1997.
THE TOYOTA WAY FIELDBOOK346
Problem statement: The fabrication units per hour is below goal.
Why?
We are not able to make enough parts each hour
Why?
We are losing production opportunities
Why? Why?
Losing time Losing parts (scrap)
(Not most significant)
Why? Why?
Cycle time losses Process not running
Why?
Loading the machine takes too long
Why?
Operator walks 5 feet for material
(Root Cause)
Figure 15-4. Final pass Five-Why analysis
LARGE PROBLEM
Many Possible Causes
Most Likely Causes
Point of Cause
Five-Why Process
Root Causes
Figure 15-5. The narrowing and focusing process
Seeking Problem Causes That Are Solvable
During any process of analysis there will be a tendency to jump to predeter-
mined causes. Predetermined conclusions are often based on issues that are not
Continuing with the causal analysis (Five-Why) process in this example
revealed the chain in Figure 15-4. Follow the bold text chain to the root cause in
the outlined box.
Toyota uses this process of continually narrowing, isolating (using the 80/20
rule), and focusing efforts on the items that will provide the greatest benefit.
Continuing to dig until the root causes are discovered also provides causes that
are both easier to improve and, when improved, will solve the original problem.
We can think of it as a funnel as shown in Figure 15-5.
within the ability or responsibility of the person developing them. A critical
thought process of the Toyota Way is the assumption of finding causes that are
in the direct control of the problem solver. In any problem analysis it is always
possible to find causes that originate outside the control of the problem solver.
For instance, it’s common to find fault with a supplier of material, or with a sup-
port group such as maintenance, or engineering (this is jokingly referred to as the
“Five Who’s” and the objective is to find “root blame” rather than root causes).
Also, there is a tendency to accept certain causes as “the way it is,” and therefore
preclude the possibility of change. The following example demonstrates this
phenomenon.
During the analysis of the sawing operation shown in Figure 15-3, it was
determined that clean-up time was resulting in loss of production. The saws
operated for three shifts, and each shift was assigned 30 minutes to clean up,
resulting in a loss of 90 minutes per day. Following the Five-Why chain in Figure
15-2 above it is apparent that the operation is experiencing problems meeting
the daily production requirement. There are lost time opportunities, and there-
fore the goal would be to capture the lost opportunities. The causal chain would
appear as shown in Figure 15-6.
The cleaning activity is the “point of cause.” Finding the point of cause will
provide both the time and place that the problem occurs. At this stage the root
causes have not been determined, and the “Why?” questioning continues.
The leader asks: “Why do we clean up?” to find the root causes.
Likely responses will be:
“It helps safety.”
“It makes the work area look better.”
Chapter 15. Complete a Thorough Root Cause Analysis 347
Problem statement: The fabrication units per hour is below goal.
Why?
We are not able to make enough parts each hour
Why?
We are losing production opportunities
Why? Why?
Losing time Losing parts (scrap)
(Not most significant)
Why? Why?
Cycle time losses Process not running
Why?
Clean-up
Why?
Leads to root causes
(Point of Cause)
Figure 15-6. Identifying point of cause