Báo cáo y học: "Altered expression of circadian clock gene, mPer1, in mouse brain and kidney under morphine dependence and withdrawa" docx
Bạn đang xem bản rút gọn của tài liệu. Xem và tải ngay bản đầy đủ của tài liệu tại đây (723.21 KB, 10 trang )
BioMed Central
Page 1 of 10
(page number not for citation purposes)
Journal of Circadian Rhythms
Open Access
Research
Gemvid, an open source, modular, automated activity recording
system for rats using digital video
Jean-Etienne Poirrier*
†1,2
, Laurent Poirrier
†3
, Pierre Leprince
2
and
Pierre Maquet
1
Address:
1
Cyclotron Research Center, University of Liege, Allee du 6 Aout, 8 (B30), 4000 Liege, Belgium,
2
Centre for Cellular and Molecular
Neurobiology, University of Liege, Avenue de l'Hôpital, 1 (B36), 4000 Liege, Belgium and
3
Applied Sciences Faculty, University of Liege, Chemin
des Chevreuils, 1 (B52), 4000 Liege, Belgium
Email: Jean-Etienne Poirrier* - ; Laurent Poirrier - ; Pierre Leprince - ;
Pierre Maquet -
* Corresponding author †Equal contributors
Abstract
Background: Measurement of locomotor activity is a valuable tool for analysing factors influencing
behaviour and for investigating brain function. Several methods have been described in the
literature for measuring the amount of animal movement but most are flawed or expensive. Here,
we describe an open source, modular, low-cost, user-friendly, highly sensitive, non-invasive system
that records all the movements of a rat in its cage.
Methods: Our activity monitoring system quantifies overall free movements of rodents without
any markers, using a commercially available CCTV and a newly designed motion detection software
developed on a GNU/Linux-operating computer. The operating principle is that the amount of
overall movement of an object can be expressed by the difference in total area occupied by the
object in two consecutive picture frames. The application is based on software modules that allow
the system to be used in a high-throughput workflow. Documentation, example files, source code
and binary files can be freely downloaded from the project website at />gemvid/.
Results: In a series of experiments with objects of pre-defined oscillation frequencies and
movements, we documented the sensitivity, reproducibility and stability of our system. We also
compared data obtained with our system and data obtained with an Actiwatch device. Finally, to
validate the system, results obtained from the automated observation of 6 rats during 7 days in a
regular light cycle are presented and are accompanied by a stability test. The validity of this system
is further demonstrated through the observation of 2 rats in constant dark conditions that
displayed the expected free running of their circadian rhythm.
Conclusion: The present study describes a system that relies on video frame differences to
automatically quantify overall free movements of a rodent without any markers. It allows the
monitoring of rats in their own environment for an extended period of time. By using a low-cost,
open source hardware/software solution, laboratories can greatly simplify their data acquisition and
analysis pipelines and improve their workload.
Published: 25 August 2006
Journal of Circadian Rhythms 2006, 4:10 doi:10.1186/1740-3391-4-10
Received: 14 July 2006
Accepted: 25 August 2006
This article is available from: />© 2006 Poirrier et al; licensee BioMed Central Ltd.
This is an Open Access article distributed under the terms of the Creative Commons Attribution License ( />),
which permits unrestricted use, distribution, and reproduction in any medium, provided the original work is properly cited.
Journal of Circadian Rhythms 2006, 4:10 />Page 2 of 10
(page number not for citation purposes)
Background
Measurement of locomotor activity is a valuable tool for
analysing factors influencing behaviour and for investigat-
ing brain function. As a result, assessment of locomotor
activity has been used in many fields such as neurotoxicol-
ogy, psychopharmacology, biological rhythm research,
etc.
In the past, the most widely used automated devices for
measuring locomotor activity have been stabilimeters [1],
microwaves [2], photocell-based systems [3] and running
wheels [4]. The latter technology has gradually come to
dominate the area, probably because of its reasonable cost
and adaptability to varying environmental configurations.
But these methods in general either present flaws or are of
very high cost. For example, counting interruptions of
infrared light beams in a cage using photocell sensor units
mainly reflects locomotion instead of overall movements
and has poor temporal resolution. The reconstruction of
multi-dimensional movements from markers tracked by
motion analysis systems is not suitable for measuring
overall movements (because markers are placed on the
entire body and these markers prevent free animal behav-
iour) and is costly. Running-wheel systems fail to record
activity when the animal is not on the wheel and may
induce changes in circadian period [5,6]. Finally, a simple,
visual observation of behaviour and manual counting of
movements is subjective and prone to inter-examiner dif-
ferences.
Newer technologies have become available that provide
the opportunity to detect motor activity, primarily loco-
motion, in a different and potentially more accurate way.
Some of these are contrast-sensitive or frame-difference
video tracking systems [7-9]. In addition to the use of the
frame-difference technique, the system we present here
takes advantage of two other technological evolutions:
increasing computer power, allowing the use of inexpen-
sive technologies that were previously costly (e.g. IR-cam-
era that can record even in the dark) and open source
software, widely and openly available to anyone for use
and modification.
We designed our system based on four ideal, basic
requirements [10]:
• Data collection should not influence the rhythmic phys-
iological variables.
• Acquired data should permit flexible and powerful anal-
ysis.
• Data should be collected regularly during each oscilla-
tory period (increasing frequency spectrum) and for many
successive cycles (increasing frequency resolution).
• Data collection should be automated.
Methods
Our system consists of a closed-circuit television (CCTV)
camera that non-invasively records all movements of a rat
in its own cage. It then uses custom-designed motion
detection software running on a GNU/Linux-based per-
sonal computer. The operating principle is that the
amount of overall two-dimensional movement of an ani-
mal can be expressed by the difference in total area occu-
pied by the object in two consecutive picture frames (two-
dimensional object-difference method [7]), during light
and dark periods.
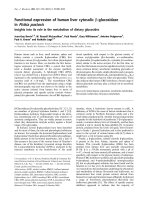
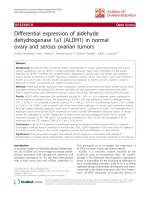
The video image analysing system consists of 3 compo-
nents (Figure 1): a visible/infrared CCTV camera, a com-
puter equipped with a common TV tuner and modular
software pieces.
For the first component, we used a small, low-cost CCTV
camera (LYD-806C CCD, Lianyida, China), capable of
working at 0 lux and mounted on a standard tripod. This
construction allowed the adjustment of the height of the
camera and the adjustment of the angle and distance
between the camera and the animal cage. The camera was
set in such a way that the longest side of the rat cage was
perpendicular to the camera view. In this configuration,
we could measure more animal movements. In the light
phase, light was provided by three 133 cm, 36 W neon
tubes placed on the ceiling. They produced a perceived
intensity of 260lux in the cage (LX-6610 luxmeter, Elix).
During the dark phase, 30 infrared LEDs inside the camera
were automatically switched on.
Conventional equipment was used for the last hardware
component: an Intel Pentium II personal computer run-
ning RedHat Linux v.7. This computer uses a video card
with a TV tuner/frame grabber (Rage 128 Pro, ATI, USA).
Images from the camera were transmitted to the computer
and digitised by the frame-grabber. Our system digitises
25 frames per second (25 Hz). Frame resolution is 360 by
240 pixels (86400 pixels in total). Pixel size is 0.133 cm at
1 m.
Any other camera/frame grabber system can be used, pro-
vided it is recognized by the Video4Linux library http://
linuxtv.org/v4lwiki/. This allows the use of commercial
webcams, regular (IR-unable) camera and CCTV.
The computer programs were designed with modularity in
mind. Each module can be used separately. Moreover,
results from each module are openly described and can be
used by any other custom process, software or analyser. A
clear advantage is that, by launching the same module in
Journal of Circadian Rhythms 2006, 4:10 />Page 3 of 10
(page number not for citation purposes)
different processes, our system can easily be extended to
simultaneously monitor several animals. Software are
written in C and licensed under the GNU General Public
Licence. Documentation, example files, source code and
binary files can be freely downloaded from the project
website at />.
Our first software module acquires frames and compares
each frame with the previous one. The number of pixels
that change between two frames is associated with the
time during which the frame was taken (when activity
occurred: in hour, minute, second and millisecond). Our
system processes 25 frame comparisons per second (25
Hz, as fast as frames arrive).
The software first shows the observation field in real time
and overlays a layer that highlights the changed pixels in
green. Thus, a first use of this software allows visualization
of behavioural changes that occur in real time.
A signal can be sent to the operator or back to the rat envi-
ronment if the amount of movement is below a user-
defined threshold (number of pixels) for a user-defined
duration. This signal can be, for instance, visual (on a
computer screen) and/or auditory (through computer
loudspeakers).
Numerical results from the first module are sent to the
standard output: every 25th fraction of a second, a string
containing the time and the number of pixels changed,
compared to the previous frame, is sent to the command
line. The number of modified pixels is an indirect measure
of rat overall activity. This output allows the quantifica-
tion of changes that occur in real time.
Via a pipe or a redirection, data output from the first mod-
ule can be stored in a text file. The data output can be eas-
ily modified to store values in other formats. The length of
a continuous data acquisition period is limited only by
the memory size of the computer hard disk (a day of
The three components of the video image analysis systemFigure 1
The three components of the video image analysis system. A: schematic representation; B and C: picture of the setup
in our laboratory.
Journal of Circadian Rhythms 2006, 4:10 />Page 4 of 10
(page number not for citation purposes)
acquisition is contained in a 80 Mb text file; 6 Mb when
compressed with gzip).
Data can later be processed by a second software module.
The current module draws actograms, indicating the rela-
tive intensity of the overall movement of the rat (y-axis) at
a given time (x-axis). Other analyses can be performed by
any mathematical or statistical software package.
Two other parameters can be set: a minimum and/or max-
imum count value. The minimum count value sets the
minimum number of changed pixels that are scored as
movement. In this experiment, we set the lower limit filter
value at 100 pixels, corresponding approximately to a
square of 2 cm
2
in our experimental setup.
In experiment 1, we investigated the sensitivity and repro-
ducibility of our device and software to detect the exact
frequency of movement of a small object with regular
movement. We placed a metronome (Taktell Piccolino,
Wittner, Germany) at a distance of 1 meter from the cam-
era and we recorded several series of oscillations at differ-
ent frequencies (40, 52, 100, 152 and 200 oscillations per
minute). Each recording lasted 60 seconds. We applied a
short-time Fourier transform (in Matlab R2006a, Math-
works, USA) to recorded signals in order to extract
observed frequencies. We also performed a Pearson's
product-moment correlation test between theoretical and
observed frequencies (R 2.3.1, R Foundation for Statistical
Computing, Austria [11]).
In experiment 2, we left the metronome (at 52 oscillations
per minute) in front of the system during 10 hours. Since
the metronome signal is stable in time, we tested the
detection stability of our system. We also applied a short-
time Fourier transform to compare spectrograms obtained
at the beginning and at the end of the test. This procedure
allowed us to detect any potential drift of signal detection
in time, leading to false increase or decrease in movement.
In experiment 3, we were interested in the sensitivity of
our system and in the comparison of our data with
another well-established activity-monitoring device. On a
custom-designed mobile going at two different speeds
(23.81 cm · s
-1
and 45.45 cm · s
-1
), we placed an Acti-
watch Plus (Cambridge Neurotechnology Ltd, United
Kingdom) and a white square paper of variable surface.
This paper was placed perpendicularly in front of the cam-
era. We recorded a series of movements of the mobile at
different speeds and with different surface areas (80, 128,
160, 192, 224 and 256 cm
2
). This area range was chosen
because it encompassed the area occupied by the projec-
tion of a rat seen laterally on a vertical surface (approxi-
mately 150 cm
2
). We reported data obtained from our
system and from the Actiwatch on the same chart. A Pear-
son's product-moment correlation test was also applied to
recorded signals with different moving areas.
Experiments 4 to 6 were performed on 8 male Sprague-
Dawley rats weighing 200–250 g at the time of observa-
tion. Upon their arrival, the rats were housed in group
cages and had food and water ad libitum. Seven days prior
to observation, rats were individually housed in smaller
cages (18 cm high × 29 cm wide × 20 cm deep), food and
water still ad libitum. The room was maintained at a tem-
perature of 22–24°C and a relative humidity of 30–40%.
All procedures were approved by the Ethics Committee of
the University of Liège.
In order to maintain a certain level of animal welfare dur-
ing data acquisition, we left the rat in its own cage, at the
same place in the cage rack, with a little bit of nesting
material. Nothing was placed inside the rat environment.
A dark blue poster was left hanging on the wall behind the
rat cage. This provided a sufficient contrast with white rats
when viewed in visible light.
On the day before the first day of observation, the camera
was placed approximately at 2 m from the back wall of the
cage. The observation frame contained the whole cage.
Apart from the animal, all other objects remained inert in
the observation field.
In experiment 4, we investigated the sensitivity of our
device with real animals and the types of movement that
it effectively detected. Data acquisition was started simul-
taneously with the time-stamped video-cassette recording
of the rat (AG-VP320, Panasonic, Japan). Later on, the
video-cassette was played back and we compared the
amount of pixels that had changed with the observed
behaviour.
In experiment 5 (6 rats), a 12 h light-dark cycle was
imposed with the lights automatically turned on at 06:00
h and off at 18:00 h (LD 12:12). The rats were left undis-
turbed for the next 7 days with food and water ad libitum,
except on day 3, when litter was changed and food and
water were provided when necessary. Data were automat-
ically and continuously collected for the whole experi-
mental period, except when we changed the litter.
Subsequently, data analysis was performed off-line. Our
data analysis included the data presentation with the sec-
ond software module (creation of actogram) and a test of
stability over time. This test was also performed in order
to verify that there was no drift in the detection system.
For that purpose, we calculated the mean number of pix-
els that changed each hour. The means between the days
and conditions (light or dark) were compared using an
ANOVA in R.
Journal of Circadian Rhythms 2006, 4:10 />Page 5 of 10
(page number not for citation purposes)
Experiment 6 (2 rats) was carried out with two rats in the
same conditions as in experiment 5 except that the rats
were kept in constant darkness (DD, 0 lux) since the first
day of observation. Data presentation was performed with
the second software module.
Results
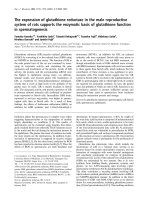
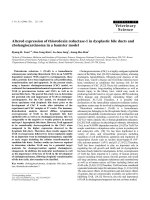
In the first experiment, the system was able to collect
enough samples to find the right oscillation frequencies of
the metronome. Figure 2 (A, B, C) shows the result of the
spectral analysis for one frequency (200 oscillations per
minute, or 3.333 Hz). In Figure 2 (D), we plot the
observed frequencies versus theoretical frequencies (set
up on the metronome from 0.66 to 3.3 Hz). Pearson's cor-
relation coefficient is 0.9992245 (p < 10
-16
), indicating
that the observed frequencies are not statistically different
from the theoretical ones.
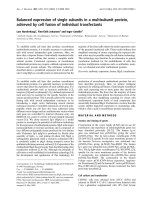
In Figure 3, we show two spectrograms derived from
observed oscillations of the metronome (at 52 oscilla-
tions per minute, or 8.86667 Hz) at the beginning and
end of a 10-hour continuous experiment. The comparison
of the two spectrograms shows that there is no drift of
detected signal after 10 hours: the main frequency coeffi-
cient of variation during the first quartile is 0.32701% and
this coefficient of variation during the last quartile is
0.57637%.
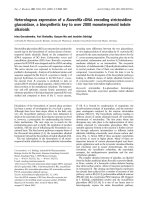
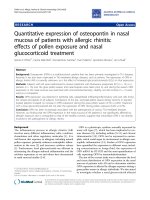
The comparison of data collected with our system and
data from the Actiwatch show that they are quite similar.
However, our system detected activity before the Acti-
watch (example of two movements of our mobile in Fig-
ure 4A). Three factors made this comparison difficult.
First, the Actiwatch resolution is low as its shortest period
is 2 s while our system's shortest period is 0.04 s. Second,
observed movements in this type of setup are in the lower
range of sensitivity for the Actiwatch. Finally, the Acti-
watch can only detect variation in speed of movement
("activity") while our system also detects variations in the
amount of movement (number of changed pixels, see
next paragraph). In the same third experiment, we com-
pared the number of pixels that changed using different
moving areas. In Figure 4B, we plot the mean number of
pixels changed versus different areas. Pearson's correla-
tion coefficient is 0.9511966 (p < 10
-7
), indicating that
the size of a body that moves (at the same speed) is related
to the number of pixels that change.
In the fourth experiment, the amount of pixels that
changed during the data acquisition was compared with
the rat behaviour. We observed that the system was very
sensitive, even to very small movements of the head or the
tail (Figure 5A, left). When rats were sleeping, no move-
ment was detected (Figure 5A, right).
The recordings of 7 days of activity of 6 different rats in the
second experiment were similar to those presented in Fig-
ure 5B, top. Actograms are plots of the number of pixels
changed (y-axis) versus time during the day (x-axis). Fig-
ure 5B, bottom left, shows an interesting activity pattern:
for unknown reasons, rat 3 recurrently increased its activ-
ity around noon (other rats did not show the same activity
pattern; nothing in the environment could explain this
specific behaviour).
In Figure 5C, we plot the mean number of changed pixels
each day for one rat. The ANOVA test indicates that there
is a significant difference between the two conditions, as
expected (p < 0.001) but that there is no significant day
effect nor difference in the interaction between day and
condition (p < 0.05). All this indicates that there is no drift
in the detection system over time.
Finally, Figure 6 compares the activity of the same rat
between a regular day in LD conditions and the fifth day
in DD conditions. In LD conditions, the rat drastically
reduced its activity at 6:24 (24 minutes after lights were
switched on) but became very active just after the light
were switched off (at 18:00). Four days after being put in
DD conditions, it drastically reduced its activity at 10:02
(4 hours after the initial drop in activity) but became very
active only at 19:44 (nearly two hours after lights were
switched off in the previous configuration).
Conclusion
The present study describes a system that relies on frame
difference video technology. The main operating principle
is that the amount of overall movement of an object can
be expressed by the total area of the object which changes
from frame to frame. We demonstrate that the system we
designed is sensitive enough and stable in its acquisition
process.
To test the validity of this system, we first tested it with a
metronome, giving a regular and stable movement. We
show that the system is sensitive enough to detect the
small movements of the metronome at 1 m of distance
and that the observed data contains the oscillation fre-
quency. We demonstrate that there is no drift in the detec-
tion process since observed data contain the same
oscillation frequencies for at least 10 hours. Moreover, we
show that, while recording a real animal, the mean
number of pixels that changed each day was also not sig-
nificantly different.
We have compared our system with an Actiwatch device
and, despite some limiting factors inherent to the Acti-
watch, both systems recorded activity at approximately
the same time. Moreover, we also showed that, with our
system, there was a strong correlation between the mean
Journal of Circadian Rhythms 2006, 4:10 />Page 6 of 10
(page number not for citation purposes)
number of pixels changed and the size of the areas moving
at the same speed.
To test this system with animals, rats were observed in LD
and DD conditions. The results of experiment 4 show that
there is usually more activity during the dark periods than
the light periods, as expected for a nocturnal animal. Our
system was also able to detect changes in the length of the
endogenous circadian period. Indeed, Rattus norvegicus
has a period of more than 24 h that becomes apparent in
free-running conditions (constant darkness here).
We overcame the limitation of video recording during
darkness by using a camera that, by automatically switch-
ing to infrared in complete darkness, allowed us to contin-
uously monitor activity during the light and dark phases.
There are, however, three disadvantageous features of this
technique:
• The recording of movements parallel to the camera
viewpoint axis (vertical movements when the camera is
above the cage) cannot be recorded by a single camera.
Certain movements within the region of the object cannot
be detected, such as movements in the direction of the
camera (it is for this reason that we placed the longest side
of the cage in front of the camera).
• Part of the bedding that are actively displaced by the
rodent during foraging sometimes lead to miscalculation
of the overall movement. This issue might be solved by
including a segmentation step before the frame substrac-
tion.
• Finally, one should note that our system can record
activity from only one animal at a time. This limitation
can be overcome by including a segmentation step or, for
a small number of animals, by launching as many proc-
esses as different animals/cameras in the experiment.
Observation and spectral analysis of a metronome at 200 oscillations per minuteFigure 2
Observation and spectral analysis of a metronome at 200 oscillations per minute. A: observations from the first
software module. B: mean power of observed frequencies; 3.35 Hz is the frequency that has the maximum mean power (200
opm = 3.333 Hz). C: spectrogram of observed frequencies over time (intensity scale on the right) (opm = oscillations per
minute). D: correlation plot between theoretical and observed frequencies of a metronome (n = 24)
Journal of Circadian Rhythms 2006, 4:10 />Page 7 of 10
(page number not for citation purposes)
Spectral analysis of two periods of data acquisition with a metronome set up at 52 oscillations per minutes = 0.8667 Hz, in a continuous experimentFigure 3
Spectral analysis of two periods of data acquisition with a metronome set up at 52 oscillations per minutes =
0.8667 Hz, in a continuous experiment. Left: spectrogram from data acquired at 9:00 hr. Right: spectrogram from data
acquired at 18:50 hr.
Comparison of data from Gemvid and from ActiwatchFigure 4
Comparison of data from Gemvid and from Actiwatch. A: observed data from each device is presented in blue for
Gemvid and red for Actiwatch. Mobile is going at 23.8 cm · s
-1
and the mobile surface is 128 cm · s
-1
. B: correlation plot
between the size of the moving surface and the mean number of pixels that changed for each value of area (n = 3 for each value
of area).
Journal of Circadian Rhythms 2006, 4:10 />Page 8 of 10
(page number not for citation purposes)
Data from software module 1Figure 5
Data from software module 1. A: screenshot showing the actual view of software module 1. Green pixels highlight zones
that changed since the last frame. Movements highlighted here were only observed around the head and the tail. Left: the rat is
active; right: the rat is sleeping. B: Examples of actograms. Top: one day actogram for rat #1 (LD 12:12 with lights on at 6:00).
Below: seven days actogram for rat #3 (left) and #6 (right). C: mean number of pixels changed each day for one rat (left: in
dark conditions ; right: in light conditions).
Journal of Circadian Rhythms 2006, 4:10 />Page 9 of 10
(page number not for citation purposes)
In summary, this method has many interesting advan-
tages:
• all instruments are commercially available at compara-
tively low cost (a Pentium II computer can be found for
less that US$ 90.00 and our CCTV costs US$ 70.00);
• the analysis procedure is performed automatically, and
no skill is necessary;
• placed outside the animal environment, the data collec-
tion system does not influence the rhythmic physiological
variables;
• the overall movements of animals can be estimated with
high sensitivity;
• our system can easily be extended to the simultaneous
monitoring of several animals;
• acquired data allows flexible and powerful analysis as
well as a full integration in a bigger data collection frame-
work (use of open formats).
These advantageous features make the Gemvid system a
powerful device for overall movement assessment in
rodents.
Competing interests
The author(s) declare that they have no competing inter-
ests.
Authors' contributions
LP wrote the first module software and built the mobile
device for the third experiment. JEP wrote the second
module software, carried out the experiments, data analy-
sis and prepared the successive versions of the manu-
scripts. PL and PM supervised the experiments. The study
was conceived and planned by JEP. All authors approved
the final version of the manuscript
Acknowledgements
This project was supported by the Fonds pour la formation a la Recherche
dans l'Industrie et dans l'Agriculture, a Fonds Leon Fredericq Grant and an
Andre Kahn Sleep Award.
References
1. Parreno A, Saraza ML, Subero C: A new stabilimeter for small
laboratory animals. Physiol Behav 1985, 34:475-178.
2. Pasquali V, Scannapieco E, Renzi P: Validation of a microwave
radar system for the monitoring of locomotor activity
rhythms in mice. J Circadian Rhythms 2006, 4:7.
3. Kafkafi N, Mayo C, Drai D, Golani I, Elmer G: Natural segmenta-
tion of the locomotor behavior of drug-induced rats in a pho-
tobeam cage. J Neurosci Methods 2001, 109:111-121.
4. Jud C, Schmutz I, Hampp G, Oster H, Albrecht U: A guideline for
analyzing circadian wheel-running behavior in rodents under
different lighting conditions. Biol Proced Online 2005, 7:101-116.
5. Hashimoto T, Izawa Y, Yokoyama H, Kato T, Moriizumi T: A new
video/computer method to measure the amount of overall
Activity of a rat in L:D and D:D conditionsFigure 6
Activity of a rat in L:D and D:D conditions. Top: 3rd day in LD conditions ; bottom: 5th day under free-running, DD con-
ditions ; a * denotes change in activity.
Publish with BioMed Central and every
scientist can read your work free of charge
"BioMed Central will be the most significant development for
disseminating the results of biomedical research in our lifetime."
Sir Paul Nurse, Cancer Research UK
Your research papers will be:
available free of charge to the entire biomedical community
peer reviewed and published immediately upon acceptance
cited in PubMed and archived on PubMed Central
yours — you keep the copyright
Submit your manuscript here:
/>BioMedcentral
Journal of Circadian Rhythms 2006, 4:10 />Page 10 of 10
(page number not for citation purposes)
movement in experimental animals (two-dimensional
object-difference method). J Neurosci Methods 1999, 91:115-122.
6. Yamada N, Shimoda K, Ohi K, Takahashi S, Takahashi K: Free-
access to a running wheel shortens the period of free-run-
ning rhythm in blinded rats. Physiol Behav 1988, 42:87-91.
7. Koteja P, Swallow JG, Carter PA, Garland T: Different effects of
intensity and duration of locomotor activity on circadian
period. J Biol Rhythms 2003, 18:491-501.
8. Vorhees CV, Acuff-Smith KD, Minck DR, Butcher RE: A method for
measuring locomotor behavior in rodents: contrast-sensi-
tive computer-controlled video tracking activity assessment
in rats. Neurotoxicol Teratol 1992, 14:43-49.
9. Togasaki DM, Hsu A, Samant M, Farzan B, DeLanney LE, Langston JW,
Di Monte DA, Quik M: The Webcam system: a simple, auto-
mated, computer-based video system for quantitative meas-
urement of movement in nonhuman primates. J Neurosci
Methods 2005, 145:159-166.
10. Moraes MF, Ferrarezi C, Mont'Alverne FJ, Garcia-Cairasco N: Low-
cost automatic activity data recording system. Braz J Med Biol
Res 1997, 30:1009-1016.
11. R Development Core Team: R: A Language and Environment
for Statistical Computing. Vienna Austria R Foundation for Statistical
Computing 2006.